 Wenjun Lu
 Libo Qian
 Wenzhong Zhou
- 1Sino-French Institute of Nuclear Engineering and Technology, Sun Yat-Sen University, Zhuhai, China
- 2Nuclear Power Institute of China, Chengdu, China
- 3Department of Mechanical Engineering, City University of Hong Kong, Hong Kong, China
Under loss-of-coolant conditions, the temperature on fuel cladding will increase rapidly (up to 1000–1500 K), which will not only cause a dramatic oxidation reaction of Zircaloy-4 and an increase in hydrogen concentration but also cause an allotropic phase transformation of Zircaloy-4 from hexagonal (α-pahse) to cubic (β-phase) crystal structure. As we all know, thermophysical properties have a close relationship with the microstructure of the material. Moreover, because of an important influence of the phase transformation on the creep resistance and the ductility of the fuel rod, studying the crystallographic phase transformation kinetics is pivotal for evaluating properties for fuel rod completeness. We coupled the phase transformation model together with the existing physical models for reactor fuel, gap, cladding, and coolant, based on the finite element analysis and simulation software COMSOL Multiphysics. The critical parameter for this transformation is the evolution of the volume fraction of the favored phase described by a function of time and temperature. Hence, we choose two different volume fractions (0 and 10%) of BeO for UO2-BeO enhanced thermal conductivity nuclear fuel and zircaloy cladding as objects of this study. In order to simulate loss-of-coolant accident conditions, five relevant parameters are studied, including the gap size between fuel and cladding, the temperature at the extremities of the fuel element, the coefficient of heat transfer, the linear power rate, and the coolant temperature, to see their influence on the behavior of phase transformation under non-isothermal conditions. The results show that the addition of 10vol%BeO in the UO2 fuel decreased the phase transformation effect a lot, and no significant phase transformation was observed in Zircaloy-4 cladding with UO2-BeO enhanced thermal conductivity nuclear fuel during existing loss-of-coolant accident conditions.
Introduction
With the increasing energy demand, human beings have never stopped exploring new energy sources. Among them, nuclear energy is one of the most popular and promising future energy sources. Although nuclear energy is considered a clean and efficient energy source, it deals with a serious hazard - nuclear radiation. Many studies have shown that complex lesions can easily occur in cellular DNA (Sutherland et al., 2000; Sutherland et al., 2001; Yang et al., 2004), which means that nuclear radiation can cause massive damage to the human body, causing people to suffer from cancer and even death.
Nearly 70°years have passed, nuclear energy has been developed from the 1950s to the present. In these years, nuclear energy’s development process is not smooth sailing, which means that there have been accidents in nuclear energy development history. Some major nuclear power cases have attracted the whole world’s attention on nuclear safety, such as the Chernobyl nuclear leak accident in 1986, rated as INES 7 and considered the worst nuclear power accident in history. More recently, the Fukushima Daiichi Nuclear Power Plant accident in 2011, which is also rated as INES 7, brought widespread attention. These accidents caused substantial economic losses and caused many people to be exposed to varying degrees of radiation pollution, affecting health and even losing their lives. What is more, huge adverse effects have been caused on nuclear energy development worldwide. Thus, safety issues occupy a vital position in the development of nuclear energy.
With respect that an entire reactor of a nuclear power station is incredibly complex, there are many ways to ensure nuclear power plants’ safety. One of the critical aspects is how to avert the leakage of radioactive energy as much as possible in a loss-of-coolant accident (LOCA). In LOCA, the pivotal step to controlling nuclear leakage is to maintain the nuclear fuel rod’s integrity and the fuel cladding when they are inserted into cold water under the emergency cooling system. If the fuel cladding is not firm and tenacious enough, the nuclear fuel rod may crack easily, causing the radioactive material to break through the cladding and leak, resulting in severe consequences. Subsequently, accident tolerant fuel and cladding materials under LOCA conditions are studied by many researchers (Isobe and Suda, 1999; Forgeron et al., 2000a; Manngård et al., 2011; Manngård and Massih, 2011; Sawarn et al., 2014; Park et al., 2016; Suman et al., 2016; Gamble et al., 2017; Tang et al., 2017; Jailin et al., 2020), especially after the event at Fukushima Daiichi Nuclear Power Plant.
Accident Tolerant Fuel, or ATF for short, is a new generation of the fuel system to improve the fuel element’s ability to fight against severe accidents. Compared to the previous fuel system, this updated fuel system can resist grave accident conditions for a longer time and, in the meanwhile, maintain the same or have even better performance under normal operating conditions. The unique material characteristics of accident tolerant fuel can slow down the velocity of deterioration in severe cases, which would help people reclaim more valuable time to take emergency measures so that the radiation leakage risk of fuel is significantly reduced. To sum up, the critical point of accident tolerant fuel is the endurance capacity in a loss-of-coolant accident. For the moment, there are two effective methods to enhance this capacity, one is to find new material (such as SiC, FeCrAl) to replace the fuel cladding that we are using now, and the other is to enhance the properties of the existing fuel system (such as coating cladding, modifying fuel). For the former, the database of new cladding material on the physical properties and phenomena is scarce. There are still many properties and phenomena of existing cladding that are not well understood at present. Further research on the existing cladding material is beneficial to analyzing accident tolerant fuel and cladding as the object for comparison and validation (to keep its strong points and overcome the shortcomings). Our work has used UO2-BeO enhanced thermal conductivity nuclear fuel and zircaloy cladding as an accident tolerant fuel system, which means we have chosen the latter method to research the physical properties of cladding.
In today’s nuclear energy industry, zirconium alloys (especially Zircaloy-4) are still widely used as structural materials for reactors due to their superior properties. The small thermal neutron capture cross-section of zirconium allows it to ensure sufficient thermal neutrons to sustain the reactor’s normal operation. Also, zirconium alloy has the advantages of strong corrosion resistance (Isobe and Suda, 1999) and excellent mechanical properties, making the research of zirconium alloys internationally occupy an increasingly important position.
Under extreme conditions, such as in a loss-of-coolant accident, the fuel cladding will undergo a rapid temperature increase (up to 1000–1500 K) (Hales et al., 2016), which will not only cause a dramatic oxidation reaction of Zircaloy-4 and an increase in hydrogen concentration but also cause an allotropic phase transformation of Zircaloy-4 from hexagonal (α-pahse) to cubic (β-phase) crystal structure (Northwood and Lim, 1979). Thermophysical properties are closely related to the microstructure of the materials themselves. In other words, under LOCA conditions, the behavior of fuel rod cladding depends mainly on the metallurgical evolution at high temperatures. Researchers have also pointed out an important influence of the phase transformation on the creep resistance and ductility, two essential characteristics for fuel rod integrity (Forgeron et al., 2000a). Therefore, studying the crystallographic phase transformation kinetics is pivotal for evaluating the mechanical properties essential for fuel rod completeness (deformation and burst) to improve its performance during LOCA conditions.
The essential parameter for the transformation kinetics is the evolution of the new phase’s volume fraction as a function of time and temperature. This paper has selected the method for calculating the volume fraction of the advantageous phase in Zircaloy-4 as a function of time and temperature during phase transformation under non-isothermal conditions (Hales et al., 2016).
This study has implemented the physical model of phase transformation coupled with the existing physical models for reactor fuel, gap, cladding, and coolant, based on the finite element analysis and simulation software COMSOL Multiphysics. COMSOL Multiphysics originated from the Toolbox of MATLAB, is a finite element analysis and simulation software that is good at coupling multiple physical fields described by the PDEs. Besides, some physical models of the UO2-BeO-Zircaloy fuel-cladding system have already been implemented (Liu et al., 2015) into the COMSOL Multiphysics finite-element platform.
Implementation of Models
Model Geometry
The model used in this work adopted a 2D axisymmetric plane with UO2-BeO fuel rod and Zircaloy-4 cladding (see Figure 1A). For the reason of the periodic boundary condition in the axial direction, a single pellet is chosen to represent all the pellets with a mapped mesh (seeFigure 1B) (Liu et al., 2015).

FIGURE 1. (A) Geometry of 2D-axisymmetric, (B) pellet geometry with mapped mesh.
Phase Transformation
Transition Model
We choose a variable y as the volume fraction of the new transformed phase (β-phase) as a function of time t and temperature T. The value of y is in the range of 0–1. Following the research of Leblond and Devaux (Leblond and Devaux, 1984), we considered that the value of y and the steady-state or equilibrium value
where
To calculate volume fraction y as a function of time and temperature, we need to specify the two function
where
where
In addition to the steady-state volume fraction
From Eq. 5 , we can see that the rate parameter
Threshold Temperature Models
For the material-dependent temperatures for the beginning of phase transformation, the experimental data on Zircaloy-4 show that this quantity depends on the heating or cooling rate
where
A temperature (time) lag of the start temperature of phase transition from
All these material-dependent quantities above allow us to calculate the β-phase volume fraction as a function of time by numerical integration of Eq. (2). Using the above-mentioned phase transformation models, the Zircaloy-4 cladding phase formation and redistribution can be investigated.
Modeling Results
The behavior of fuel and cladding are presented for a 2D axisymmetric LWR fuel rodlet in COMSOL Multiphysics. The 2D axisymmetric model simulates a simplified fuel pellet with a typical finite element mesh shown in Figure 1B. The model contains an individual fuel pellet and Zircaloy-4 cladding. It is important to note a minimal but non-negligible gap between pellet and cladding considering the actual situation. A width of 80°μm is considered to be the nominal gap size in this model.
This section has used two different fuel systems, i.e., UO2-10% BeO and UO2, following the parameters setting in (Liu et al., 2015). The UO2-BeO fuel properties are shown in Supplementary Appendix S1. The typical RWR operating conditions used are shown in Table 1 above.
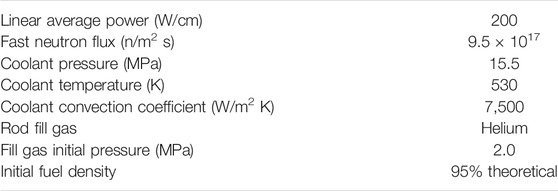
TABLE 1. Input parameters for the axisymmetric problem under typical PWR operating conditions (Liu et al., 2015).
After implementing the phase transformation model for Zircaloy-4 cladding, we first calculated the volume fraction of β-phase under the normal operating condition to test this model, and we obtain Figure 2 as a result for the UO2 fuel and Zircaloy-4 cladding.
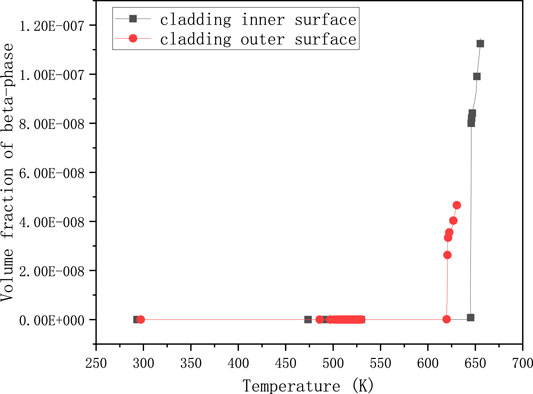
FIGURE 2. Volume fraction of β-phase changing with temperature for UO2 and Zircaloy-4 under normal operating conditions.
Figure 2 shows that the value of volume fraction of β-phase attains a very small magnitude. The green line with circles represents the volume fraction of β-phase of cladding outer-surface, while the blue line with asterisks represents the cladding inner-surface. Although the value of the inner surface of cladding is almost twice that of the outer surface, it is barely more than
During a LOCA condition, on account of the decrease in heat-transfer capacity under loss-of-coolant accident conditions, the heat or energy generated in the fuel cannot be passed outside, which causes the changes in the boundary conditions between fuel elements. Hence it has a high possibility that the temperature at the extremities of the fuel element will rise higher than before. The boundary conditions will change between fuel elements and change between fuel, cladding, and coolant because heat transfer capability decreases. For example, the heat transfer coefficient between cladding and coolant will decrease in the transition boiling interval. If we consider the swelling effect of fission gas, the fuel diameter will grow a little, which will make the size of the gap between fuel and cladding smaller. The linear power rate will also rise from 20000 W/m (set for normal condition) to 25,000 W/m, even 30,000 W/m when it is in serious condition. According to NRC (U.S. Nuclear Regulatory Commission) in (The U.S. Nuclear Regulatory Commission, 2011), a peak linear power density of around 60,000 W/m is considered the safe limit for core in operation. Hence, we can also try to raise the linear power rate to 60,000 W/m to observe its effect on phase transformation. The water saturation pressure at 530 K is between 3.3469 and 4.6923 MPa, according to Engineering Toolbox’s data in (Engineering ToolBox (2004). However, from Figure 2, we can see the value of coolant pressure is up to 15.5 MPa while the coolant temperature is only 530 K. Per the data for water saturation pressure, the corresponding temperature of 15.5 MPa is between 613 and 633 K. In the following simulation, we have taken 613 K as the coolant temperature into account during the calculations.
To simulate a relatively severe loss-of-coolant accident, we had reduced the physical size of the gap between fuel and cladding, raising the linear power generation rate, the coolant temperature, and the temperature at the extremities of the fuel element. For the sake of decreasing the heat transfer coefficient of cladding to coolant, we have multiplied the coefficient with a number less than one. All these conditions are taken into account simultaneously, and the results obtained are shown below.
To make the results more clear, they are divided into four groups. The first group is the volume fraction of β-phase varying with the linear power rate, with 1500 K - the temperature at the extremities of the fuel element, 8e−7 m - the gap size, and 0,6 - the coefficient multiplied with the heat transfer coefficient between cladding and coolant.
Figures 3A,C showed that the volume fraction on cladding inner-surface was increased almost by an order of magnitude from
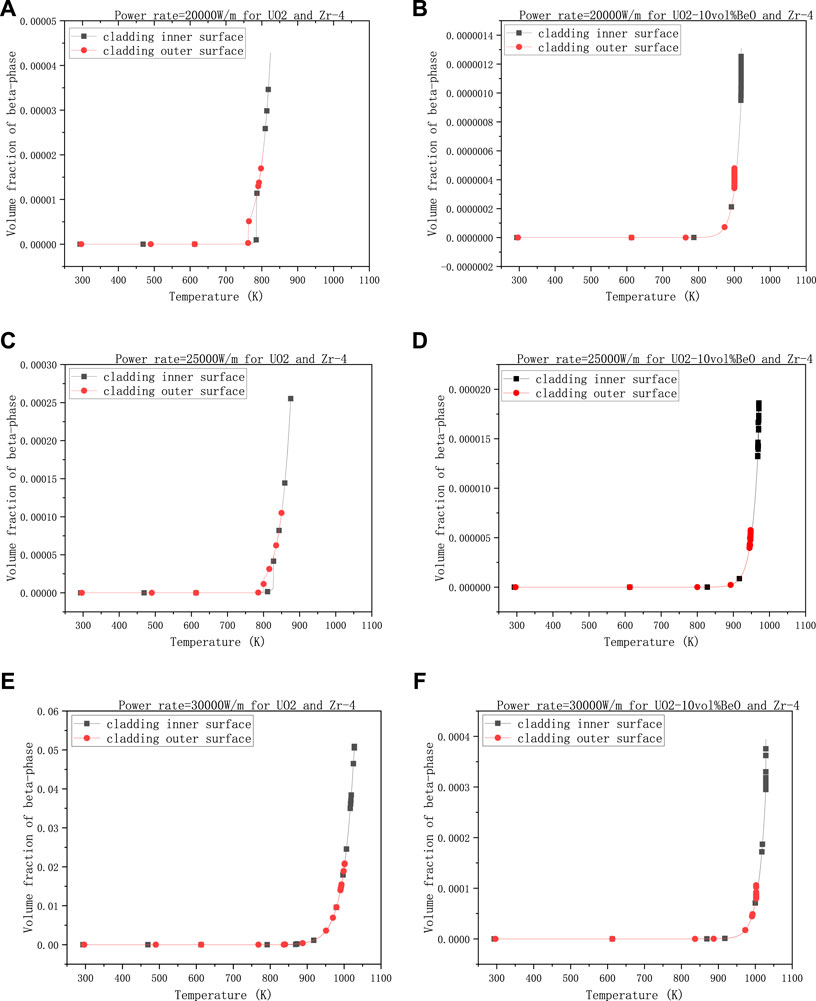
FIGURE 3. Volume fractions of β-phase on cladding inner surface and outer surface, changing with linear power rate, (A) 20,000 W/m for UO2 and Zircaloy-4, (B) 20,000 W/m for UO2-10vol%BeO and Zircaloy-4, (C) 25,000 W/m for UO2 and Zircaloy-4, (D) 25,000 W/m for UO2-10vol%BeO and Zircaloy-4, (E) 30,000 W/m for UO2 and Zircaloy-4, (F) 30,000 W/m for UO2-10vol%BeO and Zircaloy-4.
The second group is about the effect of the temperature at the extremities of fuel element on the volume fraction of β-phase, with 30,000 W/m - the linear power rate, 8e−7 m- the gap size, and 0,6-the coefficient multiplied with the heat transfer coefficient between cladding and coolant.
Figure 4 showed that there was not much difference in these results when the temperature at the extremities of the fuel element changed. From 700 K to 1100 K, the volume fractions on cladding inner-surface and outer-surface had all increased a little for both UO2 and UO2-10vol%BeO, where the increments are nearly
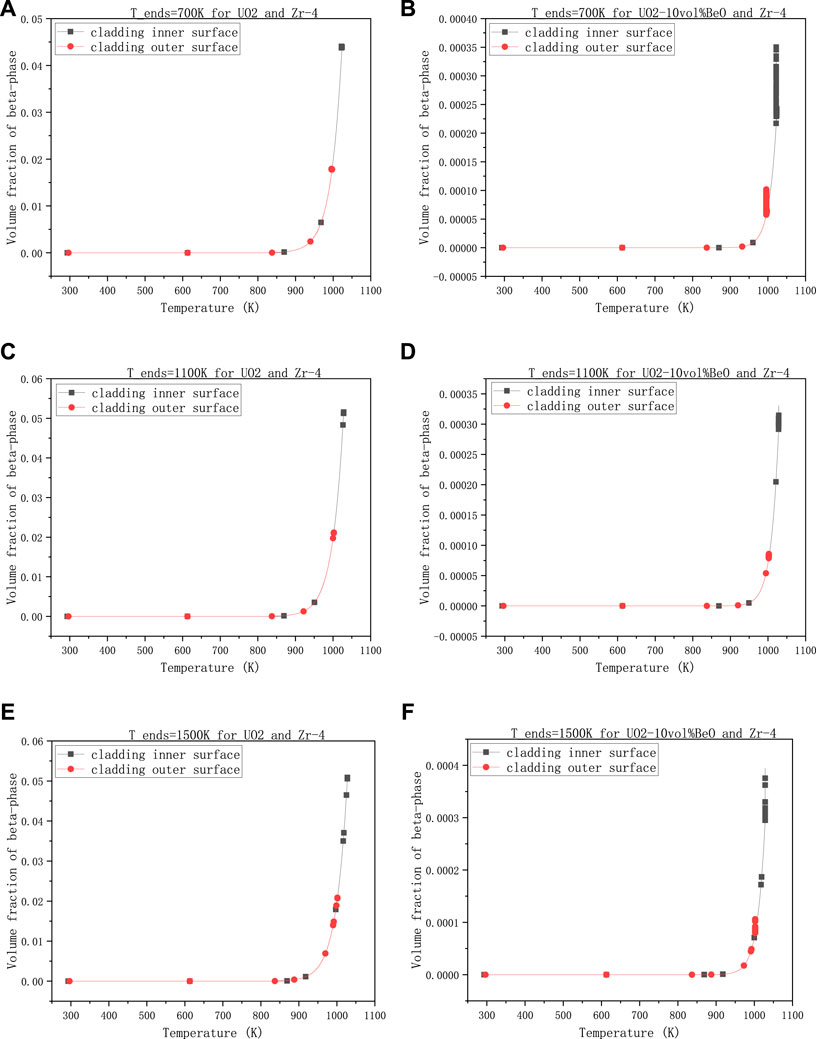
FIGURE 4. Volume fractions of β-phase on cladding inner-surface and outer-surface, changing with the temperature at the extremities of the fuel element, (A) 700 K for UO2 and Zircaloy-4, (B) 700 K for UO2-10vol%BeO and Zircaloy-4, (C) 1100 K for UO2 and Zircaloy-4, (D) 1100K for UO2-10vol%BeO and Zircaloy-4, (E) 1500 K for UO2 and Zircaloy-4, (F) 1500 K for UO2-10vol%BeO and Zircaloy-4.
The third group describes the variations of volume fraction of β-phase when the gap size changes. The other values are 0,6-the coefficient multiplied with the heat transfer coefficient between cladding and 30,000 W/m - the linear power rate, 1500 K-the temperature at the extremities of the fuel element.
In this group of calculations, we have selected three different magnitudes of gap size to observe the variations in the volume fraction of β-phase on cladding inner-surface and outer surface. We note that 8e−5 m in Figures 5A,B is the initial gap size. From Figures 5A,C, E, the gap size has increased tenfold and a 100 times, the volume fraction on cladding inner-surface has increased from 0.02 to 0.036 and from 0.02 to 0.052, respectively, while we nearly see no difference between Figures 5B,D. In Figures 5D,F, when the gap size had increased a hundred times, the volume fraction of β-phase on cladding inner-surface for UO2-10vol%BeO had increased a lot from
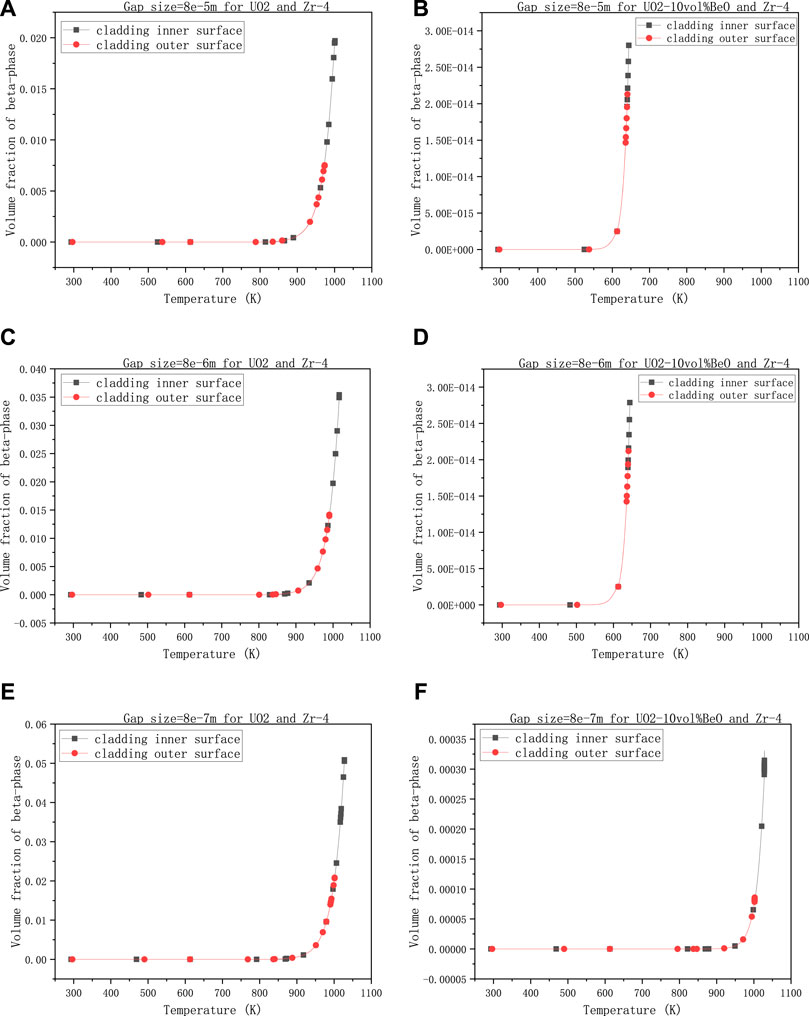
FIGURE 5. Volume fractions of β-phase on cladding inner-surface and outer-surface, changing with the gap size between the fuel and cladding, (A) 8e−5 m for UO2 and Zircaloy-4, (B) 8e−5 m for UO2-10vol%BeO and Zircaloy-4, (C) 8e−6 m for UO2 and Zircaloy-4, (D) 8e−6 m for UO2-10vol%BeO and Zircaloy-4, (E) 8e−7 m for UO2 and Zircaloy-4, (F) 8e−7 m for UO2-10vol%BeO and Zircaloy-4.
The last group is to observe the influence of the coefficient multiplied with the heat transfer coefficient between cladding and coolant on the volume fraction of β-phase, with 30,000 W/m - the linear power rate, 1500 K - the temperature at the extremities of the fuel element, and 8e−7 m- the gap size.
In Figures 6A,C,E, we can see the volume fractions of β-phase on both the cladding inner-surface and outer-surface for UO2 increased rapidly when the heat transfer coefficient decreased. More specifically, when the coefficient decreased from 1 to 0.8, the volume fraction of β-phase for UO2 on cladding inner-surface increased from
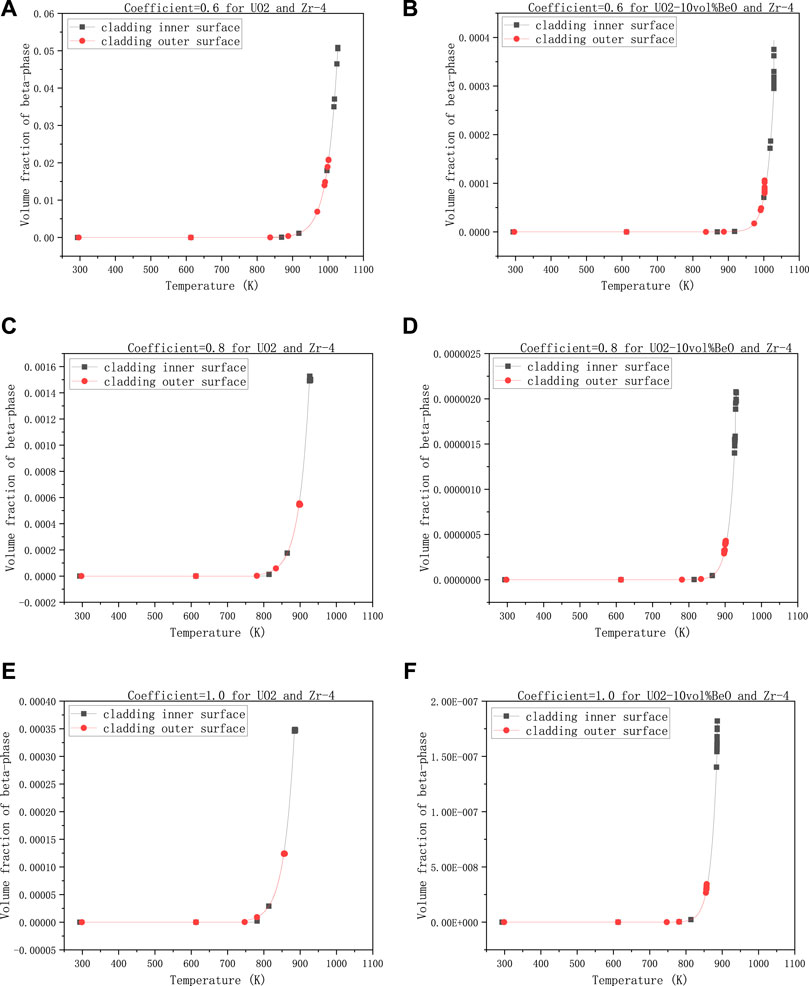
FIGURE 6. Volume fractions of β-phase on cladding inner surface and outer-surface, changing with the heat transfer coefficient multiplied by a number smaller than 1, (A) 0.6 for UO2 and Zircaloy-4, (B) 0.6 for UO2-10vol%BeO and Zircaloy-4, (C) 0.8 for UO2 and Zircaloy-4, (D) 0.8 for UO2-10vol%BeO and Zircaloy-4, (E) 1.0 for UO2 and Zircaloy-4, (F) 1.0 for UO2-10vol%BeO and Zircaloy-4.
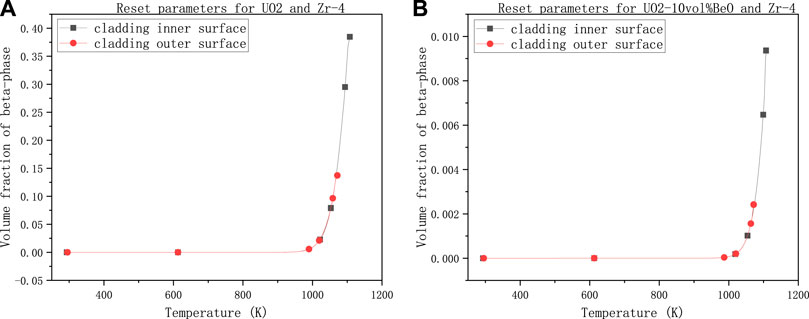
FIGURE 7. Volume fraction of β-phase on cladding inner and outer surface with power linear rate 60,000 W/m, gap size 1e–7 m, temperature at the extremities of fuel element 1500 K and the number multiplying the heat transfer coefficient 0.4, (A) for UO2 and Zircaloy-4, (B) for UO2-10vol%BeO and Zircaloy-4.
From all the figures above (i.e., Figures 3–6), we found that the highest volume fractions of β-phase are only
This time we set the linear power rate to 60,000 W/m according to Westinghouse Technology Systems Manual by NRC (The U.S. Nuclear Regulatory Commission, 2011). We decreased the gap size from 8e–7 to 1e–7 m because we have seen a relatively significant influence of gap size on the volume fraction of the new phase (β-phase). We can also decrease the coefficient of heat transfer by multiplying a number smaller (this time, we choose 0.4) for the same reason. Nevertheless, we could keep the temperature at the extremities of fuel element 1500 K because it seems that this temperature has little influence on the volume fraction of the β-phase. The results are shown below.
As we can see, the volume fraction of the β-phase on cladding inner-surface for UO2 in Figure 7A has reached nearly 0.4, which means the inner surface of cladding had reached the significant phase transformation interval.
The result for UO2-10vol%BeO in Figure 7B, comparing with the results before (i.e., Figures 3–6), showed a significant increase in the volume fraction of β-phase, reaching nearly 0.01. However, the volume fraction is still minimal, which showed that the phase transformation did not significantly occur on both the inner and outer surfaces of cladding for UO2-10vol%BeO.
To see more clearly the variation of the β-phase volume fraction with axial direction on cladding inner-surface, in Figures 8A,B, we found that the β-phase volume fraction decreases with the cladding radius increase.
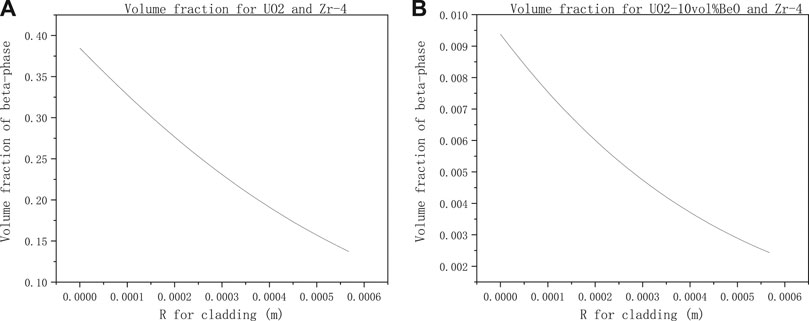
FIGURE 8. Volume fraction of β-phase from cladding inner surface to outer-surface with the same parameter setting in Figure 7 for (A) UO2 and Zircaloy-4, (B) UO2-10vol%BeO and Zircaloy-4.
Analysis and Discussion
As seen in the results above, we found that all parameters have an evident influence on the volume fraction of the favored phase except the temperature at the extremities of the fuel element, which has little impact. In the results of Figures 3–6, the highest volume fractions of β-phase are 0.052 for UO2 and
According to the results in (Liu et al., 2015), the addition of BeO decreased fuel temperature by increasing the fuel thermal conductivity. However, we found that the temperature distribution in the cladding (not the fuel) for both UO2 and UO2-10vol%BeO is very close to our results. Although the temperature is close, the volume fraction has a significant difference. According to Massih in (Massih, 2009), the heating rate Q affects the position of the transformed volume fraction. More specifically, when the absolute value of Q increases, the graph of volume fraction of β-phase will move to a higher temperature position. Thus from our results presented in Figures 3–7, we can deduce that the heating rate Q for UO2-10vol%BeO is higher than that for UO2 because the volume fraction for UO2-10vol%BeO is lower than that for UO2 under the similar temperature. We may also deduce that the addition of BeO affects the temperature variation, which is the heating rate Q.
Conclusion and Prospects
In summary, this model simulates the phase transformation by presenting the volume fraction of the favored phase
For further study on phase transformation behavior in Zircaloy-4 cladding with the UO2-BeO enhanced thermal conductivity nuclear fuel, adjusting parameters to simulate a more realistic loss-of-coolant accident would be the right choice. In this model, we have used a constant to represent the variation of hydrogen concentration. To analog a more realistic phase transformation, implanting the model of hydrogen pickup and ydride formation would be beneficial. The influence of excess oxygen due to oxidation is another important factor affecting phase transformation behavior in Zircaloy-4 cladding and needs to be modeled in the future work.
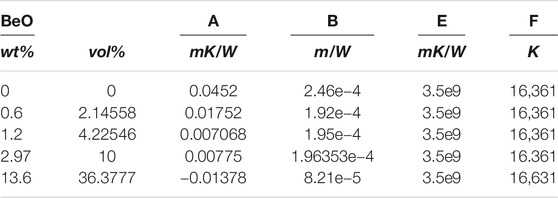
TABLE 2. Constants for Supplementary Equation (S14).
Data Availability Statement
The raw data supporting the conclusions of this article will be made available by the authors, without undue reservation.
Author Contributions
The work is mainly done by WL. LQ contributed to the accomplishment of this work, and WZ is the advisor of WL.
Conflict of Interest
The authors declare that the research was conducted in the absence of any commercial or financial relationships that could be construed as a potential conflict of interest.
Acknowledgments
The financial support from Nuclear Power Technology Innovation Center of China (No. 45000-41020012), the Fundamental Research Funds for the Central Universities of China (No. 45000-18841210), the International Sci & Tech Cooperation Program of Guangdong Province (No. 2019A050510022), and Guangdong Major Project of Basic and Applied Basic Research (No. 2019B030302011) is highly appreciated.
Supplementary Material
The Supplementary Material for this article can be found online at: https://www.frontiersin.org/articles/10.3389/fenrg.2021.667419/full#supplementary-material
References
Brachet, J. C., Portier, L., and Forgeron, T. (2002). “Influence of Hydrogen Content on the α/β Phase Transformation Temperatures and on the Thermal-mechanical Behavior of Zy-4, M4 (ZrSnFeV), and M5TM (ZrNbO) Alloys during the First Phase of LOCA Transient,” in Zirconium In the Nuclear Industry: Thirteenth International Symposium, Volume ASTM STP 1423. Editors G. D. Moan, and P. Rudling (West Conshohocken, PA: American Society for Testing Materials), 673–701.
Engineering ToolBox (2004). Water - Saturation Pressure. Available at: https://www.engineeringtoolbox.com/water-vapor-saturation-pressure-d_599.html (January 15, 2020).
Forgeron, T., Brachet, J. C., Barcelo, F., Castaing, A., Hivroz, J., Mardon, J. P., et al. (2000). Experiment and Modeling of Advanced Fuel Rod Cladding Behavior under LOCA Conditions: Alpha-Beta Phase Transformation Kinetics and EDGAR Methodology. Editors G. P. Sabol, and G. D. Moan (West Conshohocken, PA: ASTM International), 256–278.
Forgeron, T., Brachet, J. C., Barcelo, F., Castaing, A., Hivroz, J., Mardon, J. P., et al. (2000). “Experiment and Modeling of Advanced Fuel Rod Cladding Behavior under LOCA Conditions: Alpha-Beta Phase Transformation Kinetics and EDGAR Methodology,” in Zirconium In the Nuclear Industry: Twelfth International Symposium, Volume ASTM STP 1354. Editors G. P. Sabol, and G. D. Moan (WestConshohocken, PA: American Society for Testing Materials), 256–278.
Gamble, K. A., Barani, T., Pizzocri, D., Hales, J. D., Terrani, K. A., and Pastore, G. (2017). An Investigation of FeCrAl Cladding Behavior under normal Operating and Loss of Coolant Conditions. J. Nucl. Mater. 491, 55–66. doi:10.1016/j.jnucmat.2017.04.039
Hales, J. D., Williamson, R. L., Novascone, S. R., Pastore, G., Spencer, B. W., Stafford, D. S., et al. (2016). BISON Theory Manual the Equations behind Nuclear Fuel Analysis. United States Web (INL/EXT-13-29930 Rev. 3). doi:10.2172/1374503
Isobe, T., and Suda, Y. (1999). Method for Making Zr alloy Nuclear Reactor Fuel Cladding Having Excellent Corrosion Resistance and Creep Properties. Alexandria, VA, United States.
Jailin, T., Tardif, N., Desquines, J., Coret, M., Baietto, M.-C., and Georgenthum, V. (2020). Experimental Study and Modelling of the Phase Transformation of Zircaloy-4 alloy Under High thermal Transients. Mater. Charact. 162, 110199. doi:10.1016/j.matchar.2020.110199
Kempen, A. T. W., Sommer, F., and Mittemeijer, E. J. (2002). Determination and Interpretation of Isothermal and Non-isothermal Transformation Kinetics; the Effective Activation Energies in Terms of Nucleation and Growth. J. Mater. Sci. 37 (7), 1321–1332. doi:10.1023/a:1014556109351
Leblond, J. B., and Devaux, J. (1984). A New Kinetic Model for Anisothermal Metallurgical Transformations in Steels Including Effect of Austenite Grain Size. Acta Metallurgica 32 (1), 137–146. doi:10.1016/0001-6160(84)90211-6
Liu, R., Zhou, W., Shen, P., Prudil, A., and Chan, P. K. (2015). Fully Coupled Multiphysics Modeling of Enhanced Thermal Conductivity UO 2 -BeO Fuel Performance in a Light Water Reactor. Nucl. Eng. Des. 295, 511–523. doi:10.1016/j.nucengdes.2015.10.019
Manngård, T., and Massih, A. R. (2011). Modelling and Simulation of Reactor Fuel Cladding Under Loss-Of-Coolant Accident Conditions. J. Nucl. Sci. Technol. 48 (1), 39–49. doi:10.1080/18811248.2011.9711677
Manngård, T., Jernkvist, L. O., and Massih, A. (2011). Evaluation of Loss-Of-Coolant Accident Simulation Tests with the Fuel Rod Analysis Code FRAPTRAN-1.4. Boston, MA: HI TEMP.
Massih, A. R., and Jernkvist, L. O. (2009). Transformation Kinetics of Alloys under Non-isothermal Conditions. Model. Simulation Mater. Sci. Eng. 17 (5), 055002. doi:10.1088/0965-0393/17/5/055002
Massih, A. R. (2009). Transformation Kinetics of Zirconium Alloys under Non-isothermal Conditions. J. Nucl. Mater. 384 (3), 330–335. doi:10.1016/j.jnucmat.2008.11.033
Mittemeijer, E. J. (1992). Analysis of the Kinetics of Phase Transformations. J. Mater. Sci. 27 (15), 3977–3987. doi:10.1007/bf01105093
Northwood, D. O., and Lim, D. T. (1979). Phase Transformations in Zirconium and its Alloys. Can. Metallurgical Q. 18 (4), 441–467. doi:10.1179/cmq.1979.18.4.441
Park, D. J., Kim, H. G., Jung, Y. I., Park, J. H., Yang, J. H., and Koo, Y. H. (2016). Behavior of an Improved Zr Fuel Cladding with Oxidation Resistant Coating under Loss-Of-Coolant Accident Conditions. J. Nucl. Mater. 482, 75–82. doi:10.1016/j.jnucmat.2016.10.021
Sawarn, T. K., Banerjee, S., Pandit, K. M., and Anantharaman, S. (2014). Study of Clad Ballooning and Rupture Behavior of Fuel Pins of Indian PHWR under Simulated LOCA Condition. Nucl. Eng. Des. 280, 501–510. doi:10.1016/j.nucengdes.2014.10.011
Suman, S., Khan, M. K., Pathak, M., Singh, R. N., and Chakravartty, J. K. (2016). Rupture Behaviour of Nuclear Fuel Cladding during Loss-Of-Coolant Accident. Nucl. Eng. Des. 307, 319–327. doi:10.1016/j.nucengdes.2016.07.022
Sutherland, B. M., Bennett, P. V., Sidorkina, O., and Laval, J. (2000). Clustered Damages and Total Lesions Induced in DNA by Ionizing Radiation: Oxidized Bases and Strand Breaks†. Biochemistry 39 (27), 8026–8031. doi:10.1021/bi9927989
Sutherland, B. M., Bennett, P. V., Schenk, H., Sidorkina, O., Laval, J., Trunk, J., et al. (2001). Clustered DNA Damages Induced by High and Low LET Radiation, Including Heavy Ions. Phys. Med. 17 Suppl 1, 202–204.
Tang, C., Stueber, M., Seifert, H. J., and Steinbrück, M. (2017). Protective Coatings on Zirconium-Based Alloys as Accident-Tolerant Fuel (ATF) Claddings. Corrosion Rev. 35 (3), 141–165. doi:10.1515/corrrev-2017-0010
The U.S. Nuclear Regulatory Commission (2011). Westinghouse Technology Systems Manual Section 2.2 Power Distribution Limits. Available at: www.nrc.gov/docs/ML1122/ML11223A208.pdf (January 1, 2020).
Keywords: phase transformation, zircaloy-4, LOCA, accident tolerant fuel (ATF), fully coupled
Citation: Lu W, Qian L and Zhou W (2021) Coupled Modeling and Simulation of Phase Transformation in Zircaloy-4 Fuel Cladding Under Loss-of-Coolant Accident Conditions. Front. Energy Res. 9:667419. doi: 10.3389/fenrg.2021.667419
Received: 13 February 2021; Accepted: 26 May 2021;
Published: 09 June 2021.
Edited by:
Mingjun Wang, Xi’an Jiaotong University, ChinaReviewed by:
Juliana P. Duarte, Virginia Tech, United StatesLuteng Zhang, Chongqing University, China
Copyright © 2021 Lu, Qian and Zhou. This is an open-access article distributed under the terms of the Creative Commons Attribution License (CC BY). The use, distribution or reproduction in other forums is permitted, provided the original author(s) and the copyright owner(s) are credited and that the original publication in this journal is cited, in accordance with accepted academic practice. No use, distribution or reproduction is permitted which does not comply with these terms.
*Correspondence: Wenzhong Zhou, emhvdXd6aDNAbWFpbC5zeXN1LmVkdS5jbg==