 Tang Changbing
 Li Yuanming
94% of researchers rate our articles as excellent or good
Learn more about the work of our research integrity team to safeguard the quality of each article we publish.
Find out more
ORIGINAL RESEARCH article
Front. Energy Res., 11 May 2021
Sec. Nuclear Energy
Volume 9 - 2021 | https://doi.org/10.3389/fenrg.2021.664345
This article is part of the Research TopicAdvanced Nuclear Fuel TechnologyView all 11 articles
FCM fuel which microencapsulated TRISO particles in SiC matrix is a promising ATF (accident tolerant fuel) candidate fuel designed to replace the traditional pellet-cladding fuel rod. In order to predict the in-pile behavior of FCM fuel accurately and to optimize the design of FCM fuel, it is necessary to establish a numerical simulation method of irradiation-thermal -mechanical coupling behavior of FCM fuel. In this study, the related thermal effects and irradiation effects of FCM fuel and the effect of gap heat transfer are considered. User defined subroutines are compiled respectively, and the above-mentioned correlation effects are introduced into ABAQUS software to establish a numerical simulation method for the irradiation-thermal -mechanical coupling behavior of FCM fuel. Based on the established numerical simulation method, the performance evolution of FCM fuel in the reactor is simulated, and the possible failure modes of FCM fuel in the reactor are analyzed. The research results can provide guidance for the optimization design and performance prediction of FCM fuel.
Fully Ceramic Microencapsulated (FCM) fuel is a new concept proposed by the Oak Ridge National Laboratory (ORNL) as a fuel with enhanced accident tolerance (Terrani et al., 2012). FCM fuel which microencapsulated TRISO particles in silicon carbide (SiC) matrix is an integrated fuel designed to replace the traditional pellet-cladding fuel rod. The fuel design can effectively solve the problems of LWR fuel, such as water side corrosion, abrasion, stress corrosion cracking (Olander, 2009). Moreover, FCM fuel design has the advantages of high thermal conductivity (Powers and Wirth, 2010; Terrani et al., 2012), lower swelling and high fission products capability (Boer et al., 2011; Fernández, 2011; Chun et al., 2015; Lee and Cho, 2015), which is one of the most promising ATF fuels candidate (Olander, 2009). FCM can be used in different kinds of reactors such as LWR, SMR (Olander, 2009).
TRISO particle possessed complex multi-layered coating structure, including uranium dioxide kernel, porous pyrolytic carbon layer (Buffer), inner pyrolytic carbon layer (IPyC), silicon carbide layer (SiC) and outer pyrolytic carbon layer (OPyC). The function of the coated layers was designed: buffer layer is mainly designed to absorb fission fragments, reduce radiation damage to outer layers, offered space for accommodating irradiation swelling of uranium dioxide kernel and fission gas. IPyC layer is mainly used to prevent the contact of fission products with SiC, which results in the corrosion of SiC layer caused by fission products. The SiC layer mainly acts as a pressure bearing layer, providing enough mechanical strength for TRISO particles. OPyC layer protects SiC layer from damage (Powers and Wirth, 2010; Williamson et al., 2012; Collin, 2014).
Because of the multiple coating structure of TRISO particles, irradiation-thermal-mechanical phases in application environment, and complex non-line contacting and deformation between TRISO particle and SiC matrix, FCM fuel exhibits complex in-pile behavior (Terrani et al., 2012). A number of efforts have been devoted to studying the FCM fuel performance with focuses on neutronics (Fernández, 2011), thermal-neutronics coupling (Lee and Cho, 2015) accident safety (Boer et al., 2011; Chun et al., 2015). The heterogeneous composition of this fuel design leads to difficulty with thermal and mechanical analyses. Some HTR fuel performance code was used in particle level analyses and provided 1D results of material performance (Collin, 2014; Chun et al., 2015). Chen et al., (2019) (Williamson et al., 2012) investigates the mechanical behavior of SiC layer and SiC matrix, with using 2D homogeneous model and introducing the interaction between TRISO and matrix. Zhou et al. (2020) discuss the effect of spacing of TRISO and size of no-fuel area on integrality of FCM. The result shows that the stress in SiC layer would release by reducing the spacing of TRISO.
Accurate and reliable fuel behavior prediction is not only necessary for reactor safety calculation, fuel design requirements, but also for fuel performance evaluation. In this research, the irradiation-thermal-mechanical coupling behavior of FCM fuel was simulated based on the ABAQUS software. 1/4RVE (representative volume model) was established to calculate the deformation and mechanical behavior of FCM fuel. Properties variation of the related materials was considered.
Gas and solid swelling of UO2 kernel is a function ofburnup (MacDonald and Thompson, 1976), Fuel densification occurs in the early stage of irradiation, the densification of UO2 is also a function ofburnup (MacDonald and Thompson, 1976), Thermal expansion of UO2is a function of temperature (MacDonald and Thompson, 1976)Lucuta modified model which suitable for both low and high burnup stage is adopted as the thermal conductivity model of UO2kernel, The model takes into account the effects of temperature, fuel densification, fission products and porosity on thermal conductivity (Lucuta et al., 1996). Young's modulus of UO2 fuel is taken as a constant 219,000 MPa, Poisson's ratio is 0.345 (Hales et al., 2013), density is 10.96 g/cm3.
Young’s modulus, Poisson’s ratio, density, specific heat and thermal conductivity of porous pyrolytic carbon materials are 20,000 MPa, 0.23, 1.0 g/cm3, 720 J/kg K, and 0.5 W/m K (MacDonald and Thompson, 1976) respectively. Irradiation swelling of porous pyrolytic carbon materials is isotropic, which is different with dense pyrolytic carbon materials. The radial and hoop swelling strain are the same in spherical coordinates (Hales et al., 2013):
Creep rate of porous pyrolytic carbon materials is (Hales et al., 2013):
νc is the Poisson’s ratio of creep, νc = 0.5,
Young’s modulus, Poisson’s ratio, density, specific heat and thermal conductivity for SiC are 340 GPa, 0.13, 3.18 g/cm3, 620 J/kg K, and 13.9 W/m K (Snead et al., 2007) respectively. Thermal expansion coefficient of SiC is a function of temperature (Snead et al., 2007), Radiation creep of SiC is expressed by the following empirical correlation (Snead et al., 2007):
K1 is set as a constant 0.4 × 10⁻³¹n/m2/MPa,
Young’s modulus, Poisson’s ratio, density, specific heat and thermal conductivity for dense pyrolytic carbon materials are 470,000 MPa, 0.23, 1.9 g/cm3, 720 J/kg K and 4 W/m K (Hales et al., 2013) respectively, the yield strength is set as 137 MPa.Radiation swelling of dense pyrolytic carbon is anisotropic, and the radial and hoop radiation swelling are different in spherical coordinates as follows (Hales et al., 2013):
Strain unit is 1/(1025 n/m2),
Creep rate of dense pyrolytic carbon materials is (Hales et al., 2013):
νc indicates Poisson’s ratio, νc = 0.5,
Mirr, cerrep = 2;
During the irradiation process, gap will be formed between Buffer and IPyC layer and filled with fission gas. The gap thermal transfer coefficient is expressed as follows (Hales et al., 2013):
where,
During the irradiation process, fission gas will generate in the UO2 kernel and release into the Buffer layer. Because of the low temperature of M3 fuel, the fission gas released mainly as non-thermal way. In the simulation, it is assumed that the fission gas release rate is 10%, regardless of the fuel depletion effect. The Ideal Gas law is used to calculate the gas pressure in the Buffer layer. CO is mainly generated by the combination of carbon atoms and oxygen atoms that diffuse from UO2 kernel to the Buffer layer. Generation rate is calculated by Proksch model (Hales et al., 2013):
where, O/F is the average number of oxygen atoms released per fission, neglecting the generation of CO2.
The Ideal Gas law equation is:
where, P is gas pressure, n is the number of moles of gas, R is the gas constant, T is temperature, V represents the free space volume between Buffer layer and IPyC (Including gap volume and porosity volume in Buffer layer, the porosity of Buffer layer is considered as 56%).
FCM consists of TRISO particles and matrix. TRISO particles owns a complex multi-layered coating structure, including UO2 kernel, buffer layer, IPyC layer, SiC layer and OPyC layer from inside to outside. Numerous TRISO particles are contained in SiC matrix. Figure 1 shows a typical structure of FCM.
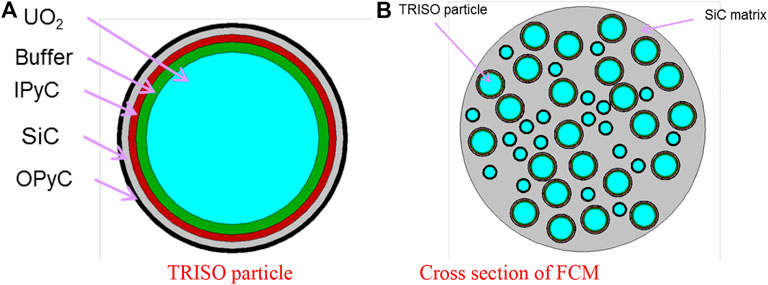
FIGURE 1. Schematic of FCM structure. (A) TRISO particle (B) Cross section of FCM.
The UO2 kernel radius and thickness of buffer layer, IPyC layer, SiC layer and OPyC layer are 420.0, 50, 35, 35, 20 µm respectively. Volume fraction of TRISO particles is 45% in FCM pellet (the UO2 volume fraction is 18.98%). Considering that FCM fuel is a dispersion fuel with complex structure, it is difficult to model and simulation the whole fuel. In order to analyze the radiation-thermal-mechanical coupling performance of FCM fuel, it is necessary to extract representative volume element (RVE) from FCM fuel for simulation analysis. Assuming that the minimum FCM fuel representative volume element (RVE) edge length is L (μm), the TRISO volume is Vf and the TRISO particle radius is R (μm), when TRISO particles are uniformly distributed in the SiC matrix, the relationships among them are as follows:
According to the above equation, the minimum RVE edge length L is 900 μm. Based on the symmetry of RVE, a 1/4 RVE model is established as shown in Figure 2. The two sections are defined as symmetrical boundary conditions in Cartesian coordinate system (three-dimensional rectangular coordinate system in global space). Considering the high thermal conductivity of FCM fuel, for simplification, the external surface of RVE is set a fixed temperature boundary condition (698 K, 100 K higher than the coolant temperature). The IPyC layer and Buffer layer are closely connected, and the boundary condition between the two layers is isothermal. Initial zero stress temperature of the whole FCM fuel RVE is 300 K. The linear power of FCM fuel is 200 W/cm, fuel diameter is 9 mm. Two situation cases are simulated in this research work. In first case, the steady operation lasts for 1,100 days, and then followed by a power transient for 9 s, with the power jumping from 100%FP to 150%FP. In the another case, the steady operation lasted for 1,100 days, and then followed by a water loss accident for 200 s, the power decreased from 100 to 10% FP, and the coolant temperature increased from 698 to 1473 K. Assuming that the fast neutron fluence in the end of steady operation reaches at 9.5 × 10²¹ n/cm2.
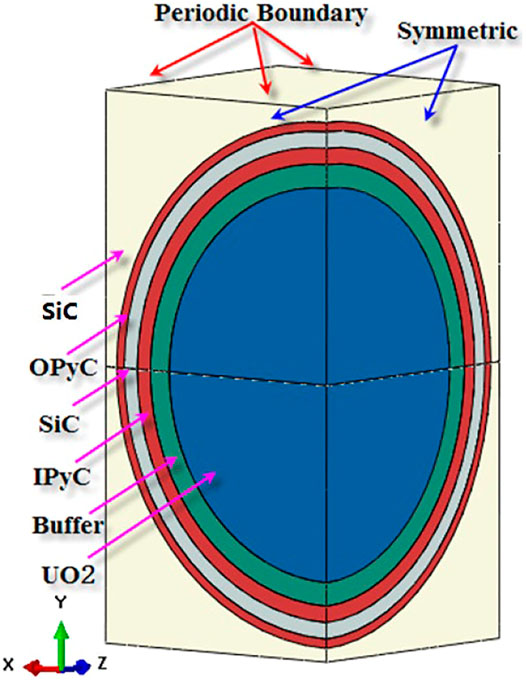
FIGURE 2. 1/4 representative volume element model of FCM fuel.
Due to the complexity of FCM fuel material models such as irradiation swelling, irradiation creep and thermal conductivity, it is difficult to input them in a simple interface. In this simulation, the complex material model is introduced into the finite element simulation calculation by compiling corresponding user-defined subroutines UMAT (customized material constitutive relation subroutine), GAPCON (gap thermal conduction subroutine), DLOAD (gap pressure subroutine) and so on. The analysis step type is transient complete temperature displacement coupling analysis step. The element type is implicit first-order temperature displacement coupling element.
Three types of mesh number, including 6,240, 12,023 and 24,960, have been adapted to investigate the mesh independence. The results show that the data deviation of temperature, stress and strain caused by different mesh number is less than 2%. Considering the precision and effectiveness of computation, the mesh number of whole model is set to 12,023 and the number of nodes is 15,180 as Figure 3 shows.
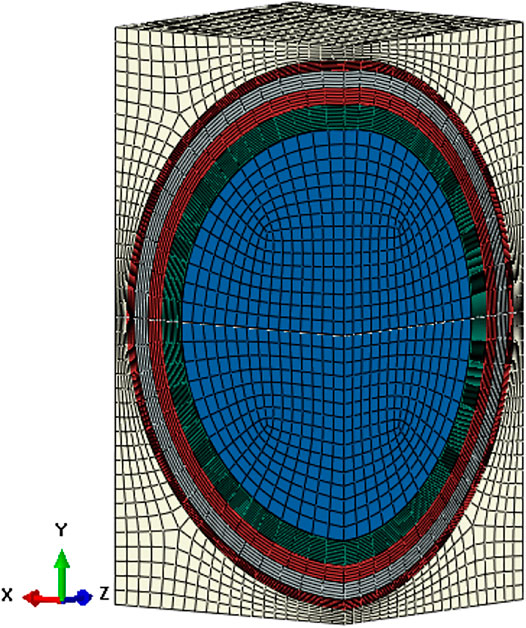
FIGURE 3. Mesh model of 1/4 RVE of FCM fuel.
The verification for FCM fuel is difficult for lacking of experiment data. Therefore a code to code verification is chosen to verify this simulation. According to the open literature, BISON is an advanced three dimension fuel performance code, and the BISON has been used to simulate the irradiation-thermal-mechanical performance of TRISO fuel in published literature. Based on the numerical simulation method established in this study, if the effect of matrix is not considered, it can be directly used to simulate the performance of TRISO fuel. According to the simulation results, the results obtained by the numerical simulation method established in this study are consistent with those obtained by BISON, The specific comparison results can be seen in the previous published articles (Changbing et al., 2019). The validity of this numerical simulation method has been verified and can be used for this study.
Figure 4 shows the temperature distribution contour of FCM fuel RVE model at the beginning, end of irradiation, power transient and LOCA conditions. According to the temperature distribution contour, the maximum temperature of the fuel is always maintained at the center of the RVE model. Under the steady operation condition, the temperature difference between the center of the RVE model and the outer surface is about 70 K. The difference of the maximum temperature at the beginning and the end of irradiation is about 20 K, and the temperature at the end of irradiation is higher. The maximum temperature increases about 55 K under power transient condition, and the whole temperature increases significantly under LOCA condition. The reason for the above phenomenon is that center UO2 particle produces heat, so the highest temperature appears in the center. The thermal conductivity of fuel decreases with the increase of burnup, so the maximum temperature at the end of irradiation increases. In the power transient, the temperature rises due to the increase of heat generation, and the whole temperature rises due to the loss of external coolant in the LOCA condition.
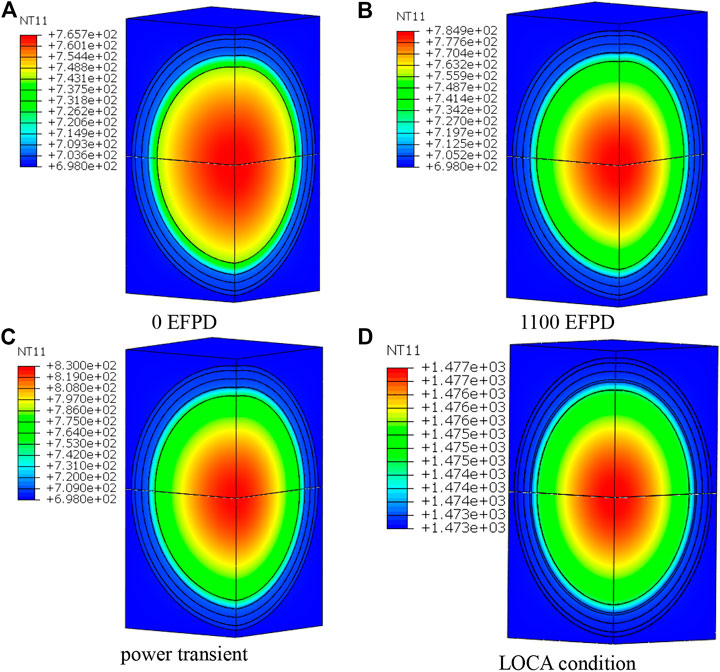
FIGURE 4. Temperature distribution contour of FCM fuel RVE model under different conditions (EFPD, Effective Full Power Day). (A) 0 EFPD. (B) 1100 EFPD. (C) power transient. (D) LOCA condition.
The variation of the maximum temperature of each layer under steady operation and power transient conditions as shown in Figure 5. According to the variation results, it can be seen that the temperature change of UO2 fuel and buffer layer is more obvious for the power transient, while the temperature change of other layers is not obvious. The results are related to two factors. On the one hand, the higher the thermal conductivity of the material, the less obvious the transient change of fuel power. Because the thermal conductivity of UO2 and buffer is relatively low, they are more sensitive to the change of temperature. On the other hand, the gap heat transfer ability is poor, so the UO2 and buffer inside the gap are more sensitive to the change of temperature.
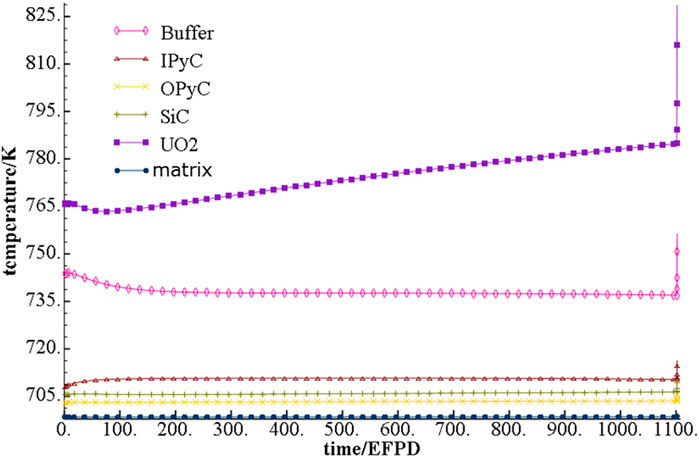
FIGURE 5. Maximum temperature of each layer of material variation under steady operation condition and power transient condition.
The max temperature of each layer of material variation under steady operation condition and LOCA condition is shown in Figure 6. According to the variation results, it can be seen that the temperature of each layer will rise significantlyunder LOCA conditions. The reason for this phenomenon is that under LOCA conditions, the heat production of fuel particle decreases, and the fuel pellet temperature will rise rapidly due to the loss of coolant.
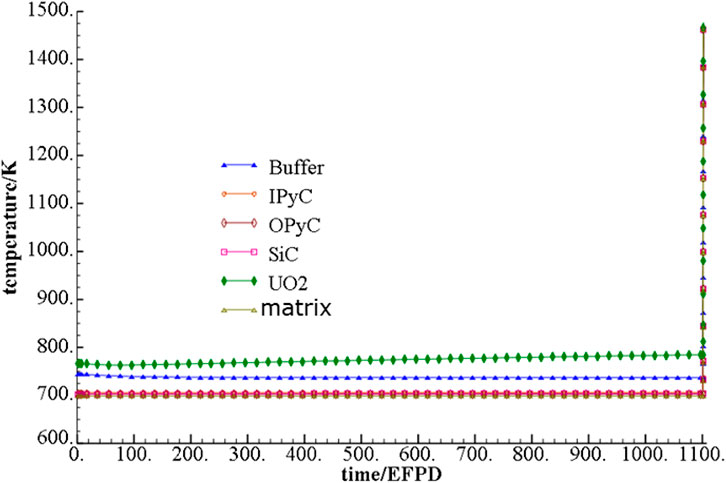
FIGURE 6. Max temperature of each layer of material variation under steady operation condition and LOCA condition.
The simulation results show that the corresponding structural changes of FCM fuel RVE model at the 0 EFPD, 200 EFPD and 1,100 EFPD are shown as Figure 7. According to the deformation results of the structure, it can be seen that the layers of the structure keep close bonding at the initial stage of irradiation. With the increase of irradiation time, there is a gap occurs between the buffer and ipyc layer, which still exists at the end of irradiation time. The reason for this phenomenon is that the buffer layer and ipyc layer will shrink under irradiation, so the gap will appear at the interface due to the irradiation shrinkage.
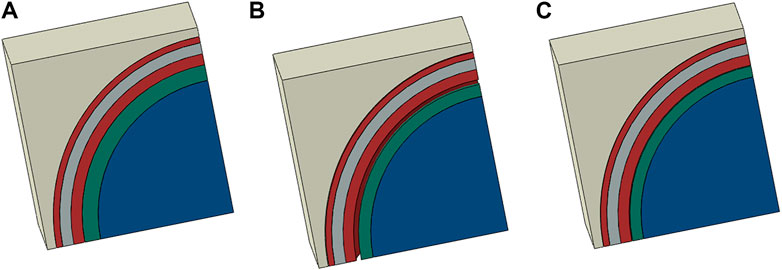
FIGURE 7. Structural changes of FCM fuel RVE model at different irradiationtime. (A) 0 EFPD. (B) 200 EFPD. (C) 1,100 EFPD.
The change curves of buffer outer diameter and IPyC inner diameter in steady operation stage are shown in the Figure 8. According to Figure 8, it can be seen that the outer diameter of Buffer layer first decreases and then gradually increases with the increase of irradiation time, while the inner diameter of the IPyC layer is opposite to the change trend of the outer diameter of the Buffer layer, which first increases and then gradually decreases with the increase of irradiation time. The outer diameter change trend of Buffer layer is caused by radiation shrinkage of buffer and radiation swelling of UO2, and the inner diameter change trend of IPyClayer is mainly caused by radiation shrinkage at initial stage of irradiation and radiation swelling at middle and late stage of irradiation.
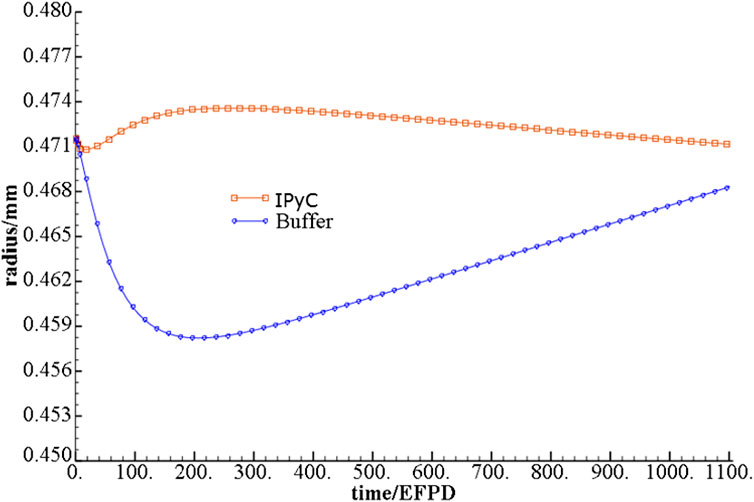
FIGURE 8. Buffer outer diameter and IPyC layer inner diameter variation with EFPD.
The difference between the inner diameter of IPyC layer and the outer diameter of Buffer layer is the gap distance. The variation of gap distance during steady operation and power transient condition is shown in Figure 9. The results show that the gap distance increases first and then decreases gradually with the increase of operation time at steady operation condtion. In the power transient condition, due to the larger thermal expansion of UO2, the gap will decrease slightly.
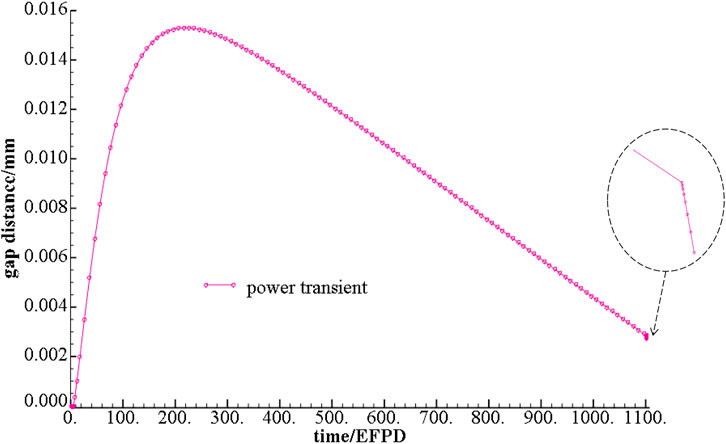
FIGURE 9. Variation of gap distance with EFPD under power transient condition.
The hoop stress contour of FCM fuel RVE model at the initial stage of irradiation time, the end of irradiation time, power transient condition and LOCA condition are shown in Figure 10. According to the hoop stress distribution contour, it can be seen that the hoop stress distribution of each layer is obviously different. For stress analysis of FCM fuel, it is usually more concerned about the hoop stress on PyC layer and SiC layer, which directly affects the corresponding structural integrity.
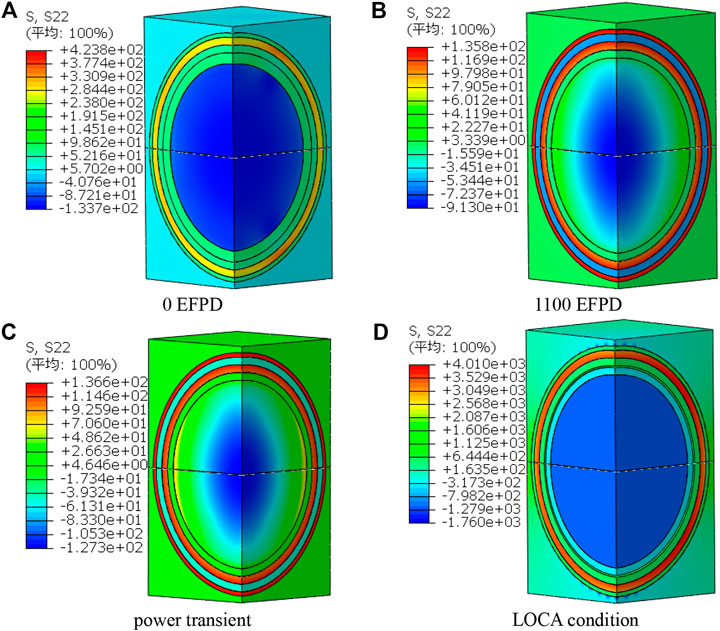
FIGURE 10. hoop stress distribution contour of RVE model under different conditions. (A) 0 EFPD. (B) 1,100 EFPD. (C) Power transient. (D) LOCA condition.
Hoop stress of PyC layer and SiC layer variation with EFPD under steady operation condition and power transient condition as shown in Figure 11. According to Figure 11, it can be seen that in the steady operation period, the hoop stress of PyC layer first increases, then decreases, and finally tends to be stable with the increase of irradiation time. However, the hoop stress of SiC layer is just opposite to that of PyC layer, with the increase of operation time, the hoop stress first decreases, then increases, and finally tends to be stable. At the beginning, the internal stress value of each layer is mainly caused by the difference of thermodynamic properties and irradiation properties of each layer, and then the stress value tends to be stable, mainly due to the creep effect of each layer. The hoop stress of the PyC layer and SiC layer is not sensitive to the power transient, and the stress change is very small under the power transient.
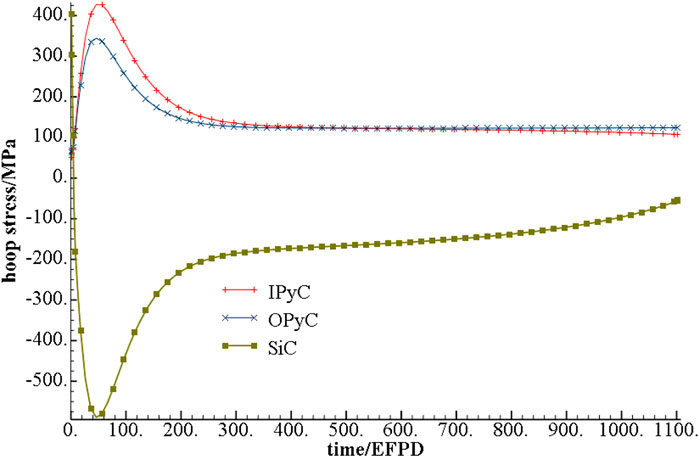
FIGURE 11. Hoop stress of the PyC layer and SiC layer variation with EFPD under power transient condition.
Hoop stress of PyC layer and SiC layer variation with EFPD under steady operation condition and LOCA condition as shown in Figure 12. According to Figure 12, it can be seen that the hoop stress of PyC layer and SiC layer is sensitive to LOCA condition. Under LOCA condition, the hoop stress changes greatly, resulting in large tensile stress and structural damage. Under LOCA condition, the overall temperature of FCM fuel rises rapidly. Due to the difference of thermodynamic properties of each materials, large stress will be produced in it. When the stress reaches a certain value, it may lead to the structural failure of FCM fuel.
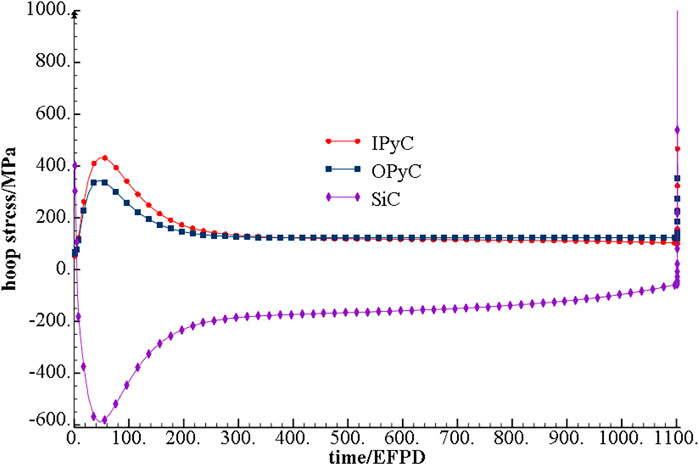
FIGURE 12. Hoop stress of the PyC layer and SiC layervariation with EFPD under LOCA condition.
The gas produced by UO2 fission would be released into the gap, which will lead to obvious gap pressure. Gap pressure variation with EFPD under steady operation condition as shown in Figure 13. According to Figure 13, it can be seen that with the increase of irradiation time, the gap pressure increases gradually. The maximum gap pressure appears at the end of irradiation time, and the corresponding value is about 21 MPa. According to the operation experience of high temperature gas cooled reactor, TRISO particles can still maintain its structural integrity when the internal gap pressure reaches about 50 MPa. Therefore, it can be inferred that the gap pressure will not lead to the structural failure of TRISO particles, which is consistent with the previous stress analysis results.
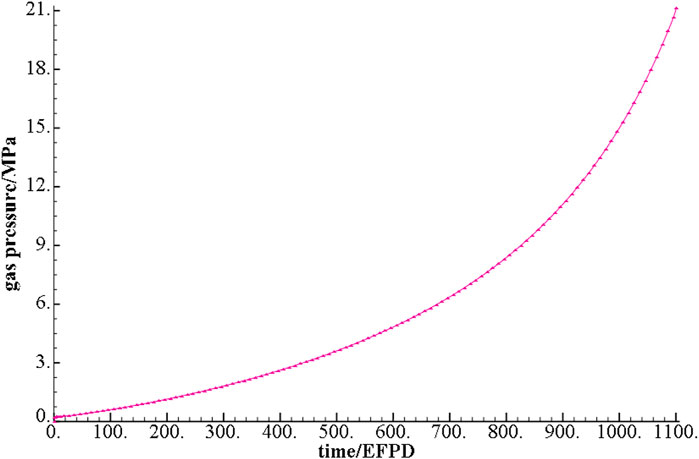
FIGURE 13. Gap pressure variation with EFPD under steady operation condition.
In this research, three-dimensional model was established to simulate the irradiation-thermal-mechanical coupling behavior of FCM fuel by using ABAQUS software. The results indicated that:
(1) The temperature difference in FCM is small under steady operation and power transient, except for temperature change of UO2 fuel and buffer layer due to power transient. The temperature of whole fuel will rise significantly under LOCA conditions.
(2) In the steady operation period, the hoop stress of PyC layer first increases, then decreases, and finally tends to be stable with the increase of irradiation time. However, the hoop stress of SiC layer is just opposite to that of PyC layer, with the increase of operation time, the hoop stress first decreases, then increases, and finally tends to be stable. The hoop stress of the PyC layer and SiC layer is not sensitive to the power transient, but sensitive to the LOCA condition.
(3) The pressure of gap would rise under steady operation and achieve about 21 MPa at the EOL, which could not result in structure failure of TRISO particles. Meanwhile, the gap increases initially and then decreases under steady operation. For power transient, the gap will decrease slightlydue to the larger thermal expansion of UO2.
The establishment of this numerical simulation method could provide guidance for the optimization design and performance prediction of FCM fuel. In the following study, the SiC fracture and its influence on Csdiffusivitywill also be introduced into numerical simulation to simulate more accurate radiation-thermal-mechanical coupling performance of FCM fuel.
The raw data supporting the conclusion of this article will be made available by the authors, without undue reservation.
TC is responsible for numerical simulation modeling and calculation of FCM fuel, data processing, part of the article writing. JY is responsible for the guidance of the whole simulation technology. The rest of the authors are responsible for the preparation and modification of the whole article and the drawing of related pictures.
This research was supported by the National Natural Science Foundation of China (U20B2013), National Key R&D Program of China (2018YFE0116100) and Science and Technology on Reactor System Design Technology Laboratory.
CT, YL, YJ, KZ, PW were employed by Nuclear Power Institute of China.
Boer, B., Sen, R. S., Pope, M. A., and Ougouag, A. M. (2011). Material Performance of Fully-Ceramic Micro-Encapsulated Fuel Under Selected LWR Design Basis Scenarios[R]. Idaho Falls, ID: Idaho National Laboratory (INL).
Changbing, T., Yongjun, J., Yuanming, L., Yi, Z., and Hua, P. (2019). Preliminary Research on the Irradiation-Thermal-Mechanical Coupling Behavior Simulation Method of FCM Fuel. Int. J. Adv. Nucl. Reactor Des. Tech. 1, 51–56. doi:10.1016/j.jandt.2019.10.002
Chen, P., Qiu, S., Liu, S., and Zhou, Y. (2019). Preliminary Analysis of a Fully Ceramic Microencapsulated Fuel Thermal–Mechanical Performance[J]. Computation 8, 448–461. doi:10.3390/computation8010013
Chun, J.-H., Lim, S.-W., Chung, B.-D., and Lee, W.-J. (2015). Safety Evaluation of Accident-Tolerant FCM Fueled Core with SiC-Coated Zircalloy Cladding for Design-Basis-Accidents and beyond DBAs. Nucl. Eng. Des. 289, 287–295. doi:10.1016/j.nucengdes.2015.04.021
Collin, B. P. (2014). Modeling and Analysis of UN TRISO Fuel for LWR Application Using the PARFUME Code[J]. J. Nucl. Mater. 451 (1–3), 65–77. doi:10.1016/j.jnucmat.2014.03.032
Fernández, G. D. (2011). “Safety Aspects of Ceramic Fully Encapsulated Fuel for Light Water Reactors[D],” in Universitat Politècnica de Catalunya. Escola Tècnica Superior d'Enginyeria Industrial de Barcelona (Barcelona, Spain: Enginyeria Industrial).
Hales, J. D., Williamson, R. L., Novascone, S. R., Perez, D. M., Spencer, B. W., and Pastore, G. (2013). Multidimensional Multiphysics Simulation of TRISO Particle Fuel. J. Nucl. Mater. 443 (1), 531–543. doi:10.1016/j.jnucmat.2013.07.070
Lee, Y., and Cho, N. Z. (2015). Steady- and Transient-State Analyses of Fully Ceramic Microencapsulated Fuel Loaded Reactor Core via Two-Temperature Homogenized Thermal-Conductivity Model. Ann. Nucl. Energ. 76, 283–296. doi:10.1016/j.anucene.2014.09.027
Lucuta, P. G., Matzke, H., and Hastings, I. J. (1996). A Pragmatic Approach to Modelling Thermal Conductivity of Irradiated UO2 Fuel: Review and Recommendations. J. Nucl. Mater. 232 (2), 166–180. doi:10.1016/s0022-3115(96)00404-7
MacDonald, P. E., and Thompson, L. B. (1976). MATPRO: A Handbook of Materials Properties for Use in the Analysis of Light Water Reactor Fuel Rod Behavior[R]. Idaho Falls, ID: Idaho National Laboratory(INL).
Olander, D. (2009). Nuclear Fuels - Present and Future. J. Nucl. Mater. 389 (1), 1–22. doi:10.1016/j.jnucmat.2009.01.297
Powers, J. J., and Wirth, B. D. (2010). A Review of TRISO Fuel Performance Models. J. Nucl. Mater. 405 (1), 74–82. doi:10.1016/j.jnucmat.2010.07.030
Snead, L. L., Nozawa, T., Katoh, Y., Byun, T.-S., Kondo, S., and Petti, D. A. (2007). Handbook of SiC Properties for Fuel Performance Modeling. J. Nucl. Mater. 371 (1), 329–377. doi:10.1016/j.jnucmat.2007.05.016
Terrani, K. A., Snead, L. L., and Gehin, J. C. (2012). Microencapsulated Fuel Technology for Commercial Light Water and Advanced Reactor Application[J]. J. Nucl. Mater. 427 (1–3), 209–224. doi:10.1016/j.jnucmat.2012.05.021
Williamson, R. L., Hales, J. D., Novascone, S. R., Tonks, M. R., Gaston, D. R., Permann, C. J., et al. (2012). Multidimensional Multiphysics Simulation of Nuclear Fuel Behavior. J. Nucl. Mater. 423 (1), 149–163. doi:10.1016/j.jnucmat.2012.01.012
Keywords: ATF, irradiation-thermal-mechanical coupling, numerical simulation, FCM fuel, 3D simulation
Citation: Changbing T, Yuanming L, Yongjun J, Kun Z and Peng W (2021) Numerical Simulation Research on the Irradiation-Thermal-Mechanical Performance Evolution of FCM Fuel. Front. Energy Res. 9:664345. doi: 10.3389/fenrg.2021.664345
Received: 05 February 2021; Accepted: 27 April 2021;
Published: 11 May 2021.
Edited by:
Yingwei Wu, Xi’an Jiaotong University, ChinaReviewed by:
Liangzhi Cao, Xi’an Jiaotong University, ChinaCopyright © 2021 Changbing, Yuanming, Yongjun, Kun and Peng. This is an open-access article distributed under the terms of the Creative Commons Attribution License (CC BY). The use, distribution or reproduction in other forums is permitted, provided the original author(s) and the copyright owner(s) are credited and that the original publication in this journal is cited, in accordance with accepted academic practice. No use, distribution or reproduction is permitted which does not comply with these terms.
*Correspondence: Jiao Yongjun, c21pbGVzdW4wMDFAMTI2LmNvbQ==
Disclaimer: All claims expressed in this article are solely those of the authors and do not necessarily represent those of their affiliated organizations, or those of the publisher, the editors and the reviewers. Any product that may be evaluated in this article or claim that may be made by its manufacturer is not guaranteed or endorsed by the publisher.
Research integrity at Frontiers
Learn more about the work of our research integrity team to safeguard the quality of each article we publish.