
95% of researchers rate our articles as excellent or good
Learn more about the work of our research integrity team to safeguard the quality of each article we publish.
Find out more
ORIGINAL RESEARCH article
Front. Energy Res. , 16 April 2021
Sec. Bioenergy and Biofuels
Volume 9 - 2021 | https://doi.org/10.3389/fenrg.2021.656165
This article is part of the Research Topic Nanocatalysts in Biofuel Process Optimization View all 13 articles
 Tianbiao He1
 Muhammad Abdul Qyyum2*
 Zhongming Zhou1Ashfaq Ahmad3
 Mohammad Rehan4
 Abdul-Sattar Nizami5Moonyong Lee2*
Biomethane is regarded as a promising renewable energy source, with great potential to satisfy the growth of energy demands and to reduce greenhouse gas emissions. Liquefaction is a suitable approach for long distances and overseas transportation of biomethane; however, it is energy-intensive due to its cryogenic working condition. The major challenge is to design a high-energy efficiency liquefaction process with simple operation and configuration. A single mixed refrigerant biomethane liquefaction process adopting the cryogenic liquid turbine for small-scale production has been proposed in this study to address this issue. The optimal design corresponding to minimal energy consumption was obtained through the black-hole-based optimization algorithm. The effect of the minimum internal temperature approach (MITA) in the main cryogenic heat exchanger on the biomethane liquefaction process performance was investigated. The study results indicated that the specific energy consumption of modified case 2 with MITA of 2°C was 0.3228 kWh/kg with 21.01% reduction compared to the published base case. When the MITA decreased to 1°C, the specific power of modified case 1 reduced to 0.3162 kWh/kg, which was 24.96% lower than the base case. In terms of exergy analysis, the total exergy destruction of the modified cases 1, 2, and 3 was 31.28%, 22.27%, and 17.51% lower than the base case, respectively. This study’s findings suggested that introducing the cryogenic liquid turbine to the single mixed refrigerant-based biomethane liquefaction process could reduce the specific energy consumption and total exergy destruction significantly. Therefore, this study could provide a viable path for designing and improving the small-scale biomethane liquefaction process.
One of the world’s biggest challenges is producing green energy to meet ever-increasing energy demands with minimum environmental damage. Presently, over 80% of global energy demands are fulfilled by fossil fuels (ExxonMobil, 2019), which contribute to most greenhouse gas emissions, thereby leading to global warming and climate change. Therefore, it is imperative to shift toward sustainable energy production systems for mitigating climate change.
Biogas, generated from waste organic materials and sewage by anaerobic digestion process, is a renewable energy source that can be accessed in most regions of the world (Sun et al., 2015). It contains 53–70% of CH4 and 30–47% of CO2, depending on the organic matter used to generate biogas (Pellegrini et al., 2018). As reported by the International Energy Agency, the demand for direct use of biogas in advanced and developing economies in 2018 was around 20.6 and 13.1 million tons of oil equivalent (Mtoe), respectively (International Energy Agency, 2019). Biogas can be used directly as a fuel for space heating (Bauer et al., 2013), power generation, and vehicles (Arteconi et al., 2016). However, upgrading is required to remove CO2 in the biogas to convert it into biomethane (BM), with higher-energy density (Hashemi et al., 2019). BM is a promising eco-friendly renewable energy source with 95–97% of CH4 as its key component (Yousef et al., 2019).
There are two transportation methods for BM. One is to pressurize the BM to the pipeline pressure and inject it into the natural gas pipeline as a supplementary gas (Ullah Khan et al., 2017). The other is to cool down the BM gas to −162°C at 1 atm to convert it into a liquid state known as liquefied biomethane (LBM) (Budzianowski and Brodacka, 2017). LBM is the best option to recover the remote biomethane resource where the pipeline network is not available. However, LBM is more energy-intensive than liquefied natural gas (LNG) for its near-ambient pressure (Rehman et al., 2020). LNG’s theoretical power requirement reduces with the increase of natural gas pressure before entering the liquefaction process. Thus, LBM needs to be pressurized to 4–5 MPa to diminish the liquefaction process’ power requirement. Due to the small capacity and decentralized location of the biomethane production (Fan et al., 2008), small-scale biomethane liquefaction technologies are the most suitable option to recover these sources with a low capital cost and flexible operation (Baccioli et al., 2018). The conventional NG liquefaction processes, namely, cascade liquefaction process (Lee et al., 2014; Mehrpooya et al., 2016), mixed refrigerant liquefaction process (He et al., 2020b; Qyyum et al., 2020b), and expander-based liquefaction process (Lin et al., 2017; He et al., 2019), can be adapted to produce LBM. However, the cascade liquefaction process and most of the mixed refrigerant liquefaction processes are designed for the large-scale LNG plants with a complex configuration, making them unsuitable for small-scale LBM production. Thus, there is a need to design and propose suitable and energy-efficiency liquefaction processes for LBM.
A considerable amount of literature has been published on the liquefaction of BM. Recently, Qyyum et al. (2020a) presented a comprehensive assessment of possible BM liquefaction technologies. They suggested that nitrogen expansion and single mixed refrigerant (SMR) liquefaction processes might be potential candidates. Nitrogen expansion liquefaction processes are considered suitable processes for small-scale LNG and LBM production plants because of their low capital cost and ease to start up and shut down. Hashemi et al. (2019) adopted cryogenic upgrading and chemical absorption upgrading integrated with a single-stage nitrogen-expander liquefaction process to produce LBM. The energy analysis implied that the proposed liquefaction process accounted for the most power consumption, and there existed space for energy performance improvement. Baccioli et al. (2018) compared conventional and cryogenic biogas upgrading processes integrated with the nitrogen expansion liquefaction process to produce LBM. The cryogenic biogas upgrading process integrated with the nitrogen expansion liquefaction process exhibited 1.45 kWh/kg of LBM. Haider et al. (2019) proposed a nitrogen-methane expansion biomethane liquefaction process integrating ionic liquid biogas upgrading resulting in 11.26 kWh/kmol of liquefaction energy consumption. Pasini et al. (2019) designed a dual nitrogen-expander liquefaction process for small-scale LBM production. The process of adopting radial turbines resulted in 0.75 kWh/kg of specific energy consumption. The nitrogen expansion liquefaction process for LBM is high-energy consumption making it unattractive to industrial LBM application.
Mixed refrigerant-based (MR) liquefaction processes are more energy-efficient than expansion-based processes for the better temperature curve match between the refrigerant and natural gas. Capra et al. (2019) analyzed five refrigeration cycles for the small-scale LBM production with a liquefaction capacity of 4.6 tons/d. The lowest energy consumption of 3061 kJ/kg LBM and cost of 6.3€/GJLHV were achieved by the MR process. Rehman et al. (2020) utilized the released cold energy from the liquid air energy storage system to reduce the refrigeration capacity of the MR-based BM liquefaction process. The findings indicated that the exergy efficiency could be increased by 42%, and the total annualized cost could be saved by 33.5%. He et al. (2019) compared the energetic and economic performances of parallel nitrogen expansion (PNEC) and modified single mixed refrigerant (MSMR) liquefaction processes for small-scale LNG production. The results indicated that the specific energy consumption and a total investment of MSMR were 33.49% and 26.88% lower than PNEC, respectively. The SMR could be enhanced by adopting a liquid hydraulic turbine to replace the throttling valve to achieve higher thermodynamic efficiency (Qyyum et al., 2018).
From the above literature review, the SMR liquefaction process (including modified processes) is preferred for the small-scale LNG and LBM production owing to its lower energy consumption and total investment, and compact design. It can manipulate the mixed refrigerant compositions, leading to a more flexible operation. Because of BM’s low pressure, it is required to compress it to a proper pressure to achieve a low specific energy consumption, which requires retrofitting the configuration of the liquefaction process. The liquefaction process modification followed by the optimization could benefit the energy saving. Moreover, previous studies mainly adopt the genetic algorithm (GA) and particle swarm optimization (PSO) algorithm to improve the energy performance of liquefaction processes. However, performing these algorithms depends on turning parameters. The improper tuning parameters may track algorithms in local optimal. Thus, algorithms without tuning parameters are more attractive to BM liquefaction process optimization. The black-hole-based optimization (BHBO) algorithm, a population-based method without tuning parameters, is a promising candidate for LBM liquefaction processes, which has not yet been employed in the open literature.
To the best of our knowledge, this is the first study of its kind to explore the black-hole-based optimization algorithm for the design optimization of the biomethane SMR liquefaction process. The process was modified by introducing cryogenic liquid turbine to replace the throttling valve with the benefit of reducing exergy loss and recovering mechanical power. Different minimum internal temperature differences (MITA) were studied to minimize the specific energy consumption of the process. Furthermore, the energy, exergy, and composite curve analysis were applied to reveal the future improvement potential and directions. The modified process optimized by the BHBO exhibits an impressive energy efficiency. This study gives an insight into the SMR-based LBM process design and optimization to minimize energy consumption to extend its potential application for small-scale LBM production. Thus, the proposed process associated with the black-hole-based optimization algorithm provides an energy-efficient method to recover and utilize biomethane, which could be beneficial to increase the percentage of renewable energies in the global energy market.
The black hole is such a mass-concentrated region in the space that it is impossible for objects falling into it to escape from it. Black-hole-based optimization (BHBO) is a new metaheuristic methodology derived from the phenomena of black hole. Black holes are so thick that nothing even the light can emit back from their inside. The spherical skull or the black hole’s periphery layer is named as the event horizon (Hatamlou, 2013; Black Hole, 2021). The objects that cross this horizon are swallowed by the black hole forever. The physical life cycle and interpretation of the black-hole algorithm is seen in Figure 1.
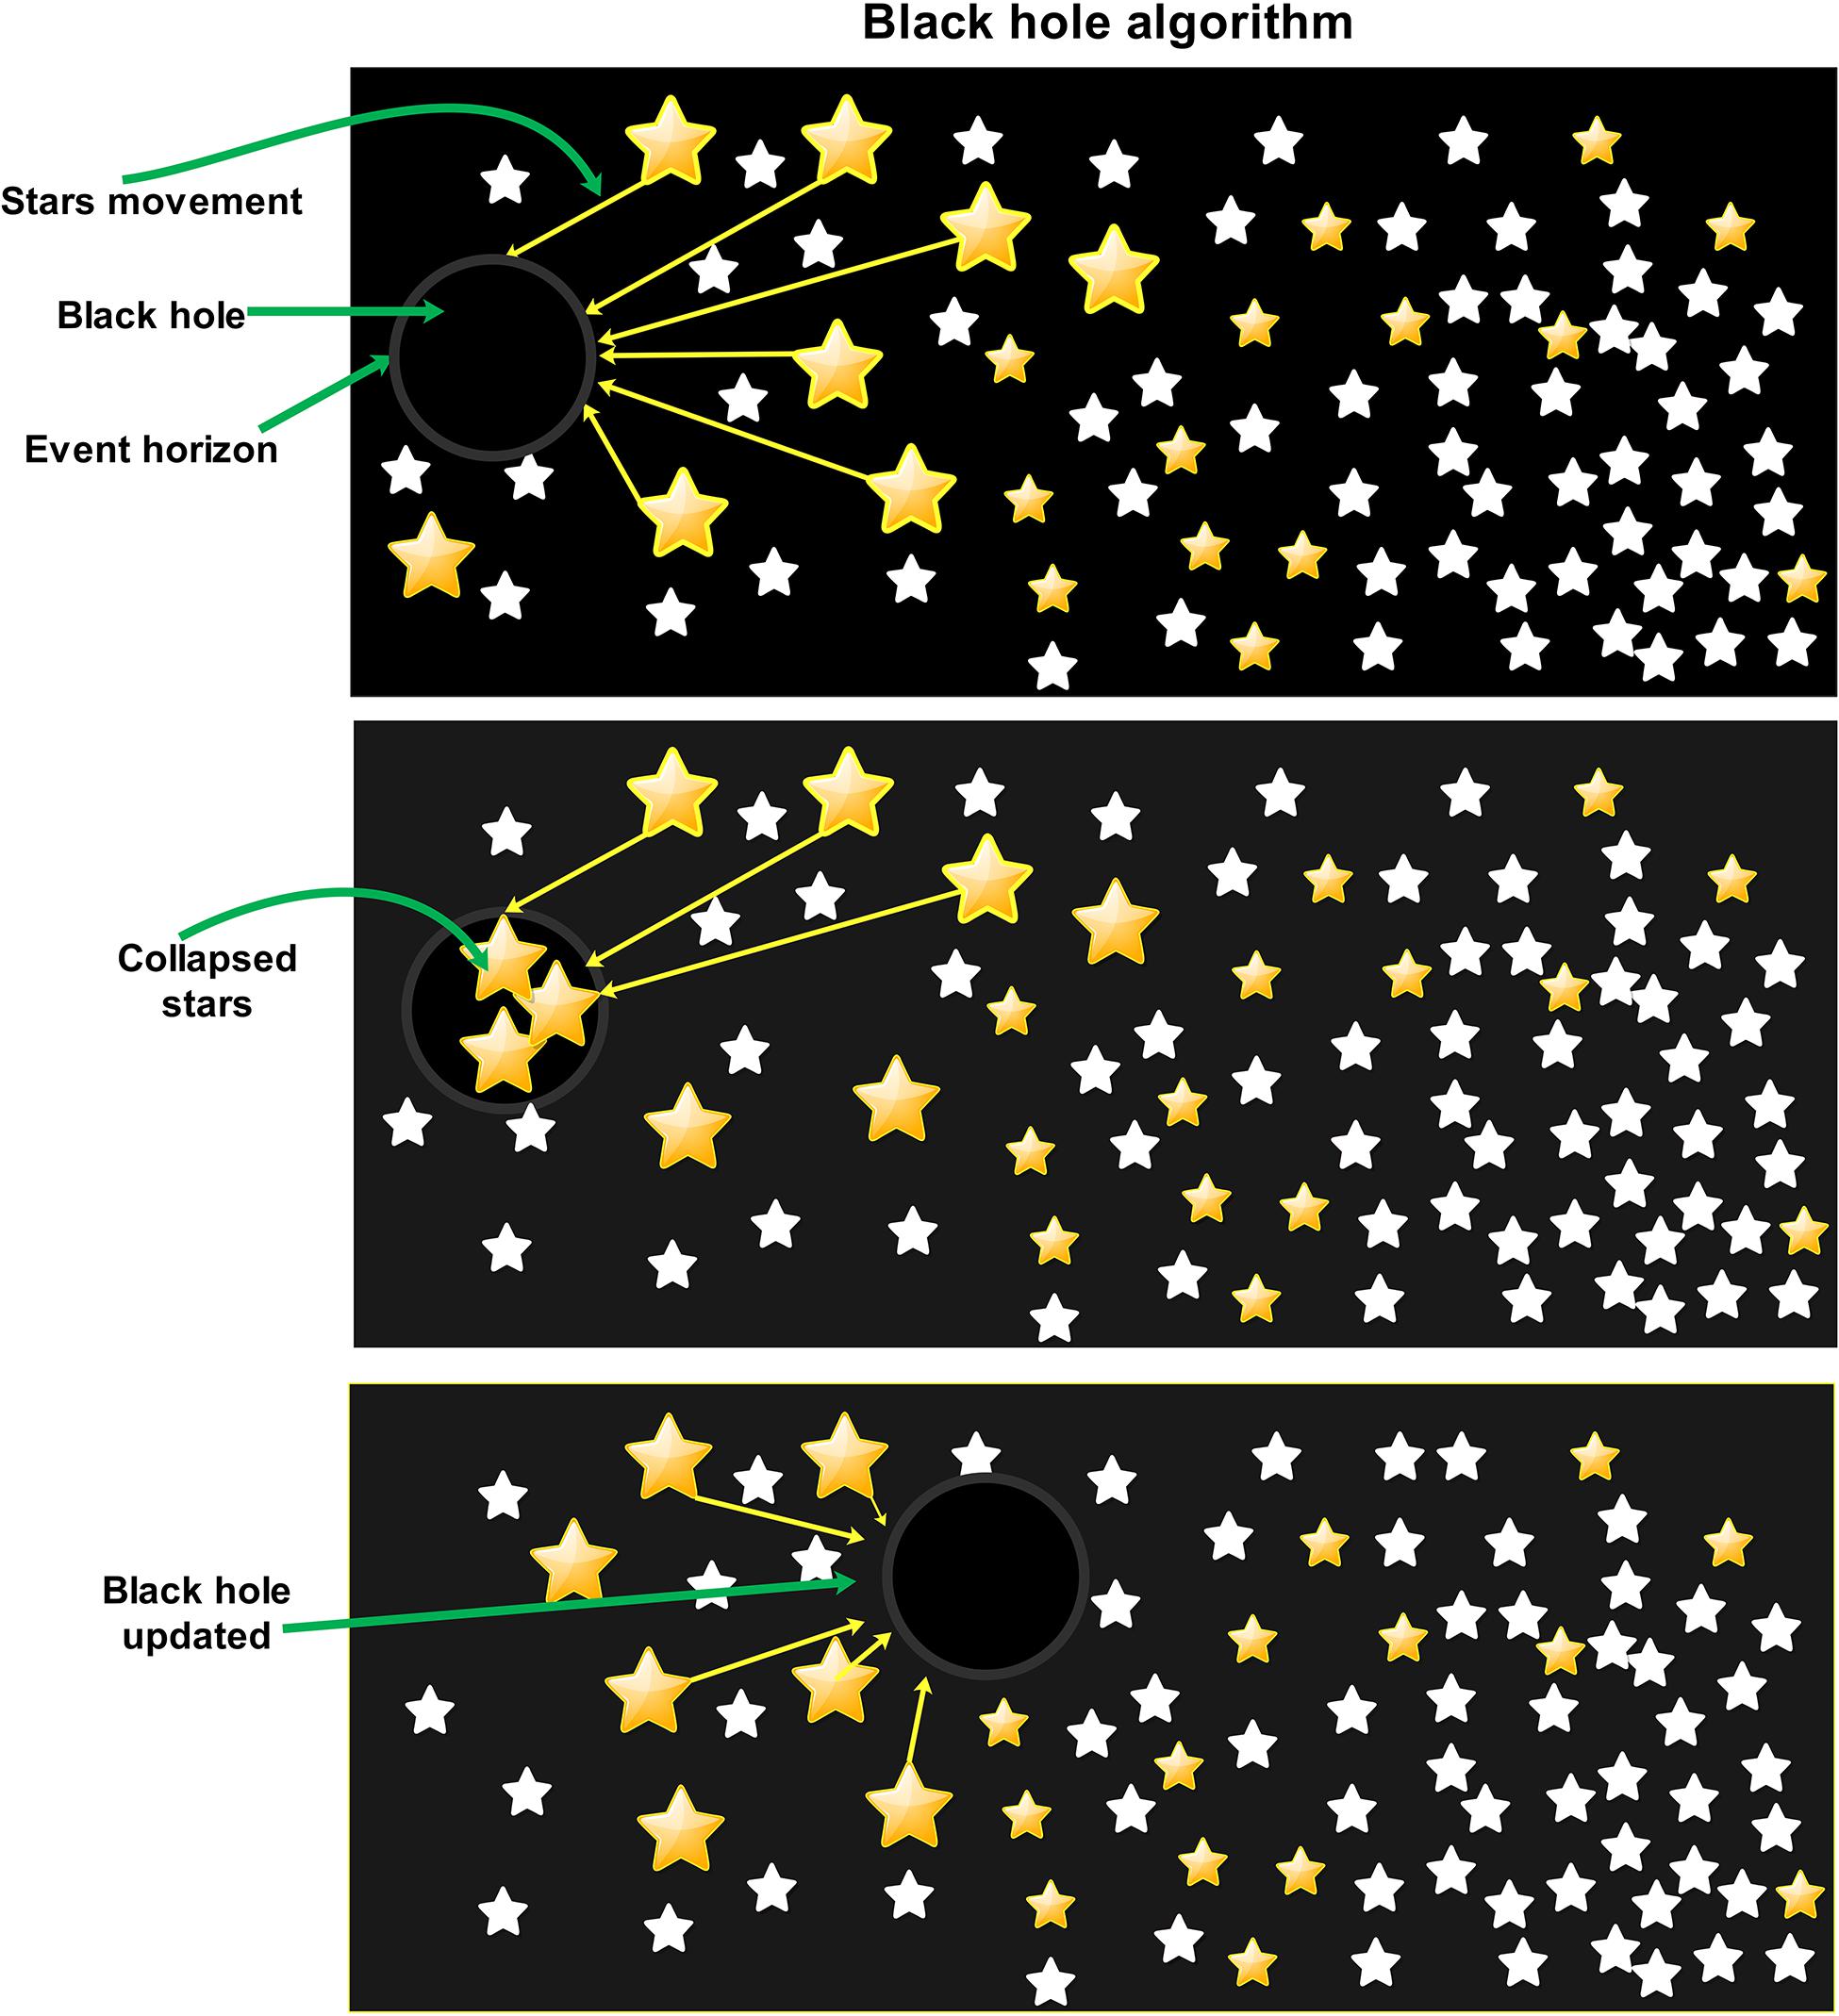
Figure 1. Physical life cycle of the black hole algorithm.
Black-hole-based optimization is a population-based method in which the optimal solution from the initial population of solutions is evolved by a procedure that is motivated by the black hole phenomenon. The evolution process is accomplished by transmuting the candidate solutions to the best candidate that is known as black hole. Other candidate solutions that fall within the black hole’s range are replaced by the candidate solutions newly created in the given search space. The working procedure of the BHBO algorithm can be well described in the forthcoming steps.
All variables may have different ranges (upper and lower bounds). These ranges of all variables are first normalized to new ranges from 0 to 1. The ranges of all variables can be normalized using Eq. (1).
Normalizing the variables’ bounds can improve the convergence speed of the BHBO algorithm.
A random population of candidate solutions called the stars is generated and placed in a search space of the problem of n dimensions. The value of the objective function against each star is calculated, and the star that has the best fitness value is designated as the black hole Xbh.
Star absorption is the process of moving stars toward the absorbing force of the black hole. Once the star population is generated and the black hole is assigned, the black hole starts absorbing its stars. Thus, all stars move toward the black hole. This movement/absorption of the stars can be formulated by Eq. (2).
where and are the locations of the ith star at iterations t+1 and t, respectively. Xbh is the location of the black hole (best fitness value), and Rand is the random number between 0 and 1. As the black hole has the best fitness value so it does not move, it just attracts others.
During stars’ movement toward the black hole, it is possible that a star (candidate solution) at its new position gets its fitness value better than the already assigned black hole. In such case, the black hole’s position is updated with this star, the algorithm continues its process with this updated black hole, and other stars start their movement toward this new/updated black hole.
During the stars’ movement, a star can cross the event horizon (spherical boundary of the black hole). The star that crosses the event horizon is sucked by the black hole which results in star death. In order to keep the number of stars (candidate solutions) constant, a new star is randomly generated at the place of the died star and randomly placed in the search space (Chen and Chang, 2010; Hatamlou, 2013). The next iteration starts on completing one movement of each star. The radius of the event horizon can be calculated as by Eq. (3).
where n is the number of candidates (stars), and fbh and fi are the fitness values of the black hole and ith star, respectively.
The above steps of the BHBO algorithm are repeated until the termination criteria. The algorithm could be terminated on two criteria. The first is the maximum number of iterations, and the second is the specific number of iterations during which the black hole does not change its position. In simple words, in the first case, BHBO will automatically terminate on completing the number of iterations defined by the user. In the second case, if the black hole’s current position does not change after a certain number of iterations, the BHBO may be terminated. However, a careful study is needed to set the stopping criteria because the algorithm may be stopped without reaching the global optimum. Conversely, unnecessary running of the algorithm may be avoided if the convergence is to be expected earlier. Based on the above description, the pseudocode of the BHBO algorithm is given in Algorithm 1.
1. Randomly generate stars population (Candidate solutions) Xi (i = [1, n]) in the search space of some function.
2. Set the number of iterations or other termination criteria
3. for each ith star, calculate the Fitness function 4. Designate the best Fitness value as the Black Hole; Xhb ← Optimal solution
4. while (Termination criteria not met) do
5. for each star Xi change its location as
6.
7. end for
8. Calculate the event horizon as:
9. for each star Xi calculate its distance from the black hole
10.
11. if Di < R
12. Collapse Xi
13. Xi ← new randomly generated star
14. end if
15. if Fitness value of Xi is better than that Xhb
16. Xi Black hole
17. end if
18. end for
19. Xbh = Best optimal solution
20. end while
21. end for
The base case of biomethane liquefaction by adopting the SMR liquefaction process is illustrated in Figure 2 (Haider et al., 2020). The upgraded biomethane (methane molar fraction over 99%) goes into the multi-stream cryogenic heat exchanger (CHX-1) and is cooled and liquefied by the low-pressure mixed refrigerant. The stream BM2 decreases to the LBM storage pressure in VLV-1 and reduces the temperature leading to obtaining of the LBM in the separator’s bottom with a liquefaction rate of 92%. The mixed refrigerant (MR) adopted in this paper consists of CH4, C2H6, C3H8, i-C5H12, and N2. The MR is pressurized by a four-stage compressor with intercooling. Subsequently, the high-pressure MR is cooled by the returning cold MR in CHX-1 and expanded in the throttling valve (VLV-2) to supply the cooling capacity for the biomethane and warm MR. Afterward, the superheated MR returns to the first-stage compressor’s inlet (K-1) to complete the refrigeration cycle. The temperature of the MR outlet from the intercoolers is 40°C.
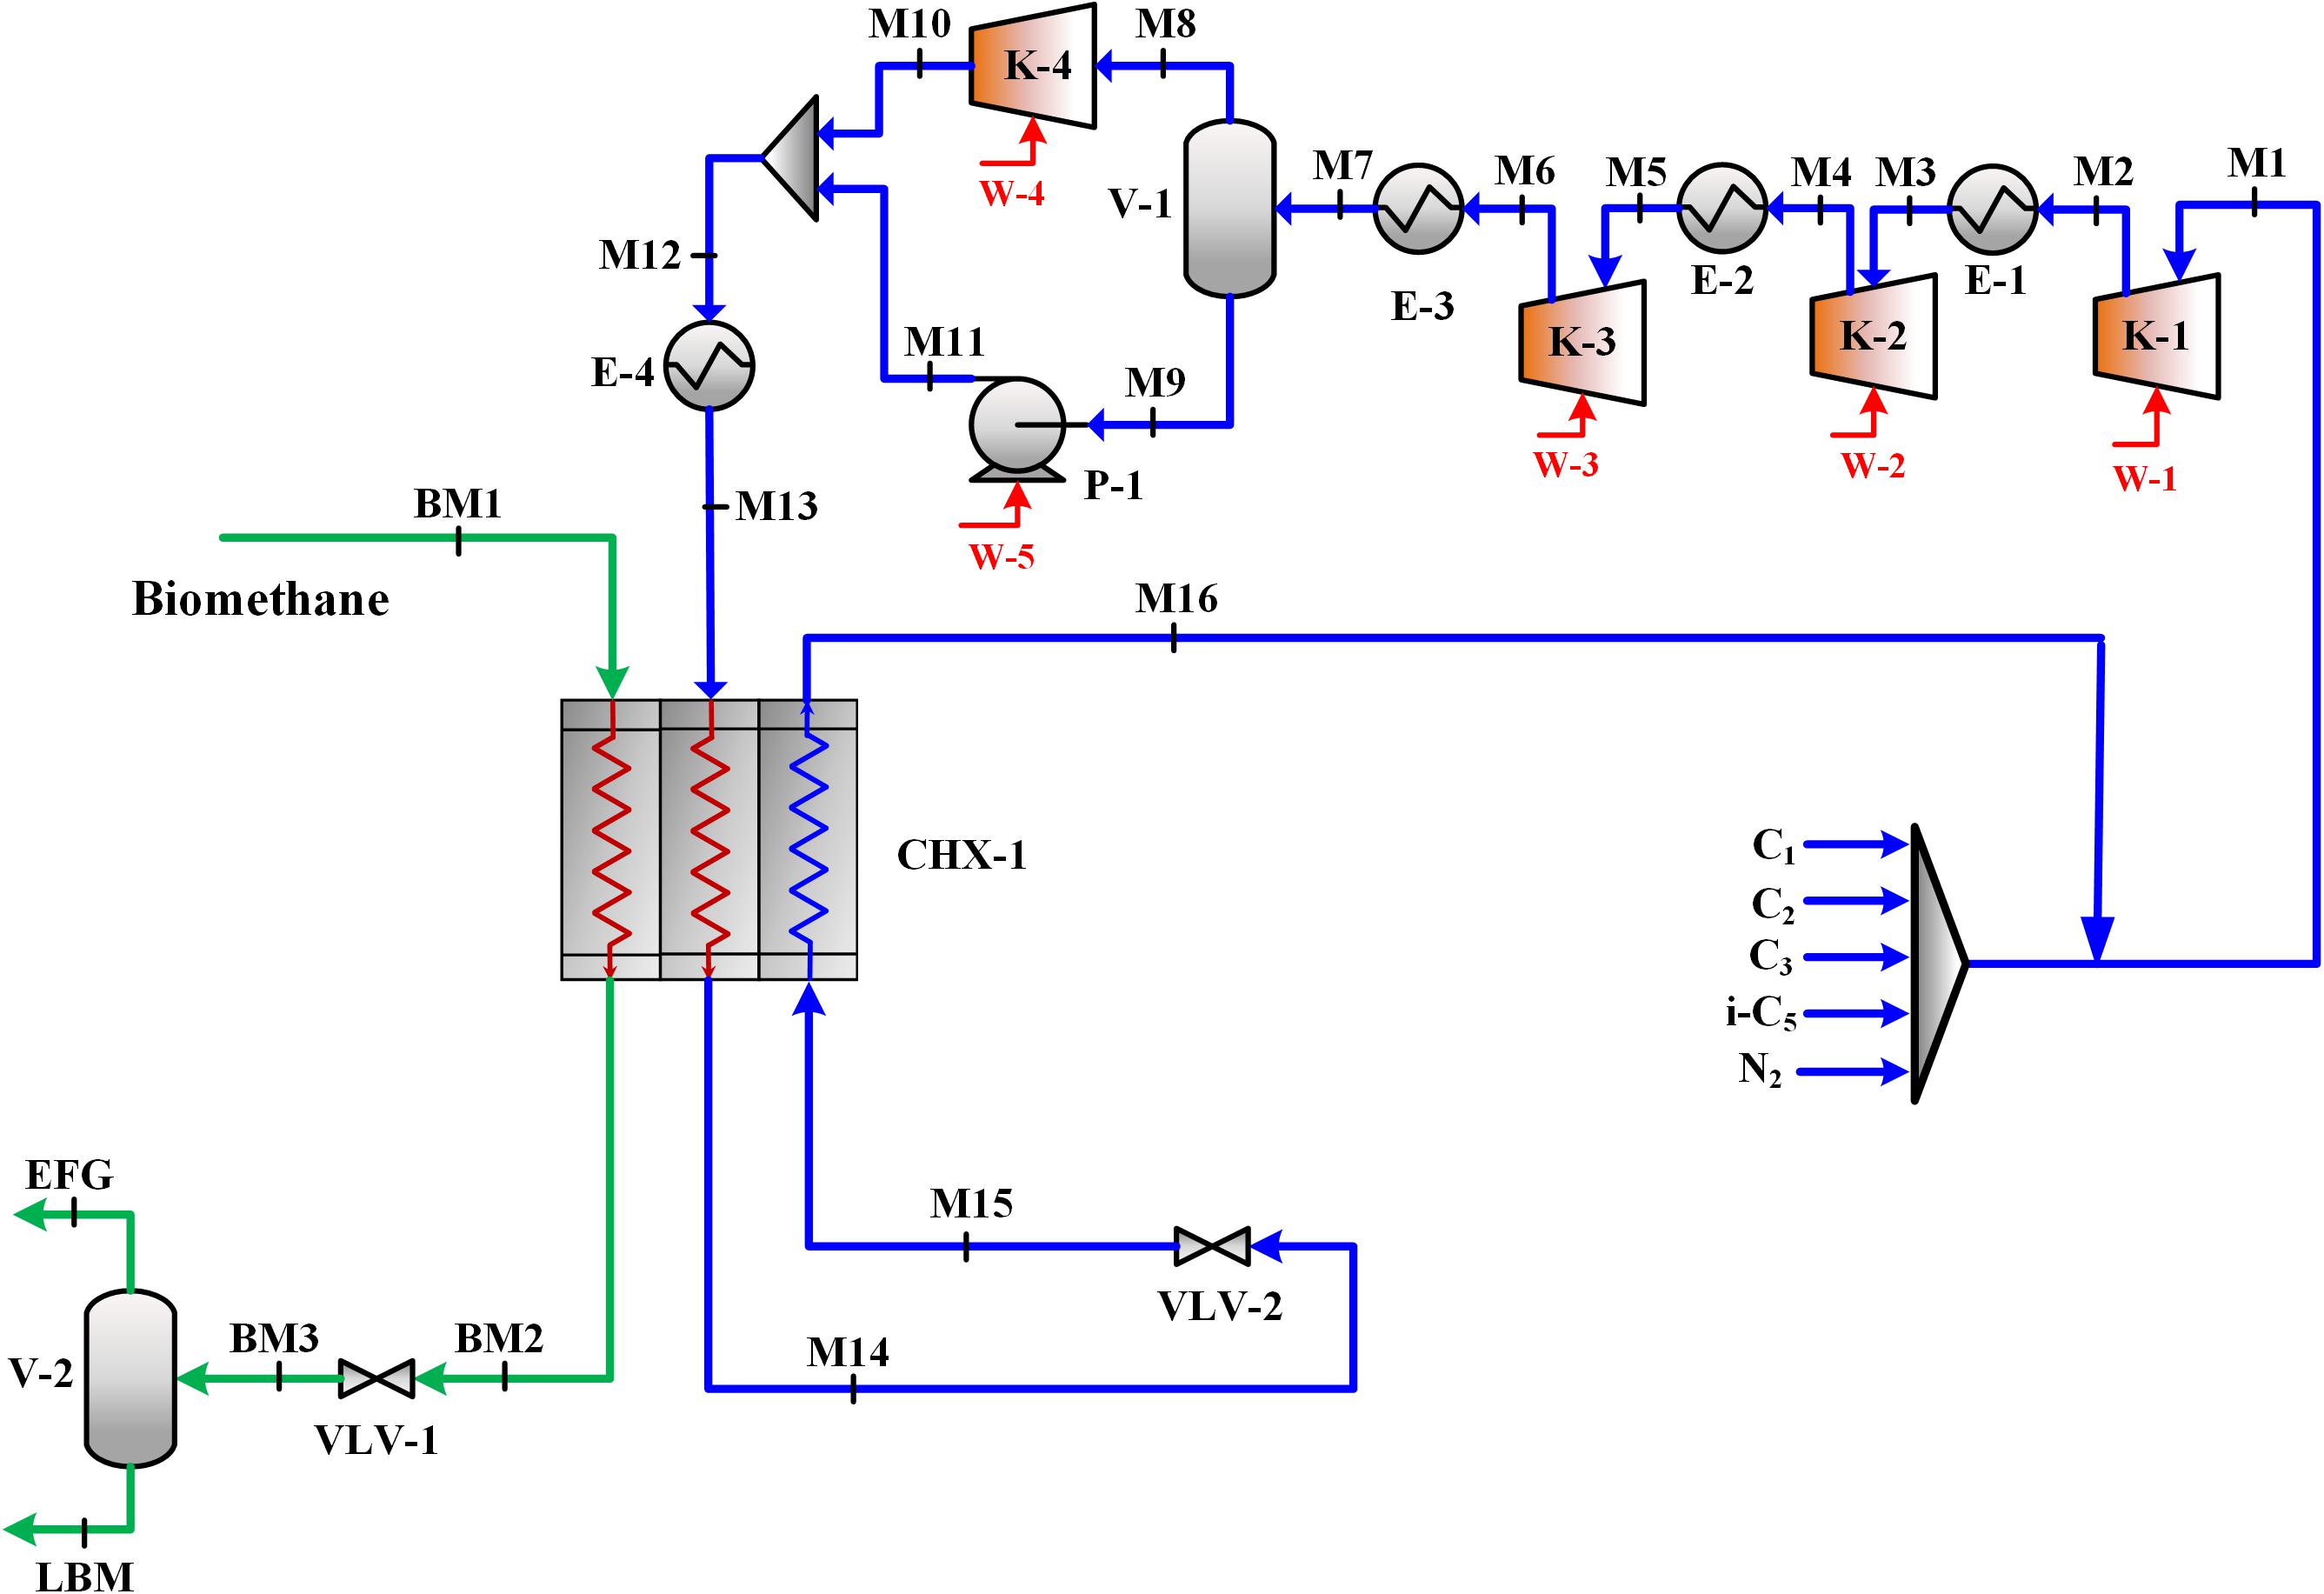
Figure 2. Base case flow sheet of biomethane liquefaction by adopting the SMR process (Haider et al., 2020).
To improve the thermodynamic performance of the base case, cryogenic liquid turbines are introduced to replace the throttling valves (VLV-1 and VLV-2), as shown in Figure 3. Through this modification, the isentropic expansion can generate a larger temperature difference with the same pressure ratio and provide extra power for the compression system. In the modified case of the biomethane liquefaction process, the cold energy of the end flash gas (EFG) is recovered in the main cryogenic heat exchanger, which also reduces the refrigeration requirement from the SMR cycle.
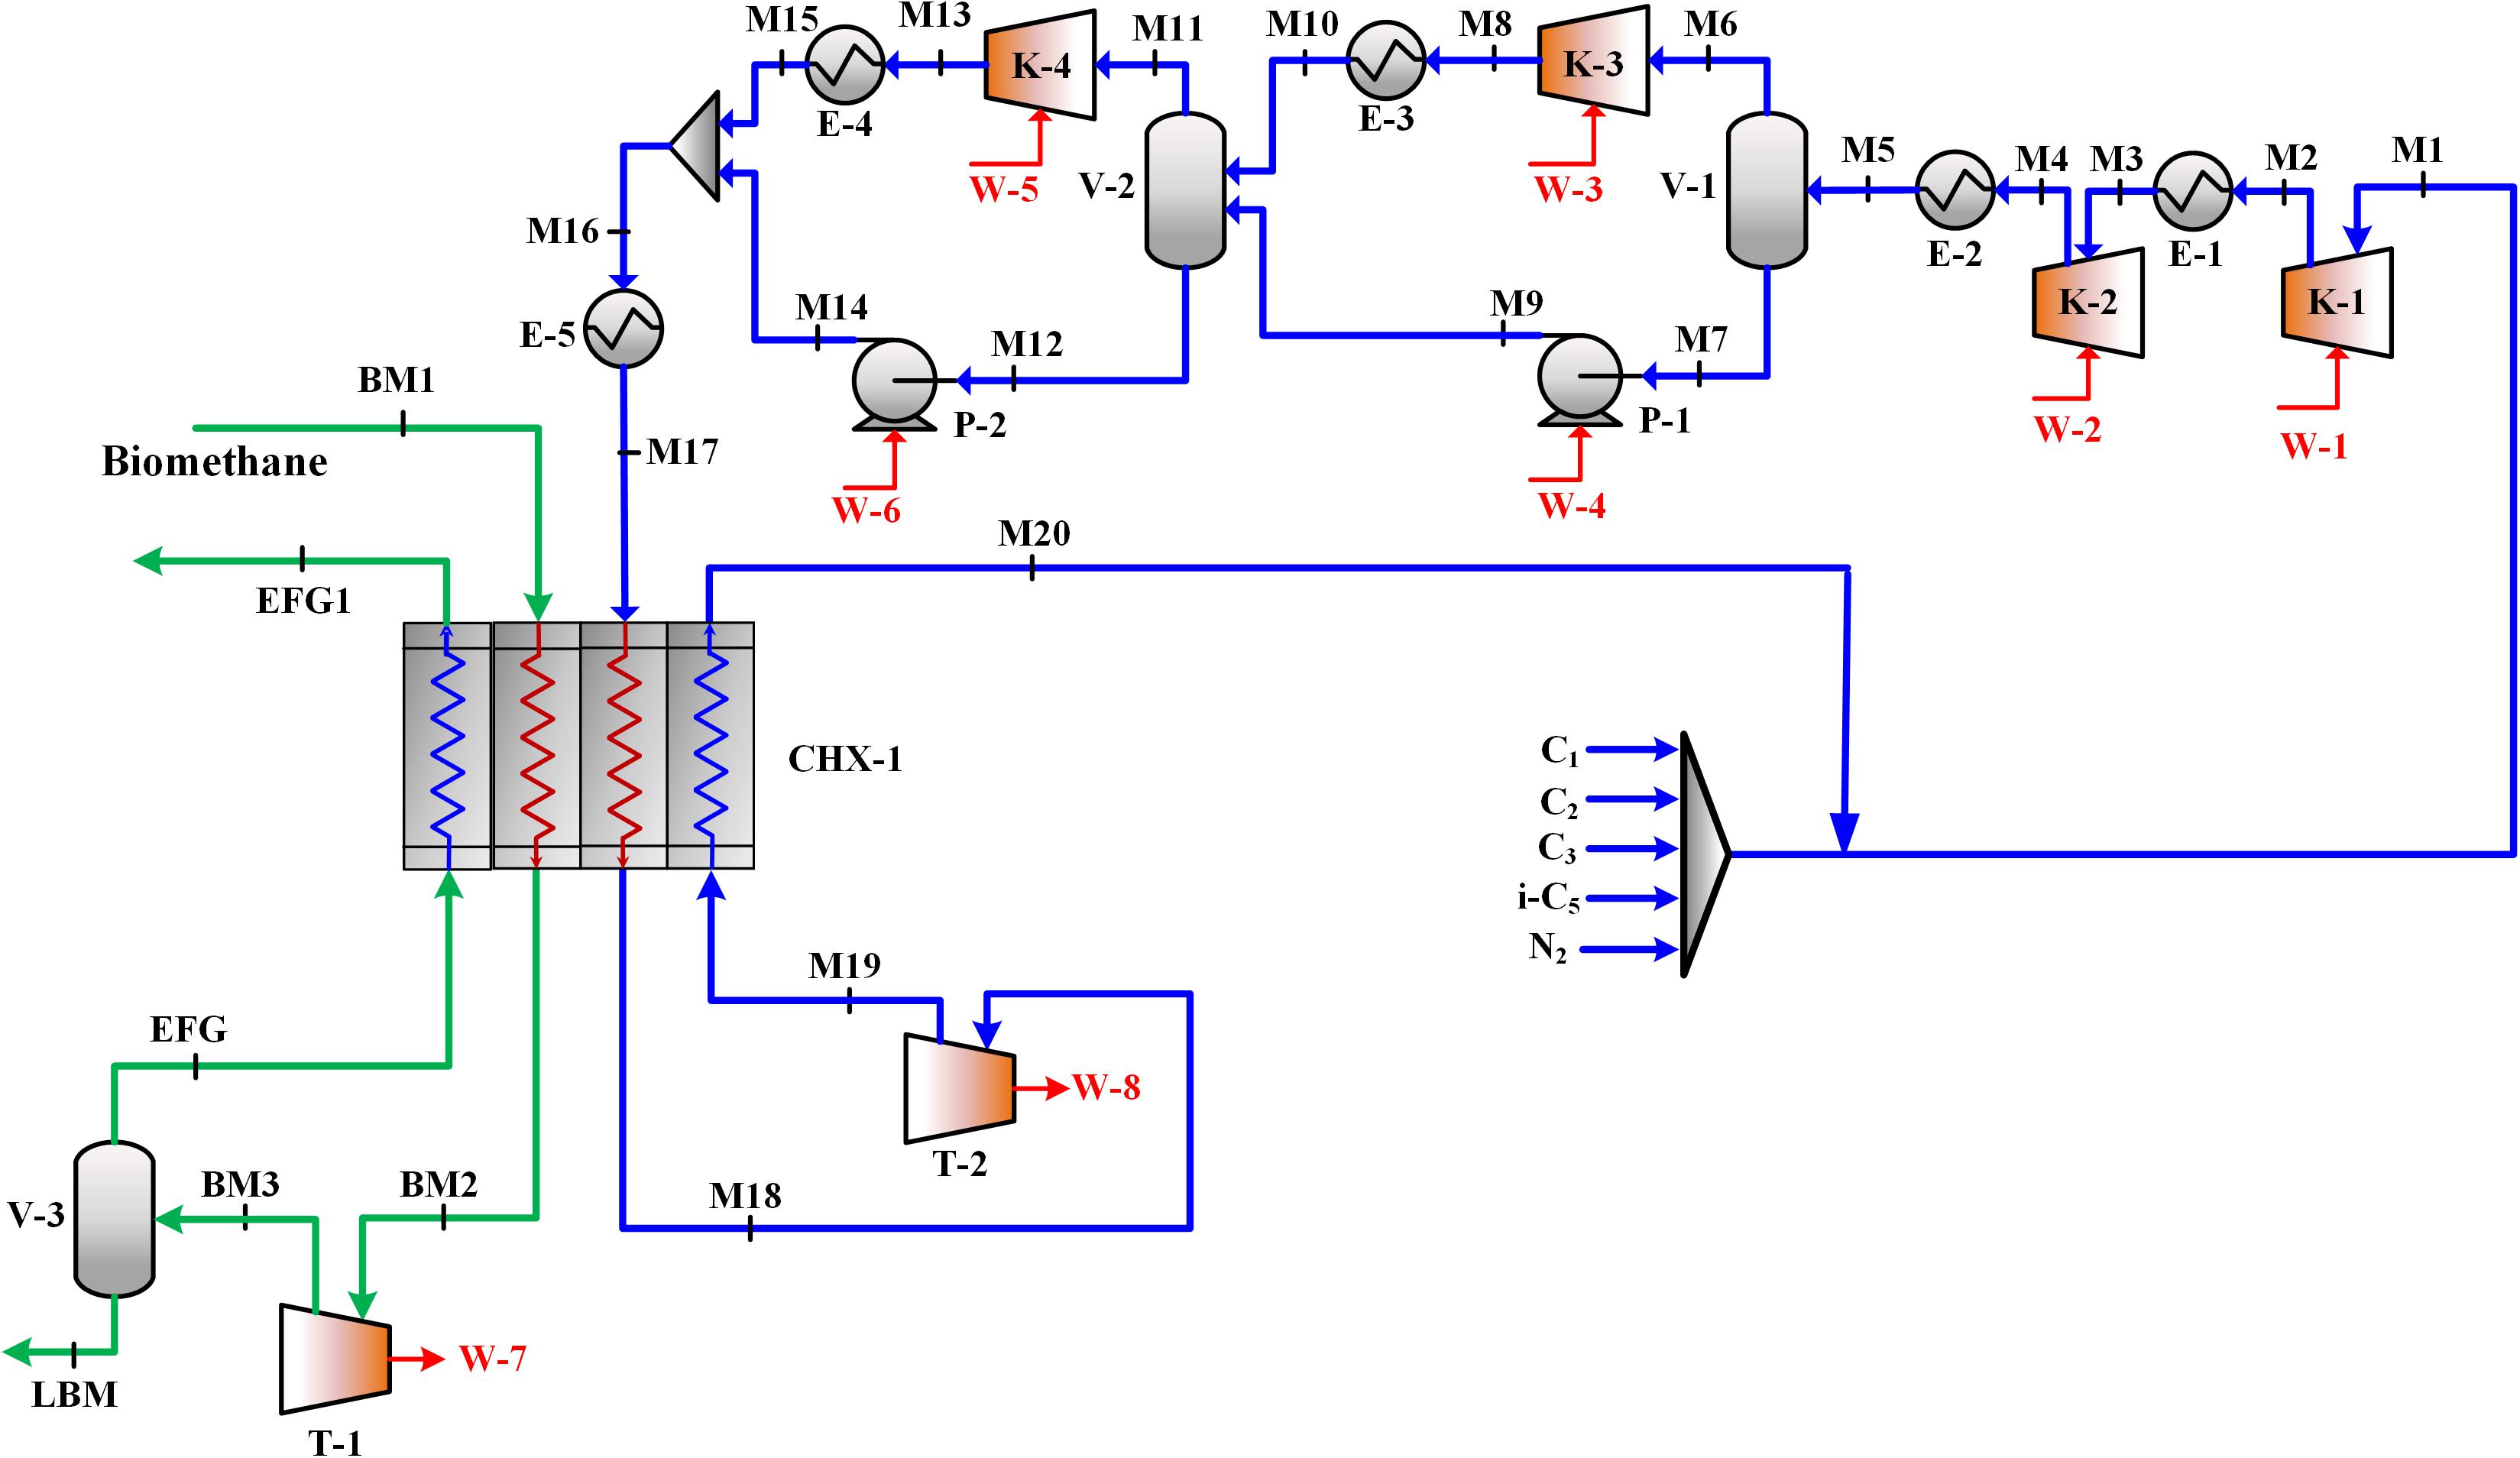
Figure 3. Modified biomethane liquefaction process.
The proposed biomethane liquefaction processes are modeled in Aspen HYSYS V10 by choosing the Peng–Robinson equation of state (Peng and Robinson, 1976) for the thermodynamic properties’ calculation. It is assumed that the deep eutectic solvent-based process upgrades the biomethane, and its conditions are shown in Table 1.
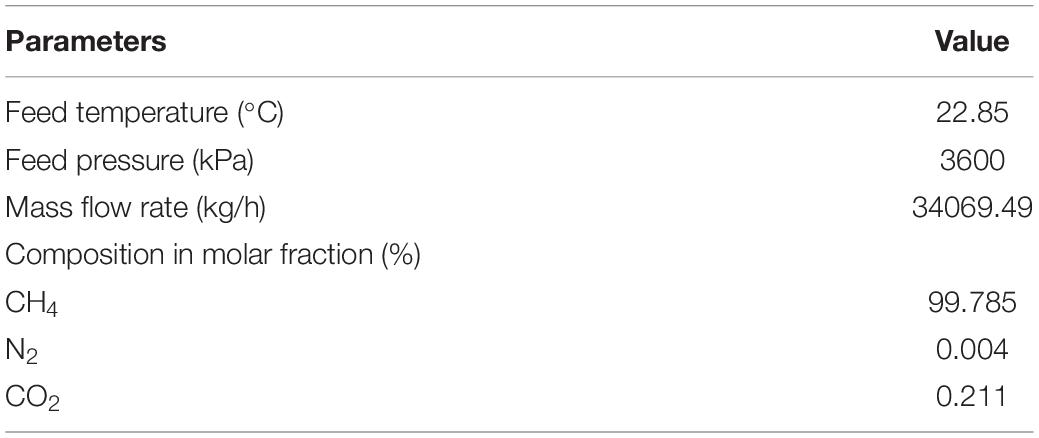
Table 1. Conditions of the upgraded biomethane (Haider et al., 2020).
To simplify the process simulation, several assumptions are made as follows:
(1) The process is in steady state.
(2) The heat losses from the equipment to the ambient are neglected.
(3) The adiabatic efficiency of the cryogenic liquid turbine, pump, and compressor is 90%, 75%, and 75% (Qyyum et al., 2018), respectively.
(4) The pressure drop of the warm stream and cold stream in the main cryogenic heat exchanger is 100 kPa (Haider et al., 2020).
(5) The pressure drop of the compressor intercooler is 25 kPa.
(6) The produced LBM is stored with a pressure of 120.9 kPa.
In this study, optimization aims to find the optimal design of the proposed modified SMR process for LBM production corresponding to minimal specific energy consumption, i.e., objective function. Usually, liquefaction processes, especially mixed refrigerant-based, are highly non-linear and complex, mainly due to the number of exceptional interactions among the key design variables, constraints, and constrained objectives. Therefore, even minor variations in the design or decision variables may cause an unfeasible process, which ultimately reduces the process’ overall competitiveness. In this context, it is meaningful and mandatory to pinpoint the major influencing design variables and constraints allied with the design of the liquefaction process in order to get the desired benefits through rigorous optimization. The refrigerant flow rates, refrigerant condensation pressure, and evaporation pressure were chosen as the key design variables. The minimum internal temperature approach (MITA) that signifies the driving force of the heat transfer between the hot and cold streams inside the main cryogenic heat exchanger was taken as a constraint with a specified value of 1∼3.0°C. All key design variables (with their lower and upper bounds), constraint, and objective function are listed in Table 2.
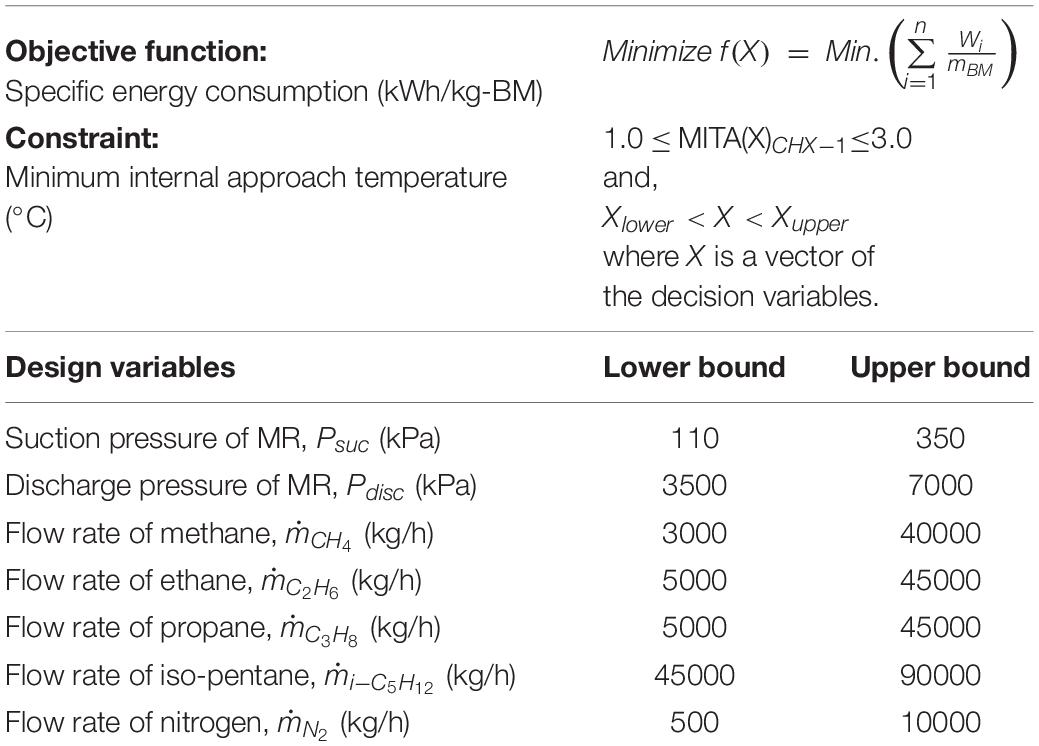
Table 2. Key decision variables of the SMR process and their upper and lower bounds.
The constraint of the MITA value was incorporated by introducing the exterior penalty function into the objective function. The objective function after incorporating the penalty function is given in Eq. (4).
where X is a vector of the decision variables, as given in Table 2, i.e.,
To find the optimal design variables of the proposed biomethane liquefaction process, the BHBO approach was customized considering the following steps:
Step 1: For the objective function given in Eq. (4), some sets (called stars) of random values from within the upper and lower bounds of each design variable are generated. These sets of random values of design variables are fed to the Aspen HYSYS environment that has the LBM process to be optimized. The SMR process returns the values of compressor energy and the MITA against each star (set of design variables), which is further used in calculating the fitness value by using the objective function given in Eq. (4). The star (set) that gives the best fitness value is designated as the black hole Xbh. The values of design variables of the black hole star may be treated as the location coordinates of the black hole. A sample population of five stars is given in Table 3.
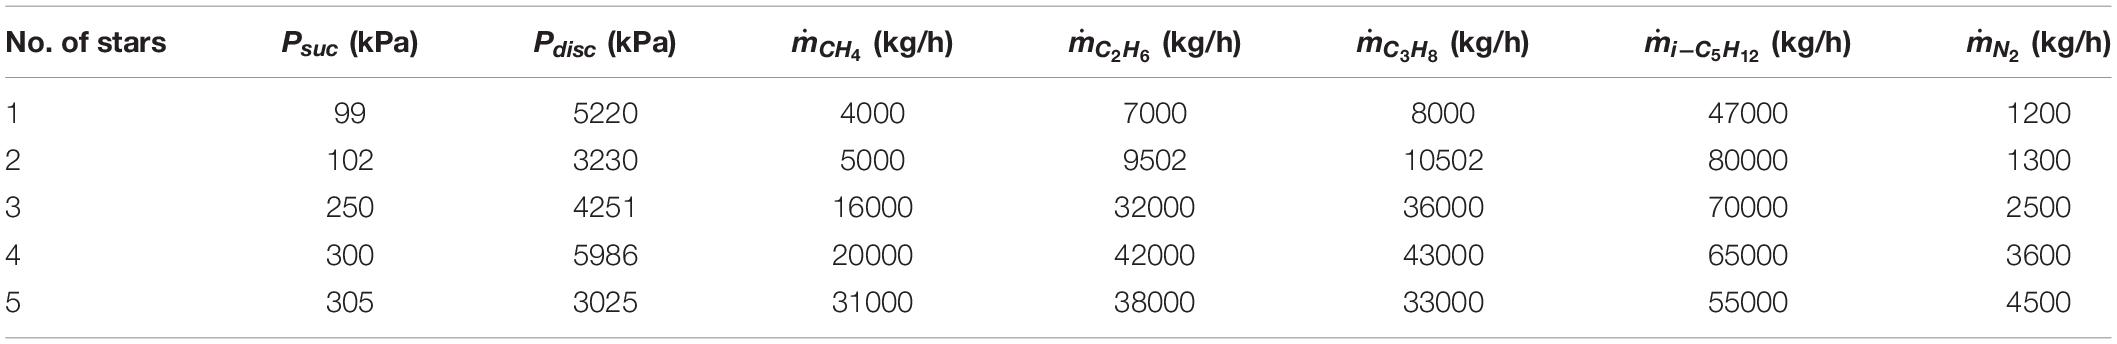
Table 3. A sample of initial population of stars.
Step 2: Once a star (a set of design variables) is fixed as a black hole, other stars start moving toward the black hole. The location coordinates/movement of stars is formulated by using Eq. (2). While moving toward the black hole, a star at its new position (new set of design variables) may have its fitness value better than that of the black hole. In such case, black hole’s position is updated with this star, the algorithm continues with this new black hole, and other stars start moving [changing location coordinates using Eq. (2)] toward this new black hole.
Step 3: The radius of the event horizon is calculated by Eq. (3). If the fitness value of any star is less than the predefined value of the event horizon, that star would be eliminated. The reason for eliminating this star is that the set of design variables against this star may lead to being stuck in the local minimum if existed. A new star (set of design variables) is randomly generated at the place of the eliminated/swallowed star to keep the number of candidate solutions constant. When each star completes its one movement (i.e., design variables of each set are updated once), the next iteration starts.
Step 4: Maximum number of iterations was set as the termination criteria. BHBO will automatically be terminated on completing the number of iterations.
Exergy is the maximum power generated by a system when it is transferred from the current state to the environmental state (Moran et al., 2014). If the potential and kinetic exergies are ignored, the exergy of a material stream can be defined as (He et al., 2020a):
where E is the exergy; is the mass flow rate; and eph and ech are the physical and chemical exergies, respectively, which are described in Eqs. (6) and (7) (Mousavi and Mehrpooya, 2020):
where h and s are the specific enthalpy and specific entropy, respectively. xi refers to the molar composition of the ith component. R is the gas constant. The subscript 0 refers to the environmental state, which are 101.325 kPa and 25°C.
The exergy destruction is induced by the thermodynamic irreversibility of the process. Thus, it is critical to obtain the exergy destruction distribution in the LBM process. Principally, the exergy destruction is defined in Eq. (8) when exergy loss is neglected:
The exergy efficiency of the LBM process is defined as the ratio of the theoretical minimum power to the actual total power consumption, as shown in Eq. (9).
where ηex is the exergy efficiency, is the total power consumption, and is the theoretical minimum power, which can be described as (Qyyum et al., 2020b):
In this work, the SMR process for BM liquefaction was designed and evaluated for different MITA values corresponding to energy and exergy efficiency. For the base case, the MITA inside the main cryogenic heat exchanger was 2°C. However, the modified case was optimized for MITA of 1, 2, and 3°C, respectively.
Specific energy consumption (SEC) is the principle indicator in assessing the energy performance of the biomethane liquefaction process. The decision parameters along with the power consumption of the base case and modified cases with different MITA optimized by BHBO are shown in Table 4.
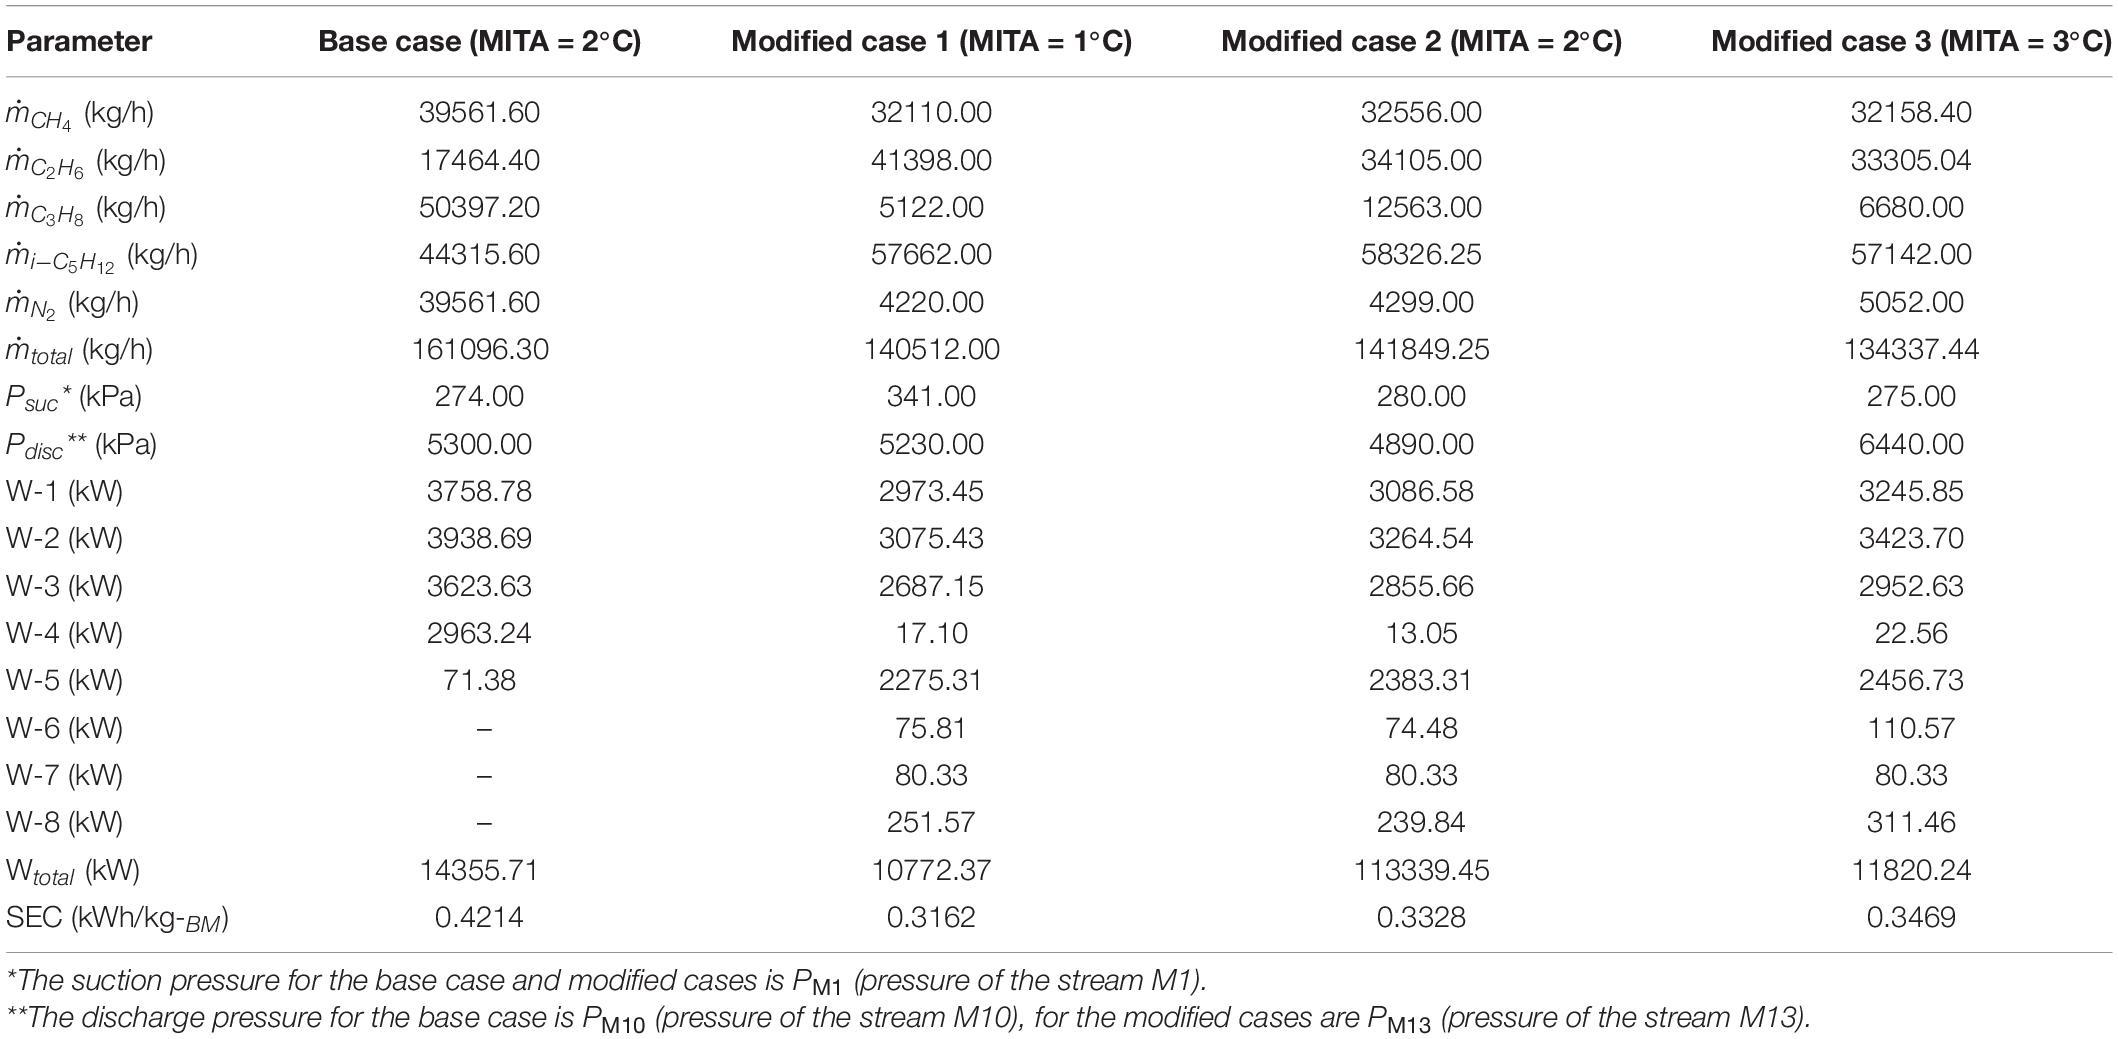
Table 4. The decision parameters along with the power consumption after optimization.
Firstly, modified case 2 and base case were compared since they had the same MITA in CHX-1. The total MR flow rate was 141849 kg/h in modified case 2, which was 11.95% lower than the base case. The optimal molar fractions of the MR in the four cases are illustrated in Figure 4. The molar fractions of methane, propane, and nitrogen decreased, while ethane and i-pentane increased in modified case 2. Moreover, the pressure ratio was 17.46 in modified case 2, while it was 19.34 in the base case leading to a 9.71% reduction. These two factors resulted in a 21.01% decrement of the SEC in modified case 2. The cryogenic liquid turbine T-1 and T-2 generated 80.33 and 239.84 kW of power, respectively, thereby saving the total power consumption of modified case 2. It should be noted that, regardless of the power recovery by the cryogenic liquid turbine, the SEC of modified case 2 was 0.3422 kWh/kg of LBM, which was still 18.78% lower than the base case. Thus, adopting the BHBO to optimize modified case 2 brought a significant power saving for the BM liquefaction process.
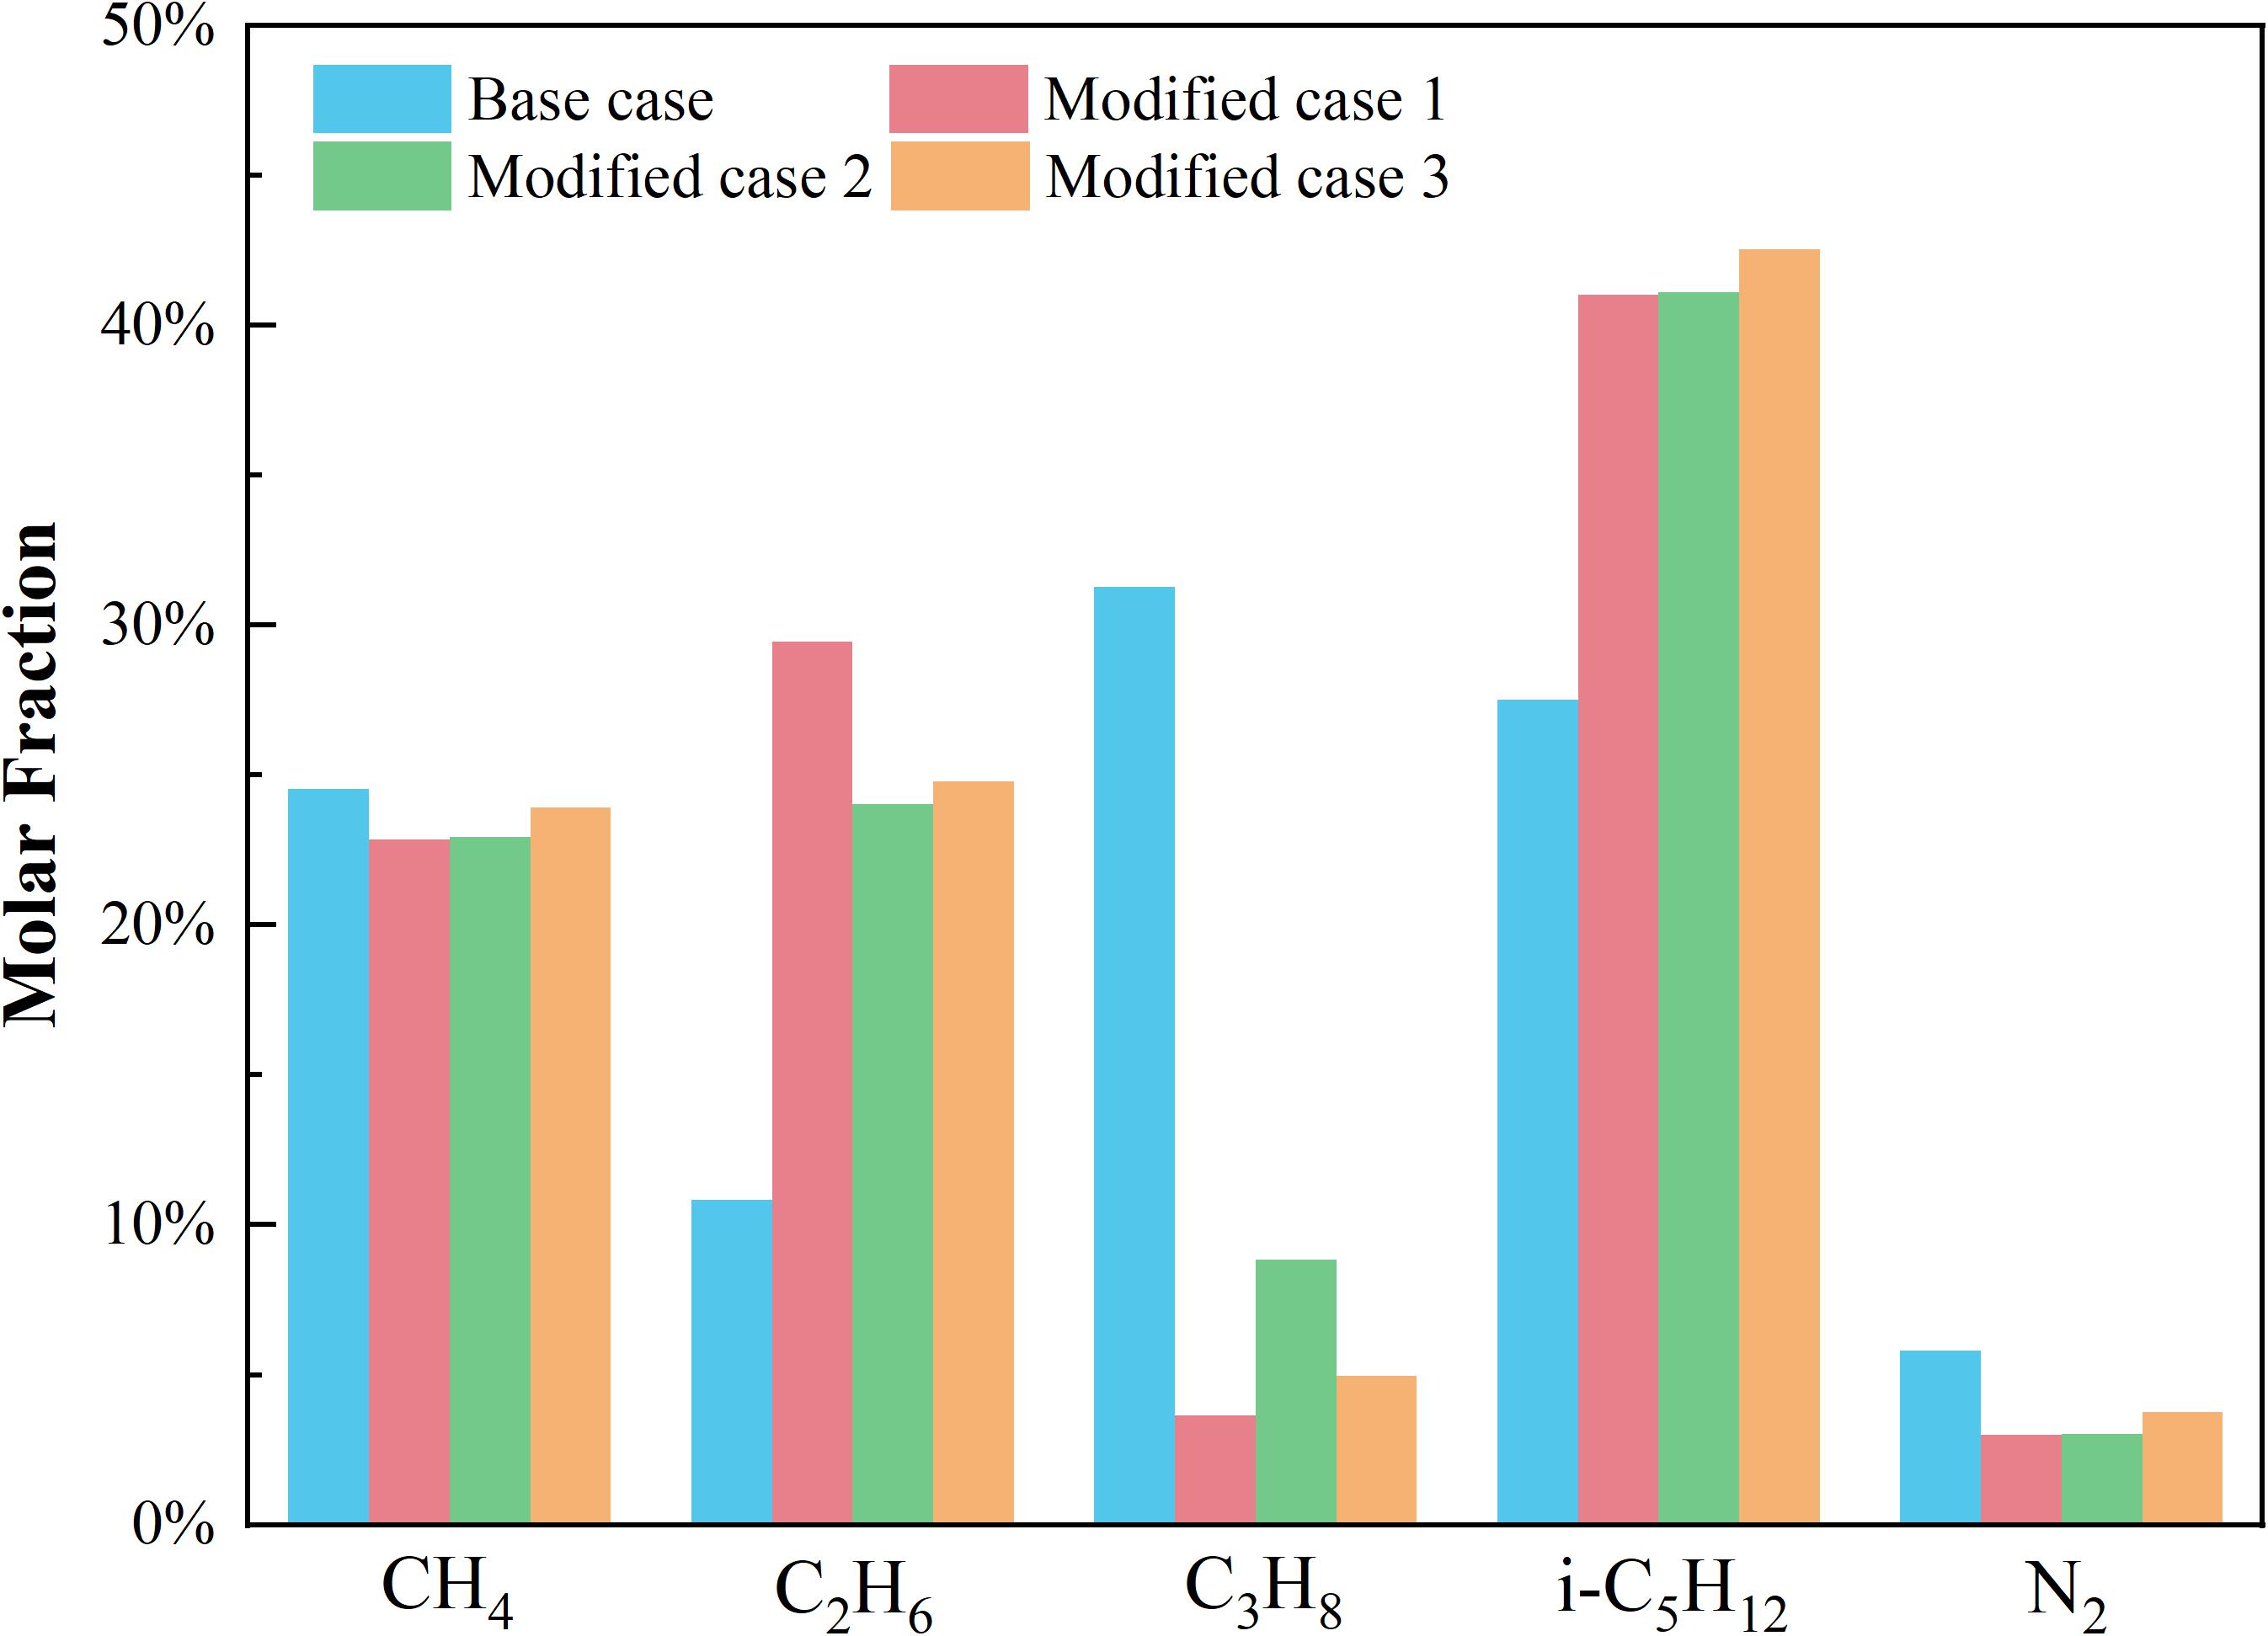
Figure 4. The optimal MR molar fractions of four cases.
The effect of MITA on the SEC of the biomethane liquefaction process was investigated. With the increase of the MITA in CHX-1, the total power consumption and SEC increased. This is because the difference between the hot and cold composite curves in CHX-1 enlarged with the increase of the MITA which required a larger refrigeration capacity to liquefy the same amount of biomethane. The SEC of the modified cases 1, 2, and 3 was 0.3162, 0.3328, and 0.3469 kWh/kg, respectively. In addition, the power generated by T-2 also rose as the MITA increased. The reason was that a larger MITA required a lower evaporation temperature of the stream M18, which means a lower discharge pressure of the T-2, thereby generating a larger power output.
The temperature-heat flow composite curves (THCC) in CHX-1 were the key indicator to reflecting the energy performance of the liquefaction process, as seen in Figure 5. The space between the hot and cold composite curves was proportional to the exergy destruction in CHX-1. Figures 5A,C show that the heat flow in modified case 2 was 29523 kW, which was 10.29% lower than the base case. This result may be explained because the appropriate MR molar fraction and cryogenic liquid turbine in modified case 2 reduced the required refrigeration capacity for LBM. When compared to Figures 5B–D, it was apparent that the cold composition curve matched the hot composite curve closer with the decrease of the MITA. In addition, the vertical line below −150°C in Figures 5B–D was caused by the cold energy recovery of the EFG, which led to a large temperature difference at the outlet of CHX-1.
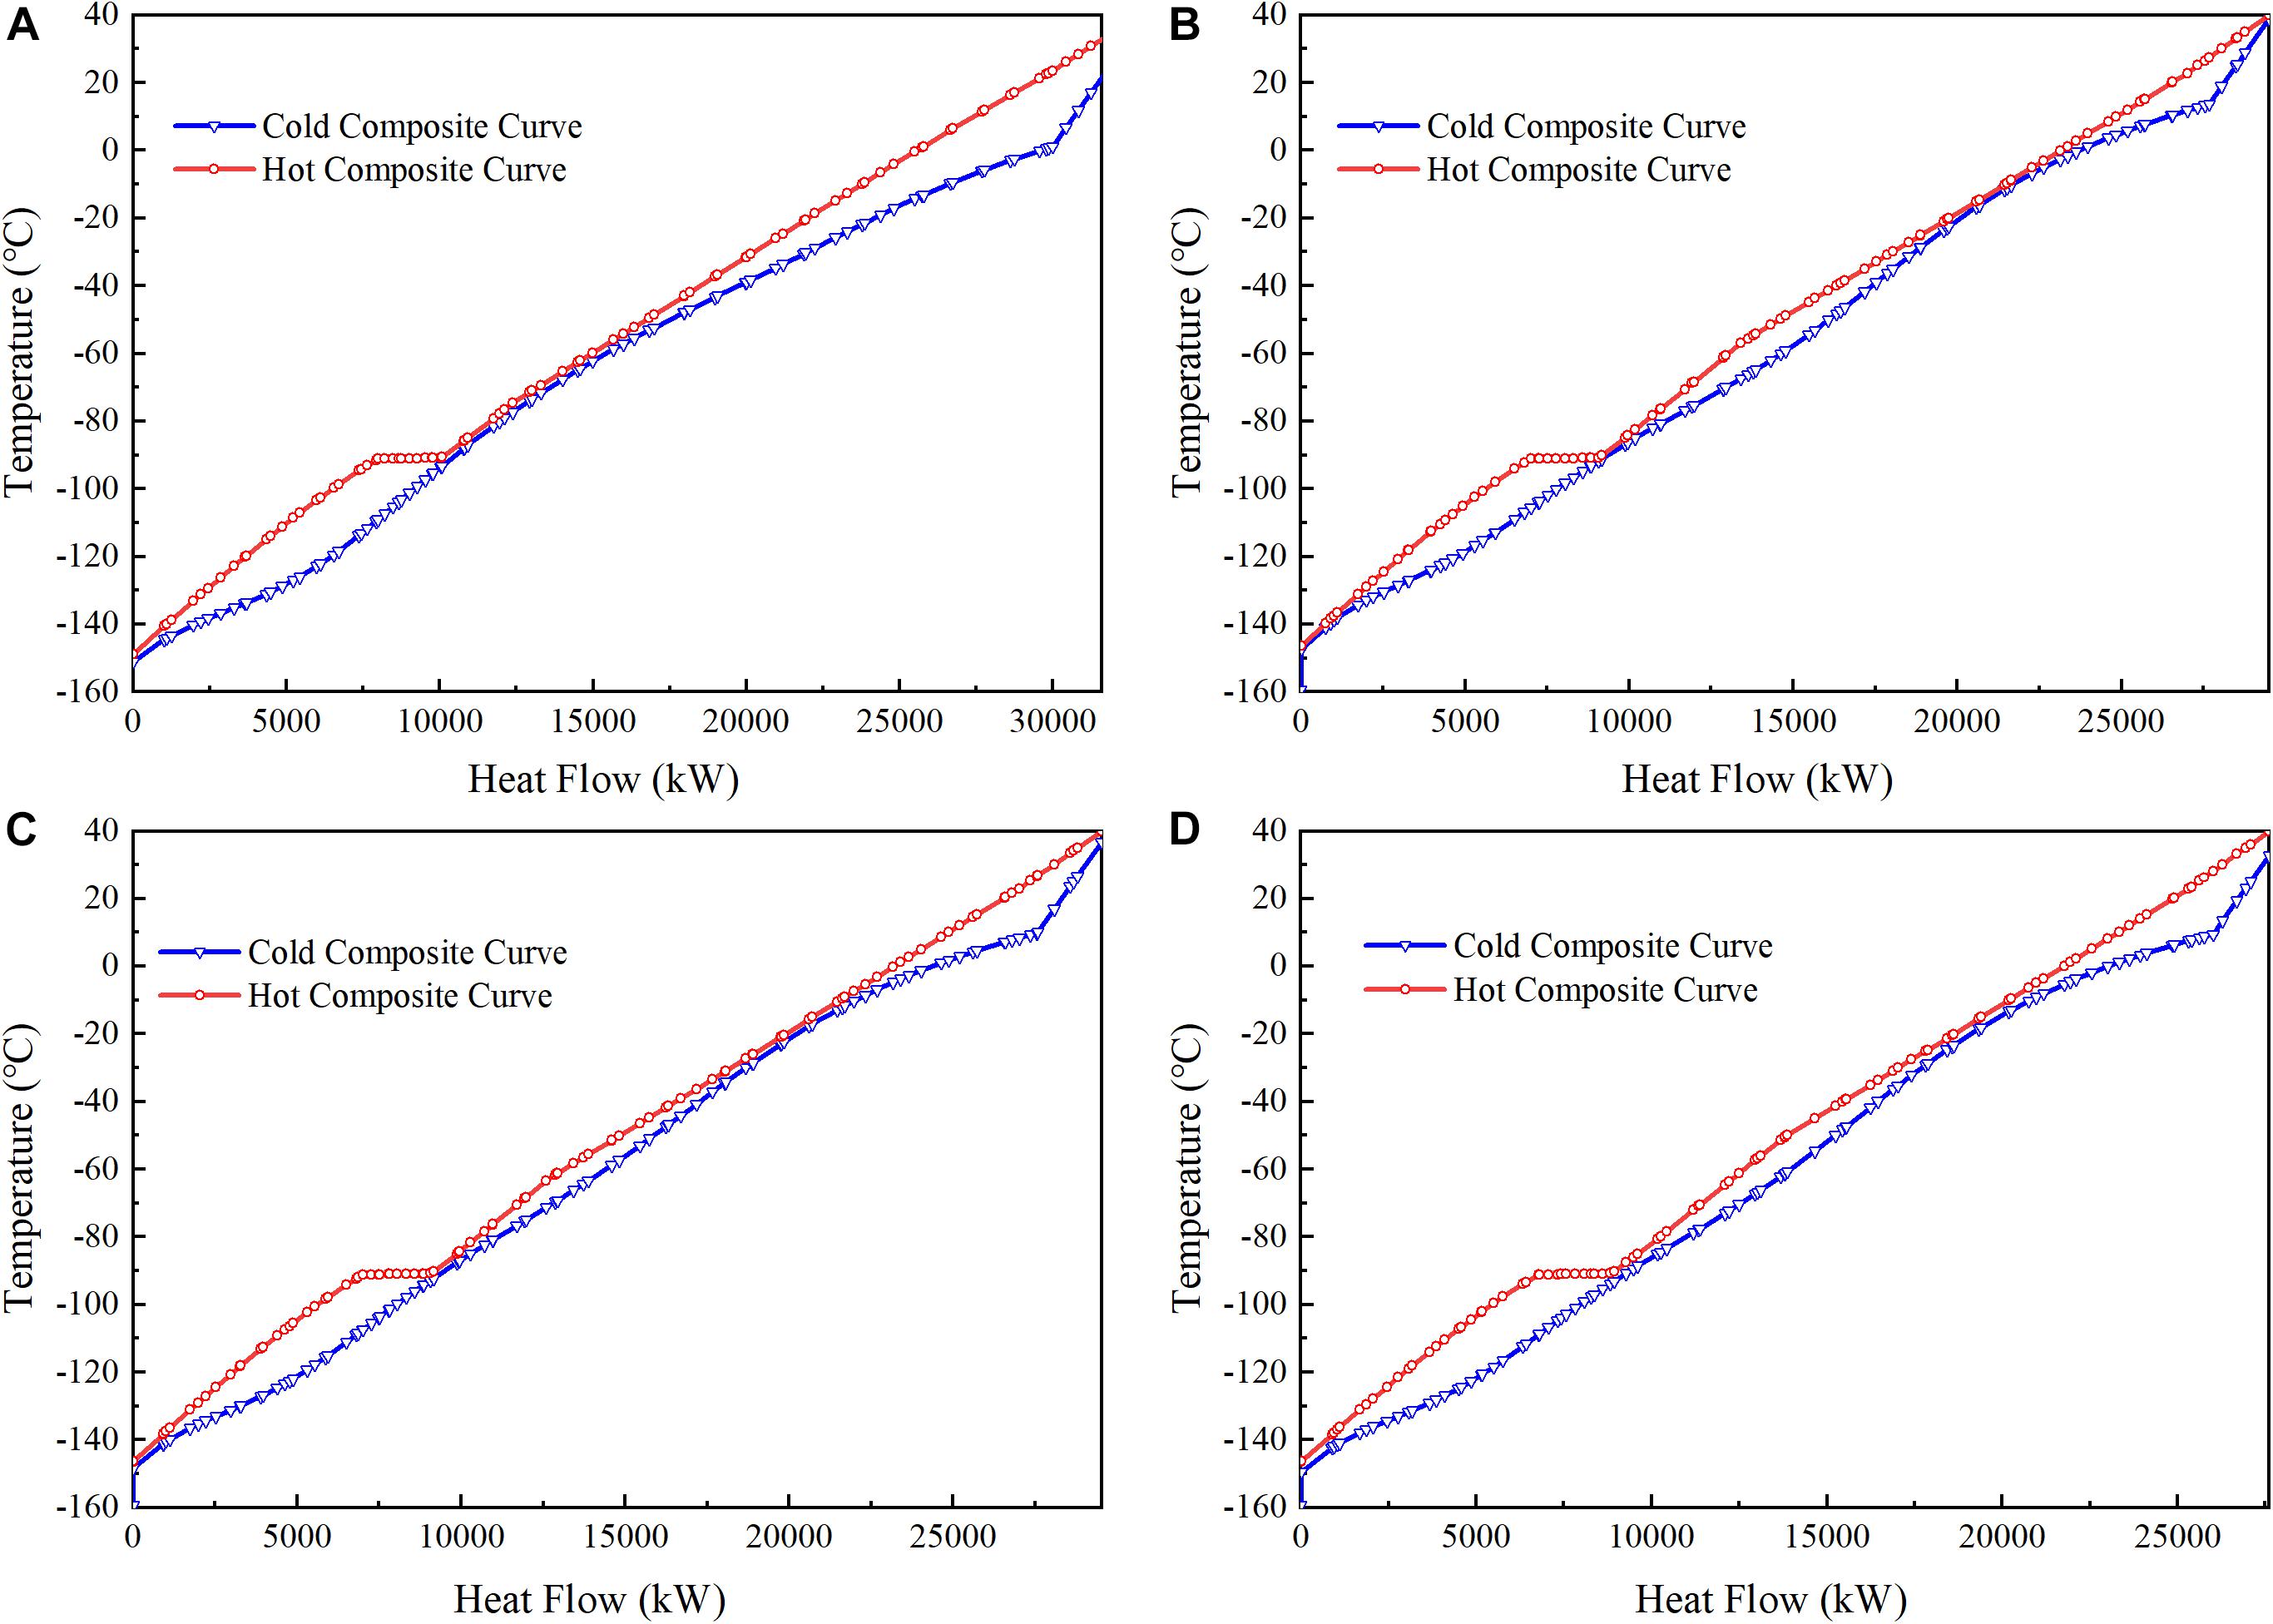
Figure 5. Temperature-heat flow diagram of the hot and cold composite curves (THCC) of four cases: (A) base case; (B) modified case 1; (C) modified case 2; (D) modified case 3.
Figure 6 presents the TDCC of the base case and three modified cases. As shown in Figure 6A, the largest temperature difference of 22.33°C occurred at the high-temperature range. In the middle temperature range (−90 to −40°C), the temperature difference is in the range of 2–4°C. When the temperature decreased to the low-temperature range (−150 to −90°C), the temperature difference increased to the second highest peak of 19.85°C. Figure 6B shows that the largest temperature difference was 14.97°C and its average temperature difference was also smaller than the base case. It indicated that reducing the MITA in the heat exchanger could uniform the temperature difference distribution along with the large temperature range. However, it was a trade-off between the energy performance and economical cost. The most surprising aspect of the temperature difference is shown in Figure 6D. Although the MITA in modified case 3 was larger than the base case, the temperature difference in modified case 3 was smaller than the base case. This implied that the modification of the process configuration by introducing the cryogenic liquid turbine coupled with the optimization by BHBO reduced the energy consumption dramatically. Moreover, the MITA affected the TDCC significantly. With the increase of the MITA, the average temperature difference in the main cryogenic heat exchanger increased. As shown in Figure 6, in the temperature range of −20°C to 40°C, the largest temperature difference increased from 13.74 to 16.87°C and 18.69°C when the MITA increased from 1 to 2°C and 3°C, respectively. It indicated that a larger MITA could deteriorate the heat transfer performance in the high temperature range of the main cryogenic heat exchanger.
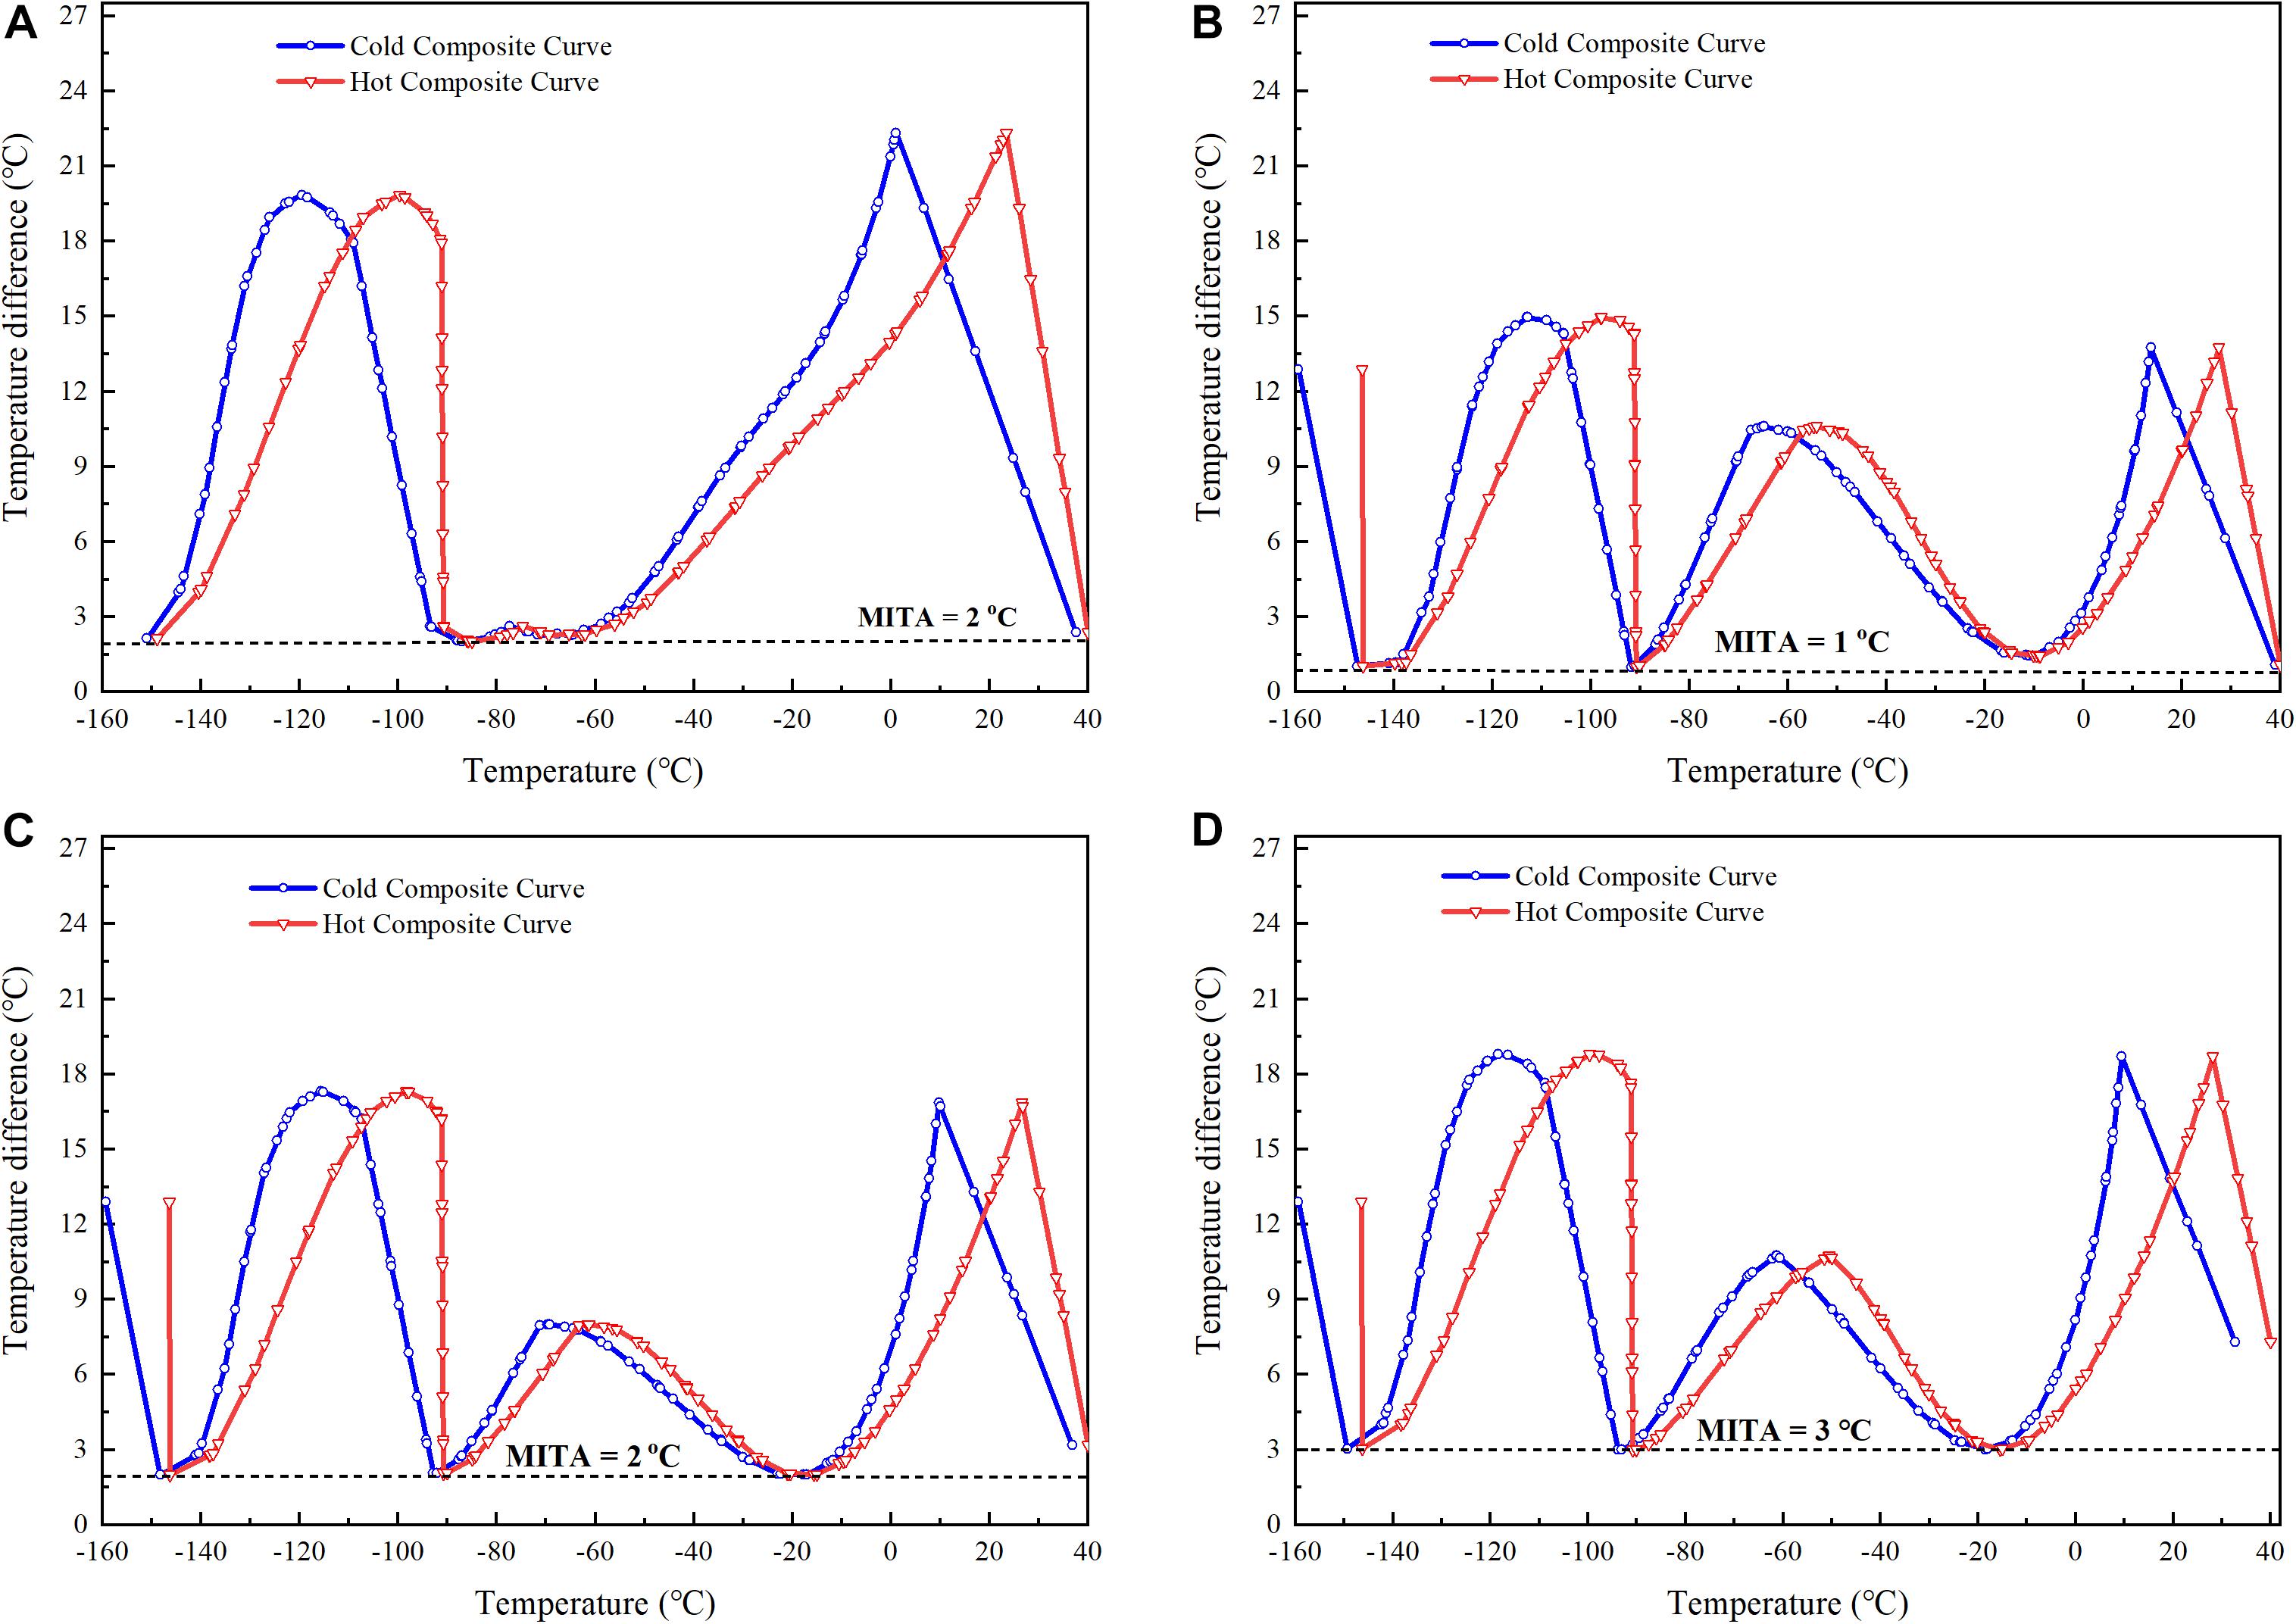
Figure 6. TDCC of four cases: (A) Base case; (B) modified case 1; (C) modified case 2; (D) modified case 3.
In this work, the theoretical minimum power of the biomethane liquefaction process was 3361.36 kW. The base case’s exergy efficiency was 23.82%, which was the lowest in four cases, as shown in Figure 7. The exergy efficiency of the three modified cases was 31.20%, 29.64%, and 28.44%, respectively. For the same MITA, modified case 2 was 5.82% higher than the base case. Moreover, modified case 3 was 4.62% higher than the base case even though the exergy efficiency decreased with the MITA increase.
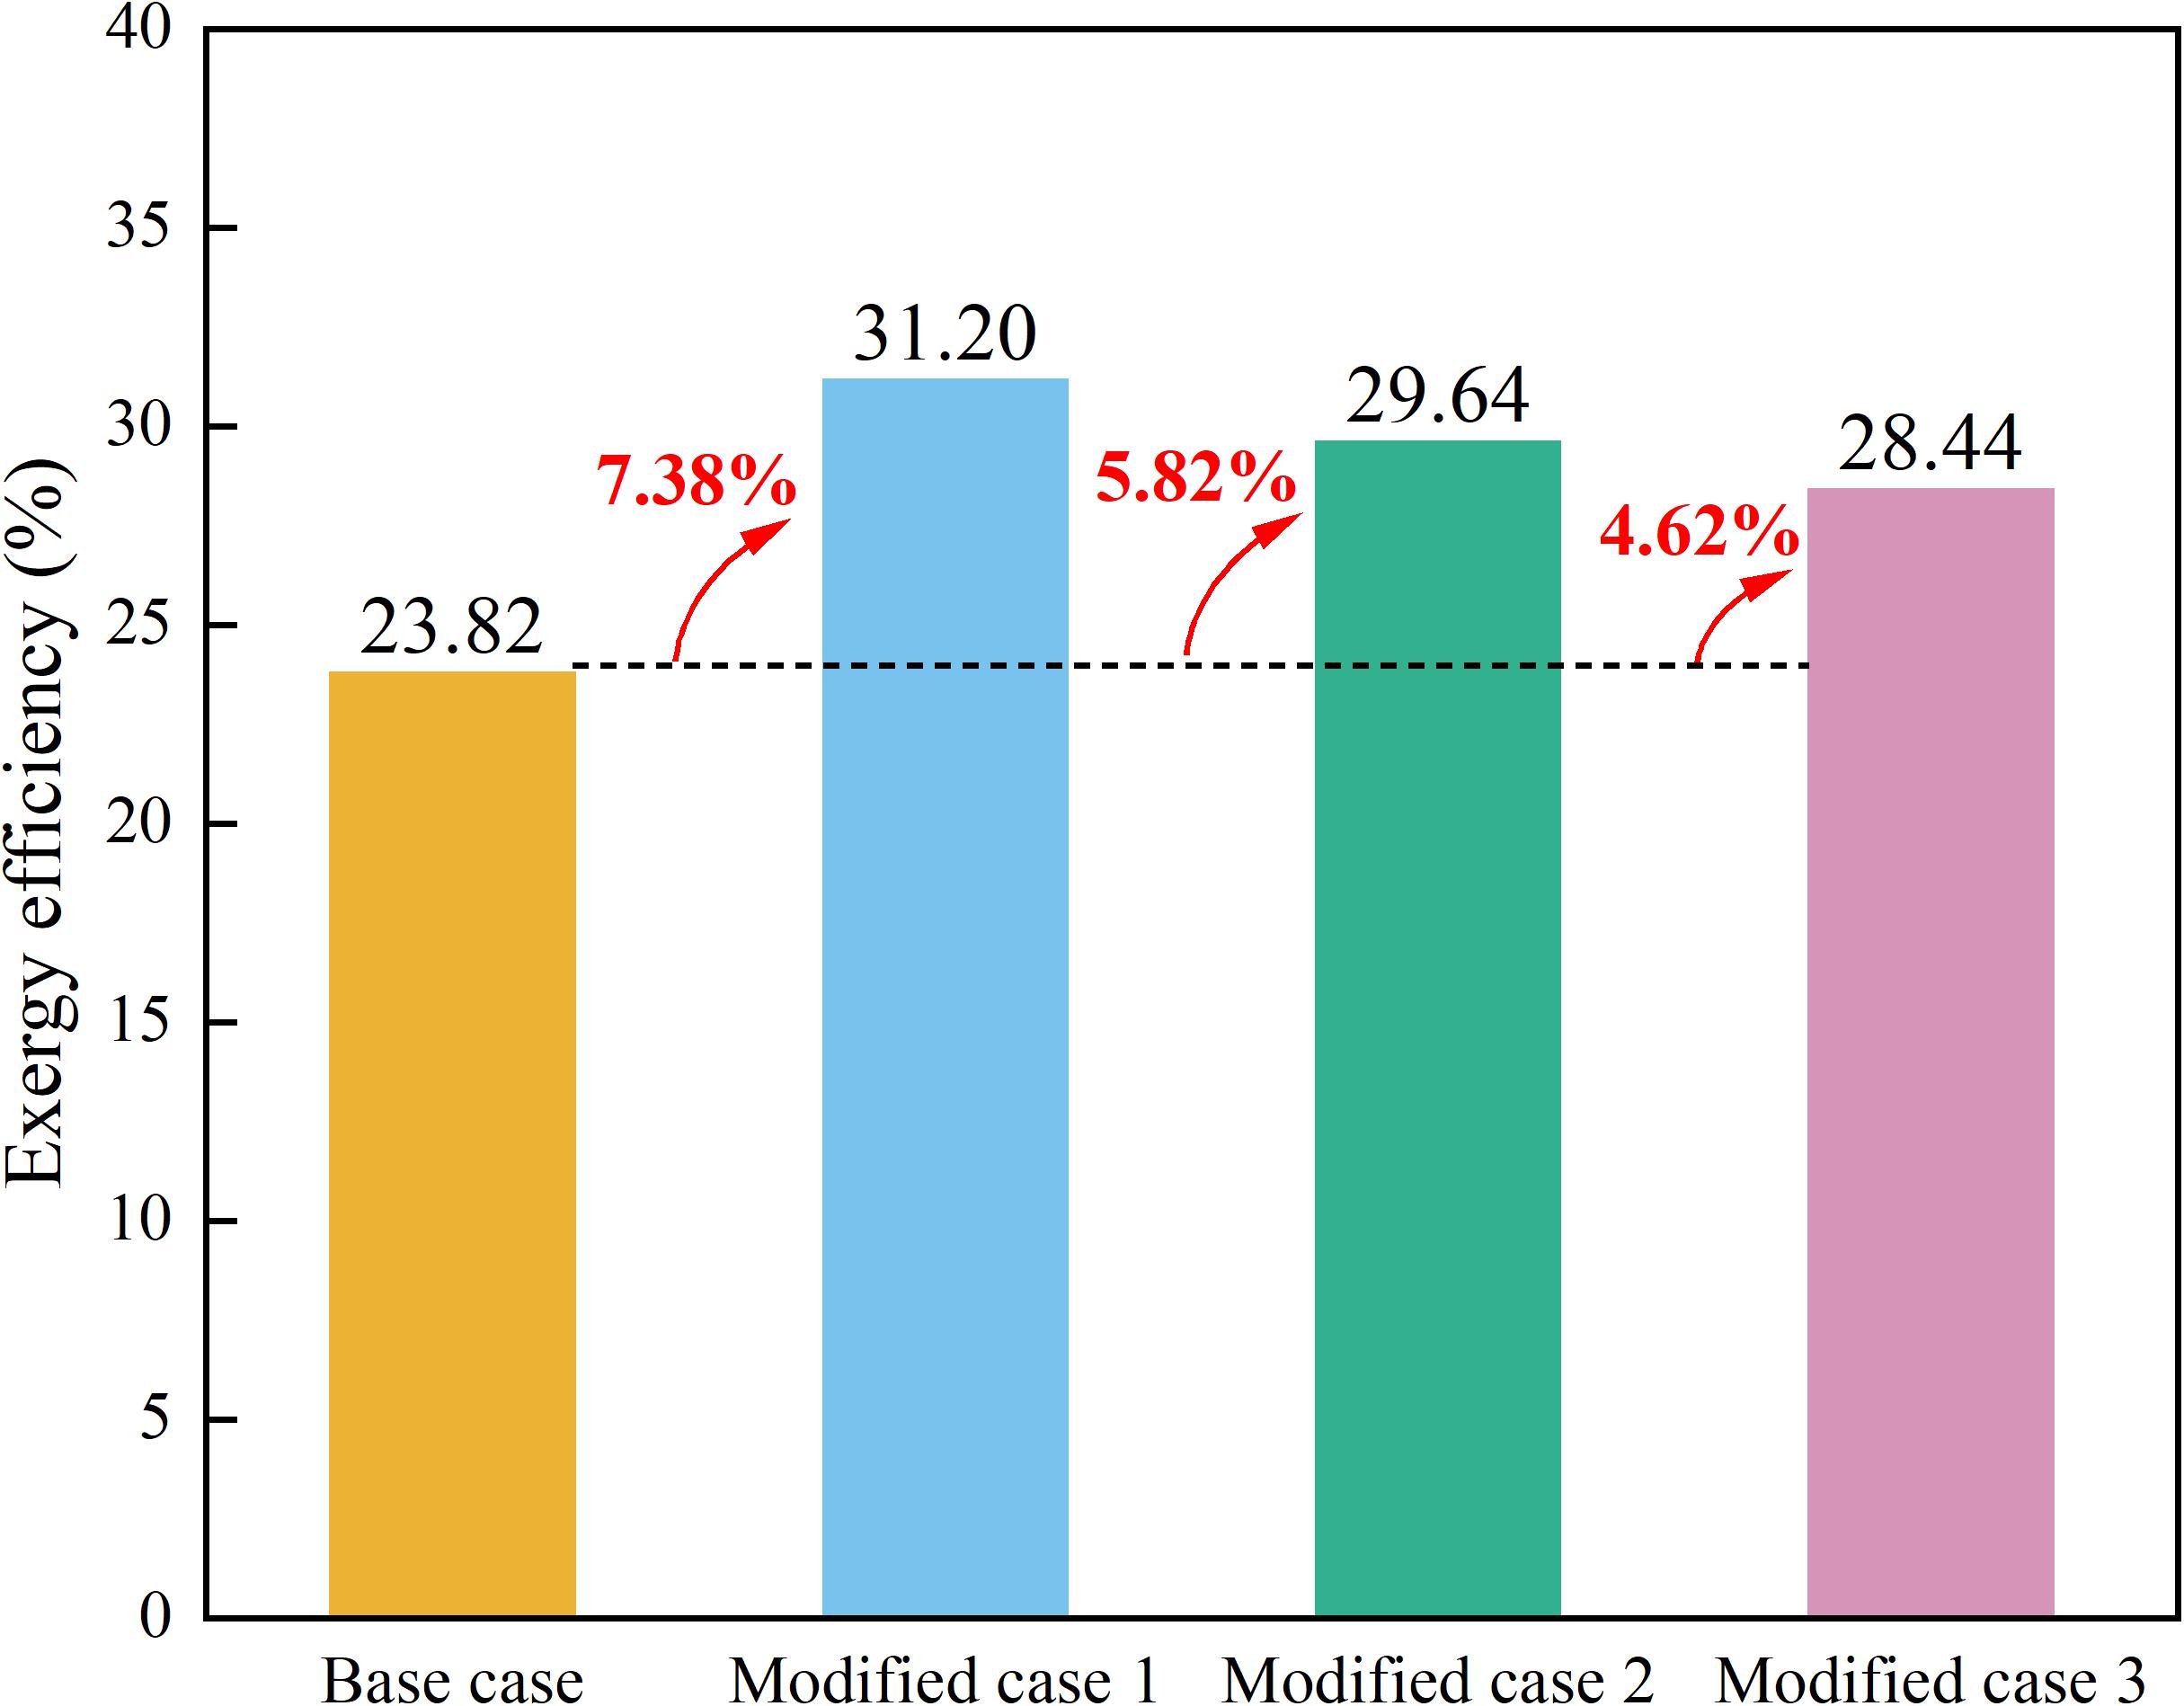
Figure 7. Exergy efficiencies of four cases.
The total exergy destruction in four cases is shown in Figure 8. The base case’s total exergy destruction reached 10022 kW, which was 45.51%, 28.66%, and 21.23% higher than the modified cases 1, 2, and 3, respectively. The results indicated that the process retrofitting and optimization by BHBO made the LBM process much efficient. For modified case 2, the total exergy destruction was 7790 kW, which was 13.10% higher and 5.77% lower than the modified cases 1 and 3, respectively. In addition, the exergy destruction of the main cryogenic heat exchanger (CHX-1) in modified case 2 was 2597 kW, which was 19.64% lower than the base case.
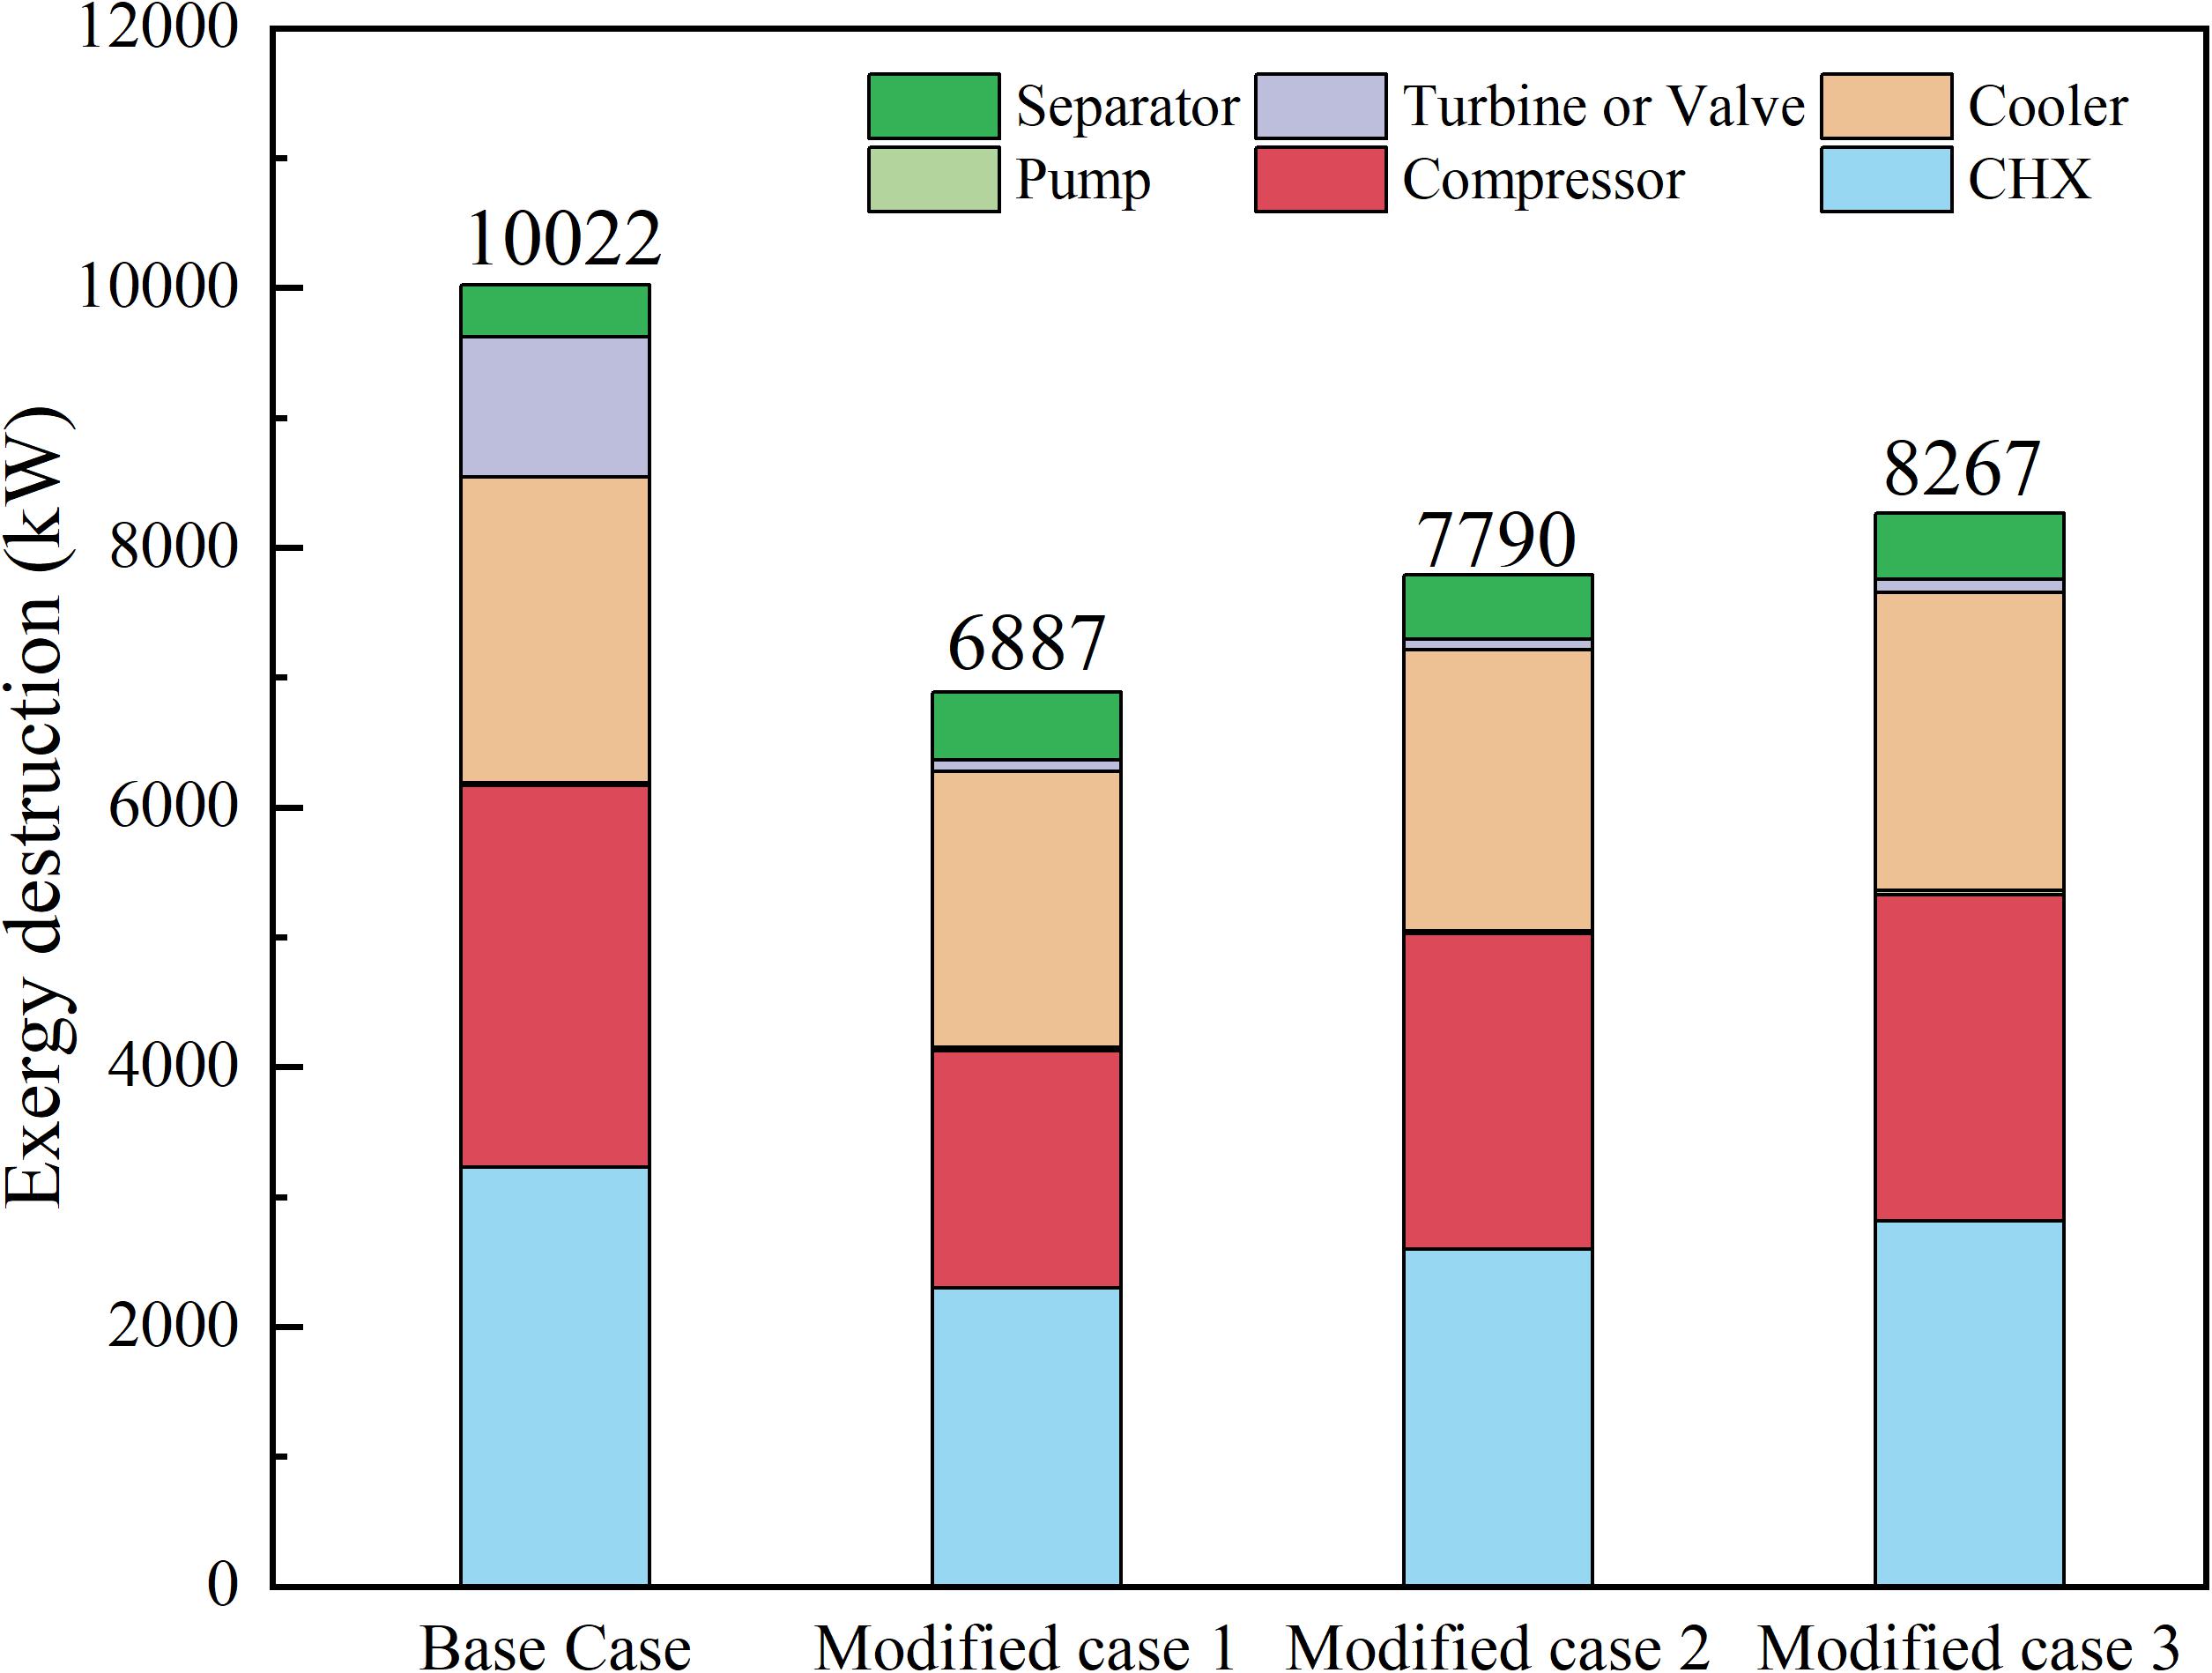
Figure 8. The total exergy destruction of four cases.
Figure 9 illustrates the percentage of exergy destruction in different equipment in four cases. It should be noted that the number 5 in Figure 9 referred to the valve for the base case and the turbine for the modified cases. It is seen from Figure 9 that the main cryogenic heat exchanger in the base case contributed to 32.24% of the total exergy destruction, followed by compressors (29.31%). However, for modified case 1, the intercooler was the second largest exergy destruction contributor reaching 30.87%, which was 4.40% higher than the compressors. A possible explanation for this might be that the appropriate mixed refrigerant reduced the exergy destruction in compressors significantly. Due to a larger temperature difference in CHX-1 in modified case 2, the exergy destruction caused by CHX-1 was the largest among all equipment. Furthermore, the exergy destruction by the cryogenic liquid turbine was dramatically lower than that by the throttling valve.
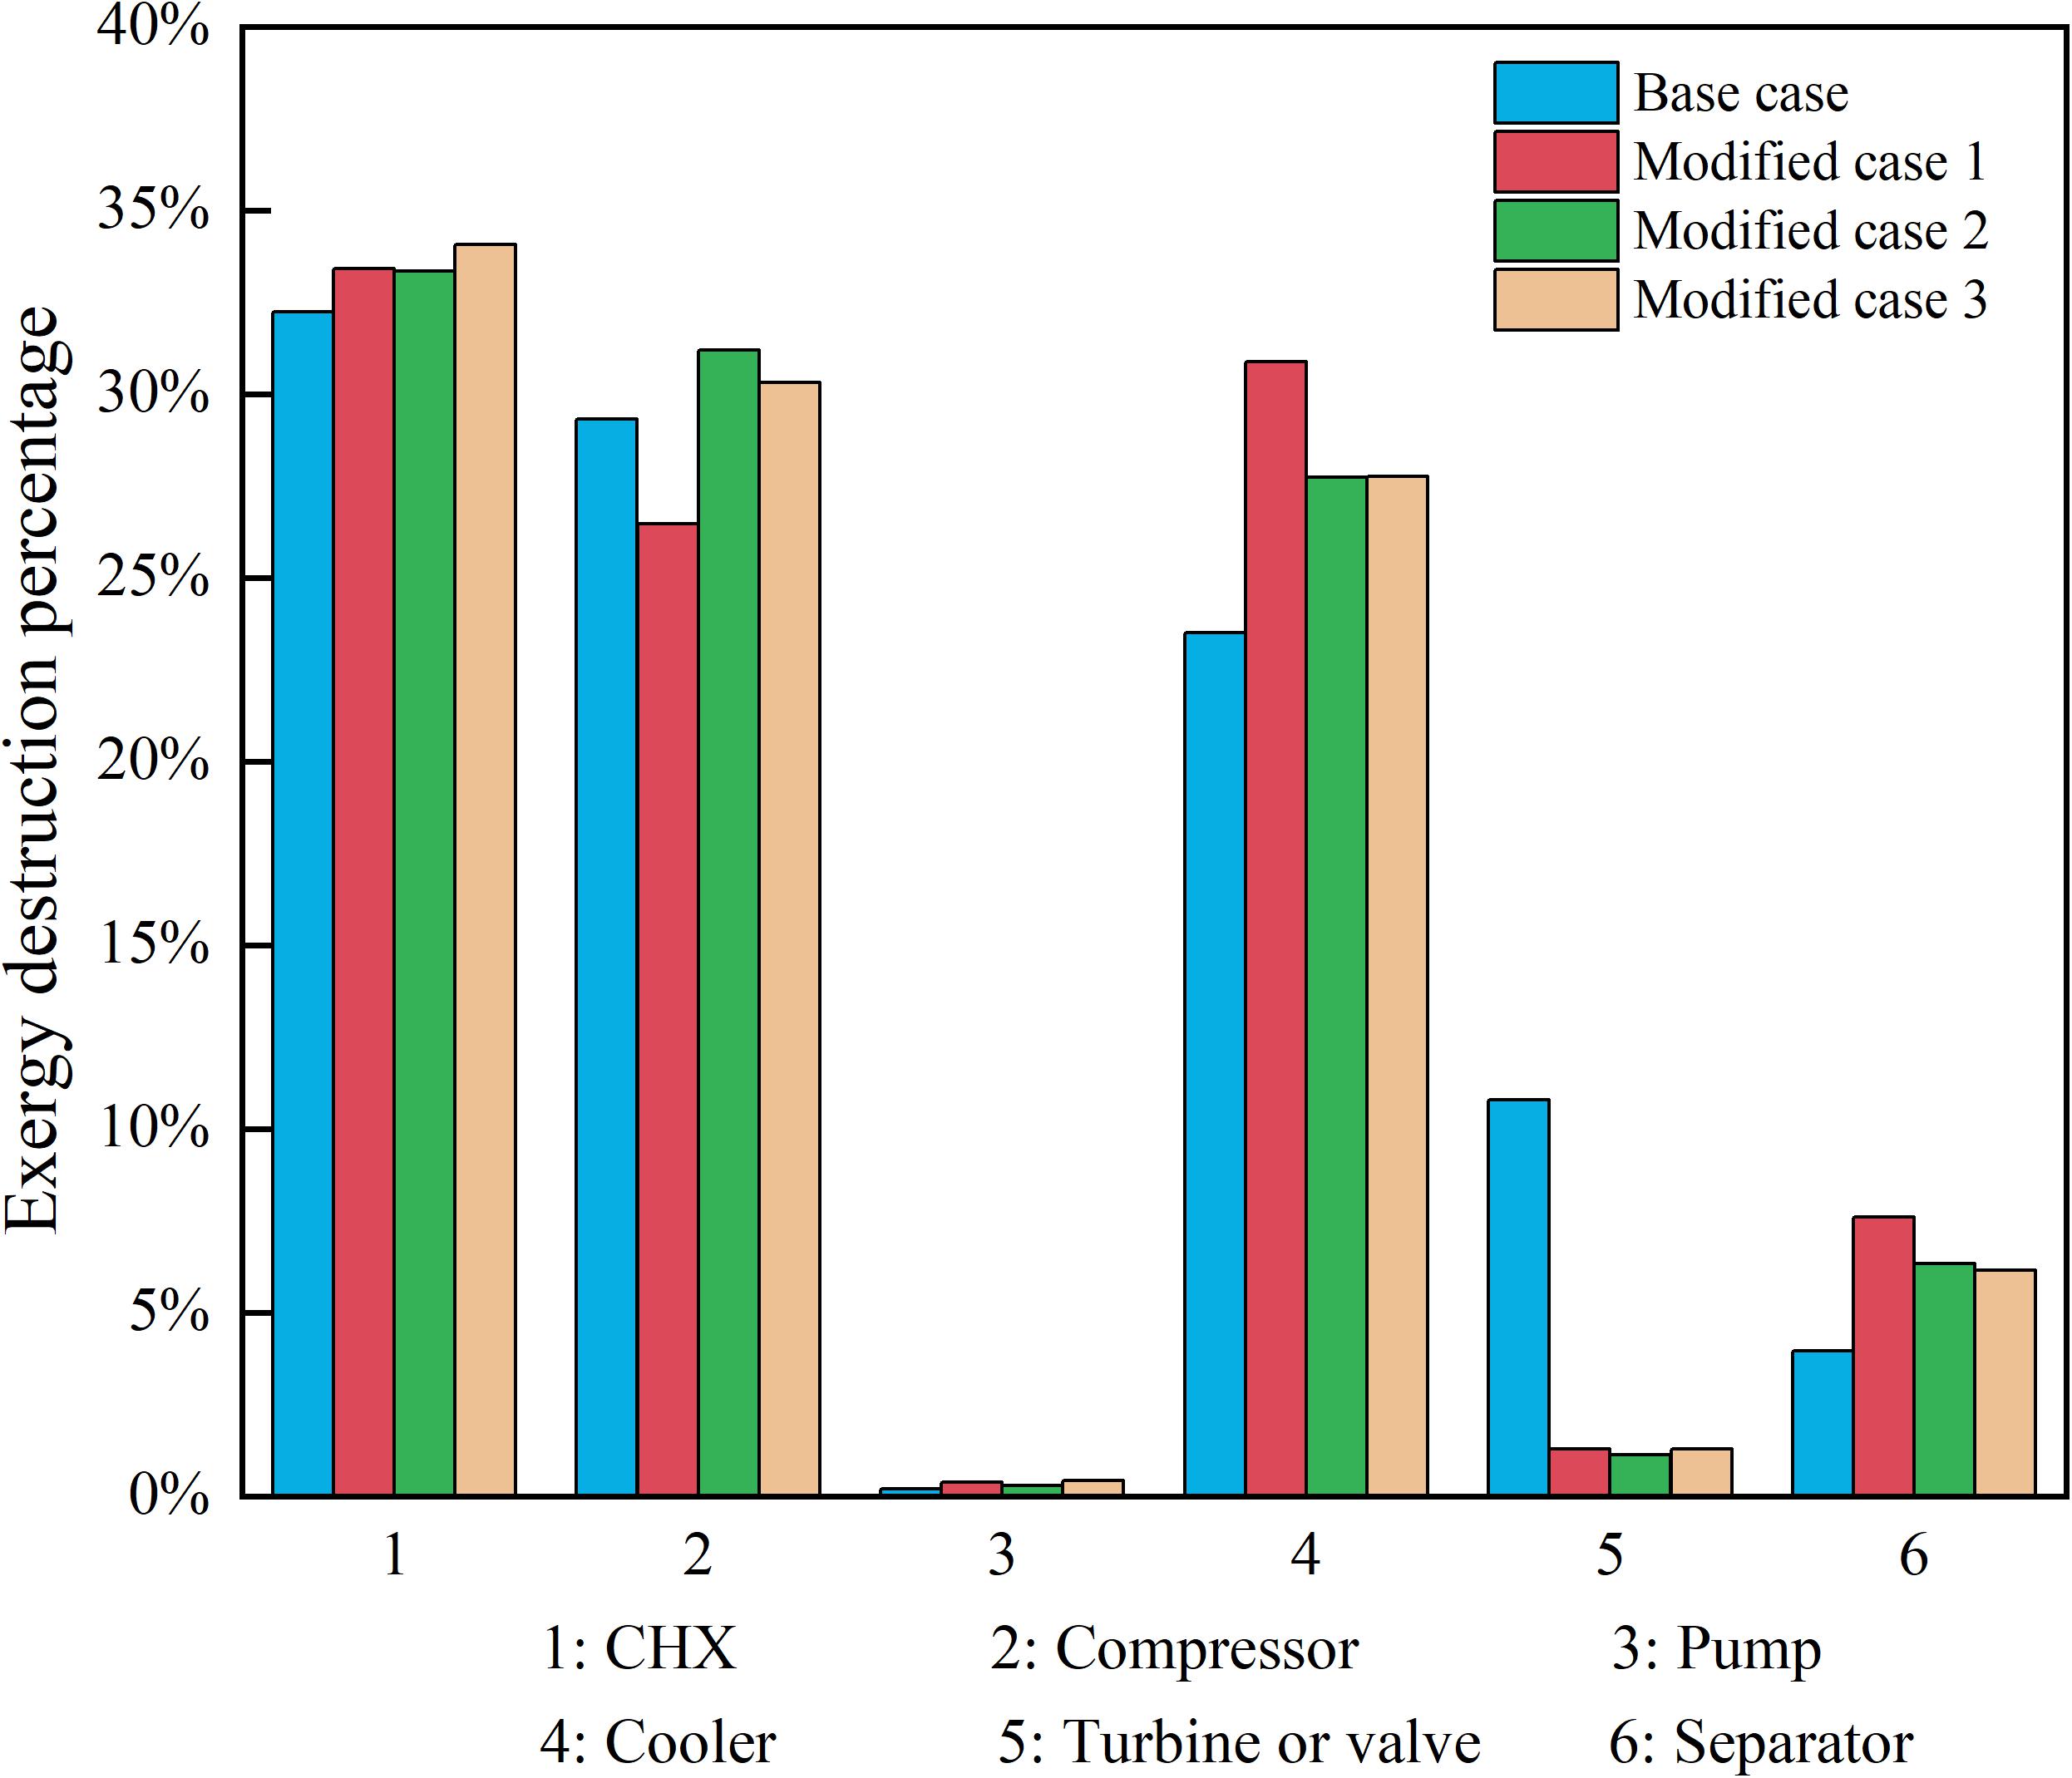
Figure 9. The exergy destruction percentage of different equipment in four cases.
To evaluate the optimization performance of BHBO, the particle swarm optimization (PSO) algorithm, and genetic algorithm (GA) were selected to compare three algorithms’ performance. The results of modified case 2 optimized by three algorithms are shown in Table 5. The SEC optimized by BHBO was 0.3328 kWh/kg, which was 2.83% and 6.59% lower than the PSO and GA, respectively. It indicated that the optimization performance of the BHBO was comparable with the mature algorithms like PSO and GA.
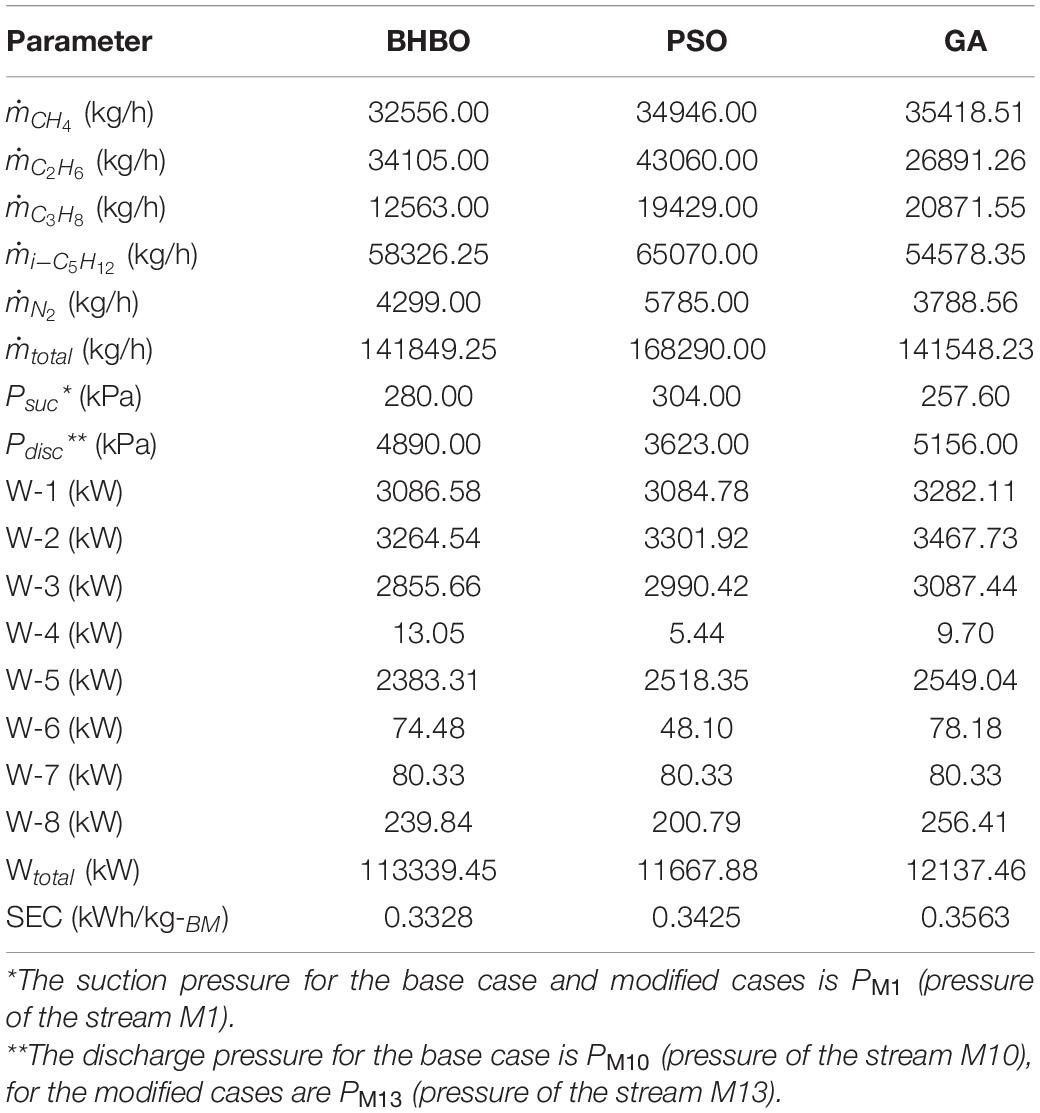
Table 5. The decision variables along with the power consumption of modified case 2 optimized by three algorithms.
Liquefied biomethane is one of the most auspicious energy sources because of its sustainable and environmental aspects. However, the high-energy consumption of LBM limits its wider potential applications. To address this issue, a SMR-based biomethane liquefaction process was proposed for the small-scale LBM production. To improve the process energy performance, cryogenic liquid turbines were utilized to replace the LBM and MR throttling valves. The BHBO algorithm was adopted to optimize key decision variables to minimize SEC. Three different MITAs in the main cryogenic heat exchanger were studied to reveal the relationship between the process performance and MITA. Furthermore, the composite curve, energy, and exergy analyses were conducted. The results indicated that the SEC of modified case 2 (applying cryogenic liquid turbine with MITA = 2°C) was 0.3228 kWh/kg with 21.01% reduction than the base case (adopting throttling valve with MITA = 2°C). When the MITA decreased to 1°C, the SEC of modified case 1 reduced to 0.3162 kWh/kg, which was 24.96% lower than the base case. Moreover, the total exergy destruction of modified cases 1, 2, and 3 was 31.28%, 22.27%, and 17.51% lower than the base case, respectively. Besides, the exergy destruction of the cryogenic liquid turbine was significantly lower than the throttling valve with additional power generation. The findings indicated that the proposed SMR process for LBM was superior to the conventional one. In conclusion, the BHBO-optimized SMR-based LBM process was found suitable for small-scale LBM production. Furthermore, the BHBO algorithm could also be adopted to optimize other LNG and LBM processes as well as other multiple working fluid-related processes.
The original contributions presented in the study are included in the article/supplementary material, further inquiries can be directed to the corresponding authors.
All authors listed have made a substantial, direct and intellectual contribution to the work, and approved it for publication.
This work was supported by the Priority Research Centers Program through the National Research Foundation (NRF) funded by the Ministry of Education (2014R1A6A1031189) and the National Natural Science Foundation of China (No. 51906255).
The authors declare that the research was conducted in the absence of any commercial or financial relationships that could be construed as a potential conflict of interest.
Arteconi, A., Spitoni, M., Polonara, F., and Spigarelli, F. (2016). The feasibility of liquefied biomethane as alternative fuel: a comparison between European and Chinese markets. Int. J. Ambient Energy 38, 481–488. doi: 10.1080/01430750.2016.1191040
Baccioli, A., Antonelli, M., Frigo, S., Desideri, U., and Pasini, G. (2018). Small scale bio-LNG plant: comparison of different biogas upgrading techniques. Appl. Energy 217, 328–335. doi: 10.1016/j.apenergy.2018.02.149
Bauer, F., Persson, T., Hulteberg, C., and Tamm, D. (2013). Biogas upgrading–technology overview, comparison and perspectives for the future. Biofuels Bioprod. Biorefining 7, 499–511. doi: 10.1002/bbb.1423
Black Hole, F. (2021). Imagine the Universe. National Aeronautics and Space Administration. Available online at: https://imagine.gsfc.nasa.gov/index.html (accessed January 15, 2021).
Budzianowski, W. M., and Brodacka, M. (2017). Biomethane storage: evaluation of technologies, end uses, business models, and sustainability. Energy Convers. Manage. 141, 254–273. doi: 10.1016/j.enconman.2016.08.071
Capra, F., Magli, F., and Gatti, M. (2019). Biomethane liquefaction: a systematic comparative analysis of refrigeration technologies. Appl. Thermal Eng. 158:113815. doi: 10.1016/j.applthermaleng.2019.113815
Chen, S.-M., and Chang, Y.-C. (2010). Multi-variable fuzzy forecasting based on fuzzy clustering and fuzzy rule interpolation techniques. Inform. Sci. 180, 4772–4783. doi: 10.1016/j.ins.2010.08.026
Fan, Q. H., Li, H. Y., Yin, Q. S., and Jia, L. X. (2008). Design and analysis of a small-scale biogas liquefaction cycle. AIP Conf. Proc. 985:1166.
Haider, J., Qyyum, M. A., Kazmi, B., Ali, I., Nizami, A.-S., and Lee, M. (2020). Simulation study of deep eutectic solvent-based biogas upgrading process integrated with single mixed refrigerant biomethane liquefaction. Biofuel Res. J. 7, 1245–1255. doi: 10.18331/brj2020.7.4.3
Haider, J., Qyyum, M. A., Kazmi, B., Zahoor, M., and Lee, M. (2019). Simulation study of biomethane liquefaction followed by biogas upgrading using an imidazolium-based cationic ionic liquid. J. Cleaner Prod. 231, 953–962. doi: 10.1016/j.jclepro.2019.05.252
Hashemi, S. E., Sarker, S., Lien, K. M., Schnell, S. K., and Austbø, B. (2019). Cryogenic vs. absorption biogas upgrading in liquefied biomethane production–an energy efficiency analysis. Fuel 245, 294–304. doi: 10.1016/j.fuel.2019.01.172
Hatamlou, A. (2013). Black hole: a new heuristic optimization approach for data clustering. Inform. Sci. 222, 175–184. doi: 10.1016/j.ins.2012.08.023
He, T., Liu, Z., Ju, Y., and Parvez, A. M. (2019). A comprehensive optimization and comparison of modified single mixed refrigerant and parallel nitrogen expansion liquefaction process for small-scale mobile LNG plant. Energy 167, 1–12. doi: 10.1016/j.energy.2018.10.169
He, T., Lv, H., Shao, Z., Zhang, J., Xing, X., and Ma, H. (2020a). Cascade utilization of LNG cold energy by integrating cryogenic energy storage, organic Rankine cycle and direct cooling. Appl. Energy 277:115570. doi: 10.1016/j.apenergy.2020.115570
He, T., Mao, N., Liu, Z., Qyyum, M. A., Lee, M., and Pravez, A. M. (2020b). Impact of mixed refrigerant selection on energy and exergy performance of natural gas liquefaction processes. Energy 199:117378. doi: 10.1016/j.energy.2020.117378
International Energy Agency (2019). Outlook for Biogas and Biomethane: Prospects for Organic Growth. Paris: International Energy Agency.
Lee, I., Tak, K., Kwon, H., Kim, J., Ko, D., and Moon, I. (2014). Design and optimization of a pure refrigerant cycle for natural gas liquefaction with subcooling. Ind. Eng. Chem. Res. 53, 10397–10403. doi: 10.1021/ie403808y
Lin, W., Xu, J., Zhang, L., and Gu, A. (2017). Synthetic natural gas (SNG) liquefaction processes with hydrogen separation. Int. J. Hydrogen Energy 42, 18417–18424. doi: 10.1016/j.ijhydene.2017.04.141
Mehrpooya, M., Omidi, M., and Vatani, A. (2016). Novel mixed fluid cascade natural gas liquefaction process configuration using absorption refrigeration system. Appl. Thermal Eng. 98, 591–604. doi: 10.1016/j.applthermaleng.2015.12.032
Moran, M. J., Shapiro, H. N., Boettner, D. D., and Bailey, M. B. (2014). Fundamentals of Engineering Thermodynamics. Hoboken, NJ: John Wiley & Sons.
Mousavi, S. A., and Mehrpooya, M. (2020). A comprehensive exergy-based evaluation on cascade absorption-compression refrigeration system for low temperature applications - exergy, exergoeconomic, and exergoenvironmental assessments. J. Cleaner Prod. 246:119005. doi: 10.1016/j.jclepro.2019.119005
Pasini, G., Baccioli, A., Ferrari, L., Antonelli, M., Frigo, S., and Desideri, U. (2019). Biomethane grid injection or biomethane liquefaction: a technical-economic analysis. Biomass Bioenergy 127:105264. doi: 10.1016/j.biombioe.2019.105264
Pellegrini, L. A., De Guido, G., and Langé, S. (2018). Biogas to liquefied biomethane via cryogenic upgrading technologies. Renew. Energy 124, 75–83. doi: 10.1016/j.renene.2017.08.007
Peng, D.-Y., and Robinson, D. B. (1976). A new two-constant equation of state. Ind. Eng. Chem. Fundamentals 15, 59–64. doi: 10.1021/i160057a011
Qyyum, M. A., Ali, W., Long, N. V. D., Khan, M. S., and Lee, M. (2018). Energy efficiency enhancement of a single mixed refrigerant LNG process using a novel hydraulic turbine. Energy 144, 968–976. doi: 10.1016/j.energy.2017.12.084
Qyyum, M. A., Haider, J., Qadeer, K., Valentina, V., Khan, A., Yasin, M., et al. (2020a). Biogas to liquefied biomethane: assessment of 3P’s–Production, processing, and prospects. Renew. Sustain. Energy Rev. 119:109561. doi: 10.1016/j.rser.2019.109561
Qyyum, M. A., He, T., Qadeer, K., Mao, N., Lee, S., and Lee, M. (2020b). Dual-effect single-mixed refrigeration cycle: an innovative alternative process for energy-efficient and cost-effective natural gas liquefaction. Appl. Energy 268:115022. doi: 10.1016/j.apenergy.2020.115022
Rehman, A., Qyyum, M. A., Qadeer, K., Zakir, F., Ding, Y., Lee, M., et al. (2020). Integrated biomethane liquefaction using exergy from the discharging end of a liquid air energy storage system. Appl. Energy 260:114260. doi: 10.1016/j.apenergy.2019.114260
Sun, Q., Li, H., Yan, J., Liu, L., Yu, Z., and Yu, X. (2015). Selection of appropriate biogas upgrading technology-a review of biogas cleaning, upgrading and utilisation. Renew. Sustain. Energy Rev. 51, 521–532. doi: 10.1016/j.rser.2015.06.029
Ullah Khan, I., Hafiz Dzarfan Othman, M., Hashim, H., Matsuura, T., Ismail, A. F., Rezaei-Dashtarzhandi, M., et al. (2017). Biogas as a renewable energy fuel – a review of biogas upgrading, utilisation and storage. Energy Convers. Manage. 150, 277–294. doi: 10.1016/j.enconman.2017.08.035
Yousef, A. M., El-Maghlany, W. M., Eldrainy, Y. A., and Attia, A. (2019). Upgrading biogas to biomethane and liquid CO2: a novel cryogenic process. Fuel 251, 611–628. doi: 10.1016/j.fuel.2019.03.127
Keywords: biomethane, liquefied biomethane, single mixed refrigerant, optimization, exergy destruction analysis, renewable LNG, liquid biogas, energy consumption minimization
Citation: He T, Qyyum MA, Zhou Z, Ahmad A, Rehan M, Nizami A-S and Lee M (2021) Black Hole-Inspired Optimal Design of Biomethane Liquefaction Process for Small-Scale Applications. Front. Energy Res. 9:656165. doi: 10.3389/fenrg.2021.656165
Received: 20 January 2021; Accepted: 01 March 2021;
Published: 16 April 2021.
Edited by:
Su Shiung Lam, University of Malaysia Terengganu, MalaysiaReviewed by:
Yonglin Ju, Shanghai Jiao Tong University, ChinaCopyright © 2021 He, Qyyum, Zhou, Ahmad, Rehan, Nizami and Lee. This is an open-access article distributed under the terms of the Creative Commons Attribution License (CC BY). The use, distribution or reproduction in other forums is permitted, provided the original author(s) and the copyright owner(s) are credited and that the original publication in this journal is cited, in accordance with accepted academic practice. No use, distribution or reproduction is permitted which does not comply with these terms.
*Correspondence: Moonyong Lee, bXlubGVlQHl1LmFjLmty; Muhammad Abdul Qyyum, bWFxeXl1bUB5dS5hYy5rcg==
Disclaimer: All claims expressed in this article are solely those of the authors and do not necessarily represent those of their affiliated organizations, or those of the publisher, the editors and the reviewers. Any product that may be evaluated in this article or claim that may be made by its manufacturer is not guaranteed or endorsed by the publisher.
Research integrity at Frontiers
Learn more about the work of our research integrity team to safeguard the quality of each article we publish.