 Xuetao Sun
 Zhenhua Wang
- 1Institute for Rural Development, Shandong Academy of Social Sciences, Jinan, China
- 2College of Economics and Management, Shenyang Agricultural University, Shenyang, China
Global warming has caused concern among countries worldwide. Since 2010, the Chinese government has implemented low-carbon pilot policies (LCPPs) in some regions to control carbon emissions. To evaluate the implementation effects of the LCPPs, we matched China’s macro data with Chinese household financial survey data. Specifically, we used a OLS model for assessing the impact of LCPPs on China’s household carbon emissions and conducted heterogeneous analysis. Further, we evaluated the mechanism through which LCPPs affect the carbon emissions of Chinese households. The research results yielded three main findings. (1) LCPPs can promote a reduction in household carbon emissions; however, the impact of LCPPs on household carbon emissions exhibits a time lag. (2) LCPPs reduce household carbon emissions by promoting the upgradation of the household consumption structure. The LCPP enables households to reduce consumption of products involving high levels of carbon emissions, while increasing consumption of low-carbon emission products, thereby affecting total household carbon emissions. (3) An analysis of household heterogeneity revealed that LCPPs mainly affect household carbon emissions in the country’s eastern and central regions, especially urban households’ carbon emissions. This paper describes the implementation effects of LCPPs and suggests a viable path for the further implementation of LCPPs.
Introduction
Global warming has become a topic of general concern worldwide (Duan et al., 2019). For instance, rapid urbanization in China has caused the country’s energy consumption to rise from 602 million tons of standard coal equivalent in 1980 to 4.86 billion tons in 2019. Simultaneously, China’s carbon emissions reached 9.839 billion tons in 2019, accounting for 27.20% of global carbon emissions. The average annual growth rate of carbon emissions in China is 5.68%, with more than half of all emissions being caused by human activities (Edenhofer and Seyboth, 2013). With the rapid growth in Chinese residents’ income, the consumer goods sector has become the second-largest consumer of energy after the industrial sector, making it a significant source of carbon emissions (Tong and Zhou, 2020).
In response, the Chinese government has made the control of carbon emissions part of its national strategy (Khanna et al., 2014) and proposed a “dual constraint” goal. That is, the government expects China’s carbon emissions to peak before 2030. Furthermore, it expects that by 2030, China’s annual carbon emissions per unit of GDP will reduce from 60–65%, compared to 2005 levels. To achieve this goal, the National Development and Reform Commission of China issued a “Notice on the Implementation of Low-Carbon Provinces and Low-Carbon Cities Pilot Work” in 2010, and identified the first group of low-carbon pilot areas. The second and third groups of low-carbon pilot areas were subsequently designated in 2012 and 2017, respectively. The low-carbon pilot policy (LCPP) specifically addresses climate change and carbon emissions. It strives to achieve China’s goal of controlling greenhouse gas emissions by reducing carbon emissions per unit of GDP in the pilot cities. The main measures adopted by the low-carbon pilot cities are low carbon production and low-carbon consumption. Low-carbon consumption affects low-carbon pilots and is essential for policy effectiveness. Low-carbon pilot cities influence residents’ carbon emissions by establishing a carbon credit system covering residents’ daily lives, guiding residents to develop environment-friendly habits, and advocating low-carbon and green lifestyles. Several studies have discussed carbon emissions from the low-carbon production perspective, and point to a series of emission reduction policies aimed at reducing carbon emissions and promoting low-carbon production (Li et al., 2020). To achieve the goal of peaking carbon emissions by 2030, however, we need to focus not only on low-carbon production but also on low-carbon consumption. Our statistical analysis found that LCPPs promote the transformation of family lifestyles in favor of low-carbon consumption. However, what must be determined from a theoretical and empirical perspective is whether the government’s “top-down” LCPP has achieved the expected effect on households’ low-carbon consumption. In particular, micro survey data can provide a reference for the progress of macro pilot policies; guide low-carbon development to pay more attention to the adjustment and change in ordinary residents’ lifestyles; and help reduce carbon emissions, energy consumption, and greenhouse gas emissions from the source.
Our study analyzed the impact of LCPPs on household carbon emissions. Our research questions were as follows: Does the LCPP reduce household carbon emissions? If LCPPs do reduce household carbon emissions, what is the mechanism of the impact? Concurrently, are there differences between households in the influence of LCPPs on carbon emissions? Providing answers to these questions should help determine the implementation effects of LCPPs and provide useful policy implications so that China can achieve its dual control goals by 2030.
Literature Review
Countries have adopted energy conservation and emissions reduction as essential strategies to cope with climate change (Aall et al., 2007; Li et al., 2019); carbon emissions have also been the focus of scholarly research (Tong et al., 2020). Scholars have discussed carbon emissions and the factors that influence emissions in the European Union (Bekun et al., 2019), India (Ahmad et al., 2016), Pakistan (He et al., 2020), developing countries (Zhang X. et al., 2019), and countries with different income levels (Abbasi and Riaz, 2016). With the gradual increase in China’s carbon emissions and the implementation of a series of low-carbon policies by the Chinese government, scholars have gradually begun to examine China’s low-carbon governance (Wang and Chang, 2014; Song et al., 2020). Shi et al. (2016) and Guo et al. (2018) studied China’s carbon emissions. Yang and Li (2013) analyzed the development path of China’s low-carbon economy, and proposed specific measures for energy conservation and emission reduction (Li et al., 2020). Song et al. (2019) used data from Chinese cities and the double-difference method to reveal that the construction of low-carbon pilot cities can significantly reduce environmental pollution. Cheng et al. (2019) used data from the second group of low-carbon pilot cities in China and found that their construction increases the urban green total factor productivity (Aristei and Gallo, 2016; Zhang, 2020). Further, the construction of such cities reduces municipal (Zhou et al., 2019) and corporate carbon emissions (Zhang J. J. et al., 2019). There are also studies evaluating the impact of LCPPs on carbon emissions from the industrial (Ouyang and Lin, 2015) and transportation sectors (Yin et al., 2015). Some studies have also discussed how to reduce carbon emissions from the perspectives of environmental regulation (Li et al., 2020), finance (Mohsin et al., 2020), and economic growth (Taghizadeh-Hesary and Rasoulinezhad, 2020). However, these studies focus mainly on the overall (or sectoral) economy of the country (or region) when discussing the factors influencing carbon emissions.
Scholars have also realized that household carbon emissions are vital to urban carbon emissions (Liu et al., 2016). Researchers (e.g., Steg, 2008) have found that household carbon emissions in the United States account for 39% of urban carbon emissions (Linden, 2006). After Ji et al. (2016) proposed a method to measure household carbon emissions, scholars analyzed the impact of household structure (Tong et al., 2020) and city size (Liu et al., 2016) on household carbon emissions. However, the research on household carbon emissions has mainly focused on the impact of household (or city) structures on household carbon emissions. There are no studies discussing the effects of LCPPs on household carbon emissions.
To determine whether LCPPs can achieve the goal of green development, we must evaluate the impact of LCPPs on regional (or sectoral) and corporate carbon emissions (Zhou and Li, 2019) as well as the effects of LCPPs on household carbon emissions. This article tries to take LCPPs as a starting point to discuss their impact on household carbon emissions, to remedy previous studies’ neglect of the impact of the policies on low-carbon consumption.
The gaps in the literature on LCPPs and household carbon emissions motivated this study. Existing studies mainly focus on the impact of LCPPs on regional (or sectoral) carbon emissions. By contrast, this paper makes three contributions to the literature. First, our study aims to help attain the ultimate goal of a low-carbon economy: to achieve a win-win situation between economic development and ecological protection (Mitchell and Connor, 2004). Existing literature mainly treats carbon emissions from a macro perspective and lacks a micro perspective. This study provides empirical conclusions about the impact of LCPPs on carbon emissions at the household level and expands related research on carbon emissions. Second, we identify effective strategies and discuss low-carbon emissions. When evaluating the impact of LCPPs on household carbon emissions, we not only assess the effects for different types of households but also the impact on various household carbon emission categories. Third, our research method explores the mechanism through which LCPPs affect household carbon emissions. We adopted the propensity score matching method and conducted robustness tests to further characterize the implementation effects of LCPPs.
Policy Background and Theoretical Analysis
Responding to the international trend of energy conservation and emissions reduction, China pledged at the Copenhagen Climate Conference in 2009 to reduce carbon emissions by 40–50% by 2020. Reducing carbon emissions will promote the sustainable development of the Chinese economy and provide an opportunity to focus on high-quality development. To achieve China’s carbon emissions by 2020, five provinces—Guangdong, Shaanxi, Liaoning, Hubei, and Yunnan—and eight cities—Tianjin, Chongqing, Shenzhen, Xiamen, Hangzhou, Nanchang, Guiyang, and Baoding City—launched LCPPs in 2010. In 2012 and 2017, respectively, the second and third groups of low-carbon pilot cities were announced. Given that the first group of pilot cities comprised provincial administrative units, the second and third batches comprised more conventional cities. The programs were targeted at Chinese households. This study employed data from the Chinese Household Finance Survey (CHFS); however, the survey dataset only specifies the province from which a sample is taken, and not the city. Therefore, we selected the first group of pilot provinces to construct our sample data for low-carbon pilots.
Figure 1 shows the trends in household carbon emissions and per capita household carbon emissions in low-carbon pilot provinces and all other provinces from 2011 to 2017. The figure reveals that households’ carbon emissions and per capita household carbon emissions are relatively similar, confirming the results of scholars such as Zhang (2020). Household carbon emissions in both sets of provinces exhibit a rising trend from 2011 to 2017, making China’s goal of peaking carbon emissions by 2030 more difficult to achieve. Moreover, the carbon emissions of households in the treatment group (provinces with LCPPs) and in the control group (provinces without LCPPs) were approximately equal in 2011. After 2011, household carbon emissions in the low-carbon pilot provinces rose more slowly, and by 2015, they began to decline.
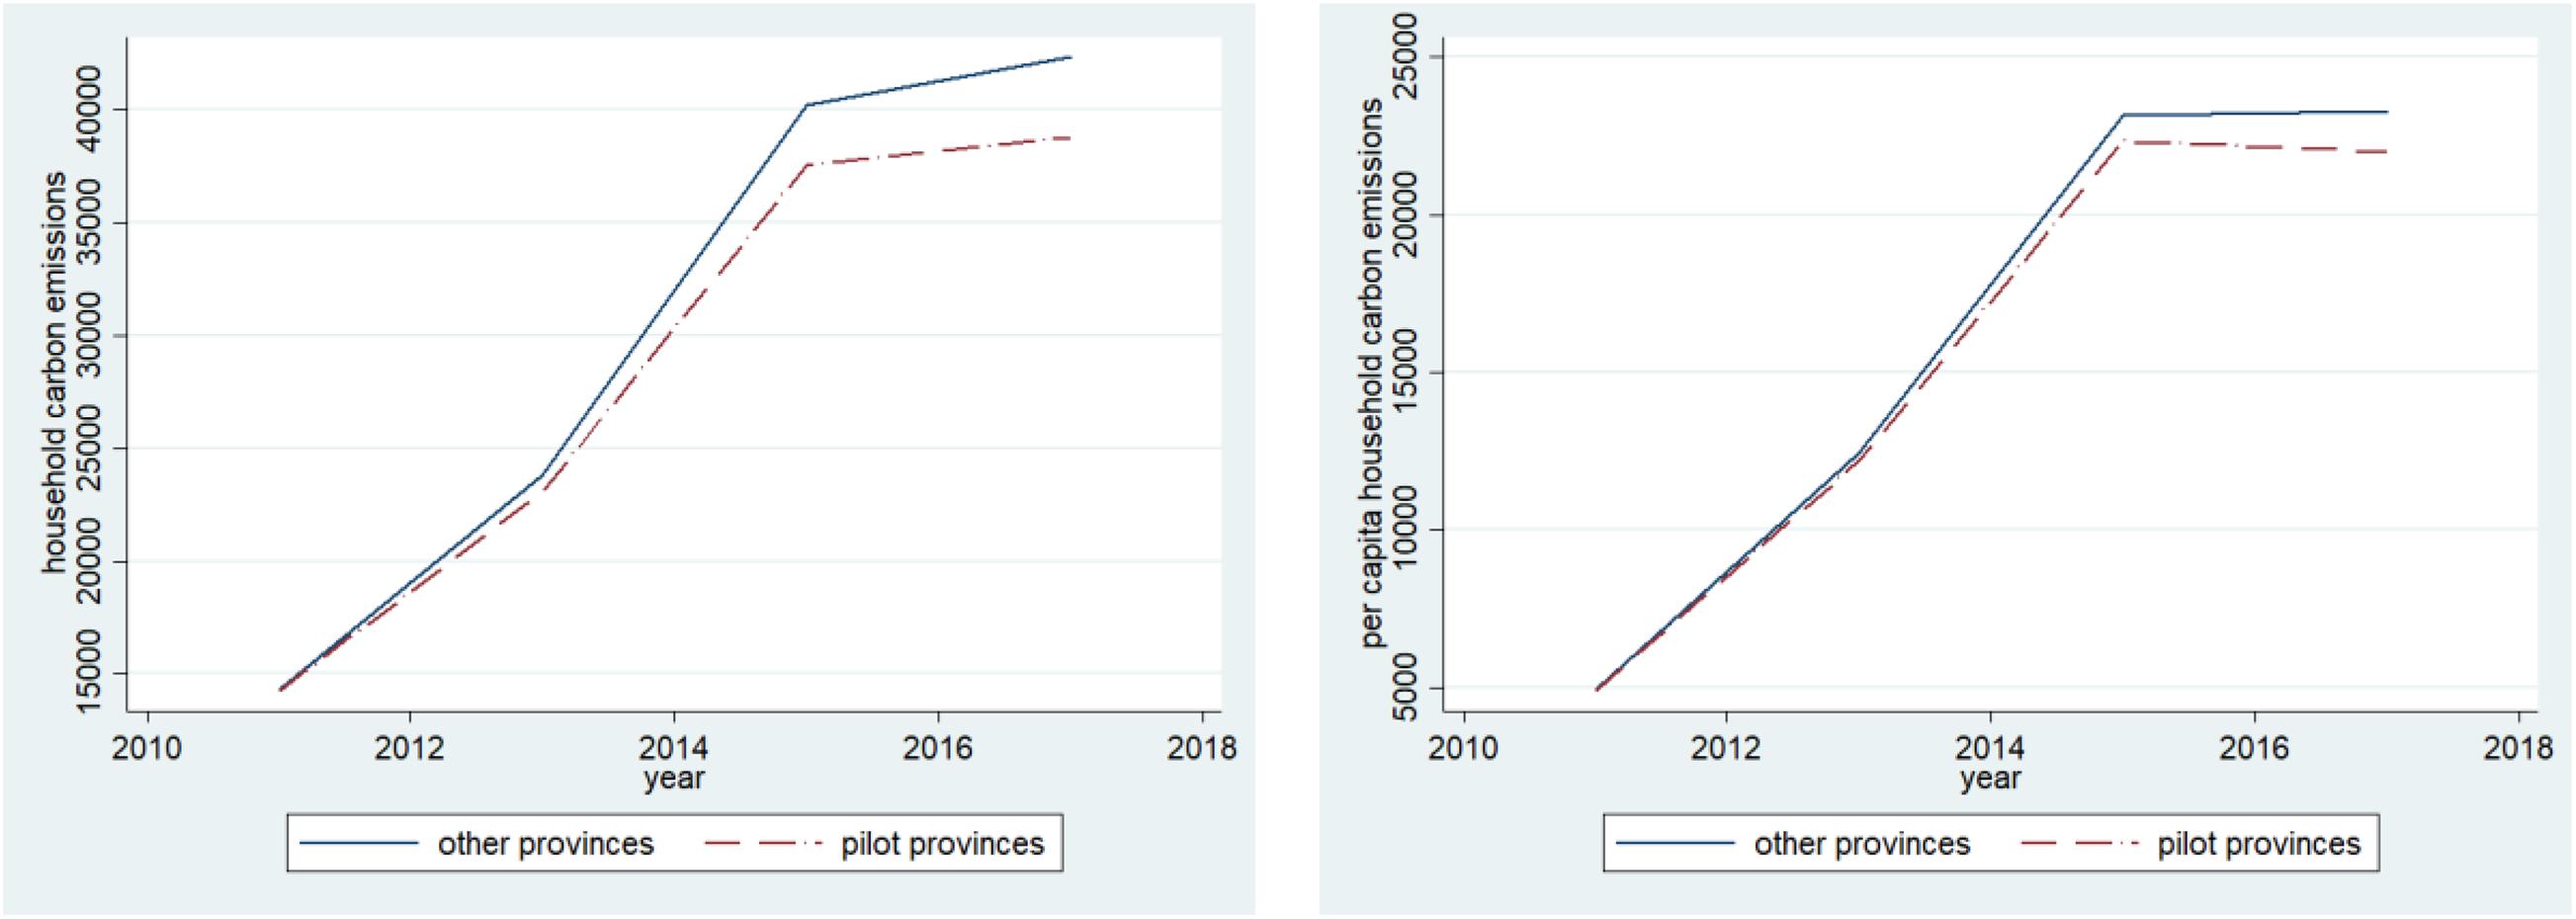
Figure 1. Trends in carbon emissions in low-carbon pilot provinces and non-low-carbon pilot provinces from 2011 to 2017.
Meanwhile, household carbon emissions in non-low-carbon pilot provinces continued to rise during this period. Moreover, household carbon emissions in both low-carbon pilot provinces and non-low-carbon pilot provinces showed a decline in growth beginning in 2017. Therefore, Figure 1 does not lend support to the notion that the implementation of LCPPs can promote a reduction in household carbon emissions. We must further evaluate the implementation effects of LCPPs from an empirical perspective.
The LCPP involves three specific tasks: setting targets for energy conservation and emission reduction, formulating supporting policies for low-carbon development, and advocating a low-carbon and green lifestyle. Based on the requirements of the LCPP and drawing on the research results of Grossman and Krueger (1995) and Auffhammer et al. (2016), our discussion begins with the consumption effect (influencing energy consumption) and structural effect (controlling household consumption) of the LCPP. These two aspects constitute the mechanism whereby LCPPs affect household carbon emissions.
First, LCPPs reduce carbon emissions through consumption effects. Under the constraints of LCPPs, not only will enterprises minimize energy consumption through various channels, but households will also adopt multiple measures to reduce household energy consumption. Specifically: (1) at the government level, the government and environmental protection agencies disseminate information on the low-carbon economy in various ways to guide enterprises and residents to a low-carbon and energy-saving lifestyle. For instance, the government requires new households to achieve zero carbon emissions, and guides them not to use disposable plastic bags. Such measures make residents gradually accept a low-carbon lifestyle. (2) At the enterprise level, in response to environmental regulations, enterprises continue to improve their environmental protection technology, thereby reducing the carbon emissions per unit of a product and ultimately decreasing the product’s carbon emission coefficient, achieving the goal of reducing total carbon emissions. (3) At the household level, the implementation of LCPPs deeply embeds the concept of a green and low-carbon lifestyle. Residents actively choose low-carbon products and low-carbon travel methods, thereby reducing their carbon emissions. After implementing the LCPP, the joint efforts of the government, enterprises, and households will reduce household energy consumption and ultimately reduce household carbon emissions.
Second, LCPPs affect household carbon emissions by affecting the household consumption structure. Michael and Claas (1995) argue that environmental regulations can bring about technological progress and the upgradation of low-carbon environmental protection technologies, giving birth to new low-carbon products. The literature also confirms that environmental regulations can promote low-carbon technologies (Cheng et al., 2019) and new products (Zhang, 2020). These new low-carbon products will replace older products that embody higher carbon emissions. In response to the advocacy for low-carbon lifestyles, some households will prioritize products that involve lower carbon emissions, which will upgrade the household consumption structure and ultimately reduce household carbon emissions. Thus, LCPPs affect household carbon emissions both directly and indirectly by altering the household consumption structure.
Third, there is a time-lag effect in realizing the impact of LCPPs. The implementation effect of LCPPs is mainly reflected in households’ response to the policies. After implementing LCPPs, it takes time for families to actively change their behaviors and practice a green and low-carbon lifestyle. That is, there is a time lag effect in LCPPs. Due to the time-effectiveness of policies (Zheng and Shi, 2017), the impact of LCPPs on household carbon emissions will gradually decrease with time. Thus, the effect of LCPPs will not be reflected immediately after implementation but will appear progressively and then weaken gradually; that is, there is a time lag effect of LCPPs.
Therefore, we propose the following hypotheses:
H1: The implementation of LCPPs will promote the reduction of household carbon emissions;
H2: The implementation of LCPPs will reduce household carbon emissions by optimizing the household consumption structure.
H3: The impact of LCPPs on household carbon emissions is still heterogeneous.
Research Design
Model Setting
Measurement Model Construction
This study treats the LCPP policy as a quasi-natural experiment. Considering that the second batch of pilots was mainly in cities and the third batch of pilots was only recently launched, there is a possibility of sample errors and data limitations associated with these later batches. Thus, this study was primarily based on the first batch of pilot provinces in 2010. After eliminating the interference in the first batch of pilot cities in 2012, the pilot provinces in 2010 would be the experimental group. The other non-pilot provinces would be the control group. The model to measure the impact of LCPPs on household carbon emissions is:
In Formula (1) HCEit represents the natural logarithm of household carbon emissions i during the period t, LCCit represents whether the province where the household i is located in an LCPP province in the t period Xit represents the control variable of the household i in the t period, and εit represents the random error term.
Calculation of Household Carbon Emissions
We used Lee and Park’s (2007) method to measure household carbon emissions from the perspective of household consumption. The scale of energy consumption by industry published in the China Statistical Yearbook and the carbon emission coefficient published by the United Nations Intergovernmental Panel on Climate Change, respectively, calculate the scale of carbon emissions by industry in China. The calculation method is:
In Formula (2) CEi is the industry i carbon emissions scale, CEPi is the energy consumption of industry i, and CECi is the industry i carbon emission coefficient. According to the sub-industry GDP increment, the sub-industry’s carbon intensity per unit GDP is calculated, the sub-industry’s GDP carbon emissions.
Formula (3) CIi is the carbon emissions per unit of GDP by industry and GDPi is the industry’s GDP incrementi. We classified household consumption expenditure items and multiplied the number of different types of household consumption expenditures by the unit GDP carbon emissions of their industries to obtain the carbon emissions of various household consumption expenditures. Then, we calculated the carbon emissions of various household consumption expenditures. After summing, we derived the total carbon emissions of the household, which is calculated as:
Formula 4 HCEis the household carbon emission, Ci which is the household’s consumption expenditure in the industryi.
Core Explanatory Variables
LCPP (Policy) is the core explanatory variable of our study. The average value of the province’s implementation of the LCPP in the current year and subsequent years is 1; otherwise, it is 0. Our study drew on the research methods of Cheng et al. (2019) and Song et al. (2019). If a province implements an LCPP, all areas of the province will be subject to the policy simultaneously. Because the second and third groups of pilots included mainly cities, the CHFS only specifies the provinces from which the household samples were taken. Therefore, our study included the five provinces—Guangdong, Shaanxi, Liaoning, Hubei, Yunnan, and two cities—Tianjin and Chongqing in the first group of pilot projects target samples for the final low-carbon pilot.
Control Variables
To control the impact of other factors on household carbon emissions, we included the measurement model, the core explanatory variable of LCPP. We also incorporated control variables, including the age of the head of the household (age), the education level of the head of the household (education), family size (family size), house area (house area), whether to migrate (migrate), the urban-rural difference (urban), and family’s region of residence (region). The age measures the age of the head of the household in years of the respondent. The respondent’s education level measures the education level of the head of the household (primary school and below = 0, junior high school = 1, high school = 2, junior college and above = 3); family size is measured as several members in the same household. The number of residents (persons) is estimated; the area of a family’s house is expressed in (square meters). Whether migration occurs is measured by whether the family lives in the location where their household is registered (yes = 1, no = 0). Urban and rural are measured by whether the family’s residence is in a city (yes = 1, no = 0). The family region is measured by the region in which the family resides (eastern = 0, central = 1, western = 2).
Data Specification
Our study used data included in the CHFS, which is conducted once every 2 years. These data contain detailed financial, demographic, and employment information about households, with the sample chosen through a three-stage stratified sampling method proportional to the population size. The database includes survey data from 29 provinces (including autonomous regions and municipalities), 363 counties, 1,439 villages (neighborhood) committees, and 113,873 registered households, of which 77,311 were urban households, accounting for 67.89% of the total sample and 36,562 were rural households, accounting for 32.11% of the total sample. This is consistent with China’s urbanization rate of 60.60% in 2019. Of the eligible households, 56,562 were in the east, accounting for 49.67% of the total sample; 31,795 were in the central region, accounting for 27.92% of the total sample; and 25,516 were in the west, accounting for 22.41% of the total sample. This is consistent with the population’s spatial distribution in China’s eastern, central, and western regions. From the consumption expenditure surveyed by CHFS, 20 household consumption categories were designated, including clothing, food, housing, transportation, education, and medical care. These categories include data on all household consumption expenditures and can fully account for total household carbon emissions. The statistical description of the variables is shown in Table 1.
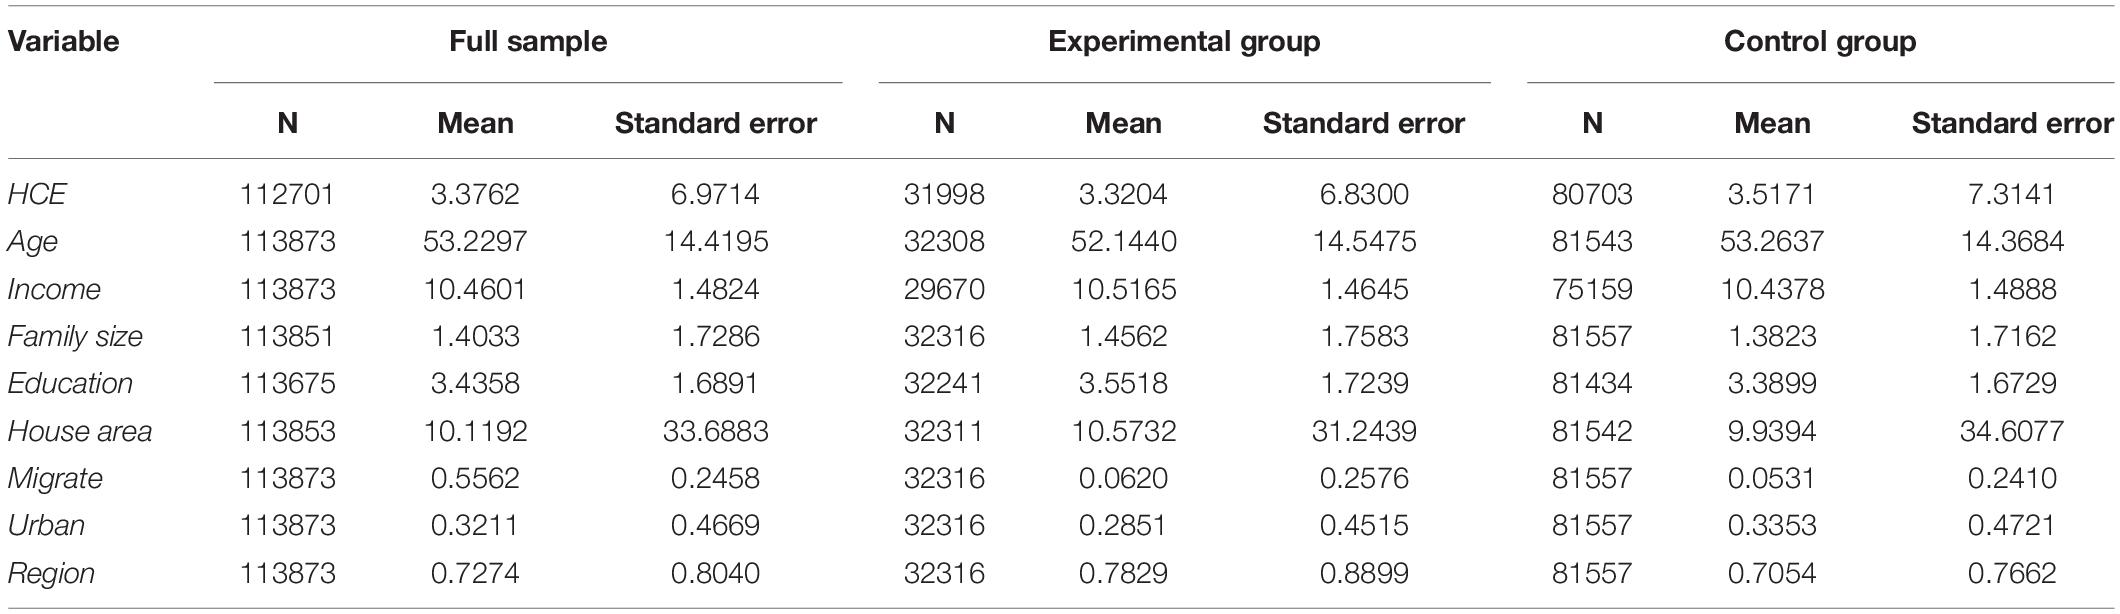
Table 1. Descriptive statistics.
Empirical Results
Benchmark Regression Results
Table 2 reports the results of measuring the impact of LCPPs on household carbon emissions. Since the sample includes household data from 29 provinces in China, which encompass the great majority of China’s population, the estimated results in Table 2 reflect the relationship between LCPPs and household carbon emissions.
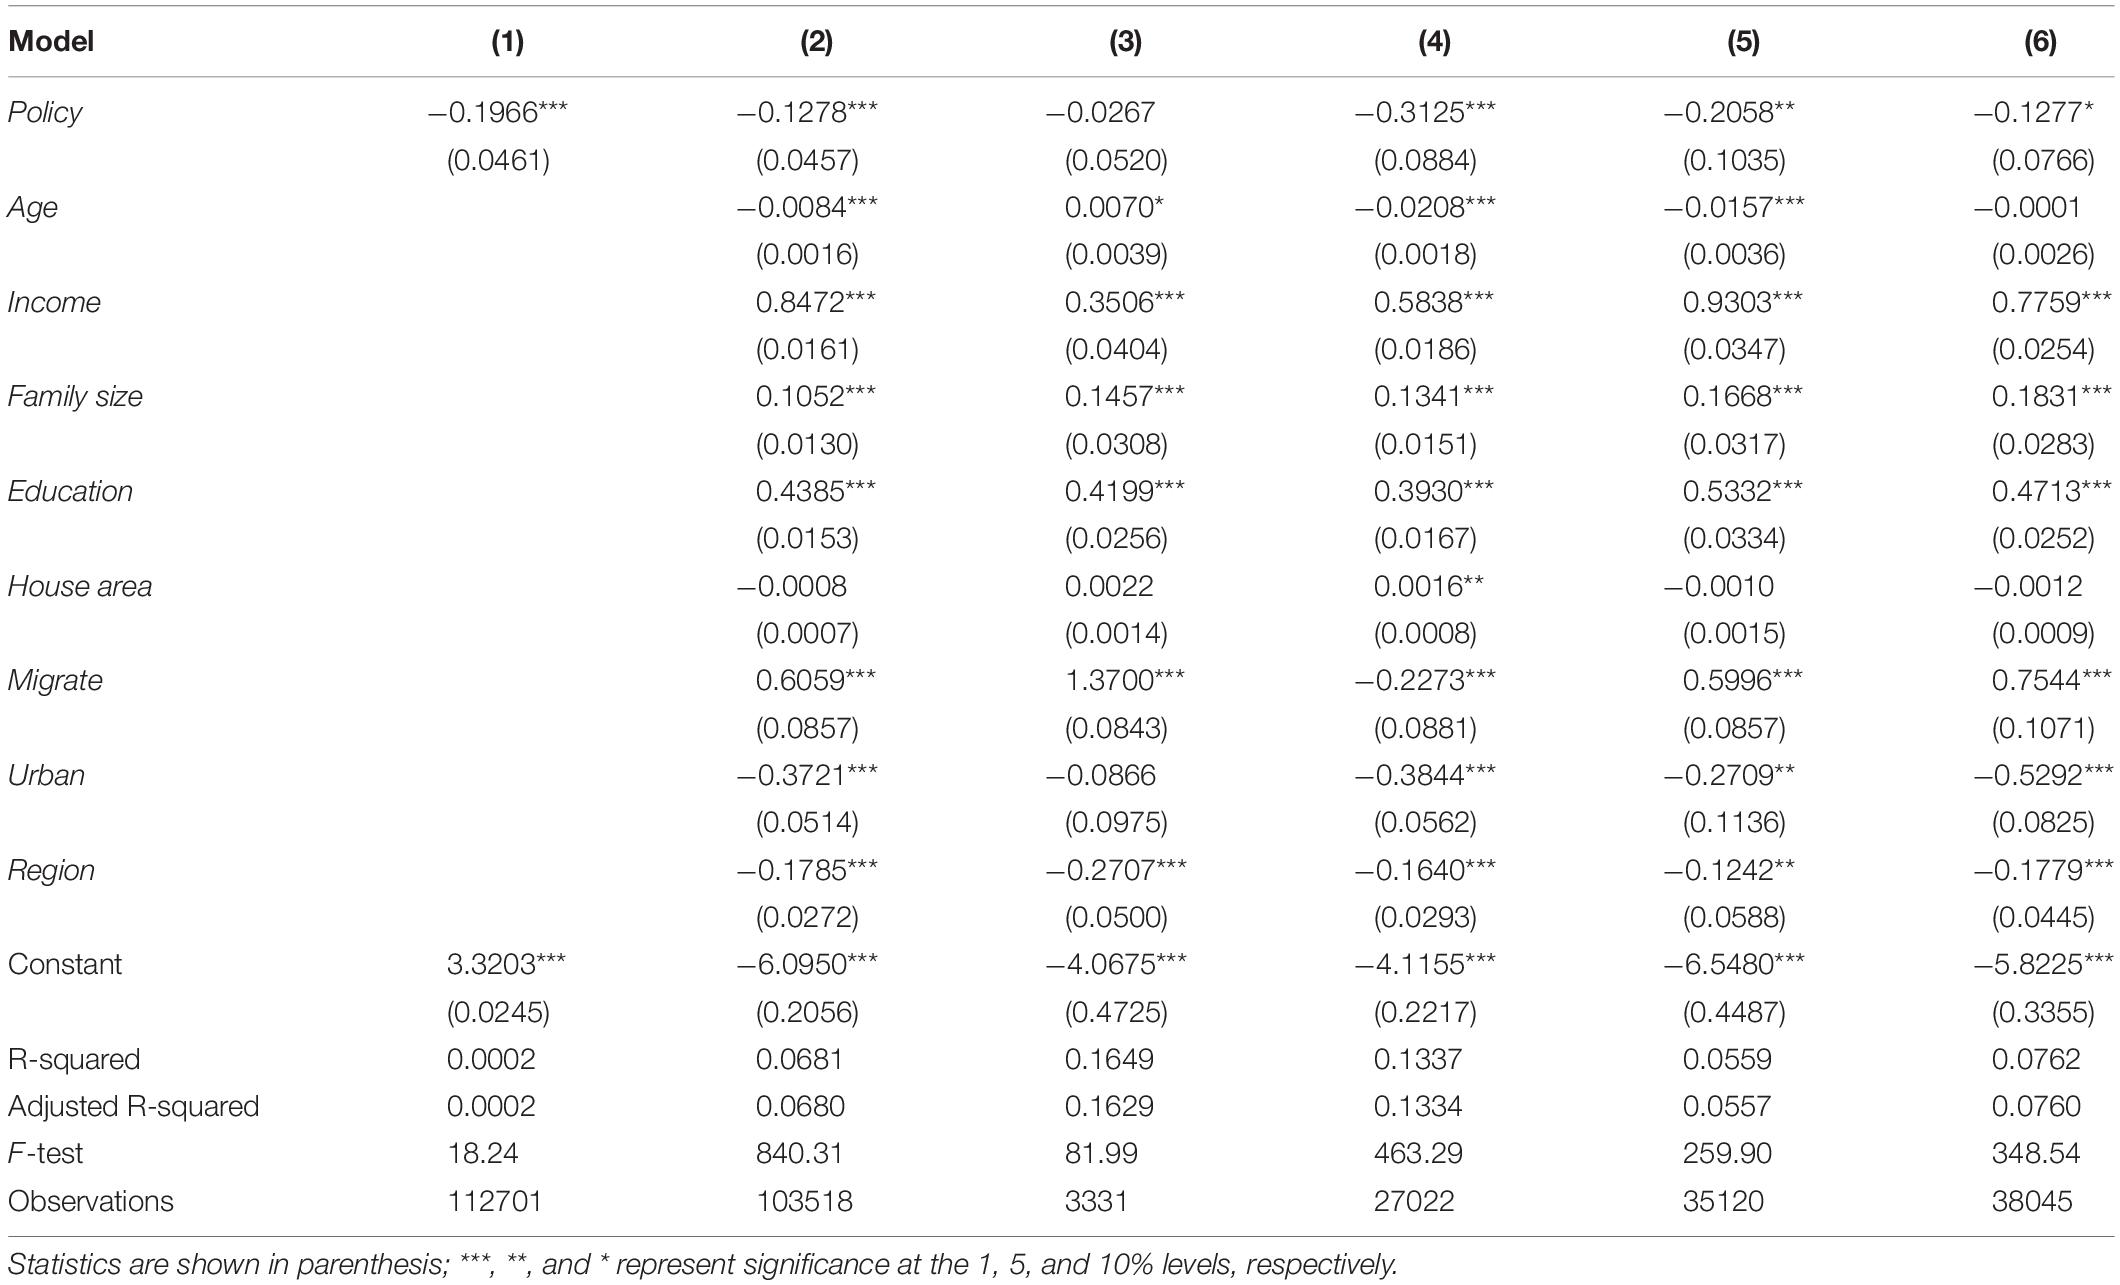
Table 2. Impact of LCPPs on carbon emissions.
Table 2 shows the estimated results LCPPs’ impact on household carbon emissions. Column 1 displays only the variable of LCPPs, without incorporating control variables. Column 2 includes effects of LCPPs and incorporates control variables; Column 3 has sample data for 2011 only; Column 4 has sample data for 2013 only; Column 5 has sample data for 2015 only; Column 6 has sample data for 2017 only.
First, we analyzed LCPPs’ impact on household carbon emissions. Table 2 shows the estimated effects of the LCPP on household carbon emissions. No control variables were incorporated into the evaluation of the impact of LCPPs on household carbon emissions shown in Column 1. The results show that the impact of LCPPs on household carbon emissions is negative, passing the 1% significance level test. Column 2 included control variables in the process of discussing the impact of LCPPs on household carbon emissions. The results show that the impact of LCPPs on household emissions is negative, passing the 1% significance level test. Column 2 discusses the impact of the LCPP from 2011 to 2017 on household carbon emissions, indicating that the LCPP reduces household carbon emissions by an average of 1.83% (12.78%÷7), per year. It shows that the implementation of LCPPs can reduce household carbon emissions by approximately 1.83% annually, consistent with the research results of scholars such as Zhang (2020) and validates Hypothesis 1. One possible explanation is that China’s economic output is dependent primarily on resource input and energy consumption. An increase in energy consumption also generates a corresponding increase in carbon emissions. After China implemented LCPPs, low-carbon pilot areas implemented policies to develop clean energy, optimize the energy structure, and encourage households to replace products that consume high amounts of energy. Thereby reducing household carbon emissions; second, after a low-carbon pilot area is designated, the pilot area gains publicity so that households have a particular awareness of carbon emissions reduction. It is known that residents gradually implement awareness of energy conservation and emissions reduction in their lives.
Second, we analyzed the time lag of the impact of LCPPs on household carbon emissions. There are significant differences in the impact of LCPPs on household carbon emissions in different years. The impact of the LCPP on household carbon emissions in 2011 did not pass the significance level test; the impact on household carbon emissions in 2013, 2015, and 2017 all passed the significance level test. Simultaneously, comparing the impact of LCPPs on household carbon emissions in different years, we found that the coefficient of the impact of LCPPs on household carbon emissions gradually decreases over time. This implies that the LCPP has a lagged effect on household carbon emissions; that is, the implementation of the LCPP will not affect household carbon emissions during the initial period but will impact household carbon emissions in the subsequent period. The possible explanation is that the LCPP will not directly impact carbon emissions (Cheng et al., 2019). There will be a 2- to 3-year time lag from policy implementation to effect. The low-carbon pilot will change over time; thus, the impact of policies on household carbon emissions will gradually decrease.
Third, we analyzed the impact of control variables on household carbon emissions. To accurately study the effect of low-carbon policies on household carbon emissions, control variables were also added to Column 2. Because our primary focus is the impact of low-carbon policies on household carbon emissions, the effect of control variables on household carbon emissions is not discussed here in detail.
Influencing Mechanism Analysis
As a result of our analysis, we found that LCPPs can reduce household carbon emissions. The next issue is the transmission mechanism for the impact of LCPPs on household carbon emissions. Our study used a two-stage mediating effect model to analyze the transmission mechanism of LCPPs on household carbon emissions (Baron and Kenny, 1986).
The first stage is the impact of LCPPs on household consumption structure. Based on Formula 1, the following mediating effect model was constructed.
Formula 5 str represents the household consumption structure, and the remaining variables are consistent with those expressed in Formula 1.
In the second stage, a model (Formula 6) is built based on Formula 5 to verify the impact of LCPPs on household carbon emissions through household consumption structure.
If α2 is not significant, there is no mediating effect in the impact of LCPPs on household carbon emissions; otherwise, there is a mediating effect. If α1 is substantial, it means that there is an intermediary variable in the household consumption structure in the impact of the LCPP on household carbon emissions; otherwise, it means that household consumption structure is the only path through which the LCPP affects household carbon emissions. In Formula 6, household consumption structure is measured by the proportion of low-carbon products in the household’s total products. Other variables are consistent with those expressed in Formula 1. Table 3 shows the mechanism of the impact of LCPPs on household carbon emissions.
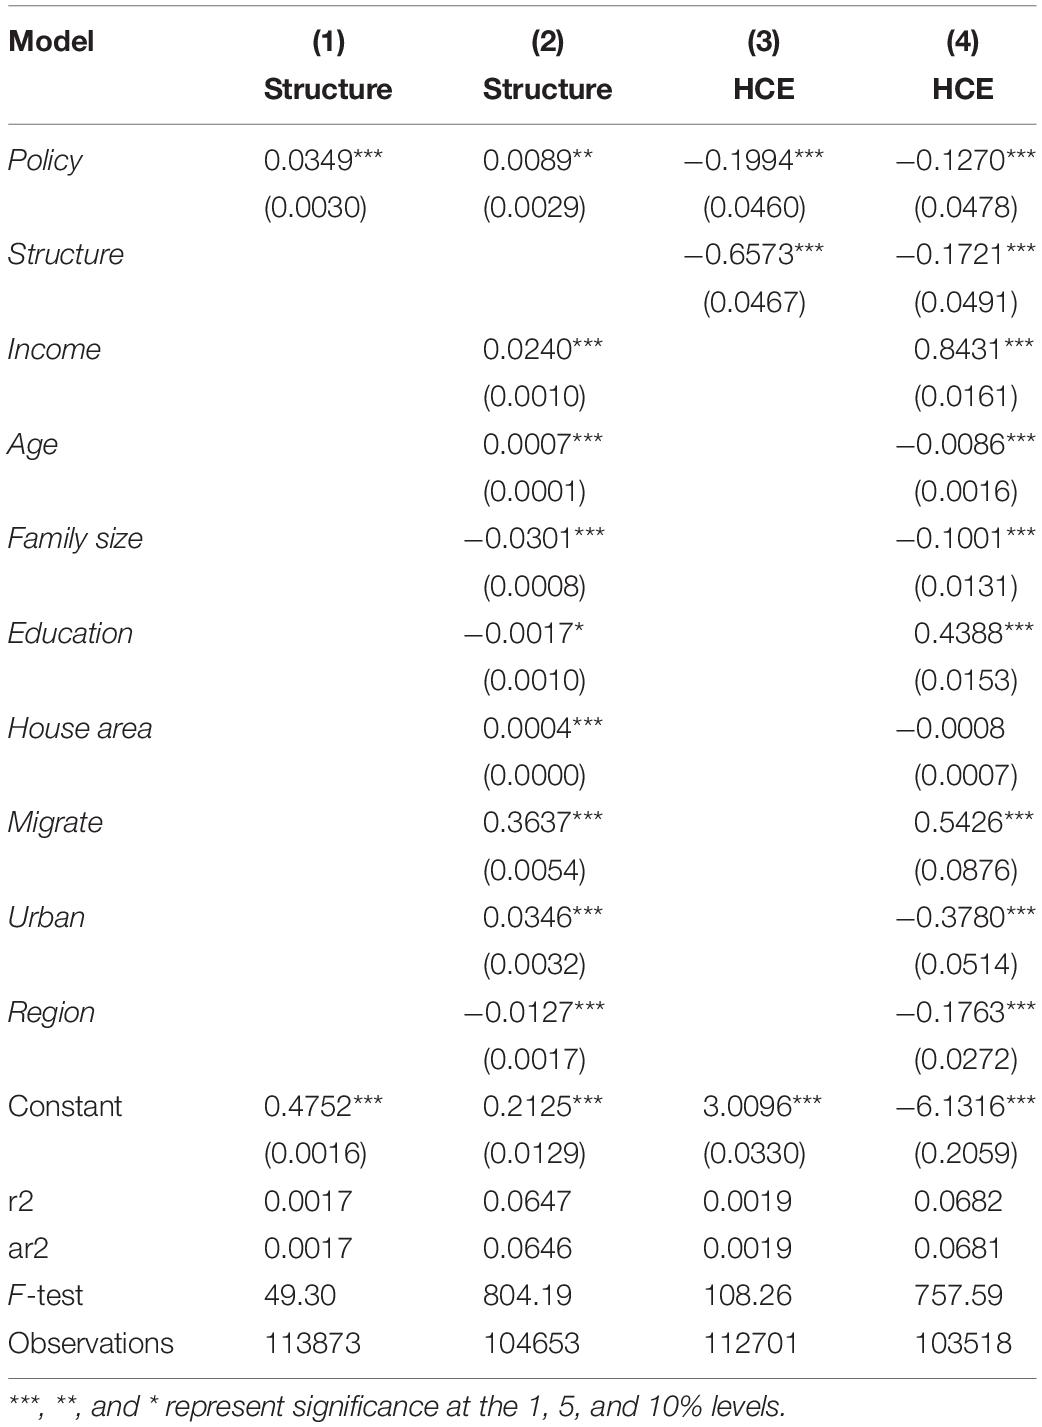
Table 3. Testing the impact mechanism of LCPPs on carbon emissions.
Table 3 shows the mechanism test of the impact of LCPPs on household carbon emissions. Columns 1 and 2 show the impact of LCPPs on household consumption structure. The results show that LCPPs positively impact household consumption structure and that the impact was significant. This supports the idea that the implementation of LCPPs promotes the transformation and upgrading of household consumption structure. The possible explanation is that after the implementation of an LCPP, the local government facilitated change in household consumption structure by advocating green and low-carbon lifestyle and by establishing a low-carbon credit system for residents, which provides incentives for households to choose a low-carbon lifestyle.
Columns 3 and 4 of Table 3 show the impact of LCPPs and household consumption structure on household carbon emissions. The results show that the impact of LCPPs on household carbon emissions is negative, and the significance test is passed. As for the level test, household consumption structure on household carbon emissions is negative and significant at the 1% level. This demonstrates an intermediary variable corresponding to household consumption structure in the impact of LCPPs on household carbon emissions. LCPPs directly affect household carbon emissions and affect household carbon emissions by altering household consumption structure.
To further analyze the impact of LCPPs on household carbon emissions, we have classed household consumption structure into subsistence consumption (subsistence), enjoyment consumption (enjoyment), and development consumption (development). Where subsistence consumption measures the total expenditures on food and clothing; enjoyment consumption is measured by the total expenditure on books, magazines, movie tickets, and travel; and development consumption is measured “courtesy demands reciprocity” between family groups. Table 4 shows the regression results of LCPPs on household consumption structure and the regression results of LCPPs and consumption structure on household carbon emissions.
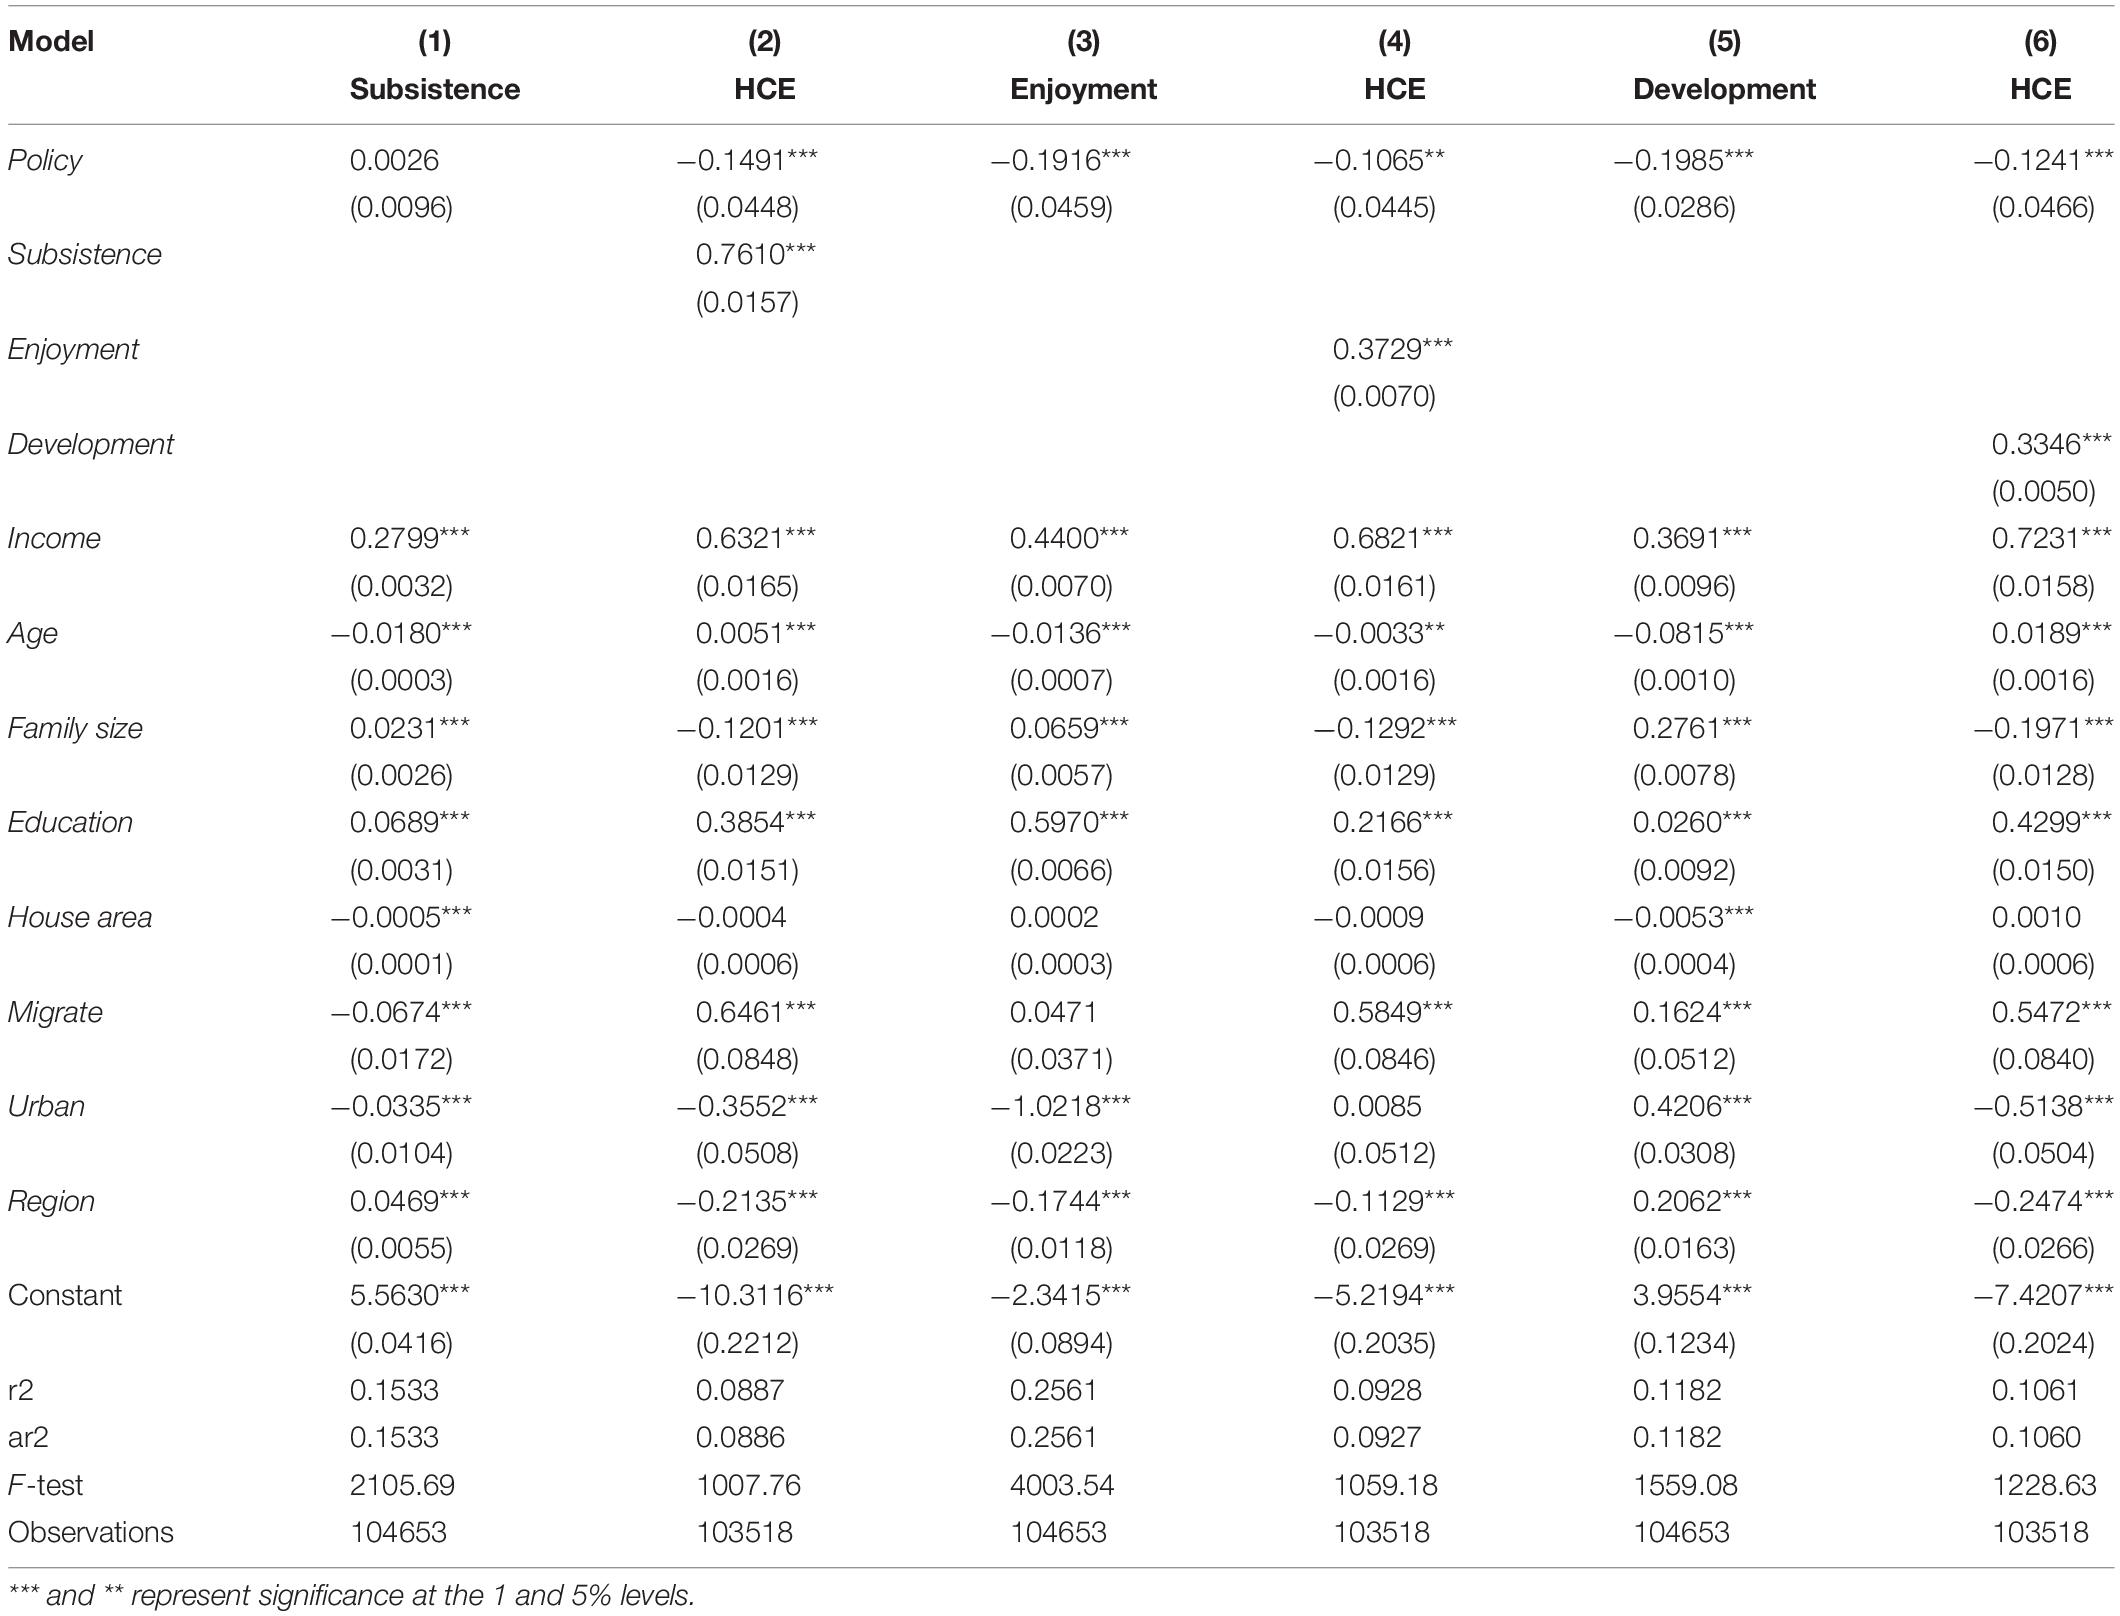
Table 4. Mechanism analysis.
The analysis of the mechanism of action in Table 4 illustrates that an LCPP positively impacts subsistence consumption, but it does not pass the significance level test; the LCPP negatively impacts both enjoyment-oriented consumption and development-oriented consumption and passes the significance level test. Simultaneously, the impacts of subsistence consumption, enjoyment consumption, and development consumption on household carbon emissions are all positive, and all have passed the significance level test. This demonstrates that the implementation of an LCPP will reduce household carbon emissions by lowering household enjoyment and development consumption expenditures, proving that the impact of LCPPs on household carbon emissions is an intermediary variable in household consumption structure.
For the next step in the analysis, we divided products consumed by households according to the carbon emission coefficient per unit of GDP by industry. We designated products with a carbon emission coefficient lower than 2 as low-carbon emission products (low-carbon products), those with a carbon emission coefficient between 2 and 3 as general carbon emission products (general products), and products with a carbon emission coefficient of 3 or greater as high-carbon emission products (high-carbon products). Table 5 shows the regression results of LCPPs on household consumption of carbon emission products of different types.
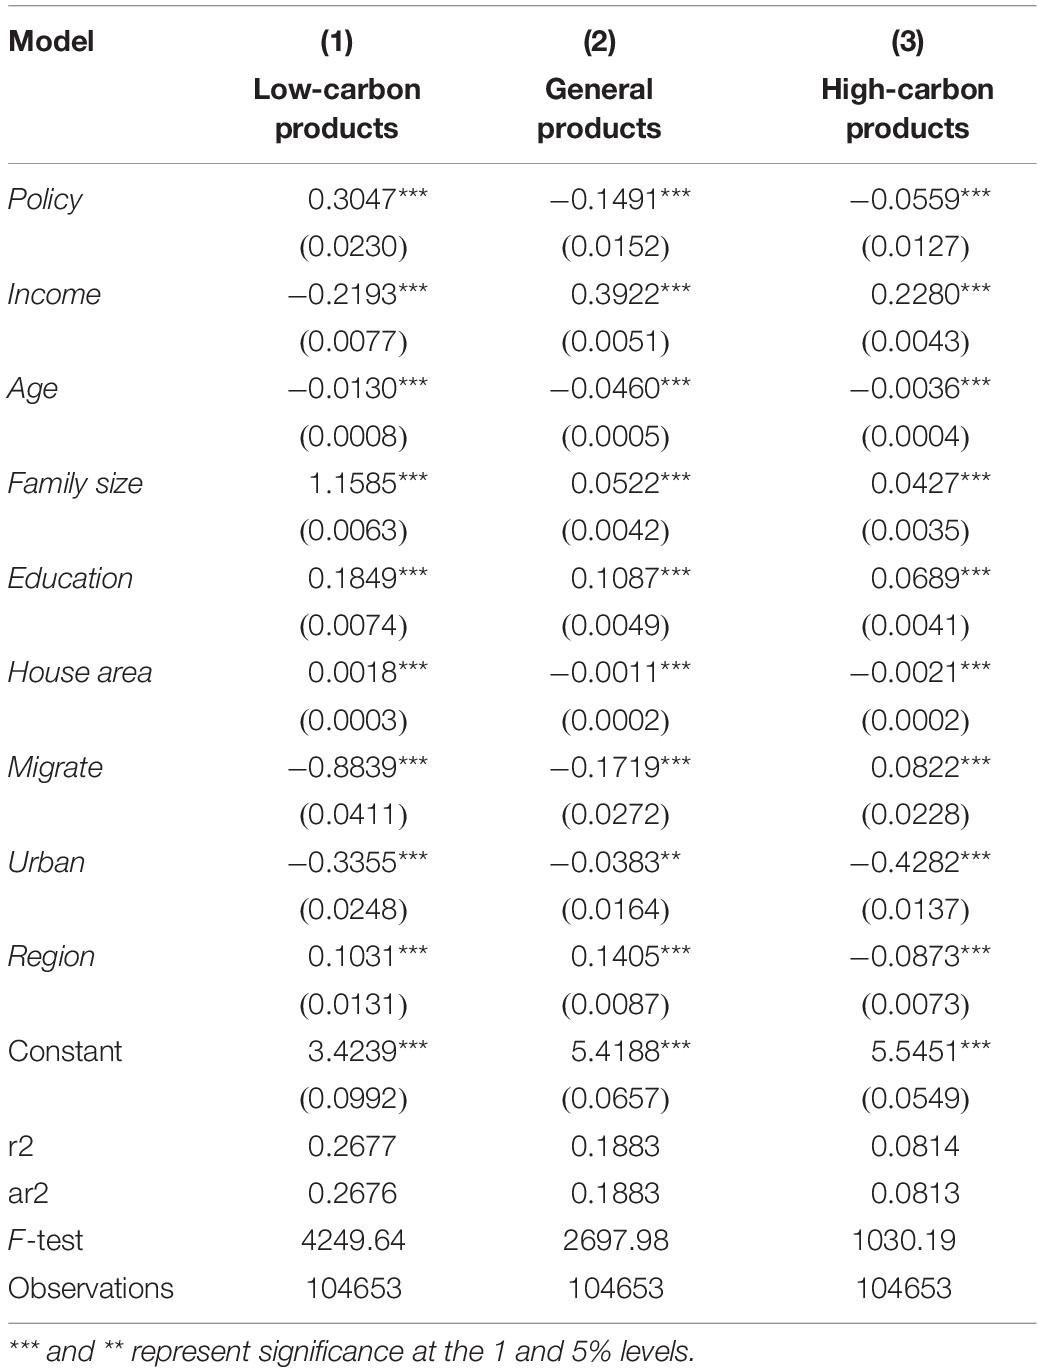
Table 5. Heterogeneity of impacts of LCPPs on household carbon emissions.
Table 5 displays the impact of LCPPs on household consumption of different carbon emission products. The regression results in Table 5 illustrate that the impact of LCPPs on low-carbon emission products is positive, and it affects both general carbon emission products and high-carbon emission products. The impact of the products is negative, and all have passed the significance level test. This demonstrates that LCPPs will reduce household consumption of high-carbon emission products and increase low-carbon emission product consumption. The most likely explanation is that the implementation of the LCPP changes residents’ consumption concepts and makes households aware of carbon emissions’ impact on society. Further, it enables residents to reduce their consumption of high-carbon products and increase their low-carbon product consumption.
Analyzing the mechanism of action reveals that the LCPP directly impacts household carbon emissions and indirectly impacts household carbon emissions by affecting household consumption structure; Hypothesis 2 is verified. Since the impact of policies on family lifestyles will also indirectly affect the guidelines, when discussing the impact of family policies, lifestyles must be considered.
Further Analyses
Endogenous Discussion
To strengthen the persuasiveness of conclusions about how LCPPs reduce household carbon emissions, we used the propensity score matching method to match cities with implemented LCPPs with those that have not so that endogenous low-carbon emissions could be determined. The effects of the implementation of LCPPs are shown in Table 6.
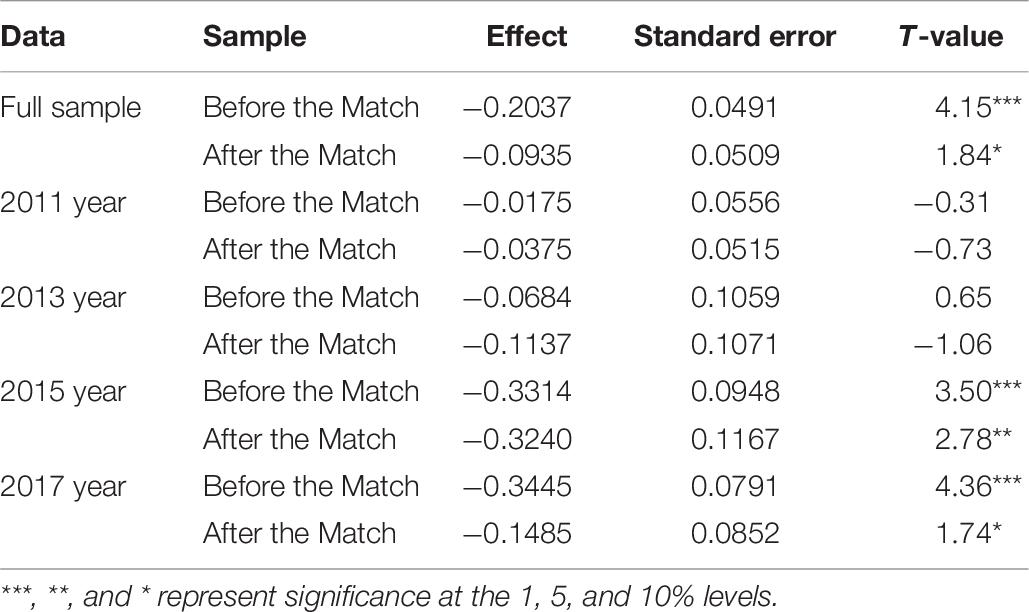
Table 6. Estimation results based on PSM method.
Table 6 illustrates that after implementing an LCPP, household carbon emissions were reduced by a factor of 0.0935, consistent with the results estimated in Table 2. However, the LCPP estimated by propensity score matching will have a low impact coefficient on household carbon emissions. Estimated results in Table 2 show that the implementation of LCPPs can reduce household carbon emissions. At the same time, there is a certain endogeneity between LCPPs and household carbon emissions. The existence of endogeneity causes overstatement of the effect of LCPPs. Table 6 also shows the impact of LCPPs on household carbon emissions in different periods. The results in Table 6 show that the implementation effects of LCPPs in 2011 and 2013 were not significant. This again verifies the notion that the LCPP has a lagging impact on household carbon emissions. It also shows that the endogenous relationship between the LCPP and household carbon emissions should lead to the early implementation of LCPPs.
Heterogeneity Analysis
Regional Differences
There are significant differences in the natural resource endowments and economic development levels of different regions. To further discuss the implementation effects of LCPPs, we draw on Song et al.’s (2020) method and apportion the household sample into three regions: east, middle, and west. Regression results associated with regional differences are shown in Table 7, with Column 1 listing the result for the eastern household sample, Column 2 the result for the central household sample, and Column 3 the result for the western household sample. From the results of the regional differences in Table 7, we see that the LCPP negatively impacts household carbon emissions in the eastern and central regions, passing the 1% significance level test. However, the impact of the LCPP on household carbon emissions in the western region is negative and failed the significance level test. A possible explanation for this result is that the eastern and central areas are relatively insufficient in resources. Conversely, the western region is relatively rich in resources, making it easier for families in the western region to rely on natural resources and fall into the “resource curse” dilemma, which will inhibit the impact of LCPPs on their household carbon emissions.
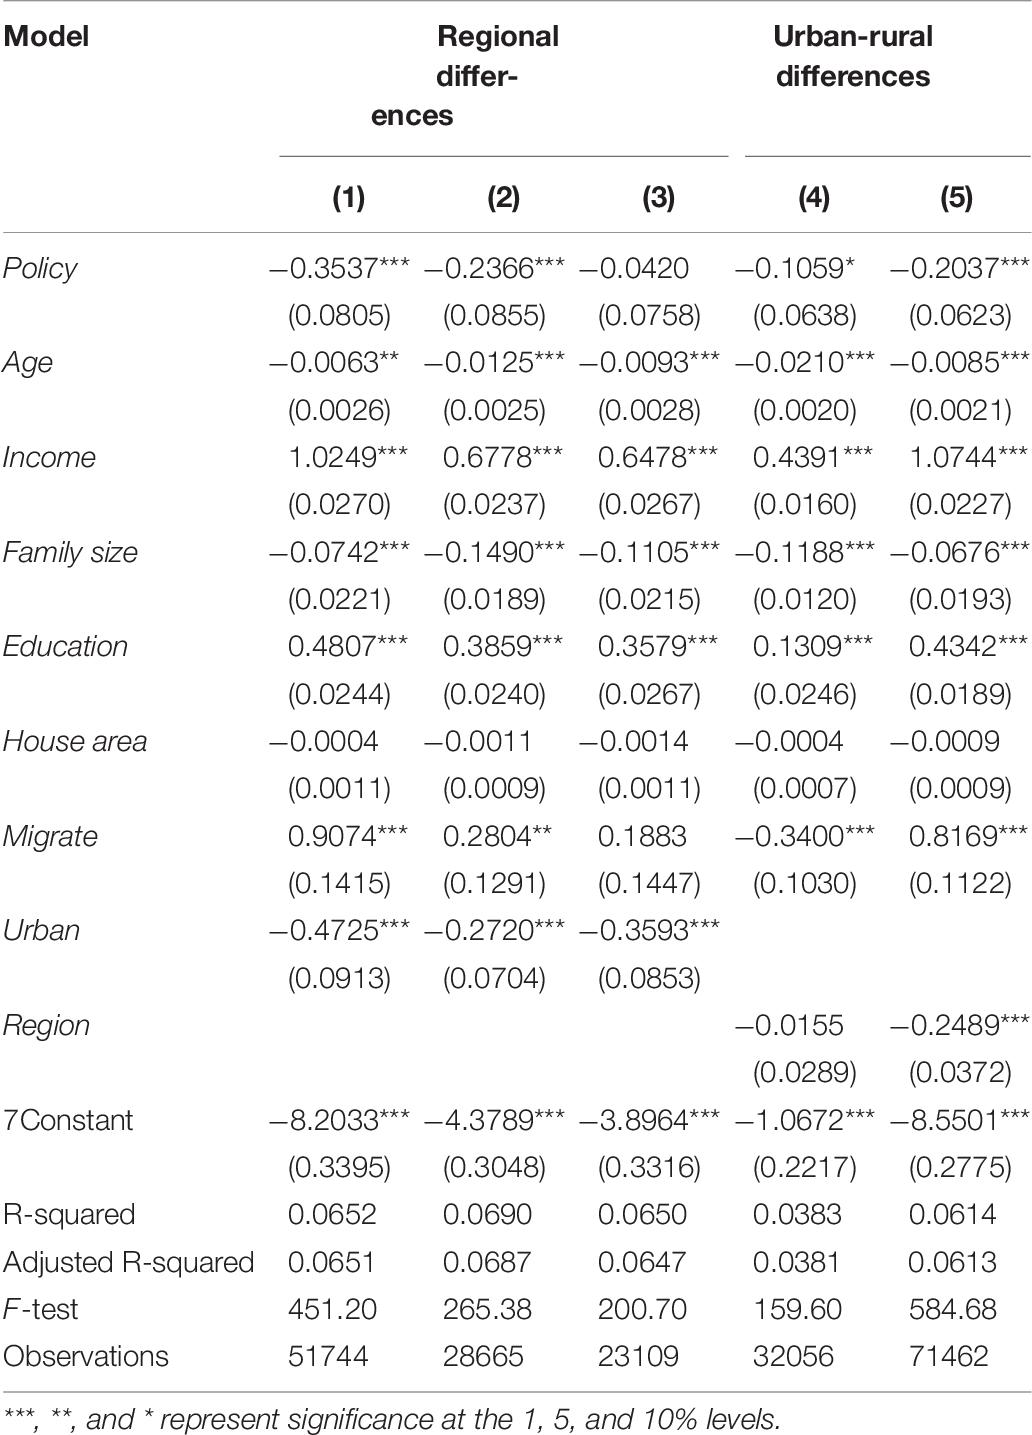
Table 7. Heterogeneity analysis.
Urban-Rural Differences
The impact of LCPPs on urban households and rural households may also differ because of differences in information acquisition and the understanding of pilot policies. To test for this, we segregated sample households into urban and rural categories. Table 7 shows the regression results for the urban-rural differences. The rural samples results are reported in (4), and those of urban samples in (5). From the urban-rural disparities in Table 7, it can be seen that the LCPP negatively impacts rural and urban household carbon emissions and has passed the significance level test. However, the LCPP has a more significant impact on urban household carbon emissions than rural household carbon emissions. It shows that the LCPP has the most considerable effect on urban households’ carbon emissions, while the impact on rural households’ carbon emissions is relatively small. The possible explanation for this result is the implementation of the LCPP. Urban households can take appropriate measures to implement the LCPP. However, rural areas’ energy infrastructure is relatively simple, and there are fewer energy options for rural households.
Conversely, the energy infrastructure in cities provides options for substitution between sources. There are more energy options for households in cities, even if some rural households can reduce carbon emissions. However, the environmental conditions in rural areas limit rural household emissions reductions.
Robustness Test
To analyze the robustness of the impact of LCPPs on household carbon emissions, we examine four aspects described here. First, to eliminate distortions due to outliers, we adopted the tailing method to deal with the highest and lowest 5% samples of the explained variables. The estimated results are shown in Column 1 of Table 8. Second, because of the particularity of municipalities directly under the central government’s administrative control, this section excludes data for Beijing, Tianjin, Shanghai, and Chongqing. The estimated results are shown in Column 2 of Table 8. Third, in the previous empirical analysis process, the carbon emission indicators were measured by taking the natural logarithm of household carbon emissions. We have used the natural logarithm of household carbon emissions per capita to measure carbon emissions. The estimated results are shown in Column 3 of Table 8. Fourth, in the foregoing analysis, the LCPP adopted the first group of low-carbon pilot sample areas as natural experimental areas. This section uses the number of times “carbon reduction,” “low carbon,” and “carbon emissions” appear in local government work reports. As the core explanatory variable of the LCPP, the impact of the LCPP on household carbon emissions is discussed. The estimated results are shown in Column 4 of Table 8.
Table 8. Robustness test.
The estimated results in Columns 1 through 4 of Table 8 show that LCPPs negatively impact household carbon emissions, and all results passed the 1% significance test. The estimated coefficient of emissions is substantially the same as the initial analysis. This supports the robustness of the finding that LCPPs can help reduce household carbon emissions, supporting the previous results.
Conclusion and Policy Recommendations
After matching China’s macro data with CHFS data, using a logical model to test the impact of LCPPs on household carbon emissions empirically, conducting heterogeneity analysis and testing for endogeneity, and studying the mechanism of LCPPs on household carbon emissions, we reach the following conclusions. (1) During the study period, LCPPs reduced household carbon emissions by approximately 1.83% each year, and the impact of LCPPs on household carbon emissions has a lag effect. LCPPs affect households over time, and the impact of carbon emissions will gradually decrease. (2) LCPPs directly reduce household carbon emissions and indirectly reduce household carbon emissions by optimizing household consumption structure. Simultaneously, LCPPs will also encourage households to reduce the consumption of high-carbon emission products and increase the consumption of low-carbon emission products, thereby reducing household carbon emissions. (3) The impact of LCPPs on household carbon emissions is also significantly heterogeneous. The LCPP mainly affects household carbon emissions in the country’s eastern and central regions. The effect on household carbon emissions in the western region does not pass the significance test. Moreover, the LCPP mainly affects urban household carbon emissions, while the impact on rural household carbon emissions is relatively small.
This article’s conclusions provide implications for supporting low-carbon cities’ construction and promoting household energy conservation and emission reduction. The specific policy recommendations are as follows:
(1) Expand the scope of LCPPs to promote household energy conservation and emissions reduction. This study found that LCPPs have reduced household carbon emissions, indicating that the implementation of LCPPs has addressed the issue of deviation from the implementation of past environmental policies. In the future, it should be possible to promote household energy conservation and emission reduction by expanding the scope of implementation of LCPPs, which is also an essential part of improving energy conservation and emissions reduction policies.
(2) Promote household energy conservation and emissions reduction per local conditions. Our research demonstrates that LCPPs affect household carbon emissions by influencing household consumption structure. This means that when implementing LCPPs, local governments can promote household energy conservation and emissions reduction by guiding households to adopt low-carbon lifestyles. Therefore, in implementing LCPPs, local governments should create specific policies consistent with their economic development strategies and levels based on households’ characteristics in the region and the prevailing status of carbon emissions. That there are significant differences in the impact of LCPPs on the carbon emissions of different sample households. For relatively small western regions and rural areas, but for eastern and central areas and urban households, LCPPs should continue to be implemented.
(3) Establish a long-term mechanism for low-carbon policies. This paper finds that the carbon emission reduction effect of LCPPs has a hysteresis effect. The carbon emission reduction effect of LCPPs will not appear during the year in which the pilot is implemented. Therefore, it is necessary to build a long-term mechanism to sustain LCPPs and normalize carbon emission reduction policies through mid-term assessment and long-term assessment to ensure the implementation effects of LCPPs.
(4) Develop low-carbon industries and foster a low-carbon industrial system. This study finds that LCPPs can reduce the consumption of products with high carbon emission levels, and increase the consumption of low-carbon emission products. This study also provides new ideas for the economic development of China, which can be extended to other emerging economies. Under the background of global carbon emission reduction, China and other emerging economies can develop low-carbon industries in line with their resource endowment to drive economic development, thereby transforming and upgrading their industrial structure and finally overtaking developed countries.
Author Contributions
ZW was responsible for providing the overall idea. XS was responsible for the other aspects of the content. Both authors contributed to the article and approved the submitted version.
Funding
This work was supported by the National Natural Science Foundation of China (Grant No. 715103173) and the Shandong Province Social Science Planning Research Special Subject (Grant No. 20CSDJ48).
Conflict of Interest
The authors declare that the research was conducted in the absence of any commercial or financial relationships that could be construed as a potential conflict of interest.
References
Aall, C., Groven, K., and Lindseth, G. (2007). The scope of action for local climate policy: the case of Norway. Glob. Environ. Polit. 7, 83–101. doi: 10.1162/glep.2007.7.2.83
Abbasi, F., and Riaz, K. (2016). CO2 emissions and financial development in an emerging economy: an augmented VAR approach. Energy Policy 90, 102–114.
Ahmad, A., Zhao, Y., Shahbaz, M., Bano, S., Zhang, Z., Wang, S., et al. (2016). Carbon emissions, energy consumption and economic growth: an aggregate and disaggregate analysis of the Indian economy. Energy Policy 96, 131–143. doi: 10.1016/j.enpol.2016.05.032
Aristei, D., and Gallo, M. (2016). Does gender matter for firms’ access to credit? Evidence from international data. Financ. Res. Lett. 18, 67–75.
Auffhammer, M., Sun, W., Wu, J., and Zheng, S. Q. (2016). The decomposition and dynamics of industrial carbon dioxide emissions for 287 Chinese cities in 1998-2009. J. Econ. Surv. 30, 460–481. doi: 10.1111/joes.12158
Baron, R. M., and Kenny, D. A. (1986). The moderator-mediator variable distinction in social psychological research: conceptual, strategic, and statistical considerations. J. Pers. Soc. Psychol. 51, 1173–1182.
Bekun, F., Alola, A., and Sarkodie, S. (2019). Toward a sustainable environment: nexus between CO2emissions, resource rent, renewable and nonrenewable energy in 16-EU countries. Sci. Total Environ. 657, 1023–1029.
Cheng, J., Yi, J., Dai, S., and Xiong, Y. (2019). Can low-carbon city construction facilitate green growth? Evidence from China’s pilot low-carbon city initiative. J. Clean. Prod. 231, 1158–1170. doi: 10.1016/j.jclepro.2019.05.327
Duan, H., Zhang, G., Wang, S., and Fan, Y. (2019). Robust climate change research: a review on multi-model analysis. Environ. Res. Lett. 14:033001.
Edenhofer, O., and Seyboth, K. (2013). Intergovernmental panel on climate change(IPCC). Encyclopedia Energy Nat. Resour. Environ. Econ. 26, 48–56. doi: 10.1007/1-4020-3266-8_09
Grossman, G. M., and Krueger, A. B. (1995). Economic growth and the environment. Q. J. Econ. 110, 353–377. doi: 10.1016/B0-12-226865-2/00084-5
Guo, J., Zhang, Y. J., and Zhang, K. B. (2018). The key sectors for energy conservation and carbon emissions reduction in China: evidence from the input-output method. J. Clean. Prod. 179, 180–190. doi: 10.1016/j.jclepro.2018.01.080
He, W., Abbas, Q., Alharthi, M., Mohsin, M., and Khan, D. G. (2020). Integration of renewable hydrogen in light-duty vehicle: nexus between energy security and low carbon emission resources sciencedirect. Int. J. Hydrogen Energy 45, 27958–27968. doi: 10.1016/j.ijhydene.2020.06.177
Ji, Z. Y., Lai, X. F., and Jia, L. J. (2016). Measurement and driving factors of carbon emissions from household energy consumption. China Popul. Resour. Environ. 26, 64–72.
Khanna, N., Fridley, D., and Hong, L. (2014). China’s pilot low-carbon city initiative: a comparative assessment of national goals and local plans. Sustain. Cities Soc. 12, 110–121. doi: 10.1016/j.scs.2014.03.005
Lee, J. W., and Park, S. B. (2007). Impact of consumption pattern changes on environmental pollution in Korea. Korea World Econ. 8, 53–77. doi: 10.1007/978-0-387-71313-7_3
Li, G., Li, L., Choi, T.-M., and Sethi, S. (2019). Green supply chain management in Chinese firms: innovative measures and the moderating role of quick response technology. J. Oper. Manag. 66, 958–988. doi: 10.1002/joom.1061
Li, W., Sun, H., Du, Y., Li, Z., and Taghizadeh-Hesary, F. (2020). Environmental regulation for transfer of pollution-intensive industries: evidence from Chinese provinces. Front. Energy Res. 8:604005. doi: 10.3389/fenrg.2020.604005
Linden, S. (2006). Bulk energy storage potential in the USA, current developments and future prospects. Energy 31, 3446–3457. doi: 10.1016/j.energy.2006.03.016
Liu, X. Y., Wang, L. M., and Zhu, S. W. (2016). Urban sprawl and residential carbon emission: panel data on southern cities in China. J. Southeast Univ. (Philos. Soc. Sci.) 18, 101–108+148. doi: 10.13916/j.cnki.issn1671-511x.2016.05.014
Michael, E. P., and Claas, V. D. L. (1995). Toward a new conception of the environment-competitiveness relationship. J. Econ. Perspect. 9, 97–118. doi: 10.2307/2138392
Mitchell, C., and Connor, P. (2004). Renewable energy policy in the UK 1990-2003. Energy Policy 32, 1935–1947. doi: 10.1016/j.enpol.2004.03.016
Mohsin, M., Taghizadeh-Hesary, F., Panthamit, N., Anwar, S., and Xuan, V. (2020). Developing low carbon finance index: evidence from developed and developing economies. Financ. Res. Lett. 5, 1–5. doi: 10.1016/j.frl.2020.101520
Ouyang, X., and Lin, B. (2015). An analysis of the driving forces of energy-related carbon dioxide emissions in China’s industrial sector. Renew. Sustain. Energy Rev. 45, 838–849. doi: 10.1016/j.rser.2015.02.030
Shi, K., Chen, Y., Yu, B., Xu, T., Chen, Z., Liu, R., et al. (2016). Modeling spatiotemporal CO2 (carbon dioxide) emission dynamics in China from DMSP-OLS nighttime stable light data using panel data analysis. Appl. Energy 168, 523–533. doi: 10.1016/j.apenergy.2015.11.055
Song, H., Sun, Y. J., and Chen, D. K. (2019). Assessment for the effect of government air pollution control policy: empirical evidence from “Low-carbon City” construction in China. Manag. World 35, 95–108+195. doi: 10.19744/j.cnki.11-1235/f.2019.0082
Song, M., Zhao, X., and Shang, Y. (2020). The impact of low-carbon city construction on ecological efficiency: empirical evidence from quasi-natural experiments. Resour. Conserv. Recycl. 157:104777. doi: 10.1016/j.resconrec.2020.104777
Steg, L. (2008). Promoting household energy conservation. Energy Policy 36, 4449–4453. doi: 10.1016/j.enpol.2008.09.027
Taghizadeh-Hesary, F., and Rasoulinezhad, E. (2020). Analyzing energy transition patterns in Asia: evidence from countries with different income levels. Front. Energy Res. 8:162. doi: 10.3389/fenrg.2020.00162
Tong, X. H., Zhou, H. Y., Chen, W., Duan, Z. Y., Xu, M. H., Duan, H. Y., et al. (2020). Study on the measurement of carbon-driven effects from different development stages of industrialization. China Popul. Resour. Environ. 30, 26–35. doi: 10.12062/cpre.20200111
Tong, Y. F., and Zhou, W. (2020). The impact of family population aging on carbon emissions——an empirical study based on the micro perspective of the family. Popul. J. 42, 78–88. doi: 10.16405/j.cnki.1004-129X.2020.03.007
Wang, N., and Chang, Y. (2014). The evolution of low-carbon development strategies in China. Energy 68, 61–70. doi: 10.1016/j.energy.2014.01.060
Yang, L., and Li, Y. (2013). Low-carbon city in China. Sustain. Cities. Soc. 9, 62–66. doi: 10.1016/j.scs.2013.03.001
Yin, X., Chen, W., Eom, J., Clarke, L. E., Kim, S. H., Patel, P. L., et al. (2015). China’s transportation energy consumption and CO2 emissions from a global perspective. Energy Policy 2015, 233–248. doi: 10.1016/j.enpol.2015.03.021
Zhang, H. (2020). Can low-carbon city construction reduce carbon emissions? Evidence from a quasi-natural experiment. Bus. Manag. J. 42, 25–41. doi: 10.19616/j.cnki.bmj.2020.06.002
Zhang, J. J., Ding, L. L., and Sun, L. C. (2019). Research on enterprise carbon emission decision considering the substitution effect of stepped carbon tax and carbon trading. China Popul. Resour. Environ. 29, 41–48.
Zhang, X., Zhang, H., and Yuan, J. (2019). Economic growth, energy consumption, and carbon emission nexus: fresh evidence from developing countries. Environ. Sci. Pollut. Res. 26, 26367–26380. doi: 10.1007/s11356-019-05878-5
Zheng, D., and Shi, M. (2017). Multiple environmental policies and pollution haven hypothesis: evidence from China’s polluting industries. J. Clean. Prod. 141, 295–304. doi: 10.1016/j.jclepro.2016.09.091
Zhou, D., Zhou, F. N., and Wang, X. Q. (2019). Impact of low-carbon pilot policy on the performance of urban carbon emissions and its mechanism. Resour. Sci. 41, 546–556. doi: 10.18402/resci.2019.03.12
Keywords: carbon emissions, low-carbon pilot policies, household characteristics, consumption structure, China
Citation: Sun X and Wang Z (2021) Can Chinese Families Achieve a Low-Carbon Lifestyle? An Empirical Test of China’s Low-Carbon Pilot Policy. Front. Energy Res. 9:655733. doi: 10.3389/fenrg.2021.655733
Received: 19 January 2021; Accepted: 10 March 2021;
Published: 01 April 2021.
Edited by:
Farhad Taghizadeh-Hesary, Tokai University, JapanReviewed by:
Hadi Farabi-Asl, Research Institute for Humanity and Nature, JapanVidya C. T., Centre for Economic and Social Studies (CESS), India
Nandita Mishra, Amity University, India
Copyright © 2021 Sun and Wang. This is an open-access article distributed under the terms of the Creative Commons Attribution License (CC BY). The use, distribution or reproduction in other forums is permitted, provided the original author(s) and the copyright owner(s) are credited and that the original publication in this journal is cited, in accordance with accepted academic practice. No use, distribution or reproduction is permitted which does not comply with these terms.
*Correspondence: Zhenhua Wang, MjAxNDUwMDA1M0BzeWF1LmVkdS5jbg==