- 1School of Automation Engineering, University of Electronic Science and Technology of China, Chengdu, China
- 2AVIC Chengdu Aircraft Design and Research Institute, Chengdu, China
In the dedicated high-precision power quality analyzer, synchronous sampling is required to reduce the effect of spectrum leakage produced by the discrete Fourier transform process. Thus, accurate fundamental frequency measurement is urgently needed. However, due to the harmonics and noise in the power signal, it is difficult to achieve the accurate fundamental frequency measurement. Moreover, with the wide application of high-frequency programmable power supply, the fundamental frequency is gradually increasing, which requires power analyzers to have the abilities of both high precision and a wide range of the fundamental frequency measurement. To solve these issues, a new fundamental frequency measurement architecture used in synchronous sampling is proposed. This architecture consists of a small-point fast Fourier transform module, spectrum refinement algorithm, and a multimodal optimization method to calculate the accurate fundamental frequency under large harmonic conditions. In the practical hardware platform results, this architecture has a large fundamental frequency measurement range from 20 Hz to 200 kHz with a relative error which is <0.004%. The wideband fundamental frequency measurement structure proposed in this article achieves high measurement accuracy.
1 Introduction
With the rapid development of power electronics technology, high-power electrical equipment such as AC motors and electric vehicles, as well as new energy power generation equipment such as solar power stations and wind power stations are gradually widely used in various fields of industry and residential life. And with the access of a larger number of distributed photovoltaic power stations in the low or medium voltage distribution power grids, the harmonic issue of voltage and current generated by the inverters seriously affects the power supply safety and quality of these power networks (Haitao et al., 2018). Moreover, due to the influence of nonlinear high-power electrical loads such as AC motors, electric arc furnaces, and welding machines, harmonic components and waveform distortion are also produced. At the same time, flicker, voltage dips, supply voltage unbalance, high reactive power, and other disadvantageous effects will also be produced due to the existence of nonlinear loads, which not only leads to the decline of power supply operation efficiency but also reduces the safety and reliability of the power supply system (Jain and Singh, 2011; Repak et al., 2018). Therefore, a dedicated power quality analyzer is needed to monitor the power quality parameters in the power grid to improve the efficiency and reliability of the overall power system. The accurate acquisition of power quality parameters is based on the high-precision sampling of voltage and current signals by a power quality analyzer. Moreover, due to the development of programmable power supply and the wide application of variable frequency drives (VFDs), the fundamental frequency of power signal will be much higher or lower than 50/60 Hz in some specific application scenarios. This means that the bandwidth of the fundamental frequency of the power signal to be measured becomes wider, and the frequency of harmonics also increases. It becomes more and more difficult for the power quality analyzer to accurately capture and calculate the power quality parameters.
Because the sampling process is the core part of the power quality analyzer, the study of the sampling method is of great significance to improve the measurement accuracy of power parameters. The sampling methods commonly used in a power quality analyzer are asynchronous sampling, quasi-synchronous sampling, and synchronous sampling. The asynchronous sampling and the quasi-synchronous sampling do not require the sampling rate to be an integer multiple of the signal frequency. When the discrete Fourier transform (DFT) is used to analyze the voltage and current signals sampled by these two sampling methods, it is difficult to accurately calculate the power quality parameters like inter-harmonics and harmonics because of the spectrum leakage and the fence effect (Zhou et al., 2018; Guo et al., 2019). Meanwhile, it is pointed out in the literature (Kuwalek and Otomański, 2019) that the calculation error of the total harmonic distortion (ΔTHD) can reach 4% due to the influence of spectral leakage and fence effect. And to reduce this influence on harmonic analysis and other power parameter calculations, the literature (Jin et al., 2017) processed the sampled data by windowing and interpolation operations, which significantly improved the accuracy of fundamental frequency measurement and harmonic analysis. However, this windowed interpolation method involves complex transformation formulas and heavy computation, which is difficult to apply in real-time power quality monitoring. And in the literature (Tao et al., 2010), the quasi-synchronous sampling method is used to analyze the harmonics. When the power signal frequency varies within ±10%, the relative error of harmonic amplitudes and phase angle is about 0.1%. Similarly, the quasi-synchronous sampling method increases the amount of data and computation in the interpolation section and reduces the operation efficiency.
The synchronous sampling method (Aiello et al., 2007; Jain and Singh, 2011) requires the sampling rate to be an integer multiple of the signal frequency. In theory, this integer cycle sampling of the voltage and current signal realized by the synchronous sampling method can avoid the adverse effects of spectral leakage on the calculation of power parameters (Guo et al., 2019). Song and Yang (2014) studied the harmonic analysis algorithm based on the synchronous sampling architecture. In this study, the relative measurement errors of fundamental and harmonic components are only 0.0019 and 0.003%, respectively. It shows that the synchronous sampling method can significantly improve the analysis accuracy of harmonic components and other power parameters.
To achieve synchronous sampling, high precision acquisition of fundamental frequency is a vital prerequisite. Erm et al. (2019) designed a digital phase-locked loop (PLL) to lock the frequency of the input signal, providing a frequency locking range from 177 to 222 kHz with a locking time of 12.57 us and a delay of 0.8 ns. However, when a PLL circuit is used to measure a signal with a wider bandwidth, it will result in a longer locking time. Meanwhile, the hardware circuit of the PLL is usually more complex and costly to design. When the signal is interfered with noise, harmonics, inter-harmonics, and other adverse effects, the accuracy of the PLL circuit is reduced or even the phase-locking is not possible (Tourigny-Plante et al., 2018). And another simple and direct frequency measurement method is composed of a hardware comparator and a counter, as shown in Figure 1A. In this structure, the highly stable crystal oscillator and a clock synthesizer of Channel A produce a reference signal with a period of T0. And the input signal from Channel B is converted to a square signal with an unknown period of Tx. Then this unknown square signal is counted by the reference signal to get the specific value of the fundamental frequency. However, this hardware implementation also has difficulty in overcoming the fact that the input signal contains harmonics. As shown in Figure 1B, when the input signal contains harmonics, the actual comparison result of the zero-crossing comparator will produce additional zero-crossing points, and measured period Txe of the fundamental component is less than the real period Tx of itself.
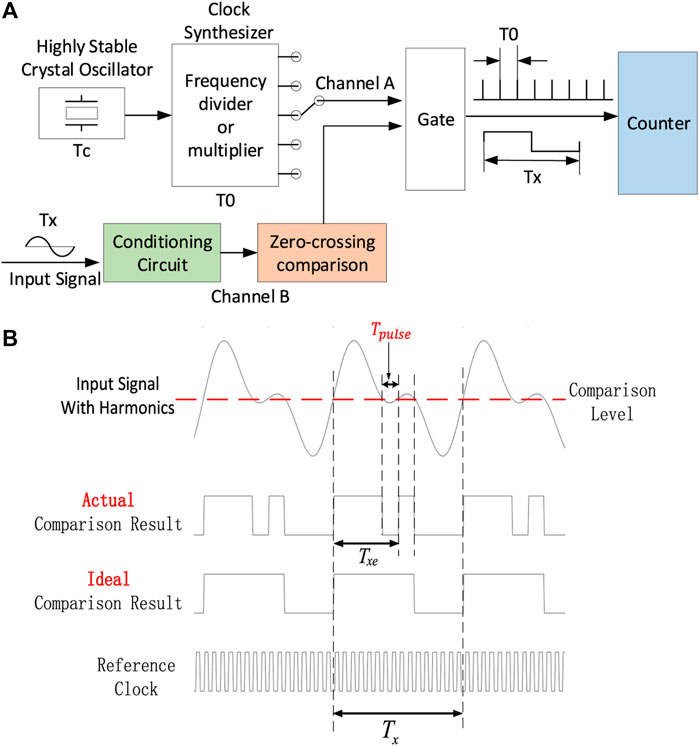
FIGURE 1. Traditional frequency measurement method. (A) Hardware comparator measurement circuit and (B) error source of frequency measurement with harmonics.
As shown in Figure 1, the harmonics caused by nonlinear electrical appliances have been a major obstacle to accurate fundamental frequency measurement. To overcome this barrier, Moreira et al. (2019) designed an online frequency estimation method based on an enhanced least mean square (LMS) method. The fundamental frequency measurement error is lower than 2 mHz under harmonic and inter-harmonic conditions. Mohan et al. (2018) proposed a data-driven method based on the dynamic mode decomposition algorithm to measure the frequency and amplitude in the power grid, and achieved a result with a relative frequency measurement error of less than
Many researchers have studied the accurate measurement strategies of the fundamental frequency under the influence of harmonics, inter-harmonics, noise, and other factors in the power grid. However, most of these studies were focused on the 50/60 Hz power grid system. Therefore, to satisfy the application scenarios where the fundamental frequency varies widely and to accurately measure the fundamental frequency at the condition of large harmonic contents, a new fundamental frequency measurement structure has been proposed in this study, which is based on the fast Fourier transform (FFT) method, spectral refinement method, and the improved particle swarm optimization (PSO) algorithm. Compared with the previous literature, this proposed method has a wider fundamental frequency measurement range from 20 Hz to 200 kHz and achieves far less than 0.02% relative error of fundamental frequency measurement in the case of large harmonics.
The rest of this article is organized as follows. The basic knowledge of the proposed method in this article is given in the section “Fundamental Knowledge of the Proposed Method.” Then the section “Implementation of the Proposed Method” will give enough details to realize the proposed method. Afterward, the “Experiment and Verification” section shows both simulation results and the performance of this proposed method executed in a hardware platform of a power quality analyzer. Finally, the “Conclusion” section concludes this article.
2 Fundamental Knowledge of the Proposed Method
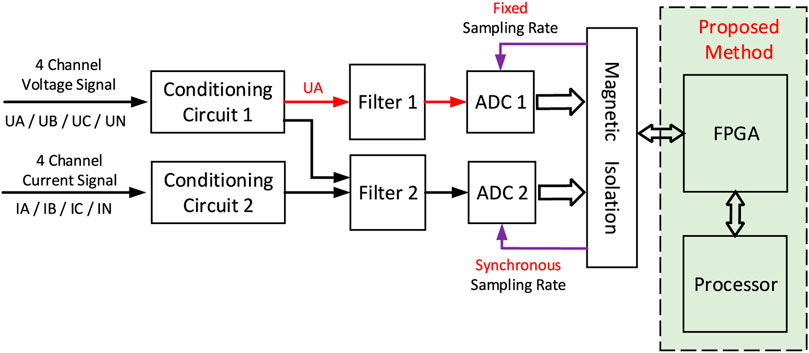
In the actual environment of power quality testing, the harmonic components and noise of a power signal are inevitable. Therefore, in order to get over the challenge of fundamental frequency measurement caused by harmonics and noise, this article proposes a high-precision and wideband fundamental frequency measurement method. This synchronous sampling structure integrating the proposed method is shown in Figure 2.
In the synchronous sampling architecture shown in Figure 2, the three-phase four-wire mode is adopted to synchronously sample 4-channel voltage signals and 4-channel current signals, respectively. Also, the phase-A voltage signal is sampled at a fixed sampling rate by the analog-to-digital convert (ADC), ADC1. Then the fixed sampling data are transmitted to an FPGA chip and a processor chip to calculate the fundamental frequency by the proposed method. After obtaining the fundamental frequency, the synchronous sampling clock will be generated by FPGA to drive the 8-channel ADC chip ADC2 to execute the synchronous sampling process.
Based on this synchronous sampling structure shown in Figure 2, the remaining part of this section will introduce the necessary knowledge to realize the proposed fundamental frequency measurement method.
2.1 Spectrum Refinement Method
Discrete Fourier transform (DFT) is the basis of spectrum analysis of signals. The DFT of a sampled digital signal sequence
where
When the FFT algorithm is used to calculate the spectrum of the signal sequence
In Eq. 2,
Therefore, it is necessary to refine the spectrum based on the signal spectrum obtained by the FFT algorithm with a small number of calculating points N. In this way, the large frequency measurement bandwidth and the calculation efficiency can be satisfied simultaneously.
Based on the frequency resolution
According to the Euler formula, Eq. 1 can be divided into the real part and the imaginary part, and the index k can be replaced by the corresponding frequency value
The spectrum after the transformation of Eq. 4 is still discrete. To obtain the continuous spectrum, the spectrum is needed to be infinitely refined. Since the DFT has the frequency resolution
where
Because the frequency variable f is continuously changing in the neighborhood of
2.2 Close Neighbor Mobility Particle Swarm Optimization Method
A rough fundamental frequency value
In order to reduce the time consumption of the coarse frequency acquisition, a small-point FFT calculation will be adopted. Therefore, the frequency resolution
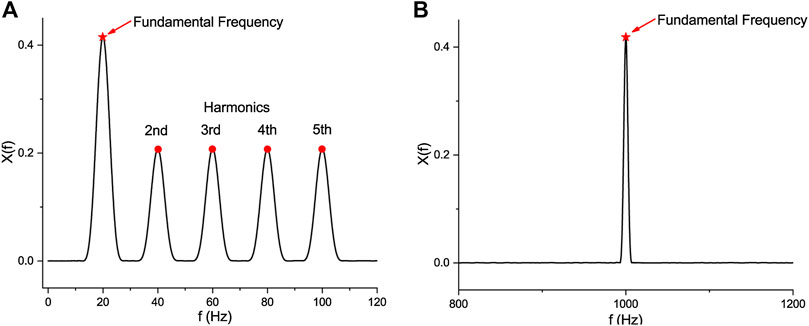
FIGURE 3. Comparison of spectrum refinement results of different fundamental frequencies. (A) 20 Hz fundamental frequency with multi-peak and (B) 1 kHz fundamental frequency with a single peak.
In Figures 3A and 3B, the two spectrum refinement results are based on the rough fundamental frequencies calculated by the 4,096 point FFT algorithm at the 2MSPS fixed sampling rate. The frequency resolution Δf is about 488 Hz at this configuration. Figure 3A shows the refinement result of phase-A voltage signal, where the fundamental frequency is 20 Hz, and this voltage signal is superimposed with 2nd, 3rd, 4th, and 5th harmonics. Since the frequency resolution Δf is much larger than the interval between fundamental frequency and harmonic frequencies, all the four harmonic components still appear in the refined spectrum acquired by Eq. 5. Compared with Figure 3A, the Figure 3B shows the refinement result of a signal with the fundamental frequency of 1 kHz and the same harmonic configuration. And in this condition, there will not be any harmonics in the refinement region. From this comparison, it can be seen that when the fundamental frequencies are low, obtaining the fundamental frequency by the refinement method becomes a multimodal optimization problem.
In order to solve the optimization problem, many researchers have studied this problem. The literature by Li et al. (2021) proposed a model-free optimization method based on the deep reinforcement learning algorithm which is used to optimize the control strategy for virtual synchronous generator. And the literature by Yushuai et al. (2020) proposed an improved Newton descent algorithm to the cooperative energy management task in the energy Internet. However, the optimization task in this article is based on the spectrum refinement algorithm, as shown in Eqs. 5 and 6, and is a model-based optimization task. Eqs. 5 and 6 follow the optimization model. And in some conditions mentioned above, the optimization task will convert to a multimodal optimization issue. To obtain the global maximum in the multimodal optimization problem which is caused by the frequency refinement method at low frequency and avoid falling into the local optima, this article adopts a method called the close neighbor mobility method (Zou et al., 2020) (CNMM) which is based on the PSO method.
The PSO method is a swarm intelligence optimization algorithm inspired by birds’ foraging behavior. Each individual in this bird population is called a particle, and the position vector of each particle represents a solution in the solution space of a certain problem. The purpose of each particle is to keep approaching the position of food which is also called the global optimal solution. In order to achieve this goal, particles are constantly dominated by the personal best position (pbest) of themselves and attracted by the global best position (gbest) of the whole population.
The dimension of the solution space is assumed as m, which means the dimension of each particle is m, too. And the size of this population is N. Then the position vector of each particle can be represented as
In the velocity update Eq. 7, w is called the inertia weight, which is used to illustrate how much velocity information the current particle can retain. A large w means better global searchability; however, the local search ability will be declined. The
And to improve the multimodal optimization ability of the basic PSO method described by Eqs. 7 and 8, the following strategies are needed to be described.
2.2.1 Elite Selection Strategy
The main purpose of the elite selection strategy is to find out the particles which have excellent convergence ability, adaptability, and distribution, and to retain these particles which have good performance. And then, these elite particles will guide the search behavior and evolution of the remaining particles.
The procedure of the elite selection strategy is shown in Figure 4A. To begin this process, the particles in the whole population P are arranged in a descending order according to these fitness values, which are calculated by Eq. 6. And the collection
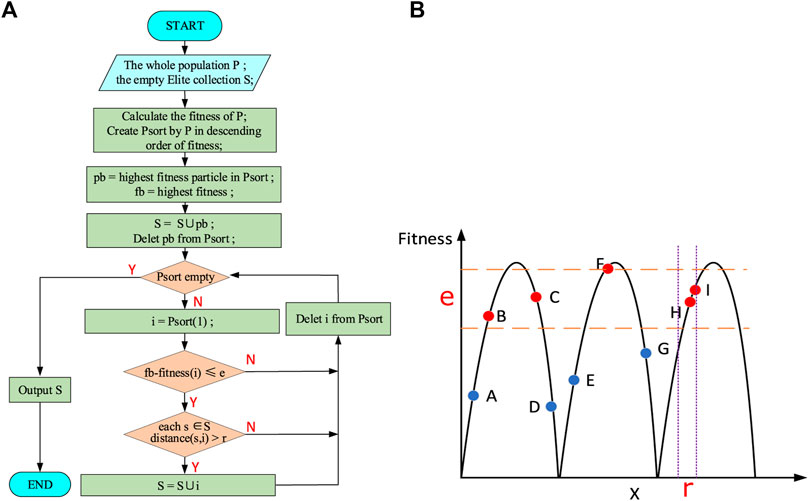
FIGURE 4. Elite selection algorithm. (A) The Procedure of the elite selection algorithm and (B) the Principle of the elite selection algorithm.
In Eq. 9, d represents the dimension of a particle.
To illustrate the elite selection strategy more vividly, we assume there are 9 particles in the population P, and the aim function is a function with three identical peak points. Through the elite selection strategy, Figure 4B can be obtained. In Figure 4B, the circles represent all the particles. It can be found that particle F has the largest fitness, so this particle F is added to the elite population S. Its fitness value is recorded as
2.2.2 Close Neighborhood Strategy
The close neighborhood strategy is based on the concept of a niche in biology. And in biological evolution, organisms usually live and breed with their own species, and form multiple subpopulations. And this condition increases the diversity of the population and improves the ability of local searching.
To improve the local searching ability of the PSO method, a close neighborhood strategy shown in Figure 5A is used instead of the global best position
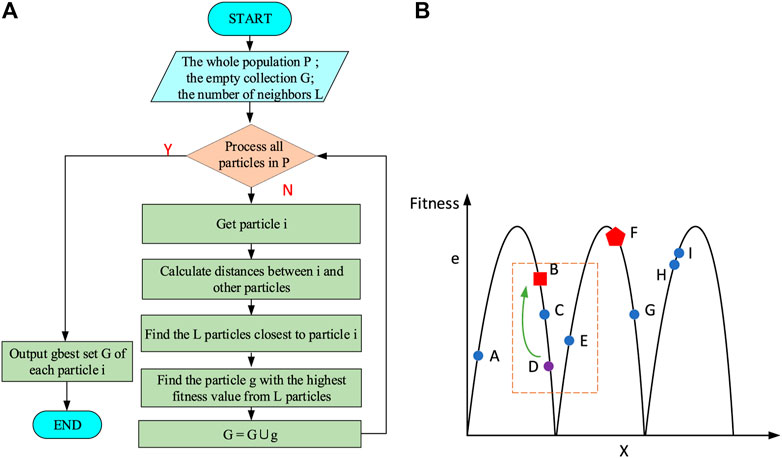
FIGURE 5. Close neighborhood strategy. (A) The procedure of the close neighborhood strategy and (B) the principle of the close neighborhood strategy.
In this equation, the global best particle
As shown in Figure 5B, we assume there are 9 particles in the population. And in the current iteration, particle F is the particle with the largest fitness value. And according to the traditional PSO method, all particles are attracted by particle F in the next iteration. In the close neighborhood strategy, taking particle D as an example, we assume that L equals 3. Then particles B, C, and E are found, which are three particles closest to particle D. And from Figure 5B, it can be seen that particle B has the largest fitness value in this neighborhood. So B is regarded as the neighbor global best particle
Unlike the classical PSO method, where all particles converge to one global best position, the close neighborhood strategy allows the particles to continuously move to the best position in their neighborhood. And this strategy helps the PSO method avoid converging to one local optimum in a multimodal situation.
2.2.3 Differential Evolution Strategy
The differential evolution (DE) strategy uses mutation, crossover, and selection operations to generate a new population from the current population. By these operations, the PSO method can expand the search region and improve the global optimization ability.
First, the mutation operation is realized using Eq. 11.
where
Based on mutation result
where
After finishing the mutation and crossover operation, a selection process is used to form the final new population according to Eq. 13.
In Eq. 13,
This differential evolution strategy generates the new population by mutation, crossover, and selection operation on the current population. This strategy improves the abundance of individuals in the population and expands the search scope.
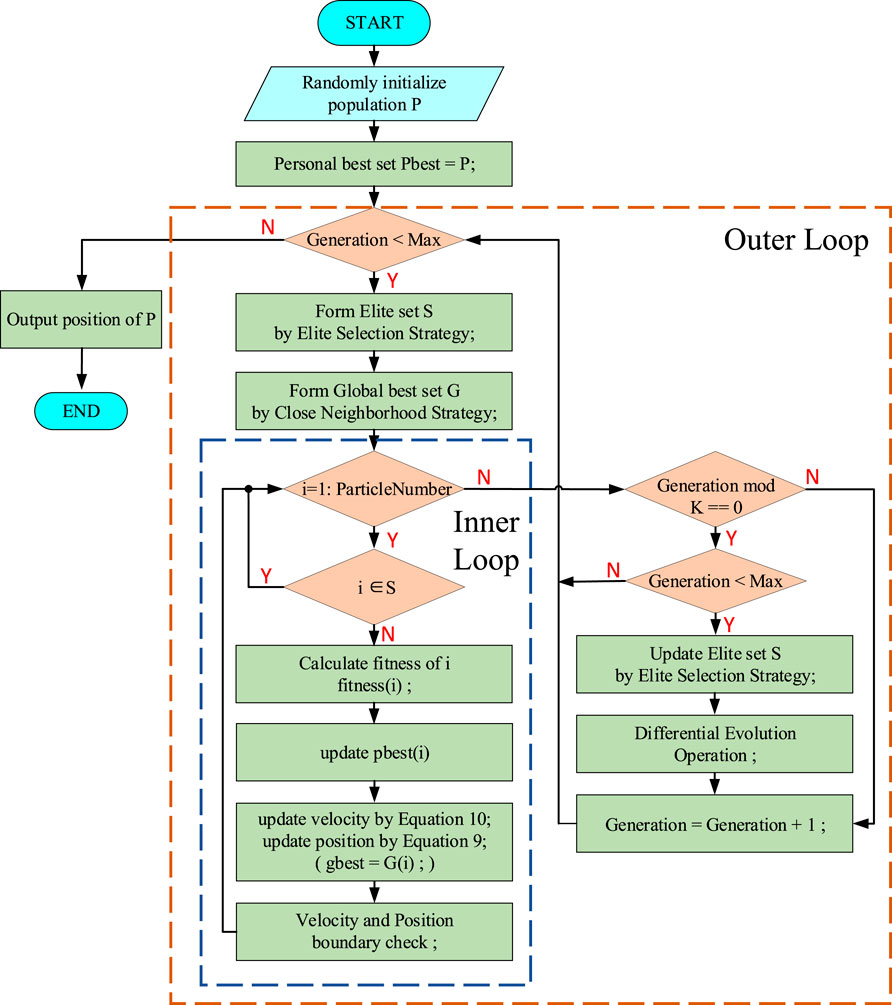
Based on the above strategies, the procedure of the complete CNMM PSO algorithm is shown in Figure 6. At the beginning of this procedure, the initial population P is generated randomly, and each particle in P has its own velocity vector
3 Implementation of the Proposed Method
Based on the spectrum refinement method and the CNMM PSO algorithm described above, the high precision and wide range fundamental frequency measurement architecture proposed in this article are shown in Figure 7.
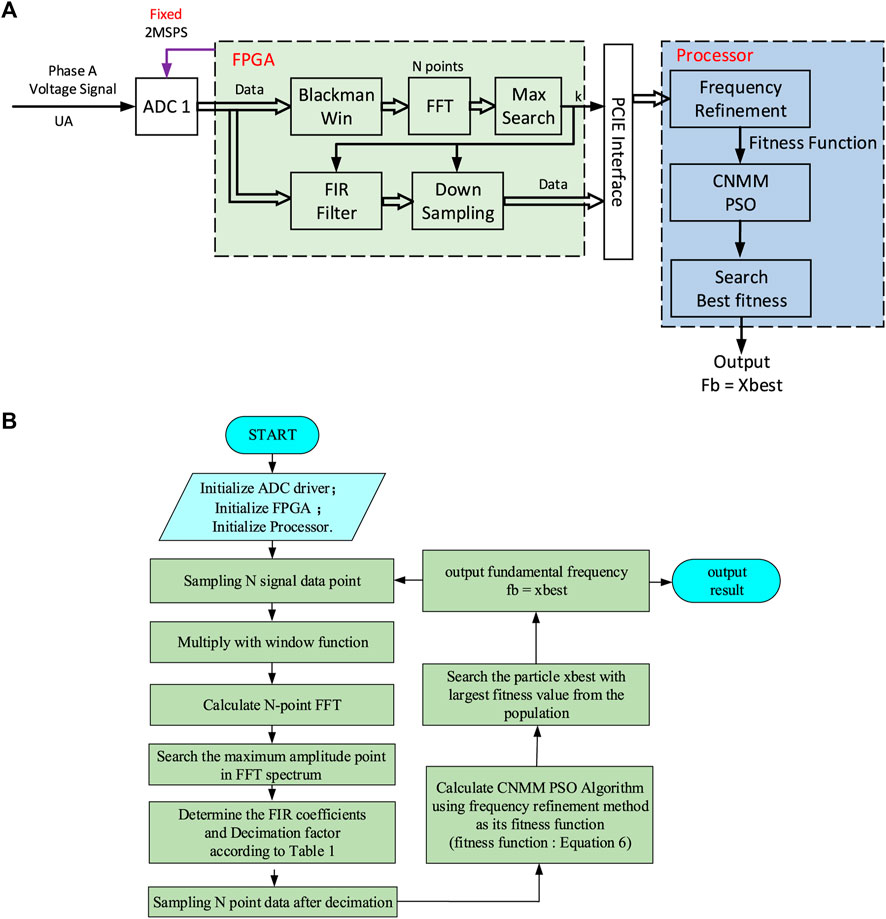
FIGURE 7. Structure of the proposed fundamental frequency measurement method. (A) The implementation structure of the proposed method and (B) the implementation process of the proposed method.
In Figure 7A, the structure consists of an FPGA chip and a processor. The phase A voltage signal is sampled by ADC1 at the sampling rate of 2MSPS. Then in the FPGA chip, the sampled digital signal is divided into two channels, one is the FFT coarse frequency measurement branch and the other is the down-sampling branch. In the FFT channel, a Blackman window is used to preprocess the sampled data. The peak amplitude of the sidelobe of this Blackman window is only −57 dB, which can effectively reduce the spectrum leakage at the fixed sampling rate condition. After this preprocessing operation, an FFT module with N = 4,096 points is used to obtain the discrete spectrum sequence of the sampled digital signal. Since the power signal has the prior information that the energy of the fundamental frequency component is greater than that of other harmonics, the spectrum index k corresponding to the frequency component with the largest amplitude can be found through a simple maximum value searching module called the “Max Search” in Figure 7A. Therefore, the coarse fundamental frequency
And another channel is the down-sampling channel which reduces the sampling rate. Then the decimated digital signal is transferred to the processor to complete the spectrum refinement method and the CNMM PSO method. The target of this fundamental frequency measurement method proposed in this article is from 20 Hz to 200kHz, and the analog-to-digital converter ADC1 works at the fixed sampling rate mode. Therefore, according to the Nyquist sampling law, the sampling rate of ADC1 needs to be twice the maximum signal frequency at least. However, the high sampling rate is unnecessary and redundant for the low fundamental frequency measurement conditions. Therefore, it is necessary to reduce the sampling rate of the sampled digital signal by the decimation method to improve the calculation efficiency when the ADC1 is working at the fixed sampling rate.
And according to the rough frequency measurement result
In terms of the cutoff frequencies required for the FIR low-pass filter listed in Table 1, the corresponding filter coefficients can be designed by some software design tools, like Matlab. And through the spectrum index k found by the “Max search” module, the corresponding FIR filter coefficients and decimation factor M are found in Table 1 and brought into the “FIR filter” and “down sampling” modules shown in Figure 7 to complete the decimation stage.
After the decimation process, the decimated digital signal and the rough fundamental frequency
4 Experiment and Verification
4.1 Simulation
In this section, the proposed fundamental frequency measurement method was performed in the Matlab programming environment. A simulation voltage signal was used to test the functionality and correctness of this proposed method.
The simulation signal is constructed according to Eq. 14.
The simulation signal formed by Eq. 14 consists of n frequency components, of which
First, the fundamental frequency
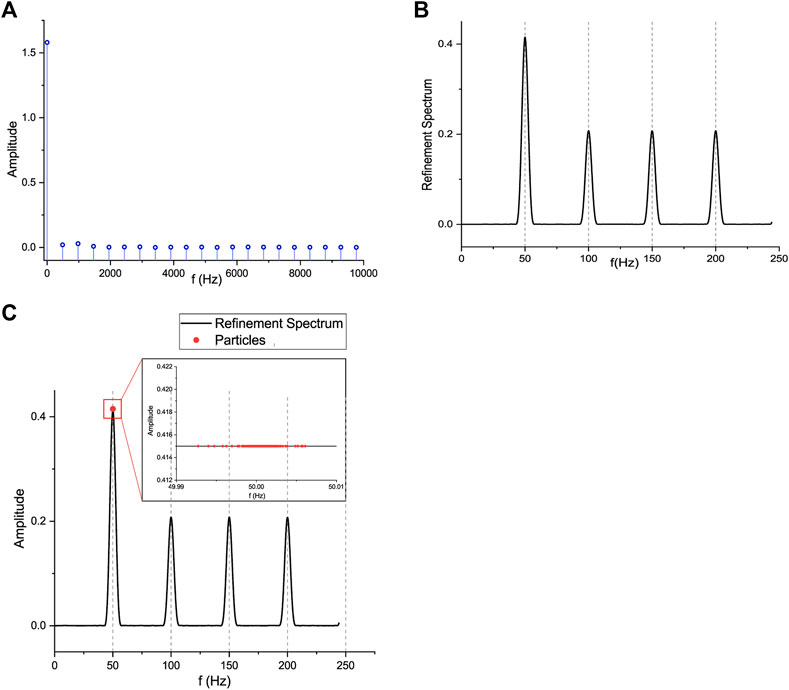
FIGURE 9. Verification results of the simulation singal with fundamental frequency 50 Hz. (A) The result of the 4,096 point FFT module, (B) the output of the spectrum refinement method, and (C) the optimiaztion result of the CNMM PSO method.
Figure 9A shows the coarse frequency measurement result after the 4,096 point FFT calculation of the simulation signal. Since the frequency resolution of this FFT module is about 488.3Hz, the spectrum calculated by the FFT module has the maximum spectrum amplitude at
After verifying the capability of the proposed algorithm for 50 Hz fundamental frequency measurement, we examine the influence of the signal-to-noise rate (SNR) of the input power signal on the fundamental frequency measurement performance. In this test scenario, the SNR of the simulation signal constructed by Eq. 14 changes from 3 to 60 dB. A group of simulation signals with different fundamental frequencies are tested. The number of harmonic components of each simulation signal is 4, which contains harmonics from the second order to the fifth order. And the amplitude of the fundamental component and harmonics of each simulation signal are 1 and 0.5 V, respectively. Figure 10A demonstrates the SNR performance of this proposed fundamental frequency measurement method. The performance is evaluated by the absolute value of the relative error, which is calculated by Eq. 15.
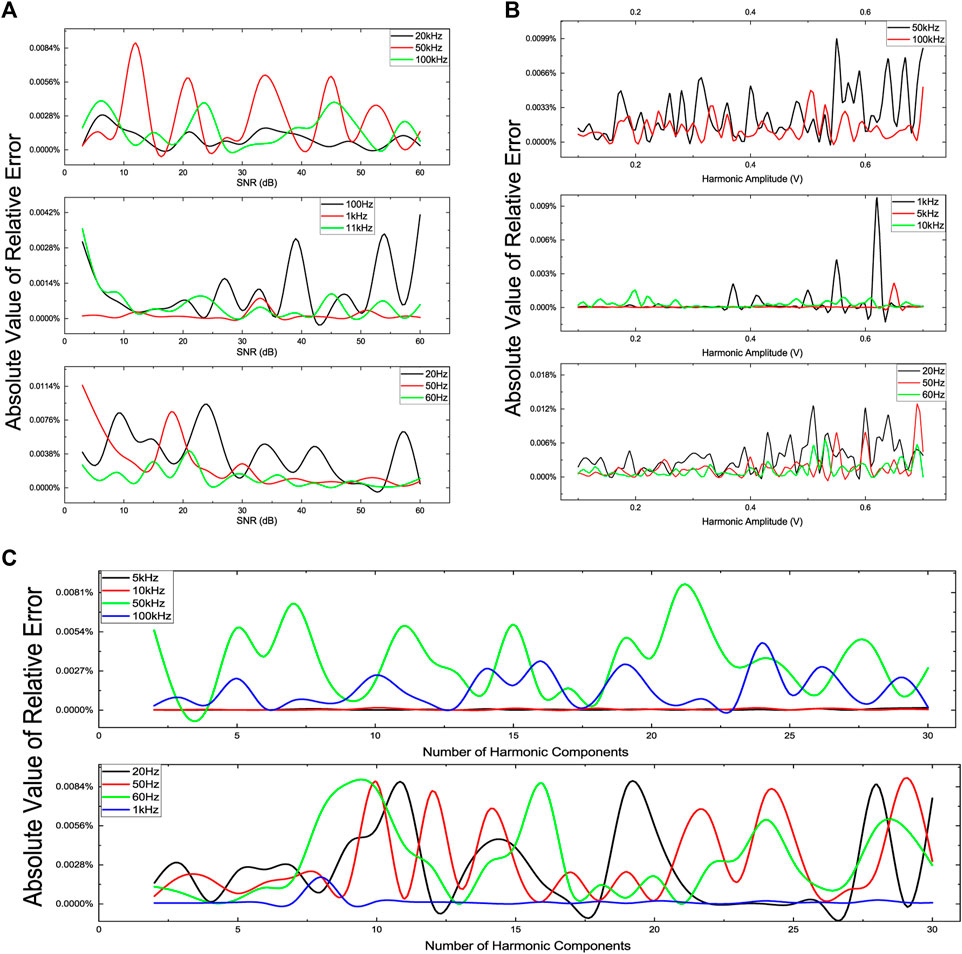
FIGURE 10. Fundamental frequency measurement accuracy verification under different parameters. (A) Absolute value of relative error of fundamental frequency measurement vs. SNR of the simulation signal. (B) Absolute value of relative error of fundamental frequency measurement vs. amplitude of harmonic components of the simulation signal. (C) Absolute value of relative error of fundamental frequency measurement vs. the number of harmonic components of the simulation signal.
In this Eq. 15, the
In the SNR range from 3 to 60 dB, the absolute values of the relative error of each fundamental frequency are <0.02%, as shown in Figure10A. Even if the SNR of the simulation signals is 3 dB, the maximum relative error is only
In this next test case, the fundamental frequency measurement accuracy of the proposed method under different harmonic amplitudes is evaluated. In this set of simulation signals, each signal contains 4 harmonics from the second order to the fifth order. The amplitude of each harmonic component varies from 0.1 to 0.7 V. From Figure 10B, it can be seen that the relative error of each fundamental frequency is lower under the small harmonic amplitude. The relative errors increase with the increase of the harmonic amplitudes. This is because the attraction of local optima increases with the increase of harmonic amplitude. Taking the fundamental frequency of 50 Hz as an example, as shown in Figure 9C, the amplitude of the global optimum, the 50 Hz, is fixed. And the amplitudes of other local optima, which are 100, 150, and 200 Hz, vary from 0.1 to 0.7 V. When the amplitudes of harmonics are small, the amplitudes of local optima are small, which means the fitness values of particles which are in the position close to the local optima are small, too. In this situation, the global optimum is very attractive for particles. However, when the amplitudes of harmonics are gradually increasing, the fitness values of particles near the local optima are gradually as well. The attractiveness of local optima increases. And the speed of particles moving to global optimum will decrease. After a fixed number of evolution, the particles are not as close to the global optimum as the case of small harmonic amplitude. The distances between global optimum and particles are the frequency measurement error. Although the relative errors increase when the harmonic amplitudes are large, the relative error is <0.02%.
In the third test scenario, the relationship between the number of harmonic components and measurement accuracy is examined. The amplitude of the fundamental component is set to 1 V. And the amplitude of each harmonic component is 0.5 V. Then a group of simulation signals for which the number of harmonic varies from 2 to 30 is used to evaluate the performance of the proposed method. From Figure 10C, it can be seen that the relative error is <
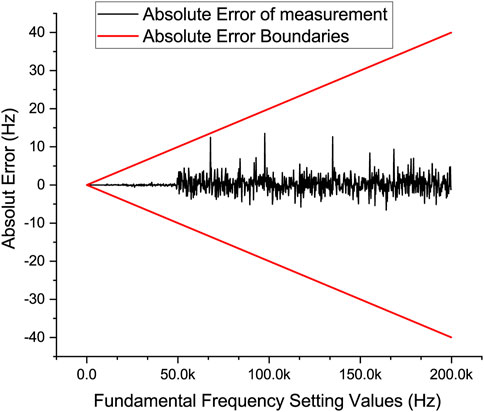
Based on the above examination, the simulation signals with a fundamental frequency in the range of 20 Hz to 200 kHz and with the harmonics of the 2nd order to the 5th order are tested. The amplitudes of both fundamental component and harmonic components are configured in the same manner as the simulation signal with a fundamental frequency of 50 Hz. And the test results are shown in Figure 11. In this Figure 11, the two red lines are absolute error boundaries which are calculated by the relative error requirement of
4.2 Hardware Verification
The hardware verification platform based on the proposed high precision and wide range fundamental frequency measurement method is shown in Figure 12. And Figure 12A shows the power analyzer used for the verification of the proposed method in this article. And in this power analyzer, four identical acquisition boards as shown in Figure 12B are used to realize the current and voltage signal acquisition test of the three-phase four-wire power system. And in Figure 12B, the acquisition board of phase-A consists of a pair of voltage signal input ports, the analog signal conditioning circuit of the phase-A voltage signal, the 16-bits ADC1 working at a fixed sampling rate of
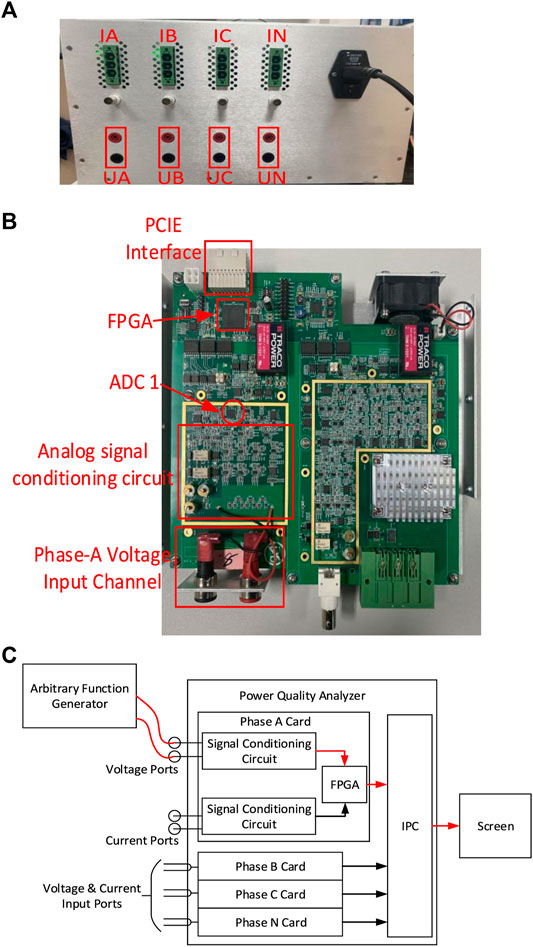
FIGURE 12. Hardware experimental platform. (A) The power analyzer used in this experiment, (B) the acquisition board of Phase-A channel, and (C) connection relationship of hardware verification platform.
And based on the hardware verification platform, the power signals with fundamental frequency varying from 20 Hz to 200 kHz are used to test the performance of this proposed fundamental frequency measurement method. The SNR of the test signal is 30 dB. The configuration of all other parameters is the same as that of the simulation subsection. The typical actual measurement results are shown in Table 2.
From Table 2, it can be seen that the largest relative error is
After verifying the measurement accuracy of this proposed method on a practical hardware platform, Table 3 compares several fundamental frequency measurement methods used in the power quality analysis. Method 1 by Li et al. (2019), method 2 by Chen et al. (2020), and method 3 by Yifan et al. (2019) are used as benchmarks to illustrate the performance of this proposed method. From Table 3, it can be seen that method 1 has the least relative error of fundamental frequency measurement. However, this method only focuses on the application scenarios of 60 Hz power grid standard. And the amplitudes of the harmonic components are just
5 Conclusion
This article sets out to improve the accuracy of fundamental frequency measurement under large harmonic conditions to meet the requirement of the synchronous sampling architecture used in the power quality analyzer. And to achieve this goal, in this article, the spectrum refinement strategy is studied first to overcome the disadvantage of the limited frequency resolution of the DFT algorithm. Then a modified PSO method is analyzed to resolve the multimodal optimization problem in fundamental frequency acquisition under large harmonics situation. After researching these two main components, the entire fundamental frequency measurement structure has been designed. And the measurement convergence ability and accuracy of this proposed method have been assessed.
This method has a high fundamental frequency measurement range, which is from 20 Hz to 200 kHz. And this wide-bandwidth measurement ability helps to test the performance of some programmable power source and variable frequency drivers. And in the premise of a wide measurement range, this proposed method achieves high precision that the largest relative error of fundamental frequency measurement in the practical hardware platform test is only
Data Availability Statement
The raw data supporting the conclusions of this article will be made available by the authors, without undue reservation.
Author Contributions
YW: methodology and FPGA implementation; XG and GQ: design of the hardware verification platform; WZ, SY, and RH: software implementation of the CNMM PSO method and PCIe communication; KC: methodology and supervision.
Funding
This work was supported by the National Key R&D Program of China (No. 2018YFC1505203), and the Science and Technology Plan Project of Sichuan Province (No. 2019ZDZX0033).
Conflict of Interest
The authors declare that the research was conducted in the absence of any commercial or financial relationships that could be construed as a potential conflict of interest.
Publisher’s Note
All claims expressed in this article are solely those of the authors and do not necessarily represent those of their affiliated organizations, or those of the publisher, the editors and the reviewers. Any product that may be evaluated in this article, or claim that may be made by its manufacturer, is not guaranteed or endorsed by the publisher.
References
Aiello, M., Cataliotti, A., Cosentino, V., and Nuccio, S. (2007). Synchronization Techniques for Power Quality Instruments. IEEE Trans. Instrumentation Meas. 56, 1511–1519. doi:10.1109/TIM.2007.903585
Borkowski, J., and Kania, D. (2019). “Influence of Harmonics on the Interpolated DFT-Based Frequency Estimation for the Control of Power in Renewable Energy Systems Using Generalized Maximum Sidelobe Decay Windows,” in 2019 IEEE 13th International Conference on Power Electronics and Drive Systems (PEDS), Toulouse, France, July 9–12, 2019, 1–4. doi:10.1109/PEDS44367.2019.8998928
Chen, K., Yang, Y., Gou, X., Zhou, W., Wang, L., and Qiu, G. (2020). A Wideband Synchronous Sampling Method for Power Analyzer. In 2020 2nd International Conference on Smart Power Internet Energy Systems (SPIES), Bangkok, Thailand, September 15–18, 2020, 362–367. doi:10.1109/SPIES48661.2020.9243116
Erm, A., Toppo, N., Sugumar, D., and Vanathi, P. T. (2019). “Design of All-Digital Phase Locked Loop for Improved Frequency Lock Range,” in 2019 2nd International Conference on Signal Processing and Communication (ICSPC), Coimbatore, India, March 29–30, 2019 (Shanghai: IEEE), 218–221.
Guo, Q., Wu, J., Jin, H., and Peng, C. (2019). An Innovative Calibration Scheme for Interharmonic Analyzers in Power Systems under Asynchronous Sampling. Energies 12, 121. doi:10.3390/en12010121
Haitao, Y., Tao, R., Junyi, C., Yun, Z., Junjie, C., Jiachao, H., et al. (2018). “Usage and Application of Power Quality Monitor on Harmonic Measurement,” in 2018 IEEE 3rd International Conference on Integrated Circuits and Microsystems (ICICM), Shanghai, China, November 24–26, 2018 (Shanghai: IEEE), 212–216.
Jain, S. K., and Singh, S. (2011). Harmonics Estimation in Emerging Power System: Key Issues and Challenges. Electric Power Syst. Res. 81, 1754–1766. doi:10.1016/j.epsr.2011.05.004
Jin, T., Chen, Y., and Flesch, R. C. C. (2017). A Novel Power Harmonic Analysis Method Based on Nuttall-Kaiser Combination Window Double Spectrum Interpolated FFT Algorithm. J. Electr. Eng. 68, 435–443. doi:10.1515/jee-2017-0078
Kuwalek, P., and Otomański, P. (2019). “The Effect of the Phenomenon of ”spectrum Leakage” on the Measurement of Power Quality Parameters,” in 2019 12th International Conference on Measurement, Smolenice, Slovakia, May 27–29, 2019, 70–73.
Li, J., Teng, Z., Wang, Y., You, S., Liu, Y., and Yao, W. (2019). A Fast Power Grid Frequency Estimation Approach Using Frequency-Shift Filtering. IEEE Trans. Power Syst. 34, 2461–2464. doi:10.1109/TPWRS.2019.2892599
Li, Y., Gao, W., Yan, W., Huang, S., Wang, R., Gevorgian, V., et al. (2021). Data-Driven Optimal Control Strategy for Virtual Synchronous Generator via Deep Reinforcement Learning Approach. J. Mod. Power Syst. Clean Energ. 14, 1–11. doi:10.35833/MPCE.2020.000267
Mohan, N., Soman, K., and Sachin, K. S. (2018). “A Data-Driven Approach for Estimating Power System Frequency and Amplitude Using Dynamic Mode Decomposition,” in 2018 International Conference and Utility Exhibition on Green Energy for Sustainable Development (ICUE), Phuket, Thailand, October 24–26, 2018, 1–9. doi:10.23919/ICUE-GESD.2018.8635792
Moreira, M. G., Vale-Cardoso, A. S., Martins, C. H. N., and Leles, M. C. R. (2019). “Enhanced LMS for Online Frequency Estimation under Wide Spectrum Disturbances,” in 2019 IEEE 10th Annual Information Technology, Electronics and Mobile Communication Conference (IEMCON), Vancouver, BC, Canada, October 17–19, 2019, 0530–0534. doi:10.1109/IEMCON.2019.8936287
Repak, M., Otcenasova, A., Regula, M., Boli, A., and Belany, P. (2018). Design of Power Quality Analyzer. In 2018 ELEKTRO (IEEE), Mikulov, Czech Republic, May 21–23, 2018, 1–6.
Song, Y., and Yang, C. (2014). “A Harmonic Analysis Algorithm Based on Synchronous Sampling,” in 2014 IEEE International Conference on Signal Processing, Communications and Computing (ICSPCC), Guilin, China, August 5–8, 2014 (IEEE), 128–132.
Tao, W., Zhou, J., and Xiang, Y. (2010). “Based on Quasi-Synchronous Sampling Harmonic Analysis Method and its DSP Realization,” in 2010 Asia-Pacific Power and Energy Engineering Conference, Chengdu, China (IEEE), 1–4.
Tourigny-Plante, A., Michaud-Belleau, V., Bourbeau Hébert, N., Bergeron, H., Genest, J., and Deschênes, J.-D. (2018). An Open and Flexible Digital Phase-Locked Loop for Optical Metrology. Rev. Scientific Instr. 89, 093103. doi:10.1063/1.5039344
Yifan, W., Kai, C., Bo, X., Yunpeng, Y., and Yun, L. (2019). “A High Precision Fundamental Frequency Measurement Method Based on FPGA,” in 2019 14th IEEE International Conference on Electronic Measurement Instruments (ICEMI), Changsha, China, November 1–3, 2019, 254–260. doi:10.1109/ICEMI46757.2019.9101426
Yushuai, L., Gao, W., Gao, W., Zhang, H., and Zhou, J. (2020). A Distributed Double-Newton Descent Algorithm for Cooperative Energy Management of Multiple Energy Bodies in Energy Internet. IEEE Trans. Ind. Inform. 17 (9), 5993–6003. doi:10.1109/TII.2020.3029974
Zhou, Z., Lin, R., Wang, L., Wang, Y., and Li, H. (2018). Research on Discrete Fourier Transform-Based Phasor Measurement Algorithm for Distribution Network under High Frequency Sampling. Energies 11, 2203. doi:10.3390/en11092203
Keywords: fundamental frequency, spectrum refinement, FFT, particle swarm optimization, synchronous sampling, power quality analyzer
Citation: Wang Y, Chen K, Gou X, He R, Zhou W, Yang S and Qiu G (2021) A High-Precision and Wideband Fundamental Frequency Measurement Method for Synchronous Sampling Used in the Power Analyzer. Front. Energy Res. 9:652386. doi: 10.3389/fenrg.2021.652386
Received: 12 January 2021; Accepted: 10 June 2021;
Published: 28 July 2021.
Edited by:
Farhad Rachidi, École Polytechnique Fédérale de Lausanne, SwitzerlandReviewed by:
Kenneth E. Okedu, National University of Science and Technology, OmanYushuai Li, University of Denver, United States
Copyright © 2021 Wang, Chen, Gou, He, Zhou, Yang and Qiu. This is an open-access article distributed under the terms of the Creative Commons Attribution License (CC BY). The use, distribution or reproduction in other forums is permitted, provided the original author(s) and the copyright owner(s) are credited and that the original publication in this journal is cited, in accordance with accepted academic practice. No use, distribution or reproduction is permitted which does not comply with these terms.
*Correspondence: Kai Chen, a2FpY2hlbkB1ZXN0Yy5lZHUuY24=
 Yifan Wang1
 Kai Chen