 Meysam Majidi Nezhad1
 Benedetto Nastasi2*
 Daniele Groppi1
 Mario Lamagna1
 Giuseppe Piras1
 Davide Astiaso Garcia2
- 1Department of Astronautics, Electrical and Energy Engineering (DIAEE), Sapienza University of Rome, Roma, Italy
- 2Department of Planning, Design, Technology of Architecture, Sapienza University of Rome, Rome, Italy
Due to the growing use of Green Energy Sources (GESs), the activities of mapping, monitoring, measurement, and detection of various GESs have become crucial. Assessing and measuring GESs are very complex since different environmental conditions occur. This importance is even greater when researchers face a shortage of measuring instruments and tools in many parts of the world. GES assessment is a challenging task that requires accurate and continuous measurement methods. Currently, traditional methods are very time-consuming and require spending money and human sources. So, the use of accurate and fast measurement methods and tools assessing measuring GESs potential are seriously recommended, which can greatly help the growth of the use of GESs, especially to cover and focus large areas. Satellite remote sensing is used to observe the environment in many fields and new and fast applications. Satellites remote sensing technologies and techniques for GESs assessing are fast, accurate, and can help to reduce costs and decision-making risks of GESs converters installations projects and provide suitable products to the public end-users. These could also be used to identify regions of interest for energy converter installations and to accurately identify new areas with interesting potentials. In this case, researchers can dramatically reduce the possibility of significant error in assessment methods. There is a lack of in-situ measuring tools mainly due to their high economic costs in the interested areas; an accurate analysis was carried out to assess the GESs energy potential. Since there are only limited options for further expanding the measurement over large areas, the use of satellites makes it easier to overcome in-situ limitations. Actually, to use and develop it as much as possible, a correct interdisciplinary understanding is needed. Satellite remote sensing technology for identifying suitable areas for GESs power plants could be a powerful tool that is constantly increasing in its new and fast applications but requires good planning to apply it in various GESs converters installations projects. In this article, a comprehensive review on wind, wave, biomass, geothermal sources assessment using Sentinel-1 (S-1) Synthetic Aperture Radar (SAR) satellite estimation has been summarized along with the different techniques available to measure GESs using satellites. In the paper, several of the successful estimation techniques were introduced in each section and compared for the understanding of limitations and strengths of different methods of GESs availability evaluation.
Introduction
Earth Observation (EO) data based on information received from satellites Remote Sensing (RS) provides a good opportunity to better understand the blue planet on which we live. Such data make linear and nonlinear analysis possible to monitor global environmental changes using predictive models (Liu, 2015), as well as providing information products that can inform the social decision and policy making by the governments of human societies (Stevens et al., 2015). Satellites RS data become important when examining issues on a global, regional, and national scale, and especially when addressing various issues, such as technical, economic, and social issues (Leibrand et al., 2019a). There is plenty of EO data and coordination between social and government stakeholders in examining issues that are addressed on a regional to global scale. EO data based on information received from satellites plays a more prominent role than other types of data in international cooperation. Such data can potentially be used in a wide range of applications, including energy, environment, and the marine protection sector (Young, 2017).
These data can facilitate the identification of parameters by researchers/analysts to address a specific or general issue, the status of the issue, or the process of data over the long or short term. Satellite data can also be used to evaluate the success of applied solutions. This can help human societies to generate environmental health and safety warnings and respond to various Earth issues such as natural disasters. The main reason for this increase in EO satellite numbers is an increase in the diversity of specialized knowledge in various fields and the response of human societies to this knowledge.
This importance becomes even greater when Green Energy Sources (GESs) potential assessment faces a shortage of measuring instruments and tools in many parts of the world. In recent years, the lack of GESs assessment potential data in large areas due to the use of time-consuming traditional methods is not unexpected and is contributing to creating so-called forgotten areas (Nezhad et al., 2021a). It should be noted that the use of the traditional measurement tools such as cup anemometers, gliders, ships, and buoys is very expensive, time-consuming (they must be installed in the desired location for more than a year), and require maintenance (Khan and Tariq, 2018).
In addition, data obtained from assessing, measuring, and monitoring operations in different regions are very important since they are used in many types of data-driven researches, to gather more accurate understanding and to get as output reliable databases (Amori et al., 2019). Choosing the right place, in the so-called site selection step, to install a renewable energy facility requires accurate knowledge of the site’s climatology as well as the environmental analysis requested for licensing and public consent for the commissioning of renewable energy facilities (Tapiador, 2009). In addition to all those points, traditional measurement tools are not able to cover large areas since they measure the desired parameter at the installed point, providing limited outputs (Moreno-Madrinan et al., 2010). Therefore, the use of these traditional measurement tools to measure GESs does not correspond to the need to identify new geographical areas for the installation of further GESs based energy converters to meet the increasing demand for them (Zhou et al., 2017). Given all these limitations of each traditional measurement tool, it is necessary to use alternative tools with new methods that can perform the measurement and identification steps with appropriate speed and accuracy (Majidi Nezhad et al., 2020a) as well as cover large areas easily.
In recent years, with the dramatic growth of technology, new tools have been developed to measure GESs, such as on-site remote sensing tools. The most important of them are LIght Detection And Ranging (LIDAR) and SOnic Detection And Ranging (SODAR) measurement tools (Lang and McKeogh, 2011). These tools, after installation on-site, are capable of measuring the desired parameters with appropriate accuracy. However, they also have limitations like the aforementioned traditional measurement tools as mentioned above. LiDAR and SODAR measurement tools are often used in conjunction with fixed masts to accurately measure remote sensing data at the site (Yue et al., 2020). Nevertheless, various numerical models have been designed and developed by using data obtained from punctual in-situ measurement tools as a reference (Jacobsen et al., 2015). However, due to the high efficiency of this type of instrument, their use and maintenance are very expensive and need to be calibrated during the measurement time, which entails time and data gaps. There are numerical models developed using the information obtained from in-situ and on-site tools as input data from several points to analyze larger areas (Emeis et al., 2004).
In this context, the use of satellite remote sensing tools and imagery to monitor, detect, measure, and evaluate different human activities or/and phenomena such as environmental pollution, climate change, and global warming are of primary interest. Continuously by processing SAR satellite remote sensing imagery, valuable information about the Earth can be examined at different scales with the least possible time and cost in a long period of time. SAR satellites remote sensing has made it possible to make extensive use of high-resolution, high-spatial, multi-axis data sets (Hasanlou et al., 2021). Specifically, several methods have been designed and developed based on a SAR (Sentinel-1, etc.) and optical satellite (Sentinel-2, Landsat, etc.) image analysis for detecting and assessing GESs. Evaluation, estimation, and detection of various GESs received attention since 1) the ability to cover large and small areas around the world, 2) these kinds of data are generally free (meaning open access) or low cost and usually supported by unlimited policy, 3) they have the ability to collect information over long and short periods, 4) these data are updated in the shortest time possible and very repeatable. Each of these satellites differs in its specific characteristics in terms of resolution, correction, rotation, spectrum, and imaging. Satellites can be classified according to multiple features (as displayed in Figure 1).
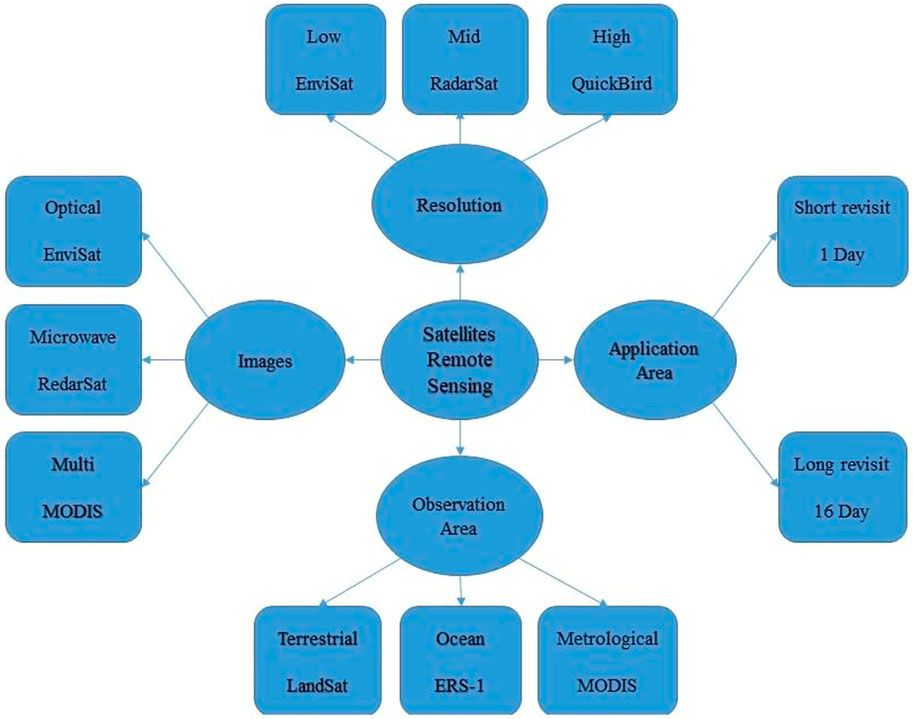
FIGURE 1. Satellite remote sensing classification of the resolution, images, application area, and observation area.
Synthetic Aperture Radar Satellite
Today, various satellites are used due to their efficiency in carrying out EO and identifying various environmental phenomena. In fact, it can be said that the choice of a satellite depends on the phenomena to investigate and monitor. In this regard, one of the types of satellites that are widely used in studies to evaluate GESs is the SAR satellites, such as ERS-1, ERS-2, Envisat, S-1, JERS-1, ALOS-1, ALOS-2, Radarsat-1, Radarsat-2, TerraSAR-X, TanDEM-X COSMO-Skymed, KOMPSat-5, and NISAR (unavco, 2018). SAR satellites play an important role in evaluating different types of environmental parameters for various applications such as volcanic activity, burned area, marine atmospheric boundary layer roll, sediment flow, and ice detection. According to several studies conducted in large areas, there are many gaps that can be filled by EO satellites and among them, the geographical and temporal data gaps and the GESs potential assessment (Amori et al., 2019). The data collected from SAR satellites are of the active type of information, band-limited, and coherent microwave imaging sensor (Corcione et al., 2021). This type of satellite uses the energy of a sensor and receives energy as a reflection after interacting with the Earth. In fact, it can be said that this energy interacts with the target on the ground, so targets with high return signals can be identified as bright spots, and surfaces with smooth surfaces can be identified as dark areas in SAR images. Therefore, due to the physical and electrical properties of objects, it is possible to identify objects on the ground (Rodríguez-Benito et al., 2021).
There are different types of SAR satellites that can be classified using two-wavelength and frequency characteristics: 1) 2.4 and 3.8 cm and frequency between 12.5 and 8 GHz (X band); 2) 3.8–7.5 cm and 8 to 4 GHz (C band); 3) 15–30 cm and 2 to 1 GHz (L band); 4) 30–100 cm/1 to 0.3 GHz (P band) (Haarpaintner and Hindberg, 2019). The transmitted and received waves can be linear or circular. But it should be noted that the waveform cannot fully describe the wave. Linear pulses in SAR satellites can be horizontal (H) or vertical (V) depending on the direction of the plane in which the wave propagates (Brisco et al., 2020).
The polarization of the SAR satellite fully reflects the direction of propagation of the waves analyzed by the SAR satellite. The following four combinations describe all linear pulses: HH, VV, HV, and VH. The first letter of the sending pole indicates the emitted energy and the second letter of the receiving pole indicates the received energy. SAR satellite sensors can fully support polarization: dual (HH + HV or VV + VH), cross (HV/VH), and quad (HH, HV, VH, and VV) polarizations. The use of all four is defined as quad polarization (Mondéjar, 2009). Table 1 shows SAR satellites according to band characteristics, state, coverage, and spatial resolution, incidence angle, and polarization with temporal resolution. SAR satellites are very popular among researchers in various fields due to the many capabilities reported and analyzed in the next sections.
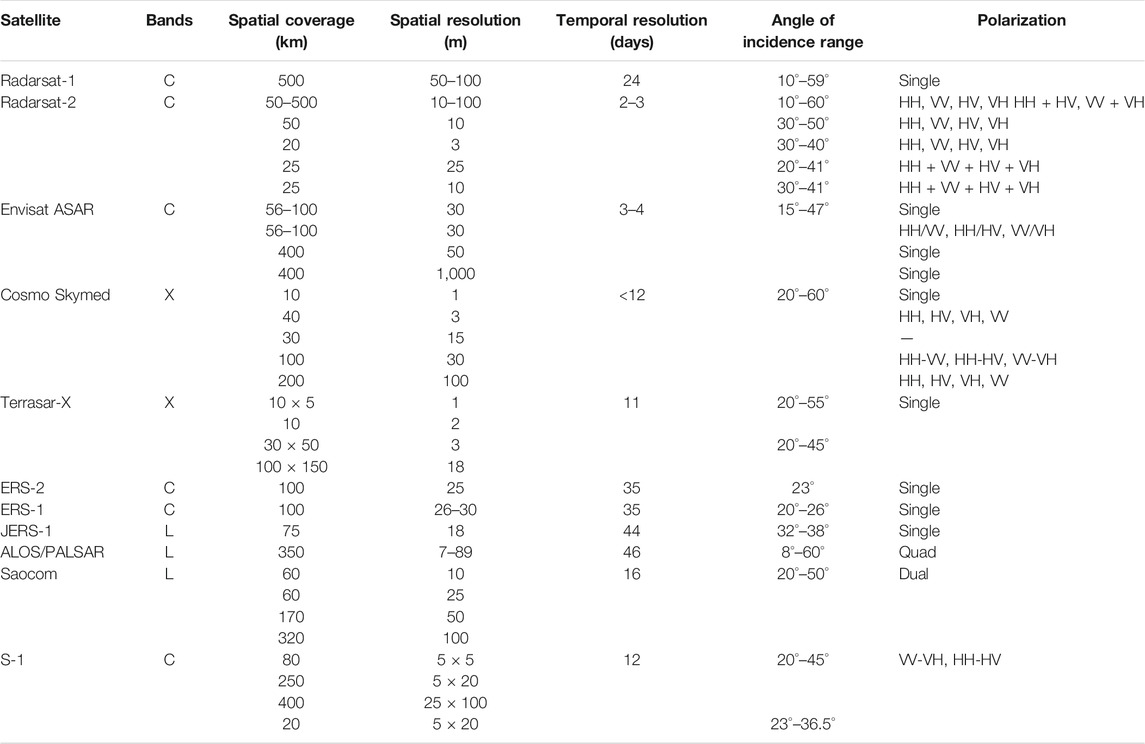
TABLE 1. Specifications of satellites with SAR properties (Majidi Nezhad et al., 2019).
Sentinel-1 Satellite
Sentinel family satellites have been designed, developed, and launched by the European Space Agency (ESA) as a part of the Copernicus program to meet its requirements on behalf of the joint ESA/EU initiative Global Monitoring for Environment and Security (GMES). The Sentinel family mission includes S-1 (A and B), S-2 (A and B), S-3 (A and B), S-5P, S-4, S-5, S-6, along with new satellites. Each Sentinel satellite consists of a twin satellite constellation to ensure revisit and also to carry advanced technological instruments such as radars (or SAR), multispectral imaging sensors for land, marine, and atmospheric monitoring (Euro Space Agency, 2014).
S-1 is the newest and first of five missions into Earth orbit. Access to the satellite data information received started in 2014 and 2016 and continues until now. S-1 satellite data provide in many different fields including maritime activities, sea ice mapping, crisis response, forest management, and flooding as well as extensive coverage to monitor the shipping transport especially for small ships (Rodríguez-Benito et al., 2021). S-1 twin satellites are under the Copernicus mission with two satellites in polar orbit, the mission’s ability to observe all weather conditions during the day facilitates continuous monitoring (day and night time), performing C-band SAR imaging and allowing satellites to obtain imagery irrespective of the weather by providing free information that is updated every 6 days (repeat cycle is 12 days for each satellite) (Mellors et al., 2018). The S-1 satellite has a significant improvement in SAR interferometry compared to other SAR satellites. This satellite has significantly improved data collection. This satellite receives higher resolution data compared to previous C-band sensors.
In recent years, there is a growing interest in SAR data to analyze GESs, especially in areas with frequently cloudy skies. It is difficult to obtain high-quality optical data and SAR systems have a great ability to collect data in all weather conditions. Table 2 reports the S-1 specifications. Data from the S-1 C- band (5.405 GHz) images satellite has the tremendous ability to support a variety of applications such as landslide detection, mapping and description, landslide monitoring, mining activity, subsidence, and earthquake phenomena (Hasanlou et al., 2021).
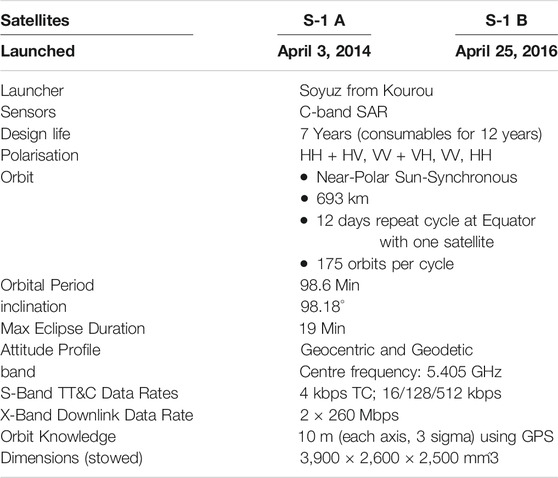
TABLE 2. Specifications of S-1 satellite (Meadows, 2019).
There are four exclusive acquisition modes produced using satellite bands, unique to the S-1 A and B and summarized in Table 3.
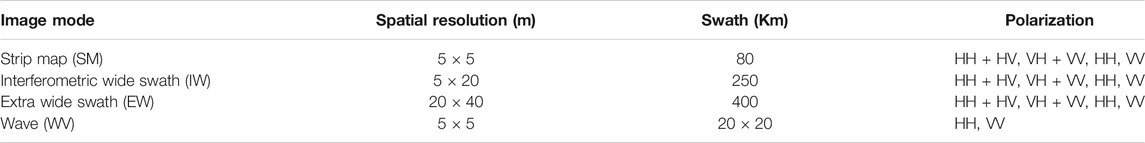
TABLE 3. Typical applications mapped to modes of S-1 satellite (Meadows, 2019).
The reasons for the popularity of S-1 satellite data among researchers, universities, and companies include the inherent ability to map on a large and small scale, regular observations, relatively higher revisit frequency than its competitor missions, high resolution, and high coverage due to the wider swath, the wider viewing angle providing large uninterrupted images, and fast upload of satellite products data in about 3 h. Furthermore, the S-1 satellite has a free and unlimited access policy and users, only requiring registration. The S-1 satellite does also have disadvantages, since the mission is recent. Indeed, the image archives are much smaller than older missions such as LandSat, high resolution is not available, access to the long-term archive is unclear, and there is less accuracy of wider viewing angles at the edges (Meadows, 2019). The reasons mentioned above have led to the use of SAR satellites data in several GESs studies as reported in Figure 2.
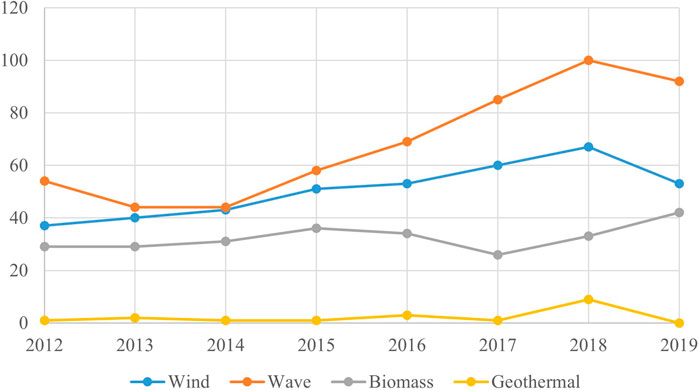
FIGURE 2. The trend of published articles with SAR satellite and each GESs keyword indexed in the Scopus database.
Sentinel-1 Application Platform Toolboxes
The Sentinel Application Platform (SNAP) toolboxes have been designed and developed by the ESA. SNAP software is a common structure and framework for the Sentinel family satellite toolboxes and was designed and developed by Brockmann Consult and OceanDataLab, SkyWatch in partnership with DLR and C-S consultants. SNAP software is extremely useful for processing and analyzing EO performed by the Sentinel family. SNAP software toolboxes are free and supported by open access policy to handle Sentinel family satellite data (SNAP, 2020).
This software is ideal due to various technological and information innovations. Many features of this software are positive such as the common structure for all toolboxes; the satellites image display being very fast, even in scrolling gigapixel images; the Graph Processing Framework (GPF) used to create user-defined processing chains; the easy management of new advanced layers allowing the addition and manipulation of new coatings; and the selection and definition of a region of interest for statistical analysis and different plans. Furthermore, it is very easy to define and install the steps of the mask, necessary for the early stages of image analysis (SNAP, 2020).
The SNAP 1 toolbox includes a convenient and different set for analyzing satellite data. In addition, the display program supports various satellite archives such as S-1, ERS-1, and 2, ENVISAT, ALOS PALSAR, TerraSAR-X, COSMO-SkyMed, and RADARSAT-2 that are very efficient. It can run the command line independently in various processes. This toolbox includes suitable tools such as calibration, spot filtering, kernel, correction, mosaic, data conversion, polarization, and interferometry for different stages of image processing in different geographical locations (Sentinel-1 Toolbox, 2021).
Literature Review on Green Energy Sources Assessment
Wind energy is one of the most abundant GESs available to replace fossil fuels around the world. Wind turbines convert wind into electrical energy. Owing to the significant progress of the new generation of wind turbines, the installation of larger wind farms in coastal areas at sea and in the oceans to generate more and more electricity is taking place. The potential of a wind energy project depends directly on the geographical location of the wind farm project. At the same time, technological restrictions apply such as wind turbines with wind speeds of more than 25 m per second are turned off to prevent gearbox wear, so calculating the future frequency of strong winds is important to calculate the efficiency of wind turbines (Tapiador, 2009). In this regard, evaluations and appropriate locations before investment significantly help to predict project results and profits from the construction phase and to reduce uncertainty in the success of the project. Depending on the location of wind turbines installed, wind farms can be divided into three categories: 1) onshore, i.e. on the mainland, 2) nearshore, and 3) offshore. In this last case, SAR satellite imagery is mainly used for the site assessment of such wind farms and potential detection (Ahsbahs et al., 2018).
Satellite imaging provides guidance to project stakeholders for better management, decision-making, and a broader understanding of the location to develop the feasibility studies of offshore wind farm projects. Usually, wind measurement tools and various SAR satellite techniques can be used to evaluate the wind potential in the studied areas. SAR satellite techniques allow measuring and calculating the size and wavelength of ocean waves with high resolution since SAR satellites are able to work in all day or/and night conditions as well as in cloudy weather. Given these capabilities, these radar-based radiographic data appear to be a viable option for use in operations at meteorological centers and government agencies, as well as for many scientific purposes. Measurements of ocean wave spectra from SAR image spectra are sensitive to different types of imaging due to the existing characteristics of ocean and Sea Surface Water (SSW) roughness, wind speed spatial variation, current and sea surface movement. SAR satellites can be one of the key tools for detecting and monitoring sea and ocean water and can be used in many marine studies with different polarizations and appropriate resolution such as SSW (Rana et al., 2019), pollution monitoring (Ferraro et al., 2007), ship and tanker detection (Kanjir et al., 2018), and wind and wave assessment (Carolis et al., 2004). The main reason for the success of SAR satellites in detecting various sea and ocean levels cases can be considered the use of different satellite polarizations, especially Vertical Vertical (VV) polarization. This polarization has the ability to measure the SSW roughness caused by the wind to measure the parameters related to the waves in ocean and sea marine areas too (Chaturvedi et al., 2020).
Wave energy: sattelite can be used to determine the expected values of parameters such as wave height, wave period, and the average wavelength to improve the prediction of various wave models (Gallagher et al., 2016). This information can also be gathered directly from SAR images of wave height, wavelengths of the ocean, and SSW (Shao et al., 2020). Therefore, the maximum height distribution of the waves resulting at sea and ocean levels can be studied worldwide (Lehner and Ocampo-Torres, 2004). Given the availability of global sea and ocean wave data in approximately realtime as well as long or/and short term in all weather conditions, there is a strong incentive to develop ideas from studying SAR satellite data. SSW is usually evaluated by several specific parameters such as Significant Wave Height (SWH) and Mean Wave Period (MWP), average propagation, and frequency (Sun et al., 2018). However, it should be noted that speed bunching, which is a nonlinear modulation, is caused by the movement of sea waves and their alignment with the direction of satellite rotation (Raspini et al., 2018). As a result of this alignment, seawater waves shorter than the specified length cannot be detected by SAR in the azimuth direction (Lehner and Ocampo-Torres, 2004). Therefore, evaluating and measuring parameters related to sea and ocean waves, for example, SWH and MWP, are much more complex than recovering wind levels in these areas. So, it can be said that all tools have limitations in measurement and estimation, including SAR satellites (Majidi Nezhad et al., 2020a).
Biomass (forest and crop) produced in developed or developing countries can lead to sustainable biological products as well as being used for energy purposes. Biomass refers to the biological structural materials of trees, agricultural and nonagricultural products. Biomass energy has been used directly or indirectly in the production of heat and light in different human societies. Biomass biofuels from the residual forest products of trees, branches, stems, and agricultural products can be exploited in various ways, for example, charcoal, methane, ethanol, methanol, and biodiesel, which is directly related to the geographical location area and culture of the user community. One of the most important rainforests in the world is the Amazon forest of South America (Pulella et al., 2020) that plays an important role in the global carbon cycle and oxygen production. It should be noted that this type of energy can be much cheaper and more accessible to human societies compared to other renewable energies. Accurate estimation of Above Ground Biomass (AGB) and biomass mapping reserves in different ecosystems help address sustainable development goals (Safari and Sohrabi, 2020) such as natural sourcing, agricultural, and ecotourism (Mercier et al., 2019). They are also essential in the forests and natural source management at different spatial large or/and small scales (Fayad et al., 2016).
Continuous technical monitoring of forest area is not possible using only post-technical field collection data due to the large covered areas, remoteness, and species diversity (Erinjery et al., 2018). Instead, the accuracy of SAR satellite data obtained for long-term monitoring of the forest is easily available in spatial, spectral, continuous, cost-effective, and highly accessible ways. In addition to the fact that research into the forest field is required to evaluate and measure these areas, money and human sources are needed. The use of SAR satellite remote sensing data to get out of this situation and the sustainable study of forest areas is a suitable solution for large- and small-scale monitoring (Erinjery et al., 2018). The studies show that the SAR satellite data have good accuracy for assessment (Dostálová et al., 2016) and also have a high sensitivity, especially Vertical Horizontal (VH) or Horizontal Vertical (HV) for canopy structural recognition of the forest region areas (Naidoo et al., 2015). It should not be forgotten that the data obtained from SAR satellites are less accurate than the multispectral optical satellites ones (Naidoo et al., 2015), but, if SAR satellite data are combined with multispectral optical satellites ones, better results will be obtained from forest analysis (Erinjery et al., 2018).
SAR satellites have an active sensor that can transmit long wavelengths and the ability to work 24 h a day without being disturbed by rain, cloudy skies, fog, haze, and smoke. Those abilities made SAR satellite technology a powerful tool for biomass estimation and field analysis (Mixed et al., 2018). Compared to SAR satellites, multispectral optical satellites are not able to fully cover the Earth. On the other hand, many forest areas of the world are located at high rainfall and humidity areas, which increases the number of cloudy days (Van Tricht et al., 2018). In these conditions, optical multispectral satellites lose their capability and can only be complementary to the measurement capabilities of SAR satellites. These satellites can understand valuable data for forest mapping, predicting forest area (Schmullius, 2020), forest change (Hansen et al., 2013), forest species identification (Xia et al., 2020), and harvest management (Shang et al., 2020) by considering the geometric structure of forests with the ability to use passive sensors.
Geothermal: another type of GES that can be measured with SAR satellite remote sensing techniques is geothermal energy. To detect and measure the potential of geothermal harvesting areas, the traditional drilling method (Kristensen et al., 2016) involves sensing the Earth temperature in the underlying layers. Drilling measurements are very accurate for assessing geothermal areas, but require a lot of time and money; manpower and peripherals are also needed (Howari, 2015). SAR satellite remote sensing is one of the most effective, low-cost, and easily accessible data with short repeat times to identify and explore geothermal energy-suitable sites (Mellors et al., 2018), especially for those areas not easily accessible (Iqbal and Juliarka, 2020).
The results of the SAR satellite remote sensing methods can be used as a guide for exploration and use in the next stage of setting up geothermal power plants in different geographical site locations (Mary et al., 2020). In previous studies, SAR satellite has been used for direct or indirect mapping and exploration of geothermal potential areas by remote currency measurement methods (van der Meer et al., 2014). Various methods can be used in geothermal studies, not only to explore and detect areas but also to monitor their exploitation for geothermal energy.
Generally, SAR satellite imagery uses several deferent reflection, propagation, and scattering to collect information from the target on Earth (Jefriza et al., 2020). These preliminary results can be used as a basis for geological, geophysical, and geochemical studies. Owing to the increasing number of satellites for EO, there are advances in measurement tools and digital image processing techniques for satellite imagery. In addition, thermal infrared sensors are used too for proper detection. As a result, truly diverse studies of thermal infrared data have been performed for geothermal potential assessment providing a unique set of data. Potential suitable geothermal areas have certain features such as fumaroles, paving stones, and hot springs that make it easy to identify these areas on the ground and also in satellites imageries. The emitted heat can be detected by infrared thermal sensors portable on various air or airborne operating systems, which can simultaneously map and determine temperature and heat fluctuation anomalies from remote areas (Ja afar, 2018).
To plan the GESs based power plant projects, first, measuring, and estimating the number of energy sources available to minimize the project management risk of the project is needed (Inger et al., 2014). Theoretically, a thorough evaluation using long-term EO can significantly help the decision-making process regarding the location of renewable energy converters installation. Different types of GES assessment are not limited to the use of satellite imagery compared to terrestrial for spatial surveying in large and remote areas with restrictions such as budget and time. More and more use of SAR satellite remote sensing data is being made as a tool to estimate GESs, demonstrating its superiority over other methods of evaluation and identification; it can also be used to determine the GESs geographical potential according to the pixel potential for economic exploitation and evaluation for identifying, monitoring, and identifying optimal sites as shown in Figure 3.
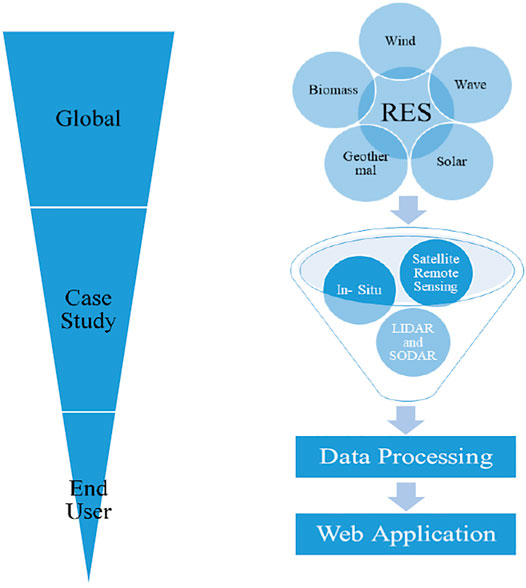
FIGURE 3. GESs assessment and analysis.
A dataset that includes satellite remote sensing data and local geographic ones can provide a good opportunity for stakeholders with different study objectives to analyze and model diverse sources (Leibrand et al., 2019a). The output of this information can be in the form of maps, atlases, and numerically simulated results bringing the end-user closer to a realistic visualization. This latter includes identifying the data needed to address one or more issues simultaneously, monitoring the status of different issues or reviewing data trends over a short or long period of time, and evaluating the success of applied solutions by considering all parameters (Leibrand et al., 2019a). It should be noted that due to the large volume of satellite data received, the use of machine learning and deep learning technologies, and other neural networks such as Convolutional Neural Networks (CNN) are widely made in mapping and land type identification (Geng et al., 2021).
In this study, the measurement techniques of the S-1 satellites have been reviewed using previous studies to understand their capability and potential for evaluating, mapping, detecting, and identifying GESs like wind, wave, biomass, and geothermal energies. However, it seems that each of the SAR satellite measurement techniques used to explore GESs presents itself as an important challenge, and needs tools required to correctly understand the knowledge of various hybrid and multidisciplinary sciences.
Here, many topics related to the importance of S-1 satellite measurement techniques to evaluate GESs are discussed; solutions have been proposed by reviewing the strengths and weaknesses of the previous case studies. The conclusions drawn by the authors and the recommendations derived from the literature reviewed will be valuable to scientists and policymakers for decision-making of renewable energy projects.
In this section, a literature study of research using S-1 satellite remote sensing in the exploration and estimation of GESs has been developed. Databases, papers, and other public resources on the role of S-1 satellites and their techniques in GESs exploration have been reviewed using a multidisciplinary perspective. Different types of technologies, methods, and techniques for evaluating the potential of GESs are analyzed and classified based on the assessed GESs potential, namely:
Wind Potential Assessment
Several studies over the years have shown that high-resolution spatial S-1 satellites have an inherent potential for mapping, detecting, estimating, and evaluating wind sources (Zhao and Ren, 2020). The S-1 satellite was ignored in the development of marine studies such as wave, tidal (Seifi et al., 2019), bathymetry analysis (Bian et al., 2020), marine transport (Dechesne et al., 2019), and oil spill detection (Naz et al., 2021), but it can play a key role especially for offshore wind studies (Zhang et al., 2018a). The S-1 satellites include two parts, a transmitter and a receiver sensor to detect the signal emitted by the transmitter from the satellite to the extent that they receive these return signals from the receiving sensor (Majidi Nezhad et al., 2019). These satellites can measure wind speed at sea by measuring the SSW with 10 m standard height above sea level; in fact, the wind that blows at sea level causes roughness on the SSW and particularly, the induced roughness is directly proportional to the wind speed.
SAR satellite remote sensing uses two types of scanning mechanisms to assess sea-level reflectance. The shooting range between them is cross-sectional with the speed of light, so it can be said that it is not sensitive to the temporal changes of the sea. On the other hand, SAR satellite imagery is done with azimuth or satellite-based trajectory direction, so it is sensitive to temporal changes at sea and ocean levels (Raney, 1985).
The microwave signal scattered by the sea is well expressed under low to medium sea level conditions and at a wide range of angles as described by scattering models on two scales (Nunziata et al., 2014). The classification of SAR satellite scattering models in two scales shows that the surface roughness spectrum of seas and oceans is divided into two categories. It should be noted that longer surface waves have a higher surface roughness on a larger scale and shorter surface waves have a lower surface roughness on the same scale (Corcione et al., 2021).
S-1 satellites can analyze wind speed by analyzing the reverse signal changes expressed as the Normal Radar Cross-Section (NRCS). It should be noted that with increasing roughness of SSW by strong winds, the NRCS also increases (Majidi Nezhad et al., 2019). The presence of a surface-to-surface active agent, such as SSW roughness, affects both the NRCS and SAR spectra (Nunziata et al., 2009). In short, it can be said that both parts of the spectrum of short and long waves at sea level are affected by the active factor of the surface (Grieco et al., 2016).
However, the high-spatial-resolution data obtained from the SAR satellite have good accuracy and results in offshore wind analysis (Yang et al., 2011). In recent years, various Geophysical Model Functions (GMFs), particularly the so-called C models (CMOD), tailored to assess wind parameters from SAR satellites have been successfully designed and developed, such as CMOD4 (Fang et al., 2018), CMOD-IFR2 (Jagdish et al., 2018), CMOD5 (Hersbach et al., 2005), CMOD5.n (Soisuvarn et al., 2013), CMOD7 (Stoffelen et al., 2017), and recently a new CMOD model was designed from RADARSAT-2 and S-1 satellite, the so-called C-SARMOD1, and C-SARMOD2 model (Radkani and Zakeri, 2020) for coastal wind speed retrievals (Lu et al., 2018). It should be noted that different types of C-band GMF models have the ability to measure wind speed using data obtained from the different S-1 satellites polarization with a 180° ambiguous of the wind direction (Diaz et al., 2013).
S-1 satellite imagery has been used to assess the wind potential of large marine areas. S-1 satellite images obtained also cover several hard targets such as mainland and small islands, Wave Energy Converters (WECs), Wind Turbine Generators (WTGs), and ships and tankers. These hard targets are referred to as inhibitors (reflectors) and increase the back-microwave radiation in S-1 satellite images. Therefore, in all methods (postprocessing) to evaluate the wind potential, the images of these hard target objects must be masked before starting to analyze. Studies show that S-1 satellite data can be considered one of the most popular tools for observing the Earth, for example, oceanography, land surveying, and climate change measurement using spatial resolution. The above can be done in all weather conditions and S-1 satellite data can be used to compare wind speed data recorded from fixed stations (Katona and Bartsch, 2018) such as buoys and cub anemometers as input to evaluate different parameters of accuracy, such as Root Mean Square Error (RMSE) or Root Mean Square Deviation (RMSD), Mean Squared Error (MSE), or Mean Squared Deviation (MSD) and R (La et al., 2017).
Jang et al. (2019) explained and compared the wind speed parameter in the Korean Sea by means of S-1 satellites imageries using CMOD functions and compared with data collected by buoys as references. In the first stage of preprocessing S-1 satellite data, the authors masked all the factors that severely affect the process of measuring wind speed, such as oil slicks, ships, and vessels floating in the sea, as well as land areas and also large and small islands (hard targets). In the second stage, the wind speed is obtained at 10 m standard height above sea level, which is obtained from CMOD functions such as CMOD4, CMOD-IFR2, CMOD5, CMOD5.N, and CMOD5.Na was analyzed. In this research, the RMSE rates of each of the models’ functions are evaluated, and the obtained values are 1.83, 1.82, 1.69, 1.68, and 1.65 m/s, respectively. Finally, the effects of the wind direction and their calibration and S-1 interference in the offshore wind potential sources of errors are investigated.
Zhang et al. (2018b) summarized the wind speed assessment received by S-1 high-resolution images retrieval using C-band GMFs (CMOD4, CMOD-IFR2, CMOD5, and CMOD5.N) from 50 m to 50 km. They said that using high-resolution images obtained from S-1 satellites is very suitable for examining offshore winds fields. This is done to better understand the effect of wind speed recovery accuracy on different models and the performance of C-band GMFs (CMOD4, CMOD-IFR2, CMOD5, and CMOD5. N). The results of this study show that the performance of the CMOD5 had less error (RMSE = 1.17 m/s and bias = 0.28 m/s) among other models used for wind speed retrieval with a spatial resolution of 500 m and delivering better performance for retrieving wind speed from S-1 satellite IW mode data.
Rana et al. (2019) discuss the wind direction retrieval from the S-1 satellite according to the gradient algorithm (LG-Mod) model. Inversion of C-band MODel 5.N (CMOD5.N) backscattering model was used to implement wind speed parameters. Wind field retrieval at output high-spatial resolutions was evaluated using two different level-1 products, IW and EW of 5 and 12.5 km. Comparison between in-situ measurement data and Numerical Weather Prediction (NWP) models with SSW wind fields from S-1 was performed. The S-1 images output pixel size was selected by using input LG-Mod model wind direction with a related marginal error parameter. In comparison with in-situ data for the Wadden Sea and the Camargue site, there was a reduction in RMSE of LG-Mod wind directions up to 7° and about 45° and also a decrease in wind speed RMSE values up to 0.7 m/s and 2.1 m/s, respectively.
Majidi Nezhad et al. (2020b) developed a new combined algorithm to integrate wind speed analysis and forecasting, using the S-1 satellite by processing images and the Adaptive Neuro-Fuzzy Inference System (ANFIS), and also the Bat algorithm. In the first step, the SNAP software was used to detect offshore wind potential using S-1 satellite images. A GIS software was used to map wind speed and direction and thus better understand the wind regime. In the next step, 10 hot spot points were chosen based on their wind speed high energy potential and the possibility to install WTGs at those hot spot sites. In Table 4, results of wind source assessment using the S-1 satellite are summarized for easier visualization.
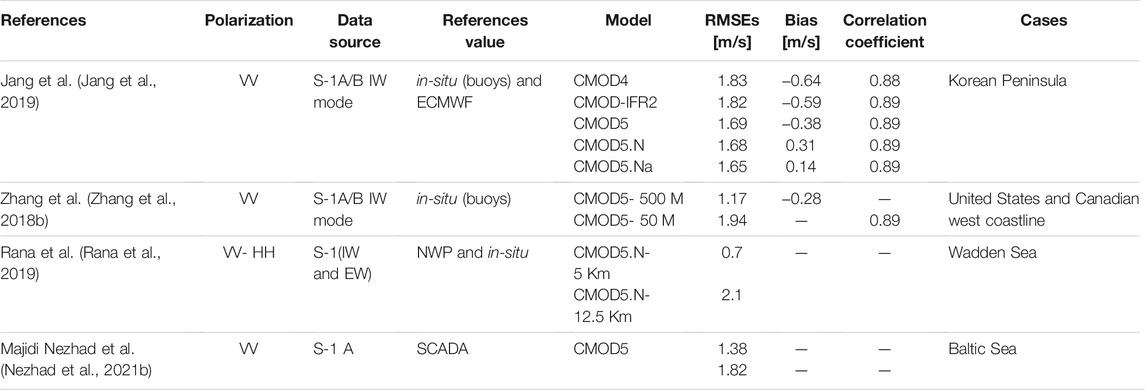
TABLE 4. The results of wind source assessment using S-1 satellite models and results are summarized.
Wave Potential Assessment
In general, there are three traditional types of wave recovery algorithms and methods from single-polarization of SAR satellite data that can be adopted. These three traditional methods can be categorized as follows (Shao et al., 2016):
1) Theory-based algorithms, for instance, Semi-parametric Retrieval Algorithm (SPRA), Max Planck Institute (MPI) method, Partition Shift (PA) method, and Parameterized First-guess Spectrum Method (PFSM). All of these algorithms and methods use first-guess wave spectra, which can be obtained from ocean wave models or from parametric functions;
2) Experimental algorithms such as CWAVE-ERS, CWAVE-ENVI, are very popular and such popularity can be attributed to not using previous wind information from SAR satellites;
3) Extraction of wave information from the NRCS by SAR satellites. These algorithms are designed using the complex hydrodynamic modulation transfer performance of an experimental performance between Hs and NRCS (Shao et al., 2016).
In the following paragraph, the above-mentioned algorithms are discussed. Pleskachevsky et al. (2019) developed a new algorithm CWAVE-S1-IW using the S-1 imagery with 250 km swath for assessing two SSW parameters, 1) Significant Wave Height (SWH or Hs), 2) and SSW that consists of a sequence of individual images. The SSP is then fully automated in NRT services to estimate wavelengths of thousands of kilometers in the direction of flight of the SAR satellite. It should be noted that SSP allows the automatic processing of S-1 IW satellite imagery with global vision capability at VV or HH polarization, including storms, cyclones, and huge storms with an RMSE of 80 cm for Hs in the Gulf of Alaska.
Ding et al. (2019) applied and developed ocean wave retrieval algorithms using SAR intensity spectrum into a wave on Parameterized First-guess Spectrum Method (PFSM) for C and X bands of SAR satellites. Then the PFSM algorithm was applied to investigate the performance of dual-polarization C band S-1 satellite of EW and IW mode level-1 product. Finally, two parameters under study, SWH, and MWP, were compared with the WAVEWATCH-III model simulations data. The validation of this study shows a 0.69 m and 0.62 s RMSE for SWH and MWP with a −0.01 m and −0.17 s bias for SWH and MWP. In conclusion, they confirmed the applicability of the PFSM algorithm for wave retrieval from S-1 satellite images.
Lin et al. (Shao et al., 2017) explained the accuracy of two ocean wave parameters, SWH and MWP, calculated from a SAR-derived wave spectrum retrieved from S-1 (VV) images. In-situ buoys measurements have been used to obtain wind direction parameters and then a novel C band GMF (C-SARMOD) was adopted to obtain wind speed. In the next step, a PFSM algorithm was employed to the SWH and the MWP received by using the wind speed SAR satellite data. The comparison showed the wind speed Standard Deviation (STD), SWH, and MWP were 1.6 m/s, 0.54 m, and 2.14 s respectively with good accuracy for wind retrieval with an acceptable error. The PFSM algorithm results compared with the European Centre for Medium-range Weather Forecasts (ECMWF) reanalysis grids wave data show STD parameters for SWH and MWP were 0.67 m and 2.21 s respectively. The results of this study show that the PFSM algorithm is useful for wave recovery of VV polarization image from S-1 satellite through SAR-derived wind speed using the new GMC-SARMAD.
Pramudya et al. (2019) developed an algorithm to directly assess the SWH of ocean waves relieved with S-1 satellites imagery of the near-range direction. The NRCS slope was derived with respect to the SAR wave incidence angle using an iterative scheme from S-1 satellite images. In total, 69 S-1A and 1 B images were compared with in-situ buoys data from the National Data Buoy Centre (NDBC) and also used to estimate Hs and validate the improvements of the developed algorithm from 1-year data. The results showed that the developed algorithm estimating SWH under low to moderate wind forcing conditions (4–10 ms−1) performed well.
Shao et al. (2016) developed a semi-empirical function algorithm using S-1 imagery with VV-polarization for estimating Hs and Time Mean Wave (Tmw) period parameters. The semi-empirical function was able to describe the relationship between several factors, Hs and cut-off wavelength, SAR incidence angle, and wave propagation direction of SAR look direction. In addition, Hs and cut-off wavelength were used to calculate Tmw using another empirical function algorithm. In total, 106 S-1 images with VV-polarization compared with 150 matchup points from in-situ measurement buoys tool were analyzed. Altogether, 93 and 57 matchup points were used to tune the coefficients of the semi-empirical function algorithm and validation. Final results show that 0.69 m RMSE for Hs with an 18.6% and also 1.98 s RMSE of Tmw with a 24.8% scatter index can be obtained. The results of this study show the algorithm has been successful in retrieving wave parameters from SAR satellites data. In Table 5, results of wave source assessment using the S-1 satellite are summarized for easier visualization.
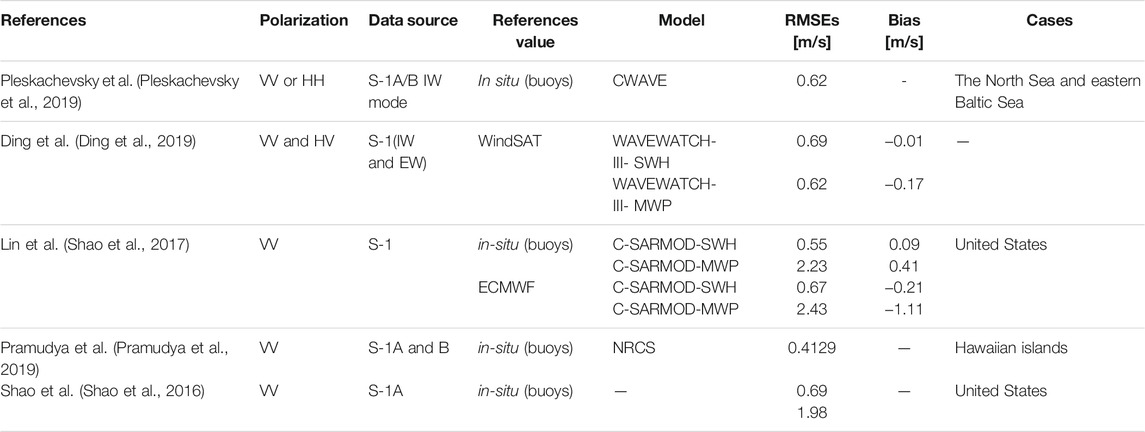
TABLE 5. The results of wave source assessment using S-1 satellite models and results are summarized.
Biomass Potential Assessment
In biomass estimation methods, researchers can refer to the method of combining different inferences obtained from SAR satellites. In recent years, various types of large-scale satellite data have been used, reaching spatial and temporal resolutions that are suitable for evaluating and measuring different types of biomasses. These studies show that the improvement in biomass estimation depends not only on the type of image satellite data but also on the image-processing techniques that are adopted. Many other factors such as environmental factors and the topography of the study area can affect the accuracy of the estimation. For this reason, a full understanding of previous efforts in estimating biomass types can be used to design an efficient method for image analysis in different regions. S-1 satellite data have a kind of contemplation of the study area, as a result of which it can examine many features of interest, such as tree height, size of the tree canopy, identify the Diameter Breast Height (DBH), and the type of species being studied. Thus, it can estimate the size of biomass cover in large areas and the amount of forest inventory using S-1 satellite data. However, biomass estimates are usually of different types and their inventory has many spatial, attributive, temporal, and forgotten regions. S-1 satellite data can easily fill these gaps and thus lead to the estimation of forest inventories with estimates close to the actual value.
S-1 satellite data can be used at different scales to obtain information directly by considering the specific indexes that are considered for each diagnosis of each parameter to obtain appropriate information about biomass types. Studies show that the use of S-1 satellite data for the analysis of various biomasses in different climatic zones has increased significantly, especially in areas with very cloudy weather, since it is not possible to use other satellites such as optical satellites. This is particularly relevant since most of the areas with high forest cover are located in areas that have a humid climate with a large number of cloudy days. Indeed, this ability of SAR satellite systems to collect data in all weather and light conditions has greatly increased their popularity (Chiarito et al., 2021).
On the other hand, S-1 satellite sensors can easily penetrate vegetation in varying degrees and obtain key information about the amount and distribution of Three-Dimensional (3-D) vegetation. Many studies with S-1 satellites are based on the development of classification algorithms and biomass estimation focused on high-transaction forests.
Optical satellite data are very suitable for examining surface changes on Earth, but there are limitations due to the clouds. On the other hand, SAR satellite data can be well used to complement the problems of optical satellite data, because SAR satellite data are not affected by weather conditions. In addition, radiometric and atmospheric factors can be important in improving image quality. Topographic factors can cause reflection on vegetation and biomass, which has led to a variety of SAR satellite techniques. Of course, it should be noted that many factors such as the reflection on the vegetation can be compensated by using different bands in the optical satellite. This satellite data well provides its potential to obtain spatial information from the surface of the Earth and a complete description of the various vegetation characteristics of the study area (Wiseman et al., 2014). This feature is well demonstrated due to the data sensitivity of the SAR satellite to the dielectric and the characteristics of the surface of the Earth (Abdel-Hamid et al., 2020). C (S-1) and X-band satellite data are used in many studies to remotely measure plants and grasslands (McNairn et al., 2009), although in many cases L-band satellite data are also used for these studies (Yekkehkhany et al., 2014). The results of studies show that SAR backscatters satellites (P and L bands) can evaluate and assess the main parameters of forest biomass as well, for example, tree age (Lucas et al., 2020), tree height (Abbas et al., 2020), DBH (Morin et al., 2019), and tree dryness (Hernández-Stefanoni et al., 2020). Fast methods with more accurate tool measurements of these parameters by SAR satellites can help to manage and sustainably develop how and when to properly manage these sources. Many of these studies focus on the polar parameters of single scenes or time series (Kyriou and Nikolakopoulos, 2018). On one hand, due to the significant growth of SAR studies, few studies have been conducted to assess vegetation in pastures and plains, as well as regional drought. The main reason is the lack of free access to many satellite imagery data and undeveloped SAR satellite products, which led to spatial and temporal discontinuities during the quantitative and qualitative studies in a wide geographical area. Time series analysis of the remote sensing data of SAR satellites is a very useful tool for monitoring and describing land surface characteristics in large areas. Hence, Normalized Difference Vegetation Index (NDVI) profiles are one of the popular parameters in vegetation assessment and monitoring studies (Abdel-Hamid et al., 2020). In the following paragraphs, the results of many of the recent studies in forest source measurements with S-1 satellites are highlighted, which can help to update and better understand the subject.
Frison et al. (2018) used data from the S-1 satellite to monitor by seasonal observations the temperate forests in France. The authors stated that the SAR backscattering coefficient proportion of VV to VH (and VV/VH) showed a good correlation with vegetation seasonality phenology as well, and confirmed the result of a comparison using the NDVI profiles derived from Landsat 8 (r = 0.77) satellite over the stand of deciduous trees. The final results of this study show that SAR satellite data have a very good potential for studying vegetation and the phenology is evaluated with more appropriate accuracy compared to optical satellites that suffer from different weather conditions. They are not atmosphe sensitive and said that in the future these observations will be analyzed using electromagnetic models.
Pulella et al. (2020) stated that S-1 satellite data for short-range series forest mapping areas have the ability to use interferometry for monthly mapping. In addition, they presented an analysis to increase the accuracy of classification using textural information, derived from S-1 satellite backscatter. In the final part of the article, the data obtained in the previous stages have been increased and updated by using further analysis and reviewing them with selected scenes by the S-2 satellite, by adding the thinnest step to the data from the previous steps at the end, the results have good and significant accuracy.
Schmullius et al. (Schmullius, 2020) used the ability of individual sensors and their common potential to map forest cover for sites with two different types of cover (for South Africa and Thuringia). In a previous article (Schmullius, 2020), the authors use machine learning classifications that include a combination of S-1 and S-2 satellite data to extract the most accurate information on the studied forest and non-forest areas. Using this method, the accuracy of forest classification was 90.9 and 93.2%, respectively, for S-1 and S-2, in which the correction was validated using correlation when using spatial validation for the data set. This is the case in which the classification performed with S-1 satellite data offers the lowest total accuracy of 87.5%, and on the other hand, the analysis performed with S-2 optical satellite shows an accuracy close to 91.9%.
Forkuor et al. (2020) used time series on annual and monthly intervals obtained from S-2 and S-1 satellites for AGB biomass mapping in Sudan. In this study, eight experiments were performed for different configurations using SAR and optical satellite data. The S-1 and S-2 satellites were used for AGB potential detection and mapping, and optical images from the S-2 satellite were tested for AGB parameter assessment mapping. To improve the evaluation accuracy in the AGB mapping, the share of derivatives of each of the obtained satellite images was determined and in the next step, 40% of the obtained data was used to predict the maps. The results of this study using the applied methods show that the AGB reserves per hectare are less than 90 mg/ha and as the results of the studies mentioned in the above sections, the S-2 optical and S-1 SAR satellite data are more accurate in predicting as shown by the RMSE and MAE (i.e. RMSE = 60.6, MAE = 19.2 and RMSE = 78.6, MAE = 25, respectively). The authors stated that by combining data obtained from radar and optical satellites, better results can be achieved predicting AGB at the end (RMSE = 45.4, MAE = 16.3).
Baumann et al. (2018) introduced a new method for independent mapping to cover shrubs and trees using S-1 SAR and Landsat-8 optical satellite images to gain a better understanding of study areas in South American forests. The authors introduced this method using a wide range of data from high-resolution S-1 satellite images to cover trees and shrubs up to 30 m height from the land surface continuously. The results show that the developed regression models have high and medium prediction capacity (68.5% for plant cover and 85.5% for tree cover), which can create acceptable maps with high accuracy for forest areas. The results of this study indicate that the use of combined models using S-1 and Landsat-8 satellite images have a more accurate performance compared to models that adopt single-sensor satellites images and can identify dense forest areas. In Table 6, the results of biomass source assessment using the S-1 satellite are shown.
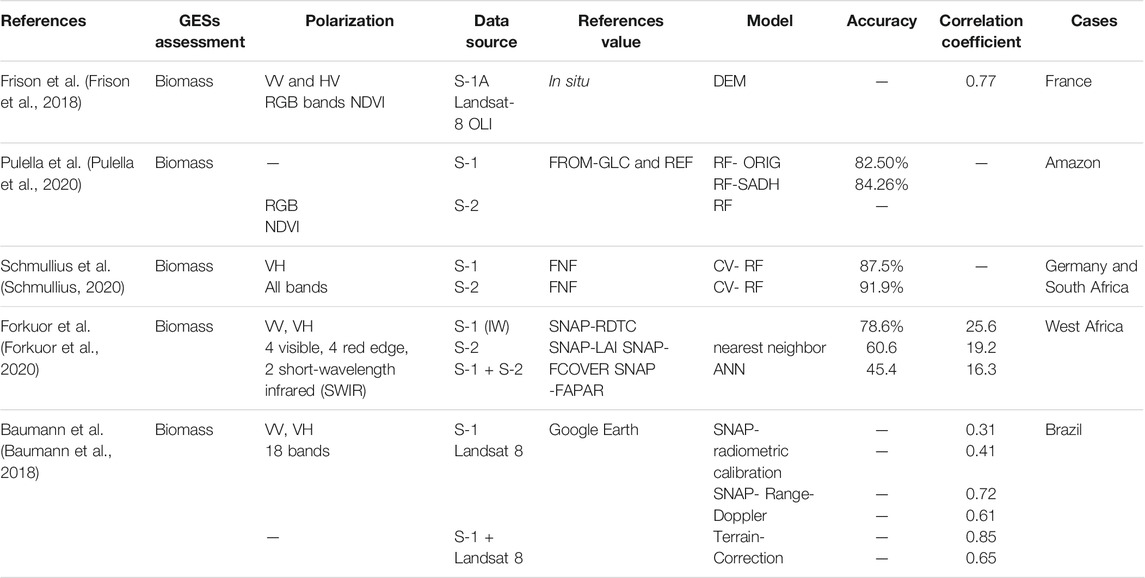
TABLE 6. The results of biomass source assessment using S-1 satellite models and results are summarized.
Geothermal Potential Assessment
The history of using SAR satellites in geothermal activities evaluation dates back to the 1980s (Maghsoudi et al., 2018). However, the use of this tool has grown significantly to identify and monitor known geothermal systems to evaluate and also discover new geothermal systems, selecting the best sites and strategies for developing engineering geothermal systems, and reducing drilling and investment risks in proposed systems (Faulds and Hinz, 2015). Various studies in different fields such as heat flux mapping, geo-hazard mitigation (Montalti et al., 2019), and surface deformation in geothermal sites (Lubitz et al., 2013) can be found (Vasco et al., 2013).
In this case, the Interferometric Synthetic Aperture Radar (InSAR) (Jefriza et al., 2020) algorithms technique is specifically designed for long-term analysis of SAR satellite scenes (Raspini et al., 2018). Today, the InSAR technique is widely used in the energy sector because of its extraordinary ability to monitor the production-induced phenomena in large areas (Mellors et al., 2018). This technique can also be used for various studies such as geothermal activity, gas extraction, production plant stability monitoring, integrity monitoring of pipelines, production plants, etc. (Norce, 2020). By means of the InSAR technique, the phase difference between SAR satellite images can be investigated at different times due to relative changes in the surface of the Earth (Mellors et al., 2018). Also, SAR Interference (InSAR) is a geodetic method in which geographical information of the studied land is provided to researchers with high speed and reliable accuracy. The use of such high-precision geodetic measurement methods with large-to-small spatial and temporal resolution can significantly contribute to future prediction research of environmental and urban planning (Ramirez et al., 2020).
One of the main reasons for this dramatic growth is the use of SAR such as the Persistent Scatterer Interferometric Synthetic Aperture Radar (PS-InSAR) and the Differential Synthetic Aperture Radar interferometry (D-InSAR) satellites due to their unique ability to obtain the deformation of the host rock due to fluid migration in the depths of the Earth (Solari et al., 2018), which of course is accompanied by high spatial resolution (Maghsoudi et al., 2018). SAR Interference (InSAR) and Advanced InSAR Differential (A-DInSAR) are geodetic measurement methods that have proven their ability to evaluate and monitor surface changes in centimeters to millimeters at ground topography and surface deformation. DInSAR geodetic measurement methods use information between two complex images of radar receptive satellites taken at different times over a study area that can provide an interference approach. To create an interferometric approach, the images used must have the same geometry to be able to create coherent interference pairs to generate, identify, map, and monitor digital deformation (Ramirez et al., 2020). A-DInSAR is a method that has been introduced as a type of multitime InSAR (MT-InSAR) (Ferretti et al., 2001) and has been developed and designed to solve the limitations of the InSAR time series (TS-InSAR) (Hooper et al., 2012). In addition, another new method called SqueeSAR has recently been developed with the aim of combining the PS and DS methods (Ferretti et al., 2011).
Receveur et al. (2019) used S-1 satellite image data to analyze a 2 year-long time series for geothermal energy potential assessment in Iceland. Their research shows that there is a deformed geothermal source at a depth of approximately 1 km below the land surface, and the source of energy shrinks at a rate close to (0.7–0.9) × 105 m3 yr−1. The authors of this study concluded that the change in the volume of the geothermal energy source near the steam cap mouth is actually in the highest part of the geothermal reservoir with a depth of 800–1,200 m with information obtained from the study of reservoir structure and rock properties. Eneva et al. (2018) applied InSAR satellite scenes from Envisat and Sentinel to identify the surface geothermal deformation rates using time series in the Coso Geothermal Field (CGF) and surrounding regions. The range of size ∼450 km2 of the Line Of Sight (LOS) by InSAR satellite scenes from Envisat and S-1 were used for permanent and dispersed scatterers from several locations. The main observations at CGF included the following parameters: the maximum reflow of −27.6 mm/yr and the S-1 satellite period the lower maximum subsidence of −19.1 mm/yr for a subsidence area of size ∼70 km2. It can be concluded that the use of InSAR data based on the Pyroclastic model can lead to accurate prediction of the geothermal source in different areas, which can be used to better understand how to exploit geothermal projects in the management of their reservoirs.
Agustan et al. (2016) used data from the ALOS-2 and S-1 satellites to identify the subsidence change area by applying two Single Look Complex (SLC) images by several observation times of the Pluit region. The deformation showed near 12 cm from a one-year-long study of the Pluit region. The SNAP software and series data processing tool was used in the process of land recovery from the S-1 satellite image.
Xu et al. (2017) collected data by S-1 satellites images for frequent and short-term interferences in consecutive time series recovery for the evaluation of the global deformation of the Cerro Perito faults in northern Baja California, Mexico. They also applied a complete geometric approach to image arrangement using previous studies that can easily provide an arrangement of more than 1/200 pixels needed to check for more accurate phase recovery. They developed S-1 satellite time series time interference measurements using a coherence-based subset method using climatic settings and modeling common point accumulation. Owing to burst discontinuities usually smaller than (<1.4 mm), they did not use an increased spectral variation that could completely eliminate subsidence in the Cerro Prieto geothermal field. The rate of subsidence is 160 mm per year at its highest, which can lead to a deformation of 40 mm per year in the end due to the extraction of geothermal fluids and the resulting heat. In Table 7, the results of geothermal source assessment using the S-1 satellite are summarized.
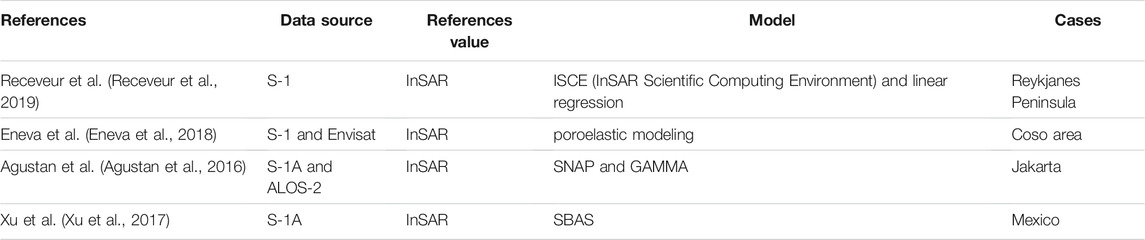
TABLE 7. The results of geothermal source assessment using S-1 satellite models and results are summarized.
Discussion
High-resolution mapping can provide important information to address the different GES issues, especially in areas where terrestrial data are inaccessible or scattered. Combining and comparing EO tools based on satellite and in-situ collection data can provide the high-resolution time series (Hooper et al., 2012) that are valuable information for assessing new GESs installations or expansion of network infrastructures (Leibrand et al., 2019b).
Satellite RS data have great potential to improve governance and reliable, cost-effective, flexible data access that can fill the gaps (Ieee, 1994) related to forgotten areas, unsolved challenges, and opportunities to be created in different developed and developing countries. In addition, satellite RS data can be merged with land-based geographic data to provide more detailed tools for diverse stakeholders in analyzing environmental sources (Schiller et al., 2020), such as the combination of GESs assessment and monitoring devices. This becomes even more understandable when considering the current applications of integrated EO satellites RS that still need to be expanded. Fortunately, there are now examples of successful satellite RS data being used in real-world programs in developed countries. These examples can be used as an example for developing countries. It should be noted that recognizing the gaps, challenges, and opportunities associated with such online platform-based projects for end-users can clearly demonstrate the technological and scientific differences across different countries (Amori et al., 2019). In fact, it can be said that the more technological advances are made in the country in question, the more reliable and realistic the data and datasets. It entails access to the country’s online platform-based projects using satellite data. This is a situation in which many models constantly need automatic access to data that they can run with the latest data output (Manfren et al., 2020).
Given the dynamics of the data received from the satellite RS, they can be used in many online studies and platforms to actively understand and learn from their analysis. Online applications have been performed on the scattered presentation of dynamic data sets, providing promising results even with EO satellite-based big data. The organization of data provider programs should be accelerated, and there is a need for the integration of satellite products and in-situ data with predictive tools with greater clarity, simplicity, and transparency (Fujii et al., 2019). NASA and the ESA have made much of their data available to users for free, with unrestricted policy support. Governments and aerospace mission organizations should be able to use the unlimited potential of many public and academic users around the world to better and hasten a deeper understanding (more quickly, and at a cheaper rate) of the Earth we live on.
Researchers and providers of data and end-user products must ensure that training and capacity building is available to enhance public awareness compatible with users’ daily lives. Although these tutorials take a long time, the final product can be used in case studies to provide examples of training for other users. The user needs studies to allow project managers and developers to tailor datasets to users’ needs in easily accessible formats. As above-mentioned, many sectors are still out from this integration such as the tidal current energy (Barbarelli and Nastasi, 2021). Currently, due to the extensive coverage of the sea areas, a large amount of information is provided to universities and companies on an hourly basis, which has increasingly allayed old concerns about a lack of GESs basic information.
As a matter of fact, existing techniques and methods are incapable of solving analytical challenges relating to EO-based satellite data. Fortunately, machine learning methods are growing at a remarkable rate due to the dramatic growth of technology that can fully cover EO-based satellite data for GESs area (Majidi Nezhad et al., 2021). These methods can be very effective in the context of multisource data with a wide range of dimensions. They can also be used to transfer large amounts of data. Given the dynamics of the data received from the satellite RS data, it can be used in many online applications and platforms to actively understand and learn from their analysis.
Conclusion
The best use of GESs requires accurate knowledge and understanding of the distribution, abundance, and quality of various sources. The remote sensing techniques of the S-1 (SAR) satellite provide the ability to quickly evaluate GESs in large and small areas with relatively fast and low-cost methods. The use of the S-1 satellite ensures that renewable energies are sustainably identified and efficiently exploited. It also has great potential in estimating and evaluating renewable energies in comparison with field measurement methods that need to be installed on-site for more than a year, leading to significant labor costs and a long data acquisition time. However, the choice of satellites techniques should be made according to the type of source studied and the scale of the study area, which is an important factor for the proper selection of land or sea-level assessment methods.
The S-1 (SAR) satellite high-resolution images can provide accurate estimates of GESs, which can contain large amounts of data for large study areas. This amount of data can be obtained in the shortest possible time and can be very valuable if combined with ground data and other aerial photographs. The data obtained in this way can play a key role in carrying out renewable energy projects and better understanding forgotten areas. It should be noted that data from the S-1 satellite with different polarization, appropriate resolution, and different angles can provide a good opportunity to study and evaluate GESs. Estimating different GESs using satellite data can be a complex analysis process that involves many different measurement factors such as mixed pixels, data saturation, and biophysical environments. Therefore, choosing the right algorithms to extract information from satellite data can be very difficult, since it requires high analytical skills and a good understanding of interdisciplinary knowledge. In addition, by using SAR satellite techniques, other aspects of the use of extraction and installation of energy converters can be addressed in matters related to biodiversity conservation, water conservation, tourist activities, maritime and public transport, and so on.
The main observations of this research can be summarized as follows: the VV polarization can be called the most practical polarization in marine studies. The VV polarization can be considered the best input in measurement models such as CMOD.N model for open areas and C-SARMOD2 model for coastal areas and WAVEWATCH-III model for wave ocean assessment, due to high accuracy in measuring parameters such as wind speed, SWH, MWP, Tmw, and Hs. On the other hand, it can be noted that polarization VH is better when used in measuring parameters related to forest studies, but it should not be forgotten that if S-1 satellite data are used simultaneously with optical satellite data such as S-2, the highest degree of accuracy is achieved. Finally, InSAR data can be used as a measure of the surface temperature of the Earth as the best measurement tool in the assessment section. It should be noted that considering the strengths and weaknesses of each source and model, a combination of them can cover these weaknesses and lead to better results. Therefore, for a thorough and comprehensive study of these tools, it is necessary to possess interdisciplinary knowledge to make the best use out of it.
By analyzing the capabilities of S-1 satellites, it is possible to identify the usefulness of its data capabilities to investigate important issues and reduce the shortcomings in different areas, which are mainly related to the lack and low quality of data. This can quickly close the data gap identified in different areas with an analysis of the satellite data, which leads to the final recognition of the academic and/or public end-user. Of course, it should not be forgotten that the implementation of all analysis processes on the potential of different sources of GESs around the world can serve as a starting point for further processing and detailed analysis to fill the data gaps at different scales. Obviously, the results can be considered an overview of the techniques used in the analysis of the S-1 satellites, which always need updating. Given the interdisciplinary nature of this subject, which requires a proper understanding of the various tools and disciplines, such research should be more closely aligned with other contexts. However, such articles can provide a useful and interesting framework for the capabilities of the S-1 satellites that end-users, decision-makers, local and national authorities should consider improving their monitoring systems. In addition, the method used to survey different areas with S-1 satellite data has the ability to be replicated, which should be repeated to make the same research in different basins, as well as possible.
Author Contributions
MM: Conceptualization, Design, Methodology, Writing. BN: Methodology, Review, Writing. DG: Methodology, Review, Writing. ML: Review. GP: Supervision. DAG: Datasets and Project management.
Conflict of Interest
The authors declare that the research was conducted in the absence of any commercial or financial relationships that could be construed as a potential conflict of interest.
Publisher’s Note
All claims expressed in this article are solely those of the authors and do not necessarily represent those of their affiliated organizations, or those of the publisher, the editors, and the reviewers. Any product that may be evaluated in this article, or claim that may be made by its manufacturer, is not guaranteed or endorsed by the publisher.
References
Abbas, S., Wong, M. S., Wu, J., Shahzad, N., and Muhammad Irteza, S. (2020). Approaches of Satellite Remote Sensing for the Assessment of Above-Ground Biomass Across Tropical Forests: Pan-Tropical to National Scales. Remote Sensing. 12 (20), 3351–3438. doi:10.3390/rs12203351
Abdel-Hamid, A., Dubovyk, O., Graw, V., and Greve, K. (2020). Assessing the Impact of Drought Stress on Grasslands Using Multi-Temporal SAR Data of Sentinel-1: a Case Study in Eastern Cape, South Africa. Eur. J. Remote Sensing. 53, 3–16. doi:10.1080/22797254.2020.1762514
Agustan, E., Sulaiman, A., and Ito, T. (2016). Measuring Deformation in Jakarta Through Long Term Synthetic Aperture Radar (SAR) Data Analysis. IOP Conf. Ser. Earth Environ. Sci. 47, 012022. doi:10.1088/1755-1315/47/1/012022
Ahsbahs, T., Badger, M., Volker, P., Hansen, K. S., and Hasager, C. B. (2018). Applications of Satellite Winds for the Offshore Wind Farm Site Anholt. Wind Energ. Sci. 3, 573–588. doi:10.5194/wes-3-573-2018
Amori, D., Giovanardi, F., Piras, G., Groppi, D., Cumo, F., and de Santoli, L. (2019). An Identification and a Prioritisation of Geographic and Temporal Data Gaps of Mediterranean Marine Databases. Sci. Total Environ. 668, 531–546. doi:10.1016/j.scitotenv.2019.02.417
Barbarelli, S., and Nastasi, B. (2021). Tides and Tidal Currents—Guidelines for Site and Energy Resource Assessment. Energies. 14 (19), 6123. doi:10.3390/en14196123
Baumann, M., Levers, C., Macchi, L., Bluhm, H., Waske, B., Gasparri, N. I., et al. (2018). Mapping Continuous Fields of Tree and Shrub Cover Across the Gran Chaco Using Landsat 8 and Sentinel-1 Data. Remote Sensing Environ. 216 (July), 201–211. doi:10.1016/j.rse.2018.06.044
Bian, X., Shao, Y., Zhang, C., Xie, C., and Tian, W. (2020). The Feasibility of Assessing Swell-Based Bathymetry Using SAR Imagery From Orbiting Satellites. ISPRS J. Photogrammetry Remote Sensing. 168 (April), 124–130. doi:10.1016/j.isprsjprs.2020.08.006
Brisco, B., Mahdianpari, M., and Mohammadimanesh, F. (2020). Hybrid Compact Polarimetric SAR for Environmental Monitoring With the RADARSAT Constellation Mission. Remote Sensing. 12 (20), 3283–3320. doi:10.3390/rs12203283
Carolis, G. D., Parmiggiani, F., and Arabini, E. (2004). Observations of Wind and Ocean Wave Fields Using ERS Synthetic Aperture Radar Imagery. Int. J. Remote Sensing. 25 (7–8), 1283–1290. doi:10.1080/01431160310001592184
Chaturvedi, S. K., Banerjee, S., and Lele, S. (2020). An Assessment of Oil Spill Detection Using Sentinel 1 SAR-C Images. J. Ocean Eng. Sci. 5 (2), 116–135. doi:10.1016/j.joes.2019.09.004
Chiarito, E., Cigna, F., Cuozzo, G., Fontanelli, G., Mejia Aguilar, A., Paloscia, S., et al. (2021). Biomass Retrieval Based on Genetic Algorithm Feature Selection and Support Vector Regression in Alpine Grassland Using Ground-Based Hyperspectral and Sentinel-1 SAR Data. Eur. J. Remote Sensing. 54 (1), 209–225. doi:10.1080/22797254.2021.1901063
Corcione, V., Buono, A., Nunziata, F., and Migliaccio, M. (2021). A Sensitivity Analysis on the Spectral Signatures of Low-Backscattering Sea Areas in Sentinel-1 SAR Images. Remote Sensing. 13 (6), 1183. doi:10.3390/rs13061183
Dechesne, C., Lefèvre, S., Vadaine, R., Hajduch, G., and Fablet, R. (2019). Ship Identification and Characterization in Sentinel-1 SAR Images With Multi-Task Deep Learning. Remote Sensing. 11 (24), 2997–3018. doi:10.3390/rs11242997
Diaz, P., Bay, C., Ejling, S., and Krogh, T. (2013). Remote Sensing for Wind Energy. Copenhagen, Denmark: DTU Wind Energy-DTU Wind Energy.
Ding, Y., Zuo, J., Shao, W., Shi, J., Yuan, X., Sun, J., et al. (2019). Wave Parameters Retrieval for Dual-Polarization C-Band Synthetic Aperture Radar Using a Theoretical-Based Algorithm Under Cyclonic Conditions. Acta Oceanol. Sin. 38 (5), 21–31. doi:10.1007/s13131-019-1438-y
Dostálová, A., Hollaus, M., Milenković, M., and Wagner, W. (2016). Forest Area Derivation From Sentinel-1 Data. ISPRS Ann. Photogramm. Remote Sens. Spat. Inf. Sci. III-7 (June), 227–233. doi:10.5194/isprs-annals-iii-7-227-2016
Emeis, S., Münkel, C., Vogt, S., Müller, W. J., and Schäfer, K. (2004). Atmospheric Boundary-Layer Structure From Simultaneous SODAR, RASS, and Ceilometer Measurements. Atmos. Environ. 38 (2), 273–286. doi:10.1016/j.atmosenv.2003.09.054
Eneva, M., Barbour, A., Adams, D., Hsiao, V., and Blake, K. (2018). Satellite Observations of Surface Deformation at the Coso Geothermal Field, 42. Reno, NV: California–6.
Erinjery, J. J., Singh, M., and Kent, R. (2018). Mapping and Assessment of Vegetation Types in the Tropical Rainforests of the Western Ghats Using Multispectral Sentinel-2 and SAR Sentinel-1 Satellite Imagery. Remote Sensing Environ. 216 (July), 345–354. doi:10.1016/j.rse.2018.07.006
Euro Space Agency (2014). Available at http://www.esa.int/ESA_Multimedia/Images/2014/04/Sentinel_family.
Fang, H., Xie, T., Perrie, W., Zhang, G., Yang, J., and He, Y. (2018). Comparison of C-Band Quad-Polarization Synthetic Aperture Radar Wind Retrieval Models. Remote Sensing. 10 (9), 1448. doi:10.3390/rs10091448
Faulds, J. E., and Hinz, N. H. (2015). Favorable Tectonic and Structural Settings of Geothermal Systems in the Great Basin Region , Western USA: Proxies for Discovering Blind Geothermal Systems. Proceeding of the World Geotherm. Congr. Australia, IEEE, 19-25 April 2015, 1–6.
Fayad, I., Baghdadi, N., Guitet, S., Bailly, J.-S., Hérault, B., Gond, V., et al. (2016). Aboveground Biomass Mapping in French Guiana by Combining Remote Sensing, Forest Inventories and Environmental Data. Int. J. Appl. Earth Observation Geoinformation. 52, 502–514. doi:10.1016/j.jag.2016.07.015
Ferraro, G., Bernardini, A., David, M., Meyer-Roux, S., Muellenhoff, O., Perkovic, M., et al. (2007). Towards an Operational Use of Space Imagery for Oil Pollution Monitoring in the Mediterranean Basin: A Demonstration in the Adriatic Sea. Mar. Pollut. Bull. 54 (4), 403–422. doi:10.1016/j.marpolbul.2006.11.022
Ferretti, A., Fumagalli, A., Novali, F., Prati, C., Rocca, F., and Rucci, A. (2011). A New Algorithm for Processing Interferometric Data-Stacks: SqueeSAR. IEEE Trans. Geosci. Remote Sensing. 49 (9), 3460–3470. doi:10.1109/TGRS.2011.2124465
Ferretti, A., Prati, C., and Rocca, F. (2001). Permanent Scatterers in SAR Interferometry. IEEE Trans. Geosci. Remote Sensing. 39 (1), 8–20. doi:10.1109/36.898661
Forkuor, G., Benewinde Zoungrana, J.-B., Dimobe, K., Ouattara, B., Vadrevu, K. P., and Tondoh, J. E. (2020). Above-Ground Biomass Mapping in West African Dryland Forest Using Sentinel-1 and 2 Datasets - A Case Study. Remote Sensing Environ. 236, 111496. doi:10.1016/j.rse.2019.111496
Frison, P.-L., Fruneau, B., Kmiha, S., Soudani, K., Dufrêne, E., Toan, T. L., et al. (2018). Potential of Sentinel-1 Data for Monitoring Temperate Mixed Forest Phenology. Remote Sensing. 10, 2049. doi:10.3390/rs10122049
Fujii, Y., Rémy, E., Zuo, H., Oke, P., Halliwell, G., Gasparin, F., et al. (2019). Observing System Evaluation Based on Ocean Data Assimilation and Prediction Systems: On-Going Challenges and a Future Vision for Designing and Supporting Ocean Observational Networks. Front. Mar. Sci. 6 (JUL), 1–25. doi:10.3389/fmars.2019.00417
Gallagher, S., Tiron, R., Whelan, E., Gleeson, E., Dias, F., and McGrath, R. (2016). The Nearshore Wind and Wave Energy Potential of Ireland: A High Resolution Assessment of Availability and Accessibility. Renew. Energ. 88, 494–516. doi:10.1016/j.renene.2015.11.010
Geng, X., Shi, L., Yang, J., Li, P., Zhao, L., Sun, W., et al. (2021). Ship Detection and Feature Visualization Analysis Based on Lightweight CNN in VH and VV Polarization Images. Remote Sensing. 13 (6), 1184. doi:10.3390/rs13061184
Grieco, G., Lin, W., Migliaccio, M., Nirchio, F., and Portabella, M. (2016). Dependency of the Sentinel-1 Azimuth Wavelength Cut-Off on Significant Wave Height and Wind Speed. Int. J. Remote Sensing. 37 (21), 5086–5104. doi:10.1080/01431161.2016.1226525
Haarpaintner, J., and Hindberg, H. (2019). Multi-Temporal and Multi-Frequency Sar Analysis for forest Land Cover Mapping of the Mai-Ndombe District (Democratic Republic of Congo). Remote Sensing. 11, 2999–3024. doi:10.3390/rs11242999
Hansen, M. C., Potapov, P. V., Moore, R., Hancher, M., Turubanova, S. A., Tyukavina, A., et al. (2013). High-Resolution Global Maps of 21st-Century Forest Cover Change. Science. 342, 850–853. doi:10.1126/science.1244693
Hasanlou, M., Shah-Hosseini, R., Seydi, S. T., Karimzadeh, S., and Matsuoka, M. (2021). Earthquake Damage Region Detection by Multitemporal Coherence Map Analysis of Radar and Multispectral Imagery. Remote Sensing. 13 (6), 1195. doi:10.3390/rs13061195
Hernández-Stefanoni, J. L., Castillo-Santiago, M. Á., Mas, J. F., Wheeler, C. E., Andres-Mauricio, J., Tun-Dzul, F., et al. (2020). Improving Aboveground Biomass Maps of Tropical Dry Forests by Integrating LiDAR, ALOS PALSAR, Climate and Field Data. Carbon Balance Manage. 15 (1), 1–17. doi:10.1186/s13021-020-00151-6
Hersbach, H., Stoffelen, A., and De Haan, S. (2005). An Improved C-Band Scatterometer Ocean Geophysical Model Function: CMOD5. J. Geophys. Res. 112 (572), 863–870. doi:10.1029/2006JC003743
Hooper, A., Bekaert, D., Spaans, K., and Arıkan, M. (2012). Recent Advances in SAR Interferometry Time Series Analysis for Measuring Crustal Deformation. Tectonophysics. 514-517, 1–13. doi:10.1016/j.tecto.2011.10.013
Howari, F. M. (2015). Prospecting for Geothermal Energy Through Satellite Based thermal Data : Review and the Way Forward. Glob. J. Environ. Sci. Manage. 1 (4), 265–274. doi:10.7508/gjesm.2015.04.001
Ieee (1994). Ground-based Remote Profiling in Atmospheric Studies: an Overview. Proc. IEEE. 82 (3), 1–43. [Online]. Available at: papers3://publication/uuid/53FD0372-2429-4907-93DC-2C01A7C81889%0Apapers3://publication/uuid/7EE8F99D-E145-4170-85C5-B0ADF3D906EB. doi:10.1109/5.272138
Inger, I. M. D., Benson, D., Booth, C. G., Embling, C. B., Grecian, W. J., Heymans, J. J., et al. (2014). Resolving Issues With Environmental Impact Assessment of marine Renewable Energy Installations. Front. Mar. Sci. 1 (December), 1–5. doi:10.3389/fmars.2014.00075
Iqbal, M., and Juliarka, B. R. (2020). Identification of Permeability Level by Using Fault Fracture Density Analysis and Landsat 8 OLI at Ulubelu Geothermal Area. IOP Conf. Ser. Earth Environ. Sci. 537, 012016. doi:10.1088/1755-1315/537/1/012016
Ja afar, A. (2018). A Review of Geothermal Mapping Techniques Using. Sci. World J. 12, 72–82. [Online]. Available at: https://www.ajol.info/index.php/swj/article/view/166100.
Jacobsen, S., Lehner, S., Hieronimus, J., Schneemann, J., and Kühn, M. (2015). Joint Offshore Wind Field Monitoring with Spaceborne Sar and Platform-Based Doppler LiDAR Measurements. Int. Arch. Photogramm. Remote Sens. Spat. Inf. Sci. XL (7W3), 959–966. doi:10.5194/isprsarchives-XL-7-W3-959-2015
Jagdish, S., Kumar, S. V. V. A., Chakraborty, A., and Kumar, R. (2018). Validation of Wind Speed Retrieval from RISAT-1 SAR Images of the North Indian Ocean. Remote Sensing Lett. 9 (5), 421–428. doi:10.1080/2150704X.2018.1430392
Jang, J.-C., Park, K.-A., Mouche, A. A., Chapron, B., and Lee, J.-H. (2019). Validation of Sea Surface Wind From Sentinel-1A/B SAR Data in the Coastal Regions of the Korean Peninsula. IEEE J. Sel. Top. Appl. Earth Observations Remote Sensing. 12 (7), 2513–2529. doi:10.1109/JSTARS.2019.2911127
Jefriza, H., Lateh, H., Yusoff, I. M., Abir, I. A., Syahreza, S., Razi, P., et al. (2020). SAR Sentinel-1: Mitigation Strategies for Earth's Surface Displacements in Aceh, Indonesia. IOP Conf. Ser. Earth Environ. Sci. 500, 012086. doi:10.1088/1755-1315/500/1/012086
Kanjir, U., Greidanus, H., and Oštir, K. (2018). Vessel Detection and Classification From Spaceborne Optical Images: A Literature Survey. Remote Sensing Environ. 207, 1–26. doi:10.1016/j.rse.2017.12.033
Katona, T., and Bartsch, A. (2018). Estimation of Wind Speed over Lakes in Central Europe Using Spaceborne C-Band SAR. Eur. J. Remote Sensing. 51 (1), 921–931. doi:10.1080/22797254.2018.1516516
Khan, K. S., and Tariq, M. (2018). Wind Resource Assessment Using SODAR and Meteorological Mast - A Case Study of Pakistan. Renew. Sustain. Energ. Rev. 81, 2443–2449. doi:10.1016/j.rser.2017.06.050
Kristensen, L., Hjuler, M. L., Frykman, P., Olivarius, M., Weibel, R., Nielsen, L. H., et al. (2016). Pre-Drilling Assessments of Average Porosity and Permeability in the Geothermal Reservoirs of the Danish Area. Geotherm. Energ. 4, 4239. doi:10.1186/s40517-016-0048-6
Kyriou, A., and Nikolakopoulos, K. (2018). Assessing the Suitability of Sentinel-1 Data for Landslide Mapping. Eur. J. Remote Sensing. 51 (1), 402–411. doi:10.1080/22797254.2018.1444944
La, T. V., Khenchaf, A., Comblet, F., and Nahum, C. (2017). Exploitation of C-Band Sentinel-1 Images for High-Resolution Wind Field Retrieval in Coastal Zones (Iroise Coast, France). IEEE J. Sel. Top. Appl. Earth Observations Remote Sensing. 10 (12), 5458–5471. doi:10.1109/JSTARS.2017.2746349
Lang, S., and McKeogh, E. (2011). LIDAR and SODAR Measurements of Wind Speed and Direction in Upland Terrain for Wind Energy Purposes. Remote Sensing. 3 (9), 1871–1901. doi:10.3390/rs3091871
Leibrand, A., Sadoff, N., Maslak, T., and Thomas, A. (2019). Using Earth Observations to Help Developing Countries Improve Access to Reliable, Sustainable, and Modern Energy. Front. Environ. Sci. 7 (August), 1–14. doi:10.3389/fenvs.2019.00123
Leibrand, A., Sadoff, N., Maslak, T., and Thomas, A. (2019). Using Earth Observations to Help Developing Countries Improve Access to Reliable, Sustainable, and Modern Energy. Front. Environ. Sci. 7 (August), 1–14. doi:10.3389/fenvs.2019.00123
Liu, P. (2015). A Survey of Remote-Sensing Big Data. Front. Environ. Sci. 3, 1–6. doi:10.3389/fenvs.2015.00045
Lu, Y., Zhang, B., Perrie, W., Mouche, A., Li, X., and Wang, H. (2018). A C-Band Geophysical Model Function for Determining Coastal Wind Speed Using Synthetic Aperture Radar, 2018 Progress in Electromagnetics Research Symposium (PIERS-Toyama), 1-4 Aug. 2018, Toyama, Japan. IEEE, 1440–1446. doi:10.23919/PIERS.2018.8598163
Lubitz, C., Motagh, M., Wetzel, H.-U., and Kaufmann, H. (2013). Remarkable Urban Uplift in Staufen im Breisgau, Germany: Observations From TerraSAR-X InSAR and Leveling from 2008 to 2011. Remote Sensing. 5, 3082–3100. doi:10.3390/rs5063082
Lucas, R., Van De Kerchove, R., Otero, V., Lagomasino, D., Fatoyinbo, L., Omar, H., et al. (2020). Structural Characterisation of Mangrove Forests Achieved Through Combining Multiple Sources of Remote Sensing Data. Remote Sensing Environ. 237, 111543. doi:10.1016/j.rse.2019.111543
Maghsoudi, Y., Van Der Meer, F., Hecker, C., Perissin, D., and Saepuloh, A. (2018). Using PS-InSAR to Detect Surface Deformation in Geothermal Areas of West Java in Indonesia. Int. J. Appl. Earth Observation Geoinformation. 64, 386–396. doi:10.1016/j.jag.2017.04.001
Majidi Nezhad, M., Groppi, D., Marzialetti, P., Fusilli, L., Laneve, G., Cumo, F., et al. (2019). Wind Energy Potential Analysis Using Sentinel-1 Satellite: A Review and a Case Study on Mediterranean Islands. Renew. Sustain. Energ. Rev. 109, 499–513. doi:10.1016/j.rser.2019.04.059
Majidi Nezhad, M., Heydari, A., Pirshayan, E., Groppi, D., and Astiaso Garcia, D. (2021). A Novel Forecasting Model for Wind Speed Assessment Using Sentinel Family Satellites Images and Machine Learning Method. Renew. Energ. 179, 2198–2211. doi:10.1016/j.renene.2021.08.013
Majidi Nezhad, M., Shaik, R. U., Heydari, A., Razmjoo, A., Arslan, N., and Astiaso Garcia, D. (2020a). A SWOT Analysis for Offshore Wind Energy Assessment Using Remote-Sensing Potential. Appl. Sci. 10, 6398. doi:10.3390/app10186398
Majidi Nezhad, M., Heydari, A., Groppi, D., Cumo, F., and Astiaso Garcia, D. (2020b). Wind Source Potential Assessment Using Sentinel 1 Satellite and a New Forecasting Model Based on Machine Learning: A Case Study Sardinia Islands. Renew. Energ. 155, 212–224. doi:10.1016/j.renene.2020.03.148
Manfren, M., Nastasi, B., Groppi, D., and Astiaso Garcia, D. (2020). Open Data and Energy Analytics - an Analysis of Essential Information for Energy System Planning, Design and Operation. Energy. 213, 118803. doi:10.1016/j.energy.2020.118803
Mary, W. M., Moses, K. G., David, N. K., and Nicholas, O. M. (2020). Low Cost Geothermal Energy Indicators and Exploration Methods in Kenya. J. Geogr. Reg. Plann. 10, 254–265. doi:10.5897/JGRP2017.0643
McNairn, H., Shang, J., Champagne, C., and Jiao, X. (2009). TerraSAR-X and RADARSAT-2 for Crop Classification and Acreage Estimation. Int. Geosci. Remote Sens. Symp. 2, 898–901. doi:10.1109/IGARSS.2009.5418243
Meadows, P. (2019). S-1A & S-1B Annual Performance Report for 2018. Plouzanè, France: MPC-S1, Available at https://sentinel.esa.int/documents/247904/3406423/Sentinel-1-Annual-Performance-Report-2018.pdf.
Mellors, R. J., Xu, X., Matzel, E., Sandwell, D., and Fu, P. (2018). New Potential of InSAR for Geothermal Systems, Proceeding of the 43rd Workshop on Geothermal Reservoir Engineering Stanford University, Stanford, California, February 12-14, 2018. IEEE, 1–4.
Mercier, A., Betbeder, J., Rumiano, F., Baudry, J., Gond, V., Blanc, L., et al. (2019). Evaluation of Sentinel-1 and 2 Time Series for Land Cover Classification of Forest-Agriculture Mosaics in Temperate and Tropical Landscapes. Remote Sensing. 11, 979–1020. doi:10.3390/rs11080979
Mixed, T., Phenology, F., Frison, P., Kmiha, S., and Soudani, K. (2018). Potential of Sentinel-1 Data for Monitoring Temperate Mixed Forest Phenology. Remote Sens. 10, 2049. doi:10.3390/rs10122049
Mondéjar, a. G. (2009). “Feasibility Study on SAR Systems on Small Satellites. Barcelona, 84. [Online]. Available at: https://www.google.es/url?sa=t&rct=j&q=&esrc=s&source=web&cd=1&cad=rja&uact=8&ved=0ahUKEwidsv2Tl8rLAhWK6RQKHTYUChoQFgglMAA&url=http://upcommons.upc.edu/bitstream/handle/2099.1/6631/Final.pdf?sequence=1&usg=AFQjCNEs5ZeXpLAXFhhlSAdQu6ZyNd7HCw&sig2=rlVb-dpMi.
Montalti, R., Solari, L., Bianchini, S., Del Soldato, M., Raspini, F., and Casagli, N. (2019). A Sentinel-1-based Clustering Analysis for Geo-Hazards Mitigation at Regional Scale: a Case Study in Central Italy. Geomatics, Nat. Hazards Risk. 10 (1), 2257–2275. doi:10.1080/19475705.2019.1690058
Moreno-Madrinan, M. J., Al-Hamdan, M. Z., Rickman, D. L., and Muller-Karger, F. E. (2010). Using the Surface Reflectance MODIS Terra Product to Estimate Turbidity in Tampa Bay, Florida. Remote Sensing. 2 (12), 2713–2728. doi:10.3390/rs2122713
Morin, D., Planells, M., Guyon, D., Villard, L., Mermoz, S., Bouvet, A., et al. (2019). Estimation and Mapping of forest Structure Parameters From Open Access Satellite Images: Development of a Generic Method With a Study Case on Coniferous Plantation. Remote Sensing. 11, 1275–1311. doi:10.3390/rs11111275
Naidoo, L., Mathieu, R., Main, R., Kleynhans, W., Wessels, K., Asner, G., et al. (2015). Savannah Woody Structure Modelling and Mapping Using Multi-Frequency (X-, C- and L-Band) Synthetic Aperture Radar Data. ISPRS J. Photogrammetry Remote Sensing. 105, 234–250. doi:10.1016/j.isprsjprs.2015.04.007
Naz, S., Iqbal, M. F., Mahmood, I., and Allam, M. (2021). Marine Oil Spill Detection Using Synthetic Aperture Radar Over Indian Ocean. Mar. Pollut. Bull. 162, 111921. doi:10.1016/j.marpolbul.2020.111921
Nezhad, M. M., Neshat, M., Groppi, D., Marzialetti, P., Heydari, A., Sylaios, G., et al. (2021a). A Primary Offshore Wind Farm Site Assessment Using Reanalysis Data: a Case Study for Samothraki Island. Renew. Energ. 172, 667–679. doi:10.1016/j.renene.2021.03.045
Nezhad, M. M., Neshat, M., Heydari, A., Razmjoo, A., Piras, G., and Garcia, D. A. (2021b). A New Methodology for Offshore Wind Speed Assessment Integrating Sentinel-1, ERA-Interim and In-Situ Measurement. Renew. Energ. 172, 1301, 1313. doi:10.1016/j.renene.2021.03.026
Norce, Y. L. (2020). European Ground Motion Service: Service Implementation Plan and Product Specification Document. European Environment Agency. 3436, 1–166. Available at: https://land.copernicus.eu/user-corner/technical-library/egms-specification-and-implementation-plan.
Nunziata, F., Migliaccio, M., Li, X., and Ding, X. (2014). Coastline Extraction Using Dual-Polarimetric COSMO-Skymed Pingpong Mode SAR Data. IEEE Geosci. Remote Sensing Lett. 11 (1), 104–108. doi:10.1109/LGRS.2013.2247561
Nunziata, F., Sobieski, P., and Migliaccio, M. (2009). The Two-Scale BPM Scattering Model for Sea Biogenic Slicks Contrast. IEEE Trans. Geosci. Remote Sensing. 47 (7), 1949–1956. doi:10.1109/TGRS.2009.2013135
Pleskachevsky, A., Jacobsen, S., Tings, B., and Schwarz, E. (2019). Estimation of Sea State From Sentinel-1 Synthetic Aperture Radar Imagery for Maritime Situation Awareness. Int. J. Remote Sensing. 40 (11), 4104–4142. doi:10.1080/01431161.2018.1558377
Pramudya, F. S., Pan, J., and Devlin, A. T. (2019). Estimation of Significant Wave Height of Near-Range Traveling Ocean Waves Using Sentinel-1 SAR Images. IEEE J. Sel. Top. Appl. Earth Observations Remote Sensing. 12 (4), 1067–1075. doi:10.1109/jstars.2019.2902566
Pulella, A., Aragão Santos, R., Sica, F., Posovszky, P., and Rizzoli, P. (2020). Multi-Temporal Sentinel-1 Backscatter and Coherence for Rainforest Mapping. Remote Sensing. 12, 847–917. doi:10.3390/rs12050847
Radkani, N., and Zakeri, B. G. (2020). Southern Caspian Sea Wind Speed Retrieval From C-Band Sentinel-1A SAR Images. Int. J. Remote Sensing. 41 (9), 3511–3534. doi:10.1080/01431161.2019.1706201
Ramirez, R., Lee, S.-R., and Kwon, T.-H. (2020). Long-term Remote Monitoring of Ground Deformation Using sentinel-1 Interferometric Synthetic Aperture Radar (INSAR): Applications and Insights into Geotechnical Engineering Practices. Appl. Sci. 10 (21), 7447–7520. doi:10.3390/app10217447
Rana, F. M., Adamo, M., Lucas, R., and Blonda, P. (2019). Sea Surface Wind Retrieval in Coastal Areas by Means of Sentinel-1 and Numerical Weather Prediction Model Data. Remote Sensing Environ. 225, 379–391. doi:10.1016/j.rse.2019.03.019
Raney, R. (1985). Theory and Measure of Certain Image Norms in SAR. IEEE Trans. Geosci. Remote Sensing. GE-23 (3), 343–348. doi:10.1109/TGRS.1985.289537
Raspini, F., Bianchini, S., Ciampalini, A., Del Soldato, M., Solari, L., Novali, F., et al. (2018). Continuous, Semi-Automatic Monitoring of Ground Deformation Using Sentinel-1 Satellites. Sci. Rep. 8, 1–11. doi:10.1038/s41598-018-25369-w
Receveur, M., Sigmundsson, F., Drouin, V., and Parks, M. (2019). Ground Deformation Due to Steam Cap Processes at Reykjanes, SW-Iceland: Effects of Geothermal Exploitation Inferred from Interferometric Analysis of Sentinel-1 Images 2015-2017. Geophys. J. Int. 216, 2183–2212. doi:10.1093/gji/ggy540
Rodríguez-Benito, C., Caballero, I., Nieto, K., and Navarro, G. (2021). Observation of Maritime Traffic Interruption in Patagonia During the COVID-19 Lockdown Using Copernicus Sentinel-1 Data and Google Earth Engine. Remote Sensing. 13 (6), 1119. doi:10.3390/rs13061119
Safari, A., and Sohrabi, H. (2020). Integration of Synthetic Aperture Radar and Multispectral Data for Aboveground Biomass Retrieval in Zagros Oak Forests, Iran: an Attempt on Sentinel Imagery. Int. J. Remote Sensing. 41 (20), 8069–8095. doi:10.1080/01431161.2020.1771789
Schiller, A., Brassington, G. B., Oke, P., Cahill, M., Divakaran, P., Entel, M., et al. (2020). Bluelink Ocean Forecasting Australia: 15 Years of Operational Ocean Service Delivery With Societal, Economic and Environmental Benefits. J. Oper. Oceanography. 13 (1), 1–18. doi:10.1080/1755876X.2019.1685834
Schmullius, C. (2020). Predicting Forest Cover in Distinct Ecosystems : The Potential of Multi-Source Sentinel-1 and -2 Data Fusion. Remote Sens. 12, 302. doi:10.3390/rs12020302
Seifi, F., Deng, X., and Baltazar Andersen, O. (2019). Assessment of the Accuracy of Recent Empirical and Assimilated Tidal Models for the Great Barrier Reef, Australia, Using Satellite and Coastal Data. Remote Sensing. 11 (10), 1211. doi:10.3390/rs11101211
Sentinel-1 Toolbox (2021). Available at: Https://step.esa.int/main/toolboxes/sentinel-1-toolbox.
Shang, J., Liu, J., Poncos, V., Geng, X., Qian, B., Chen, Q., et al. (2020). Detection of Crop Seeding and Harvest Through Analysis of Time-Series Sentinel-1 Interferometric SAR Data. Remote Sens. 12, 1–18. doi:10.3390/rs12101551
Shao, B., Li, X., Li, H., Du, X., Ji, Q., and Cai, L. (2017). Development and Validation of an Ocean Wave Retrieval Algorithm for VV-Polarization Sentinel-1 SAR Data. Acta Oceanol. Sin. 36 (7), 95–101. doi:10.1007/s13131-017-1089-9
Shao, W., Jiang, X., Nunziata, F., Marino, A., Yang, Z., Zhang, Y., et al. (2020). Analysis of Waves Observed by Synthetic Aperture Radar Across Ocean Fronts. Ocean Dyn. 70, 1397–1407. doi:10.1007/s10236-020-01403-2
Shao, W., Zhang, Z., Li, X., and Li, H. (2016). Ocean Wave Parameters Retrieval From Sentinel-1 SAR Imagery. Remote Sensing. 8, 707. doi:10.3390/rs809070710.3390/rs8090707
SNAP (2020). Available at: Https://step.esa.int/main/toolboxes/snap/
Soisuvarn, S., Jelenak, Z., Chang, P. S., Alsweiss, S. O., and Zhu, Q. (2013). CMOD5.H-A High Wind Geophysical Model Function for C-Band Vertically Polarized Satellite Scatterometer Measurements. IEEE Trans. Geosci. Remote Sensing. 51 (6), 3744–3760. doi:10.1109/TGRS.2012.2219871
Solari, L., Del Soldato, M., Bianchini, S., Ciampalini, A., Ezquerro, P., Montalti, R., et al. (2018). From ERS 1/2 to Sentinel-1: Subsidence Monitoring in Italy in the Last Two Decades. Front. Earth Sci. 6 (September), 149. doi:10.3389/feart.2018.00149
Stevens, F. R., Gaughan, A. E., Linard, C., and Tatem, A. J. (2015). Disaggregating Census Data for Population Mapping Using Random Forests With Remotely-Sensed and Ancillary Data. PLoS One. 10 (2), e0107042–22. doi:10.1371/journal.pone.0107042
Stoffelen, A., Verspeek, J. A., Vogelzang, J., and Verhoef, A. (2017). The CMOD7 Geophysical Model Function for ASCAT and ERS Wind Retrievals. IEEE J. Sel. Top. Appl. Earth Observations Remote Sensing. 10 (5), 2123–2134. doi:10.1109/jstars.2017.2681806
Sun, M., Yang, Y., Yin, X., and Du, J. (2018). Data Assimilation of Ocean Surface Waves Using Sentinel-1 SAR during Typhoon Malakas. Int. J. Appl. Earth Observation Geoinformation. 70, 35–42. doi:10.1016/j.jag.2018.04.004
Tapiador, F. J. (2009). Assessment of Renewable Energy Potential through Satellite Data and Numerical Models. Energy Environ. Sci. 2 (11), 1142–1161. doi:10.1039/b914121a
Lehner, S., and Ocampo-Torres, F. J. (2003). The SAR Measurement of Ocean Waves : Wave Session Whitepaper. [Online]. Available at: https://earth.esa.int/workshops/cmasar_2003/papers/E09lehn.pdf.
unavco (2018). Available at: httpswww.unavco.orginstrumentationgeophysicalimagingsar-satellitessar-satellites.html.
van der Meer, F., Hecker, C., van Ruitenbeek, F., van der Werff, H., de Wijkerslooth, C., and Wechsler, C. (2014). Geologic Remote Sensing for Geothermal Exploration: A Review. Int. J. Appl. Earth Observation Geoinformation. 33, 255–269. doi:10.1016/j.jag.2014.05.007
Van Tricht, K., Gobin, A., Gilliams, S., and Piccard, I. (2018). Synergistic Use of Radar Sentinel-1 and Optical Sentinel-2 Imagery for Crop Mapping: A Case Study for Belgium. Remote Sensing. 10, 1642–1722. doi:10.3390/rs10101642
Vasco, D. W., Rutqvist, J., Ferretti, A., Rucci, A., Bellotti, F., Dobson, P., et al. (2013). Monitoring Deformation at the Geysers Geothermal Field, California Using C‐band and X‐band Interferometric Synthetic Aperture Radar. Geophys. Res. Lett. 40 (11), 2567–2572. doi:10.1002/grl.50314
Wiseman, G., McNairn, H., Homayouni, S., and Shang, J. (2014). RADARSAT-2 Polarimetric SAR Response to Crop Biomass for Agricultural Production Monitoring. IEEE J. Sel. Top. Appl. Earth Observations Remote Sensing. 7 (11), 4461–4471. doi:10.1109/JSTARS.2014.2322311
Xia, J., Yokoya, N., and Pham, T. D. (2020). Probabilistic Mangrove Species Mapping With Multiple-Source Remote-Sensing Datasets Using Label Distribution Learning in Xuan Thuy National Park, Vietnam. Remote Sensing. 12, 3834. doi:10.3390/rs12223834
Xu, X., Sandwell, D. T., Tymofyeyeva, E., González-ortega, A., and Tong, X. (2017). Tectonic and Anthropogenic Deformation at the Cerro Prieto Geothermal Step-Over Revealed by Sentinel-1A InSAR. IEEE Trans. Geosci. Remote Sensing. 55 (9), 5284–5292. doi:10.1109/tgrs.2017.2704593
Yang, X., Li, X., Zheng, Q., Gu, X., Pichel, W. G., and Li, Z. (2011). Comparison of Ocean-Surface Winds Retrieved From QuikSCAT Scatterometer and Radarsat-1 SAR in Offshore Waters of the U.S. West Coast. IEEE Geosci. Remote Sensing Lett. 8 (1), 163–167. doi:10.1109/lgrs.2010.2053345
Yekkehkhany, B., Homayouni, S., McNairn, H., and Safari, A. (2014). Multi-Temporal Full Polarimetry L-Band SAR Data Classification for Agriculture Land Cover Mapping. Proceeding of the Int. Geosci. Remote Sens. Symp., 13-18 July 2014, Quebec City, QC, Canada, IEEE, 2770–2773. doi:10.1109/IGARSS.2014.6947050
Young, O. R. (2017). Satellite Earth Observations and Their Impact on Society and Policy. Singapore City, Singapore: Springer.
Yue, C.-D., Chiu, Y.-S., Tu, C.-C., and Lin, T.-H. (2020). Evaluation of an Offshore Wind Farm by Using Data From the Weather Station, Floating LiDAR, MAST, and MERRA. Energies. 13, 185. doi:10.3390/en13010185
Zhang, K., Huang, J., Mansaray, L. R., Guo, Q., and Wang, X. (2018a). Developing a Subswath-Based Wind Speed Retrieval Model for Sentinel-1 VH-Polarized SAR Data Over the Ocean Surface. IEEE Trans. Geosci. Remote Sensing. 57, 1561–1572. doi:10.1109/TGRS.2018.2867438
Zhang, K., Huang, J., Xu, X., Guo, Q., Chen, Y., Mansaray, L. R., et al. (2018b). Spatial Scale Effect on Wind Speed Retrieval Accuracy Using Sentinel-1 Copolarization SAR. IEEE Geosci. Remote Sensing Lett. 15 (6), 882–886. doi:10.1109/lgrs.2018.2811397
Zhao, X.-g., and Ren, L.-z. (2020). Focus on the Development of Offshore Wind Power in China: Has the Golden Period Come. Renew. Energ. 81, 644–657. doi:10.1016/j.renene.2015.03.077
Zhou, L., Zheng, G., Li, X., Yang, J., Ren, L., Chen, P., et al. (2017). An Improved Local Gradient Method for Sea Surface Wind Direction Retrieval From SAR Imagery. Remote Sensing. 9 (7), 671–717. doi:10.3390/rs9070671
Glossary
3-D Three-Dimensional
NDVI Normalized Difference Vegetation Index
AGB Aboveground Biomass
NIR Near Infrared
ANFIS Adaptive Neuro-Fuzzy Inference System
NRCS Normal Radar Cross-Section
CGF Coso Geothermal Field
NWP Numerical Weather Prediction
DBH Diameter Breast Height
PS-InSAR Persistent Scatterer Interferometric Synthetic Aperture Radar
D-InSAR Differential Synthetic Aperture Radar interferometry
GESs Green Energy Sources
ECMWF European Centre for Medium-range Weather Forecasts
RMSE Root Mean Square Error
EO Earth Observations
S-1 Sentinel-1
ESA European Space Agency
SAR Synthetic Aperture Radar
GMES Global Monitoring for Environment and Security
SLC Single Look Complex
GMFs Geophysical Model Functions
SNAP Sentinel Application Platform
GPF Graph Processing Framework
SODAR SOnic Detection And Ranging
HV Horizontal Vertical
STD Standard Deviation
InSAR Interferometric Synthetic Aperture Radar (InSAR)
SWH Significant Wave Height
LIDAR Light Detection and Ranging
TMW Time Mean Wave
LOS Line Of Sight
VV Vertical Vertical
MSD Mean Squared Deviation
WECs Wave Energy Converters
MSE Mean Squared Error
WTGs Wind Turbine Generator
MWP Mean Wave Period
NDBC National Data Buoy Centre
RMSD Root Mean Square Deviation
SSW Sea Surface Water
MPI Max Planck Institute
CNN Convolutional Neural Networks
PFSM Parameterized First-guess Spectrum Method
SPRA Semi-parametric Retrieval Algorithm
PA Partition Shift
Keywords: remote sensing techniques, renewable energy source (RES), energy potential assessment, energy mapping, open data access
Citation: Majidi Nezhad M, Nastasi B, Groppi D, Lamagna M, Piras G and Astiaso Garcia D (2021) Green Energy Sources Assessment Using Sentinel-1 Satellite Remote Sensing. Front. Energy Res. 9:649305. doi: 10.3389/fenrg.2021.649305
Received: 04 January 2021; Accepted: 02 November 2021;
Published: 16 December 2021.
Edited by:
Michel Feidt, UMR7563 Laboratoire d'énergétique et de mécanique théorique et appliquée (LEMTA), FranceReviewed by:
Ferhat Bingol, Izmir Institute of Technology, TurkeyMuhammad Mohsin, Jiangsu University, China
Copyright © 2021 Majidi Nezhad, Nastasi, Groppi, Lamagna, Piras and Astiaso Garcia. This is an open-access article distributed under the terms of the Creative Commons Attribution License (CC BY). The use, distribution or reproduction in other forums is permitted, provided the original author(s) and the copyright owner(s) are credited and that the original publication in this journal is cited, in accordance with accepted academic practice. No use, distribution or reproduction is permitted which does not comply with these terms.
*Correspondence: Benedetto Nastasi, YmVuZWRldHRvLm5hc3Rhc2lAb3V0bG9vay5jb20=