 Yujia Liu
 Sifan Peng
 Nan Gui
 Xingtuan Yang1
94% of researchers rate our articles as excellent or good
Learn more about the work of our research integrity team to safeguard the quality of each article we publish.
Find out more
ORIGINAL RESEARCH article
Front. Energy Res. , 02 June 2021
Sec. Nuclear Energy
Volume 9 - 2021 | https://doi.org/10.3389/fenrg.2021.647479
This article is part of the Research Topic Reactor Fuels, Materials and Systems under Extreme Environments View all 29 articles
The dropping of absorption sphere from the storage vessel under accident conditions and the transportation of spent fuel elements in the reactor will both lead to the pebble flow discharging process driven by gravity in a hopper silo. Therefore, the research on the gravity-driven discharging rate of pebbles in a hopper silo has significant engineering guidance for reactor safety. In general, the idea of falling pebbles weighing to obtain the discharging rate becomes the most common experimental measurement method. However, due to the limitation of response frequency and the disturbance of pebbles falling, the resolution of experimental results is limited, and the uncertainty is introduced into the data error, which is difficult to eliminate. In this experiment, a volume measurement based on drainage method is adopted. This is a new experimental method to measure the discharge process of hopper silo. The magnetostrictive liquid level sensor is applied to measure the rise of liquid level caused by the volume of falling pebbles. Compared with the weighing method, this method has two advantages. First, the resolution of this method has a higher controllability. On the one hand, the disturbance caused by the momentum of falling pebbles will not be introduced into this method, on the other hand, the measurement accuracy is determined by the multiple controllable factors. Second, this method can obtain higher measurement frequency. the sampling frequency of liquid level sensor is 1–2 orders of magnitude higher than that of electronictong balance. Based on this new experimental method, the reliability of the method is validated by comparing the experimental results of discharge flow rate with the Beverloo’s and Nedderman’s empirical formula. Furthermore, the effect of silo outlet size on pebble discharge flow rate fluctuation have been also analyzed in this study. By use of fast Fourier transform, the fluctuation of particle discharge flow rate is separated from the discharging sampling results of liquid level sensor.
With the characteristic of inherent safety, High Temperature Gas-cooled Reactor is regarded as one of the most feasible choice of solving the global electricity generation and industrial process heat applications problems. In 2003, Institute of Nuclear and New Energy Technology (INET) at Tsinghua University developed the world’s first modular high temperature gas-cooled reactor HTR-10, which has been approved to be one of the National Special Grand Science-technology Projects of China (Wang, 2002). Since the pebble flow has a major impact on reactor physics, the mechanistic of flow motion problems is of great research significance (Medina et al., 2000; Rycroft et al., 2006; Li et al., 2009; Jia et al., 2017). Key laboratory of Advanced Reactor Engineering and Safety of Ministry of Education from INET has spent decades on the experimental study and numerical simulation of the pebble flow to guide the safety design of the reactor (Hu, 2009; Shengyao et al., 2019). The dropping of absorption sphere from the storage vessel under accident conditions and the transportation of spent fuel elements in the reactor will both lead to the pebble flow discharging process driven by gravity in a hopper silo. Yang et al. (2012) conducted the experimental investigations on the pebble flow of a two-region pebble bed reactor to investigate the physical mechanism of gravity-driven pebble flow by means of a set of phenomenological approaches. Li et al. (2020) observed the process of granular discharging from the storage silo into the feeder by applying high-speed camera experimental method. Meanwhile, Computational Fluid Dynamics (CFD)-Discrete Element Method (DEM) coupling simulation is also conducted to investigate the coarse particle conveying in the small absorber sphere system.
Due to the direct industrial application, the hopper silo discharging process has not only attracted attention in the field of nuclear engineering, but also aroused great interest in the chemical industry and other fields. Considering the invisibility inside the three-dimensional pebble bed, experimental research pays more attention to the following parameters in the discharging process: flow rate, stacking angle, porosity distribution, velocity distribution, etc. Correspondingly, numerous measurement methods are widely applied in experiments, such as: weighing method, phenomenological method, emission computed tomography (ECT), particle image velocimetry (PIV), refractive index method and Magnetic Resonance Imaging (MRI) method. From an application point of view, the main purpose of the above parameters is to obtain the discharge flow rate mechanism. The difficulty in achieving this goal is that pebble flow is different from liquid flow, which has a complex and random flow pattern inside of the hopper silo. In previous studies, researchers have conducted various studies on the geometric structure and physical parameters of silos and particles. For the physical parameters, the focus of the research is on the restitution coefficient
Since 1911, Ketchum, (1919) found that the discharge flow rate is proportional to the 3rd power of the orifice diameter
After empirically fitting the mean discharge rate, researchers began to pay more attention to the fluctuation problem in the discharge process. For this part of the experimental research, the study can be divided into the quasi-two-dimensional silo and the three-dimensional silo from the geometric structure. Correspondingly, high-speed camera methods and weighing methods based on electronic balances are the main measurement methods. Janda et al. (2008) present an experimental study of the jamming during the discharge of spherical particles from a two-dimensional silo based on PIV technique. The jamming probability JN (D) for different discharge particle number N as a function of the orifice diameter has been calculated. By use of high speed camera in a quasi-2D large silo, Zuriguel et al (2019) observed that the decreasing of orifice size causes an increase in the relative amplitude of the velocity fluctuations. Pascot et al. (2020) present a study of the influence of mechanical fluctuations on a quasi-two dimensional silo discharges of granular matter. The influence of orifice shape on the flow rate in ordinary 3D flat-bottom hoppers is investigated based on an electronic balance with a resolution of 1.0 g by Wan et al. (2018). González-Montellano et al. (2011). found an upper bound of 1.2 W and a lower bound of 0.75 W for hopper silo discharge fluctuations with a mean value W according to DEM simulation. Uñac et al. (2012) verified González’s conclusion from an experimental point of view through the weighing method based on electronic balances. Discharge flow rate fluctuations presented a characteristic frequency of oscillation related to accumulation and discharge cycles in this study. Same fluctuation phenomena have also been observed in discharge of seeds in a silo with a mass flow regime (Calderón et al., 2017). In the numerical simulation research based on DEM method of Zeng et al. (2017), the velocity and total force fluctuations were quantitatively analyzed during the initial duration of the discharge and the relationship between velocity fluctuation and contact force disappearance was investigated.
Due to the limitation of response frequency and the disturbance of pebbles falling, the resolution of experimental results based on electronic balances is limited. In this experiment, a volume measurement based on drainage method is adopted. This is a new experimental method to measure the discharge process of hopper silo. By using a magnetostrictive liquid level sensor with high sampling frequency and low response time, more highly reducible flow rate fluctuation information is obtained. At the same time, this experimental method also provides the possibility of measuring high frequency oscillations (greater than 2 Hz) that may occur in silo discharge process.
The flow of spherical particles was studied in a cylindrical silo made of plexiglass, of diameter 180 mm and height 400 mm. Considering the process of wetting and drying, the spherical particles were made of soda lime glass with a density of 2,518 kg/m3. The diameter of the particles is 6 and 5.5 mm, and the accuracy of ± 0.02 mm ensures the sphericity of more than 0.99. After testing, the bulk density of particles in the silo is about 0.61. The repose angle of spherical particles is about 23° when they are naturally accumulated in the silo. This proves that the particles are very smooth and have good fluidity.
As shown in Figure 1, the replaceable conical hopper is connected with the cylindrical silo by flange. As shown in Table 1, six hopper sizes are used to measure the particle discharge rate in this experiment. The hopper is made of a whole piece of plexiglass after milling, with the orifice diameter accuracy of ±0.05 mm. At the bottom of the hopper orifice, an electric gate is used to control the start and stop of discharge. After passing through the gate, the particles will directly fall into the cylindrical bucket below the hopper. The bucket is connected to a cylindrical container equipped with a level sensor through a narrow channel. The magnetostrictive liquid level sensor is vertically fixed in the container, and the shock-proofed rubber pad is used at the joint to reduce the fluctuation impact from the platform. A cage made of 4 mm hole wire mesh is placed in the bucket. On the one hand, the cage can prevent the particles falling into the water from moving to the narrow channel. On the other hand, the cage is conducive to the rapid separation of the particles and the liquid so as to shorten the time of repetitive experiments. After each measurement, the wet particles are placed in a drying box for low-temperature drying. The temperature of the drying box is set below 100°C to avoid excessive deformation of the particles.
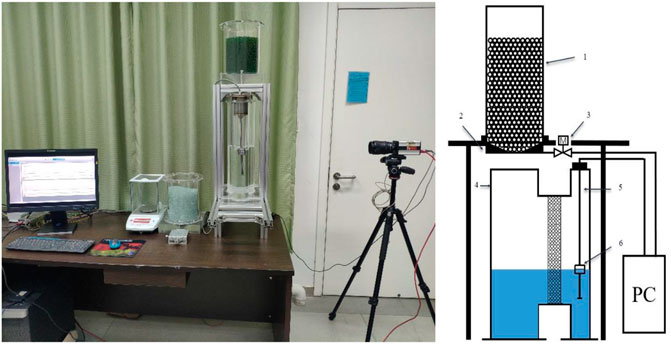
FIGURE 1. Experimental setup 1-cylindrical silo; 2-conical hopper; 3-electric gate; 4-bucket; 5-container; 6-level sensor.
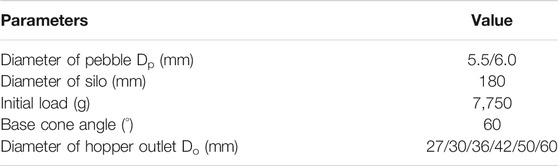
TABLE 1. Parameters used in experiment.
Different from the traditional contact weight measurement method, the drainage method measures the volume of particles falling into the water. Therefore, the influence of the momentum carried by the particles on the drainage method is much less than that of the weight method.
In fact, the measurement error of the drainage method is not only determined by the level gauge. As shown in function 1, measurement error m is determined by the particle density
During the discharging process, the flow rate of the particles is not a stable value but a fluctuating value. Therefore, a higher sampling frequency will obtain more accurate discharge fluctuation information. In previous experimental studies, researchers used high-precision electronic balances to find that the flow rate of particles has fluctuations within 2 Hz. Therefore, most of the research using the weight measurement method is limited by the response time of high-precision electronic balances. Their highest sampling frequency is only about 5–10 Hz. A numerical simulation study based on the DEM method recently found that in the cylindrical area of a silo, the average velocity of particles will fluctuate regularly and irregularly at 10–20 Hz (Zeng et al., 2017). According to the Nyquist sampling theorem, only when the sampling frequency is greater than 2 times the highest frequency in the signal (fs.max>2fmax), the digital signal after sampling can completely retain the information in the original signal. However, the electronic balance is limited by the response time of the sensor and cannot further increase the effective sampling frequency. Therefore, in contrast, the drainage method has the advantage of further studying the possibility of high frequency fluctuations in the process of particle discharge. The sampling frequency of the level meter used in this study is 100 Hz, and the output is a 4–20 mA current signal. After the conversion of the MCC 1608FS digital acquisition card with a sampling frequency of 2,000 Hz, the measurement signal is converted to a digital signal of 1–5 V.
In order to ensure the repeatability of the experiment, the design parameters of the device need to be explained.
First, for different types of particles, the initial conditions of the same load were selected for this study, that is, 7,750 g particles are loaded (about 27,000 6 mm particles, 35,000 5.5 mm particles). In order to prevent the mutual contamination of different types of particles during the experiment, the 6 mm diameter particles were dyed green to distinguish them from the white 5.5 mm particles. After free accumulation and top leveling, it can be found that the packing rate of each type of particles is about 0.61. Meanwhile, previous studies have proved that initial random packing has no significant effect on the discharge flow rate (Huntington and Rooney, 1971). The initial filling height exceeds the conical area by more than
The uncertainty can be analyzed from the measurement resolution and repeatability. The number of particles converted from the measurement error is applied to describe the absolute resolution Rab. The MTL4 magnetostrictive floating ball type liquid level meter produced by Miran Technology is used in the liquid level measurement of this experiment. The effective stroke of the level gauge is 200 mm, with a resolution
Figure 2 shows the relative error of the average flow rate of repeated experiments. The discharge curve under each working condition can be divided into initial fluctuation section and linear section. This will be well explained in the following Figure 3. Since the average mass flow rate of each working condition is fitted by the linear section data, it is only necessary to observe the relative error distribution of the linear section. As shown in Figure 2, a relative error within 3.5% was obtained under this working condition, and in all repeated measurements, the maximum error under the same working condition was less than 5%. This result fully verified the repeatability of this experiment is 5%.
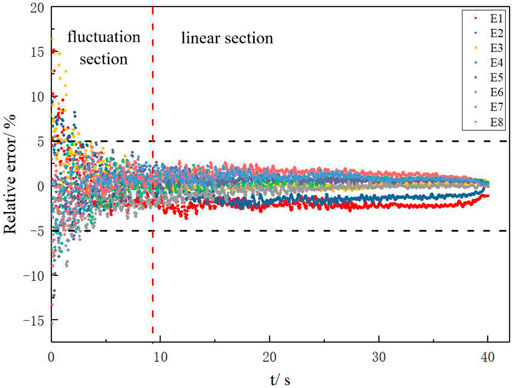
FIGURE 2. Error analysis of mass flow rate in repeated experiment (
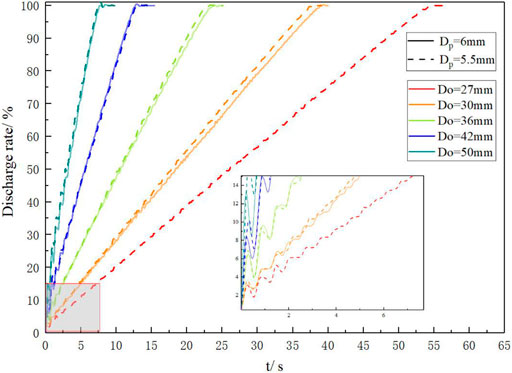
FIGURE 3. Discharge mass percentage curves of two sets of particles at different orifice sizes.
The idea of this part is as follows: firstly, the discharge curves under different working conditions are obtained. Secondly, the mean discharge flow rate is calculated according to the slope of the discharge curve. Finally, the reliability of the method is validated by comparing the experimental results with the empirical formula.
The discharging curves of the two kind of particles at different orifice sizes are shown in Figure 3. Considering that the same load is used in the repeated experiments, the mass discharge percentage is selected as the dependent variable. It can be seen from the Figure 3 that there is an initial section with obvious fluctuations and a relatively linear section under each working condition. The fluctuation of the initial section is caused by the fluctuation of the discharge rate and the accumulation of bubbles in the water at the initial moment. This phenomenon will be explained in the subsequent flow rate fluctuation analysis. In the linear section, it exhibits a typical conical hopper discharge behavior. Compared with the transition zone of the flat-bottomed hopper where the slope of the discharge curve is gradually reduced at the end of the discharge process, the discharge curve of the conical hopper maintains a stable slope at the end of the discharge. The tiny drop at the end is due to the volume reduction caused by the disappearance of stable bubbles in the linear section after all the particles are discharged. For all operating conditions, the average mass flow rate is determined as the slope of the discharge curve in the linear section. It can be seen from the end drop that the bubble content of the linear segment has a very small effect on the entire discharge (less than 1%), so its effect on the calculation of the average mass flow rate can be ignored.
Some scholars To, (2005) once found out that when the dimensionless orifice
In other words, when the dimensionless orifice
The mean mass flow rate
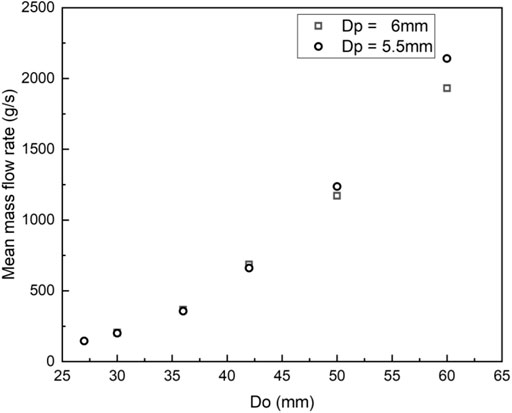
FIGURE 4. Mean mass flow rate of two sets of particles at different orifices sizes.
The empirical formulas of Beverloo and Nedderman were used to check the consistency of the measurement results.
In Beverloo’s law, mass flow rate
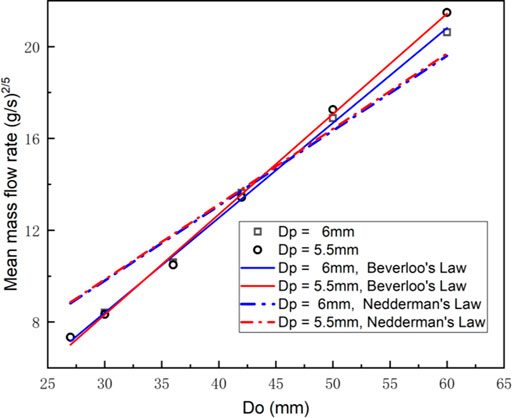
FIGURE 5. Two sets of fitted lines of two sets of particles at different orifices.
According to the intercept of the regression line fitted by the scattered points in the figure on the x-axis, the coefficient
For
For the two sets of particles, the coefficients C, k, and the value of
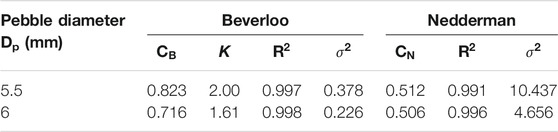
TABLE 2. Coefficients C, k,
The empirical formulas derived by Beverloo and Nedderman have different theoretical basis. Beverloo devoted considerable attention to the concept of the “empty annulus.” No particle center can approach within a distance
The idea of this part is as follows: firstly, the composition of total discharge flow rate fluctuation is analyzed; secondly, the fluctuation of particle discharge flow rate is separated from it; finally, the trend of particle discharge flow rate fluctuation vs. orifice size is analyzed.
The purpose of this part is to analyze the fluctuation of the particle discharge flow rate. However, the total discharge flow rate Qd converted from the liquid level sensor signal may contain many components. Therefore, it is necessary to analyze the factors that cause the fluctuation of the total discharge flow rate so as to separate the fluctuation of the particle flow rate Qp. In the discharge curve obtained in this experiment, there are fluctuation regions with periodic ‘fallback’ in the initial section under each working condition. As shown in Figure 6, a period of fluctuation interval is selected for display. First, we divide this section into an initial growth part and a fallback part. In previous studies, although the flow rate fluctuates, the flow rate is always greater than 0. If only the fluctuation of mass flow rate exists, there shouldn’t be fallback phenomenon occur in the discharge curve, that is, the mass of particles falling into the water cannot be reduced.
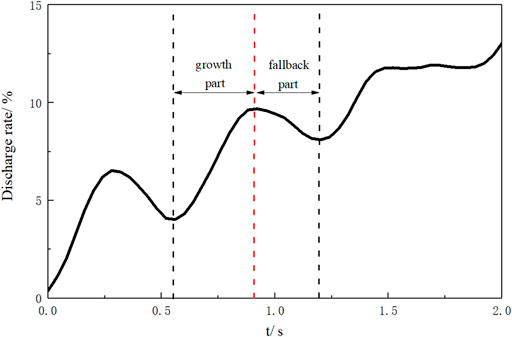
FIGURE 6. Fluctuation regions with periodic “fallback” in the initial discharge curve.
Therefore, further analysis of the fluctuation possibility is necessary. Three factors that may affect the fluctuation of the liquid level sensor are listed as follows: liquid surface fluctuation caused by particle falling impact, liquid level fluctuation caused by the content of air bubbles in the liquid, and particle mass flow rate fluctuations.
First of all, regarding the possibility of liquid level fluctuations, the x-motion high-speed camera manufactured by AOS Technology is used to observe the liquid level information during the entire unloading process. Taking into account that the sampling frequency of the level gauge is 100 HZ, according to the sampling principle, a shooting speed of 250 frame per second (FPS) is used. Since the entire container is made of plexiglass, the dividing line of the liquid level where the float of the level meter is located can be clearly photographed after the LED backlight is arranged as shown in Figure 7A. Due to the difference of refractive index between water and air, the original image can be binarized to obtain a grayscale image, and then threshold segmentation is performed according to the grayscale value to finally obtain the coordinate information of the liquid level. Under all working conditions, the correlation coefficient between the liquid level coordinate and its linear fitting straight line achieved an excellent performance of over 0.99. This indicates that the obvious fluctuation does not exist on the measured liquid level, and it also shows that the porous partition between the bucket and the level gauge container has an effective damping effect. Next, as shown in Figure 7B, the probability distribution of the angle between the liquid level fitting straight line and the horizontal is also counted. Even when the angle of the liquid level is at the upper and lower limit (1.5°) with a very small probability, the liquid level drop caused by the incline of the liquid level will not exceed 0.5%. Therefore, the possibility of liquid level fluctuations can be ruled out. Meanwhile, the “fallback” phenomenon can also be determined to be caused by the fluctuation of mass flow rate and the change of bubble content.

FIGURE 7. Influence analysis of liquid level fluctuations.
By calculating the slope between two adjacent sampling points in the discharge curve, the transient discharge flow rate at that moment can be obtained. Taking a set of experimental data with
where
It can be seen from the Figure 8 that the discharge flow rate
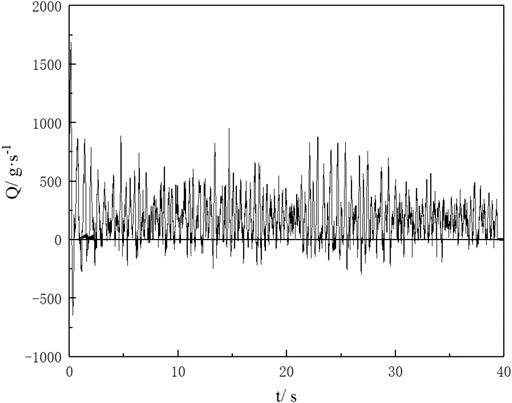
FIGURE 8. Fluctuation of discharge flow rate during the whole discharge process.
In order to analysis the frequency of particle mass flow rate, it is necessary to separate the particle mass flow rate and bubble volume change rate. A Fourier transform is applied to convert the time domain signal in Figure 6A into a frequency domain signal. Since the discharge flow rate itself is calculated by discrete sampling signals, an efficient method FFT (fast Fourier transform) in Discrete Fourier Transform is used to obtain the frequency map in Figure 9. Considering that in previous studies, the fluctuation frequency of the mass flow rate is generally within 2 Hz, so a sampling frequency of 10 Hz is used in the FFT algorithm to verify this conclusion. According to Nyquist theorem, the maximum frequency span after FFT can only be 1/2 of the original signal sampling rate so that the upper limit of frequency in Figure 7 turns to 5 Hz. It can be seen from the figure that when the frequency is greater than 2 Hz, the amplitude of the curve is close to zero. This shows that a sampling frequency of 10 Hz is feasible. At the same time, after comparing the data of different working conditions, it is found that the highest peak in the amplitude-frequency diagram corresponds to the fluctuation frequency of the particle mass flow rate, as shown in the red box. The blue box corresponds to the frequency width of liquid level fluctuations.
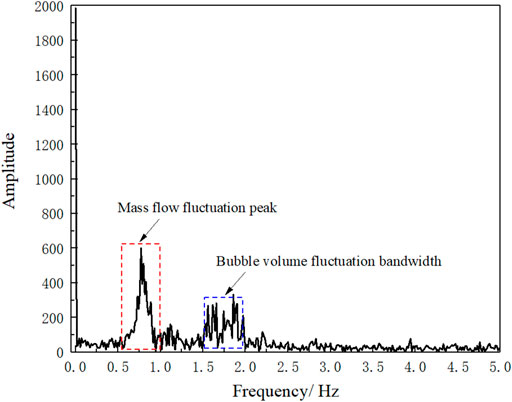
FIGURE 9. Amplitude-frequency diagram obtained by Fast Fourier Transform (FFT).
As shown in Figure 10A, the fluctuation frequency of the particle mass flow rate showed a linear trend when the orifice diameter is less than 50 mm. After that, the frequency of fluctuations tends to be flat. The bandwidth of liquid level fluctuations at different relative orifice diameter
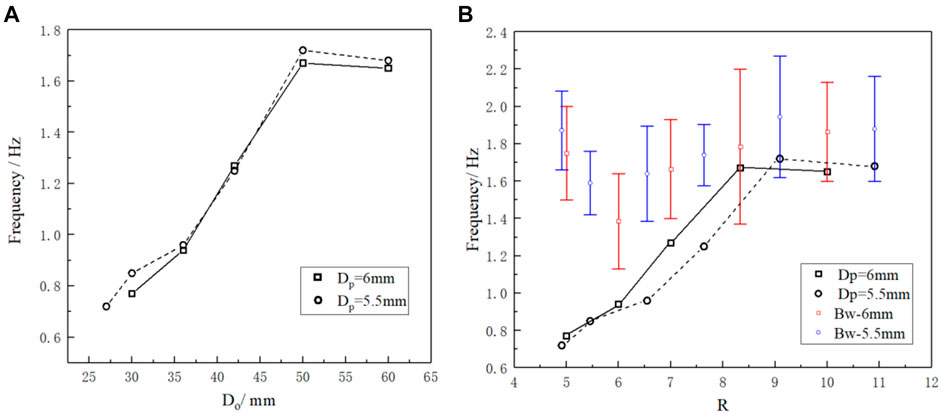
FIGURE 10. Fluctuation frequency at different orifice size.
Under the same relative orifice size R, it can be observed that the fluctuation frequency of different sets of particles is not the same, and the fluctuation frequency of large particles are always higher than that of small particles. This result is consistent with the simulation result of Cesar et al. (Calderón et al., 2017). Therefore, the experimental results of this research can show that the particle discharge flow rate fluctuation is not only determined by the formation and collapse of the transient arch bridge when the critical jamming orifice size is approached. The mechanism of particle discharge flow rate fluctuations in the case of small orifice remains to be studied further.
In this research, a volume measurement based on drainage method is applied to observe the discharge process of two sets of particles in a hopper silo with different orifice diameter. The discharge flow rate and fluctuation frequency are analyzed quantitatively. Based on the presented results the following conclusions can be drawn:
1. According to the empirical formula proposed by Beverloo and Nedderman, the trend of mean discharge flow rate at different orifice size was fitted in this experiment. Compared with Nedderman’s empirical formula, the empirical formula proposed by Beverloo obtained a higher consistency in this experiment. Compared with previous research, the corresponding coefficients C and k fitted by this experiment are both within the range of the previous study’s result, which verifies the validity and accuracy of the drainage measurement method. Compared with the traditional weighing method based on electronic balance, the drainage method with high sampling frequency and low response time provides the possibility of measuring the high frequency oscillation (greater than 2 Hz) that may occur in the silo discharge process.
2. Combining the use of high-speed camera and image recognition, discharge mass flow rate fluctuations and change of bubble content are identified as the two cause of fluctuations in the measurement signal. An ideal bubble content change model is proposed to interpret the “fallback” phenomenon in the discharge curve and the negative value in the discharge flow rate calculated from the measurement signal.
3. In the amplitude-frequency diagram obtained by the discrete Fourier transform method, the fluctuation frequency of particle mass flow rate and the fluctuation frequency of bubble content are distinguished. The fluctuation frequency of the particle mass flow rate showed a phenomenon of increasing first and then gentle under different orifice sizes, and showed a linear trend when the orifice diameter is less than 50 mm. Under the same relative orifice size R, it can be observed that the fluctuation frequency of different sets of particles is not the same, and the fluctuation frequency of large particles are always higher than that of small particles. This result is consistent with the simulation result of Cesar et al. (Zeng et al., 2017). In the research on jamming, the dimensionless orifice diameter R is the decisive factor affecting the formation of arch bridges. Therefore, the experimental results of this research can show that the particle discharge flow rate fluctuation is not only determined by the formation and collapse of the transient arch bridge when the critical jamming orifice size is approached.
The original contributions presented in the study are included in the article/Supplementary Material, further inquiries can be directed to the corresponding author.
YL: Data analysis, Methodology, Validation, Formal analysis, Visualization Software, Writing Original Draft, Experiment, recording image data SP: Data analysis, Methodology, Experiment, recording image data NG: Conceptualization, Methodology, Software, Investigation XY: Validation, Formal analysis, Visualization Review and Editing JT: Resources, Writing-Review and Editing, Supervision, Data Curation SJ: Conceptualization, Resources, Writing-Review and Editing, Supervision, research Project administration and Funding acquisition.
The authors are grateful for the support of this research by the National Science and Technology Major Project (2011ZX06901-003) and the National High Technology Research and Development Program of China (863) (2014AA052701).
The authors declare that the research was conducted in the absence of any commercial or financial relationships that could be construed as a potential conflict of interest.
The reviewer MY declared a shared affiliation with several of the authors YL, SP,NG, XY, JT, SJ, to the handling editor at time of review.
Beverloo, W. A., Leniger, H. A., and van de Velde, J. (1961). The Flow of Granular Solids through Orifices. Chem. Eng. Sci. 15, 260–269. doi:10.1016/0009-2509(61)85030-6
Brown, R. L. (1961). Minimum Energy Theorem for Flow of Dry Granules through Apertures. NATURE 191 (4787), 458–461. doi:10.1038/191458a0
Calderón, C. A., Villagrán Olivares, M. C., Uñac, R. O., and Vidales, A. M. (2017). Correlations between Flow Rate Parameters and the Shape of the Grains in a Silo Discharge. Powder Techn. 320, 43–50. doi:10.1016/j.powtec.2017.07.004
González-Montellano, C., Ramírez, Á., Gallego, E., and Ayuga, F. (2011). Validation and Experimental Calibration of 3D Discrete Element Models for the Simulation of the Discharge Flow in Silos. Chem. Eng. Sci. 66 (21), 5116–5126. doi:10.1016/j.ces.2011.07.009
Hirshfeld, D., and Rapaport, D. C. (2001). Granular Flow from a Silo: Discrete-Particle Simulations in Three Dimensions. Eur. Phys. J. E, Soft matter Biol. Phys. 4 (2), 193–199. doi:10.1007/s101890170128
Hu, W. Y. X. J. S. (2009). Phenomenological Experiments on the Pebble Dynamics in 2-D Scaled Model of a Two-Region Pebble-Bed Reactor. J. Tsinghua Univ. Sci. Tech. 49 (6), 876–879.
Huntington, A. P., and Rooney, N. M. (1971). Chemical Engineering Tripos Part 2. Research Project Report. Cambridge: University of Cambridge.
Janda, A., Zuriguel, I., Garcimartín, A., Pugnaloni, L. A., and Maza, D. (2008). Jamming and Critical Outlet Size in the Discharge of a Two-Dimensional Silo. Europhys. Lett. 84 (4), 44002. doi:10.1209/0295-5075/84/44002
Jia, X., Gui, N., Yang, X., Tu, J., and Jiang, S. (2017). Fluctuation and Arching Formation of Very Dense and Slow Pebble Flow in a Silo Bed. J. Nucl. Sci. Techn. 54 (1), 111–126. doi:10.1080/00223131.2016.1213671
Li, T., Zhang, H., Kuang, S., Yan, H., Diao, X., Huang, Z., et al. (2020). Experimental and Numerical Study of Coarse Particle Conveying in the Small Absorber Sphere System: Overview and Some Recent CFD-DEM Simulations. Nucl. Eng. Des. 357, 110420. doi:10.1016/j.nucengdes.2019.110420
Li, Y., Xu, Y., and Jiang, S. (2009). DEM Simulations and Experiments of Pebble Flow with Monosized Spheres. Powder Techn. 193 (3), 312–318. doi:10.1016/j.powtec.2009.03.009
Medina, A., Andrade, J., Córdova, J. A., and Treviño, C. (2000). Gravity Induced Granular Flow Measurements in a 2D Silo with a Lateral Bottom Exit. Phys. Lett. A. 273 (1), 109–116. doi:10.1016/s0375-9601(00)00473-4
Myers, M. E., and Sellers, M. (1971). Chemical Engineering, Tripos Part 2. Research Project Report. Cambridge: University of Cambridge. doi:10.2172/522596
Nedderman, R. M., Savage, S. B., and Houlsby, G. T. (1982). The Flow of Granular Materials-I Discharge Rates Form. CHEM. ENG. SCI. 11, 1597–1609.
Nedderman, R. M., and Laohakul, C. (1980). The Thickness of the Shear Zone of Flowing Granular Materials. Powder Techn. 25 (1), 91–100. doi:10.1016/0032-5910(80)87014-8
Newton, R. H., Dunham, G. S., and Simpson, T. P. (1945). The TCC Catalytic Cracking Process for Motor Gasoline Production. Trans. Am. Inst. Chem. Eng. 41 (2), 215–232.
Pascot, A., Gaudel, N., Antonyuk, S., Bianchin, J., and Kiesgen De Richter, S. (2020). Influence of Mechanical Vibrations on quasi-2D Silo Discharge of Spherical Particles. Chem. Eng. Sci. 224, 115749. doi:10.1016/j.ces.2020.115749
Rycroft, C. H., Grest, G. S., Landry, J. W., and Bazant, M. Z. (2006). Analysis of Granular Flow in a Pebble-Bed Nuclear Reactor. Phys. Rev. E, Stat. nonlinear, soft matter Phys. 74 (2 Pt 1), 21306. doi:10.1103/physreve.74.021306
Saleh, K., Golshan, S., and Zarghami, R. (2018). A Review on Gravity Flow of Free-Flowing Granular Solids in Silos - Basics and Practical Aspects. Chem. Eng. Sci. 192, 1011–1035. doi:10.1016/j.ces.2018.08.028
Shengyao, J., Nan, G., Xingtuan, Y., and Jiyuan, T. U. (2019). Theoretical and Experimental Research Progress on Pebble Flow and Effective Thermal Conductivity in Pebble-type HTGR. At. Energ. Sci. Techn. 53 (10), 1918–1929. doi:10.7538/yzk.2019.youxian.0089
To, K. (2005). Jamming Patterns in a Two-Dimensional Hopper. Pramana - J. Phys. 64 (6), 963–969. doi:10.1007/bf02704158
Uñac, R. O., Vidales, A. M., Benegas, O. A., and Ippolito, I. (2012). Experimental Study of Discharge Rate Fluctuations in a Silo with Different Hopper Geometries. Powder Techn. 225, 214–220. doi:10.1016/j.powtec.2012.04.013
Wan, J., Wang, F., Yang, G., Zhang, S., Wang, M., Lin, P., et al. (2018). The Influence of Orifice Shape on the Flow Rate: A DEM and Experimental Research in 3D Hopper Granular Flows. Powder Techn. 335, 147–155. doi:10.1016/j.powtec.2018.03.041
Wang, D. L. Y. (2002). Roles and prospect of Nuclear Power in China's Energy Supply Strategy. NUCL. ENG. DES 218, 3–12. doi:10.1016/S0029-5493(02)00180-2
Yang, X. T., Hu, W. P., Jiang, S. Y., Wong, K. K. L., and Tu, J. Y. (2012). Mechanism Analysis of Quasi-Static Dense Pebble Flow in Pebble Bed Reactor Using Phenomenological Approach. Nucl. Eng. Des. 250, 247–259. doi:10.1016/j.nucengdes.2012.06.011
Zeng, Y., Jia, F., Zhang, Y., Meng, X., Han, Y., and Wang, H. (2017). DEM Study to Determine the Relationship between Particle Velocity Fluctuations and Contact Force Disappearance. Powder Techn. 313, 112–121. doi:10.1016/j.powtec.2017.03.022
Zuriguel, I., Garcimartín, A., Maza, D., Pugnaloni, L. A., and Pastor, J. M. (2005). Jamming during the Discharge of Granular Matter from a Silo. Phys. Rev. E, Stat. nonlinear, soft matter Phys. 71 (5), 51303. doi:10.1103/physreve.71.051303
Keywords: pebble flow, pebble bed, discharge flow, drainage method, experimental measurement, flow rate fluctuation
Citation: Liu Y, Peng S, Gui N, Yang X, Tu J and Jiang S (2021) Experimental Measurement on Pebble Flow Discharge in a Hopper Silo Based on a Drainage Method. Front. Energy Res. 9:647479. doi: 10.3389/fenrg.2021.647479
Received: 30 December 2020; Accepted: 20 May 2021;
Published: 02 June 2021.
Edited by:
Zeyun Wu, Virginia Commonwealth University, United StatesReviewed by:
Yugao Ma, Tsinghua University, ChinaCopyright © 2021 Liu, Peng, Gui, Yang, Tu and Jiang. This is an open-access article distributed under the terms of the Creative Commons Attribution License (CC BY). The use, distribution or reproduction in other forums is permitted, provided the original author(s) and the copyright owner(s) are credited and that the original publication in this journal is cited, in accordance with accepted academic practice. No use, distribution or reproduction is permitted which does not comply with these terms.
*Correspondence: Nan Gui, Z3VpbmFuQG1haWwudHNpbmdodWEuZWR1LmNu
Disclaimer: All claims expressed in this article are solely those of the authors and do not necessarily represent those of their affiliated organizations, or those of the publisher, the editors and the reviewers. Any product that may be evaluated in this article or claim that may be made by its manufacturer is not guaranteed or endorsed by the publisher.
Research integrity at Frontiers
Learn more about the work of our research integrity team to safeguard the quality of each article we publish.