 Jude O. Majasan
 Jason I. S. Cho
 Maximilian Maier
 Paul R. Shearing
- Electrochemical Innovation Lab, Department of Chemical Engineering, University College London, London, United Kingdom
Optimised mass transport is crucial for high current density operations in Polymer Electrolyte Membrane Water Electrolysers (PEMWEs). This study investigates the effect and interactions of mass transport parameters on the performance of a PEMWE using a 23 full-factorial Design-of-Experiments (DoE) approach with replication. The effects of anode flow-field design, anode porous transport layer (PTL) and water flow rate on the cell performance were studied. At 95% confidence level, the result shows that all three factors and their two-way interactions significantly affect the cell performance. Among them, the water flow rate showed the most significant contribution, followed by the interaction between the flow-field and the PTL. A regression model was developed to relate the cell performance and the mass transfer parameters. Results of analysis of variance (ANOVA), regression analysis and R2 test indicated good accuracy of the model. The best PEMWE cell performance was obtained with a parallel flow-field configuration, a small average pore diameter of PTL and high anode water flow rate. The DoE is shown to be a suitable method for investigating interactions and optimising the operating conditions to maximise PEMWE performance.
Introduction
Polymer Electrolyte Membrane water electrolysers (PEMWEs) have garnered strong attention in recent years due to its potential for clean, sustainable hydrogen production and long-term renewable energy storage using renewable sources of electricity (e.g., wind and solar power) (Barbir, 2005; Carmo et al., 2013; Dmitri et al., 2016). One crucial step toward optimising hydrogen production from PEM water electrolysers is understanding the influence of various operating and structural parameters; in particular, mass transport effects, which influences the operation of PEM water electrolysers at high current density (Babic et al., 2017).
The effectiveness of mass transport in the PEMWE depends on several factors including the anode water flow rate, the flow-field design, porous transport layer (PTL) design, etc. The individual influence of these various geometric properties and operational factors has been investigated and reported to be of critical importance in determining PEMWE performance (Ito et al., 2010; Selamet et al., 2013; Suermann et al., 2017; Li et al., 2018; Toghyani et al., 2018; Maier et al., 2019). However, mass transport in the PEMWE is a complex, multi-component and multiphase phenomenon, which requires a systemic understanding of the interaction of various factors, rather than their stand-alone effects.
One approach to this problem is a design-of-experiments (DoE) methodology. DoE is a powerful statistical experimental design tool for identifying the influence of the most critical factors and interactions in a system (Montgomery, 2012; Jiju, 2014). When several variables influence performance, it is crucial to design a valid and reliable experiment from which sound conclusions can be drawn effectively and efficiently. In conventional experimentation, only one input factor is varied while the rest of the input factors are kept constant to determine the effect of that input factor on the response of interest. In reality, the simultaneous variation of input factors may result in different responses due to interactions among those input factors (Palkar and Shilapuram, 2015). However, information about factor interactions cannot be obtained using the conventional one-factor-at-a-time (OFAT) approach.
Therefore, one main advantage of the DoE methodology is that it explores the influence of several factors and their interactions on the overall performance of a system. Three primary DoE methodologies are commonly used in industrial and academic research, depending on the requirements: full-factorial, fractional factorial, and Taguchi orthogonal arrays (Kaytakoǧlu and Akyalçin, 2007). The full-factorial design iterates all possible combinations within the experimental space. Although it may require a prohibitive number of experimental runs, it offers precise results on the interaction between factors and avoids information loss and misleading conclusions. The fractional factorial method and the Taguchi orthogonal array exclude some of the factor-levels from the full-factorial design to achieve an optimised combination with minimum time and computational cost (Yu et al., 2008).
Despite the DoE’s advantages as a statistical method capable of increasing experimental efficiency and facilitating scientific objectivity in experimental data analysis, it has seen only limited application in electrolyser and fuel cell research, although now increasingly deployed in the optimisation of electrochemical systems (Yu et al., 2008; Karthikeyan et al., 2013; Lakshminarayanan and Karthikeyan, 2016; Rahim et al., 2017; Pessot et al., 2019). In PEM fuel cells, the DoE protocol has been applied for optimisation of the power output of a commercial PEFC stack (Dante et al., 2003), to evaluate the effect of various operating parameters on the global performance of a PEM fuel cell (Flick et al., 2014) and for investigation of water and heat management in PEM fuel cells (Kahveci and Taymaz, 2014). Other fuel cell applications include for temperature measurement accuracy in solid oxide fuel cells (SOFCs) (Barari et al., 2014) and operational optimisation of a DMFC stack (Schulze Lohoff et al., 2016).
The application of DoE in PEMWE research is more limited; only a couple of studies have employed this statistical technique for performance optimisation in PEM water electrolysers. In the first such study, the DoE approach was applied to investigate the mechanism of water transport into the membrane of a high-pressure PEM water electrolyser (Santarelli et al., 2009; Medina and Santarelli, 2010). In a more recent study, a thermodynamic modelling approach was combined with the Taguchi method to optimise seven operating parameters in the PEMWE, and suggested that optimal combination of mass transport parameters can be determined (Toghyani et al., 2019). However, for optimised PEMWE operation especially at high current densities, it is necessary to understand and quantify the relative contributions and interactions of various design and operational parameters which influences mass transport and, hence, overall PEMWE performance.
In this study, the effect of mass transport variables, namely flow-field design, PTL geometry and microstructure, and anode water flow rate on the PEMWE performance is quantified and analysed using a full-factorial design. The relative strength of the parameters and their interactions were identified, and the optimum combination of operating parameters which yields the best performance (lowest cell voltage) was determined.
Experimental
Polymer Electrolyte Membrane Water Electrolyser Cell
The PEMWE cell used for the experiments is shown in Figure 1. It has a square active area of 9 cm2 and consists of 20 mm-thick Perspex endplates, titanium flow-field plate, and titanium sinter PTLs either sides of a core membrane electrode assembly (MEA). The cell was held together with eight M5 screws, fastened to a torque of 2.5 Nm. The MEA with an active area of 3.0 × 3.0 cm2 was made of Nafion 115 membrane with the two electrodes coated either side. The anode composed of iridium/ruthenium oxide at 3 mg cm–2 loading and the cathode composed of platinum black at a loading of 0.6 mg cm–2.
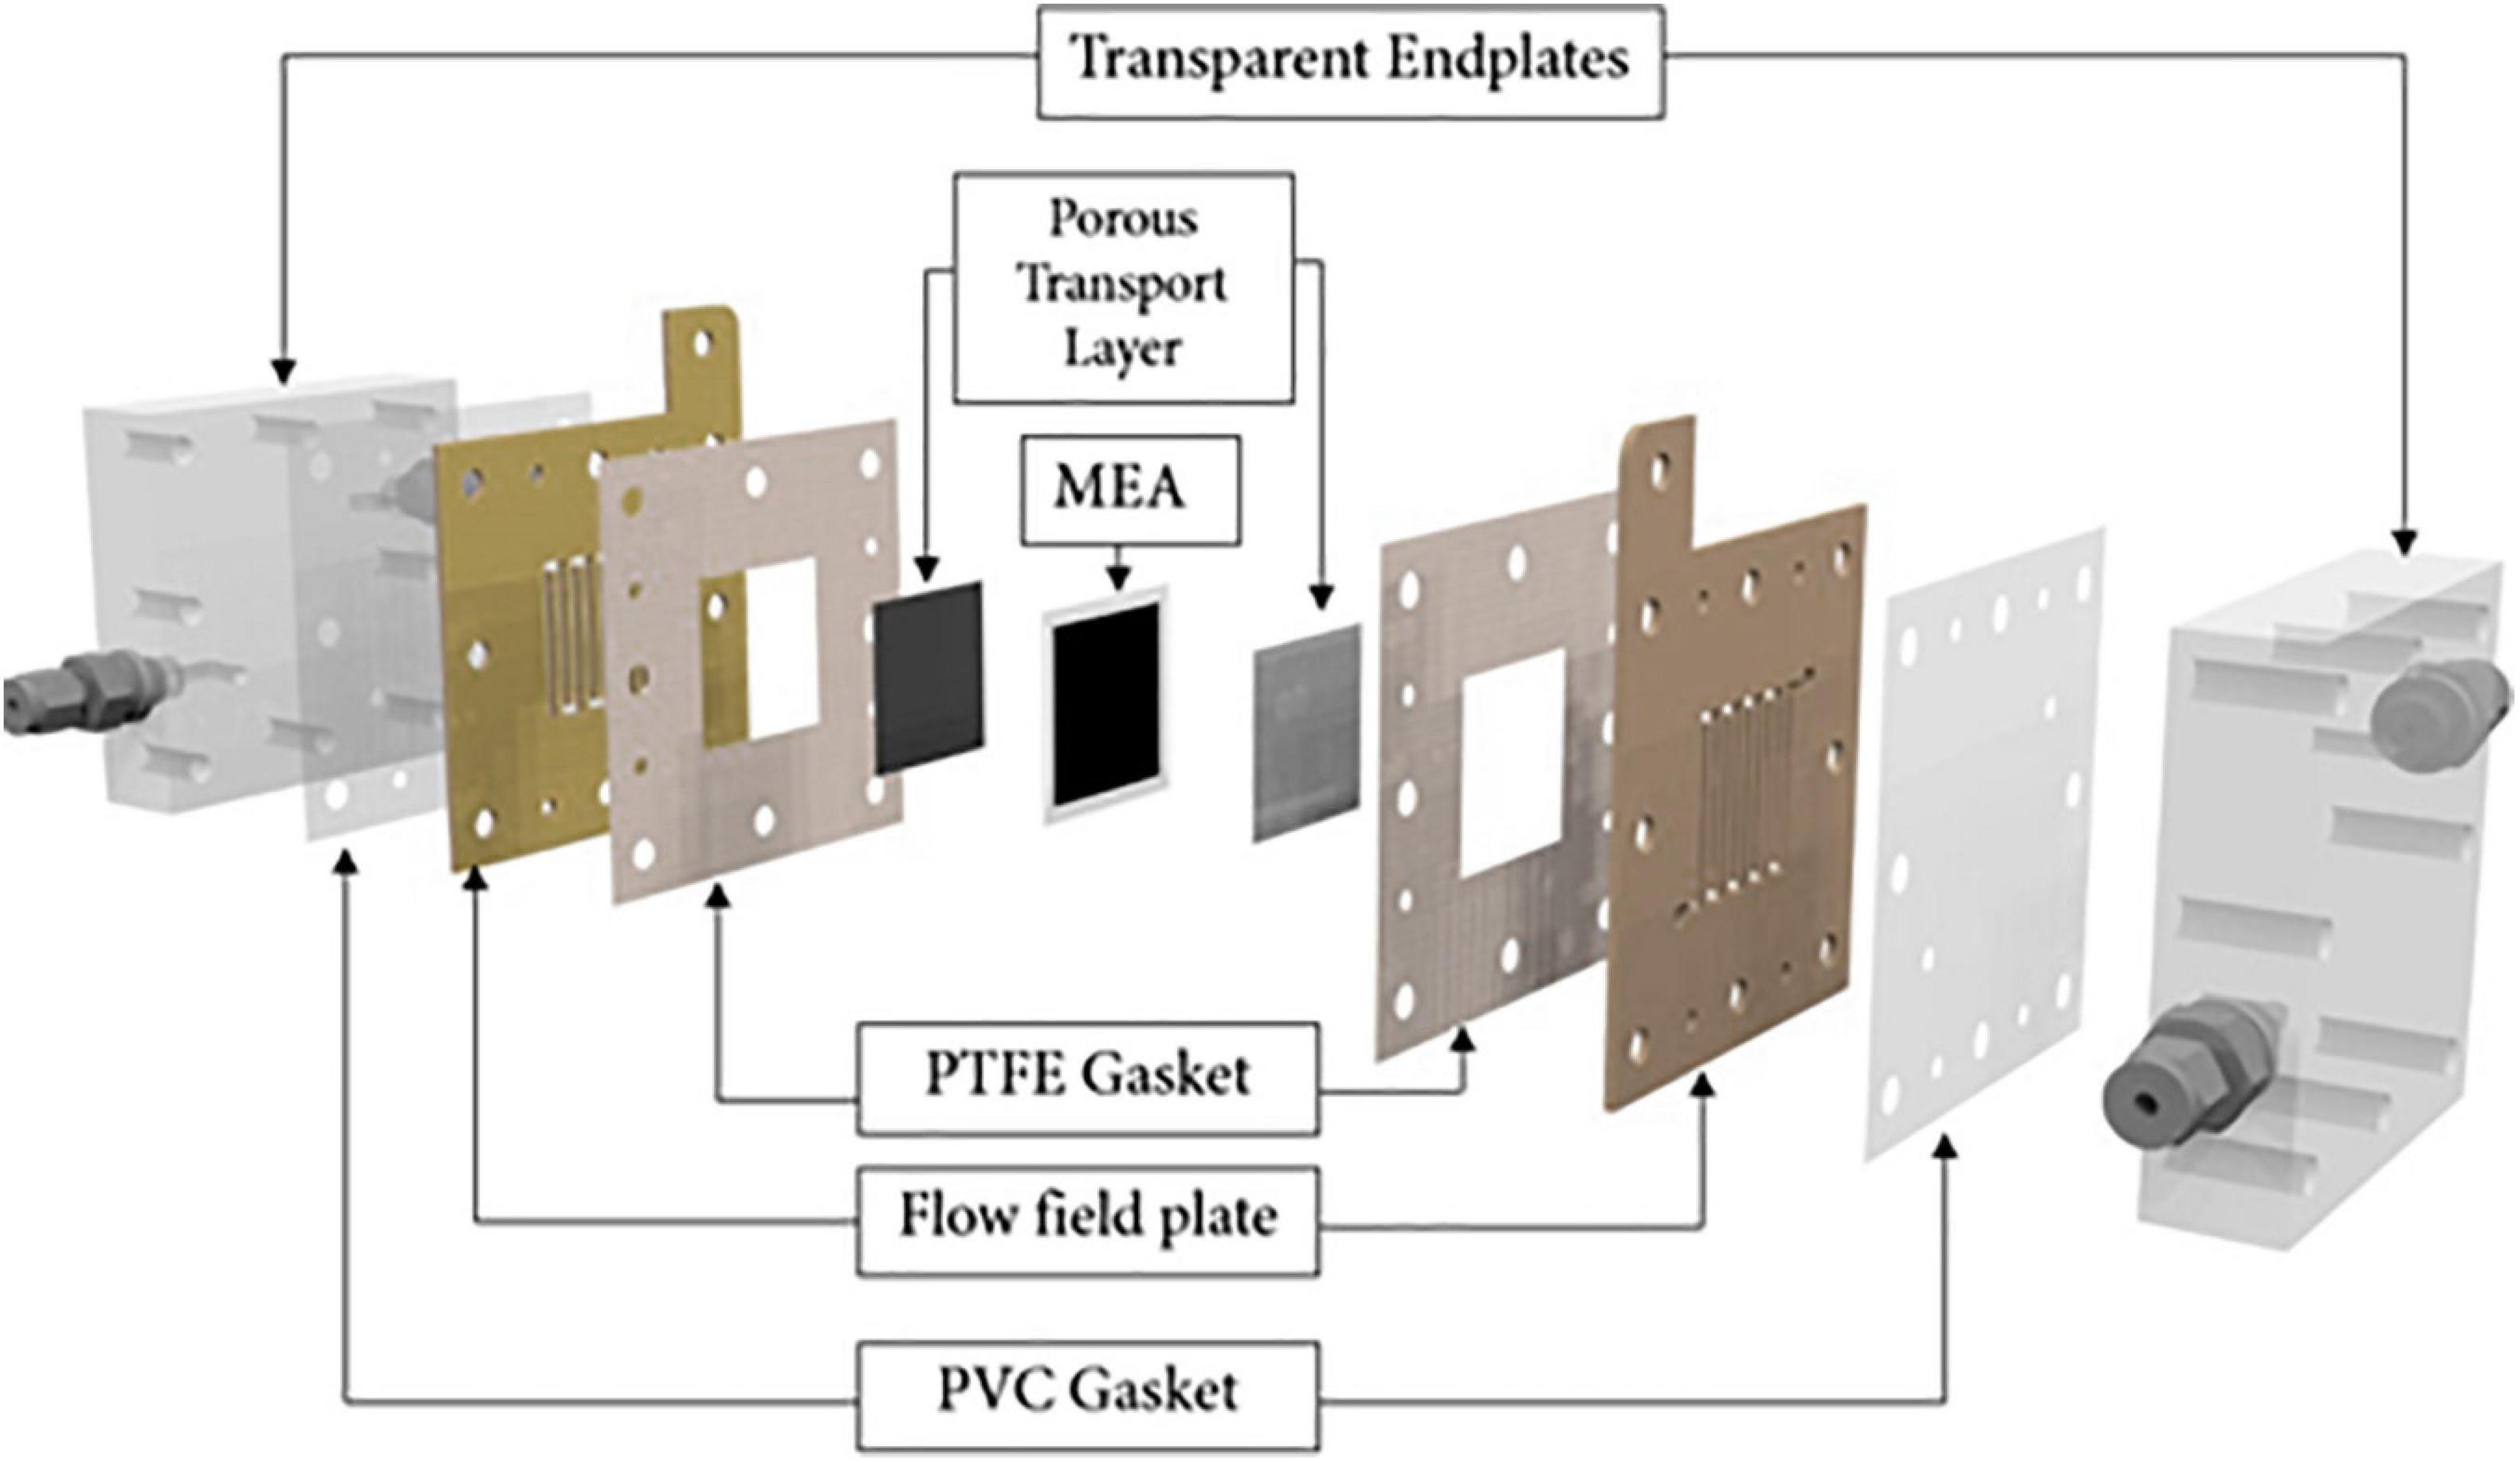
Figure 1. Schematic of the PEMWE cell used for the study.
Two different flow-fields were designed for testing at the anode: a parallel flow-field (PFF) and a single serpentine flow-field (SSFF) shown in Figures 2A,B. The PFF comprised nine parallel straight channels, each 30 mm long and the SSFF consisted of a single meandering flow channel with nine linked vertical segments (each 30 mm long) and eight horizontal segments (each 1.76 mm long). Both flow-field designs have channel depth of 2 mm and a channel and rib width of 1.76 mm to maintain the same open ratio (ratio of channel area to MEA area) of 55.7% for a fair comparison. Two anode PTLs (with average pore diameters of 16 and 60 μm) and two water flow rates (15 ml min–1 and 60 ml min–1) were used in this study and shown in Figures 2C,D. These levels of operational parameters were considered reasonable bounds for good PEMWE performance (Grigoriev et al., 2009; Ito et al., 2010; Hwang et al., 2011; Majasan et al., 2018).
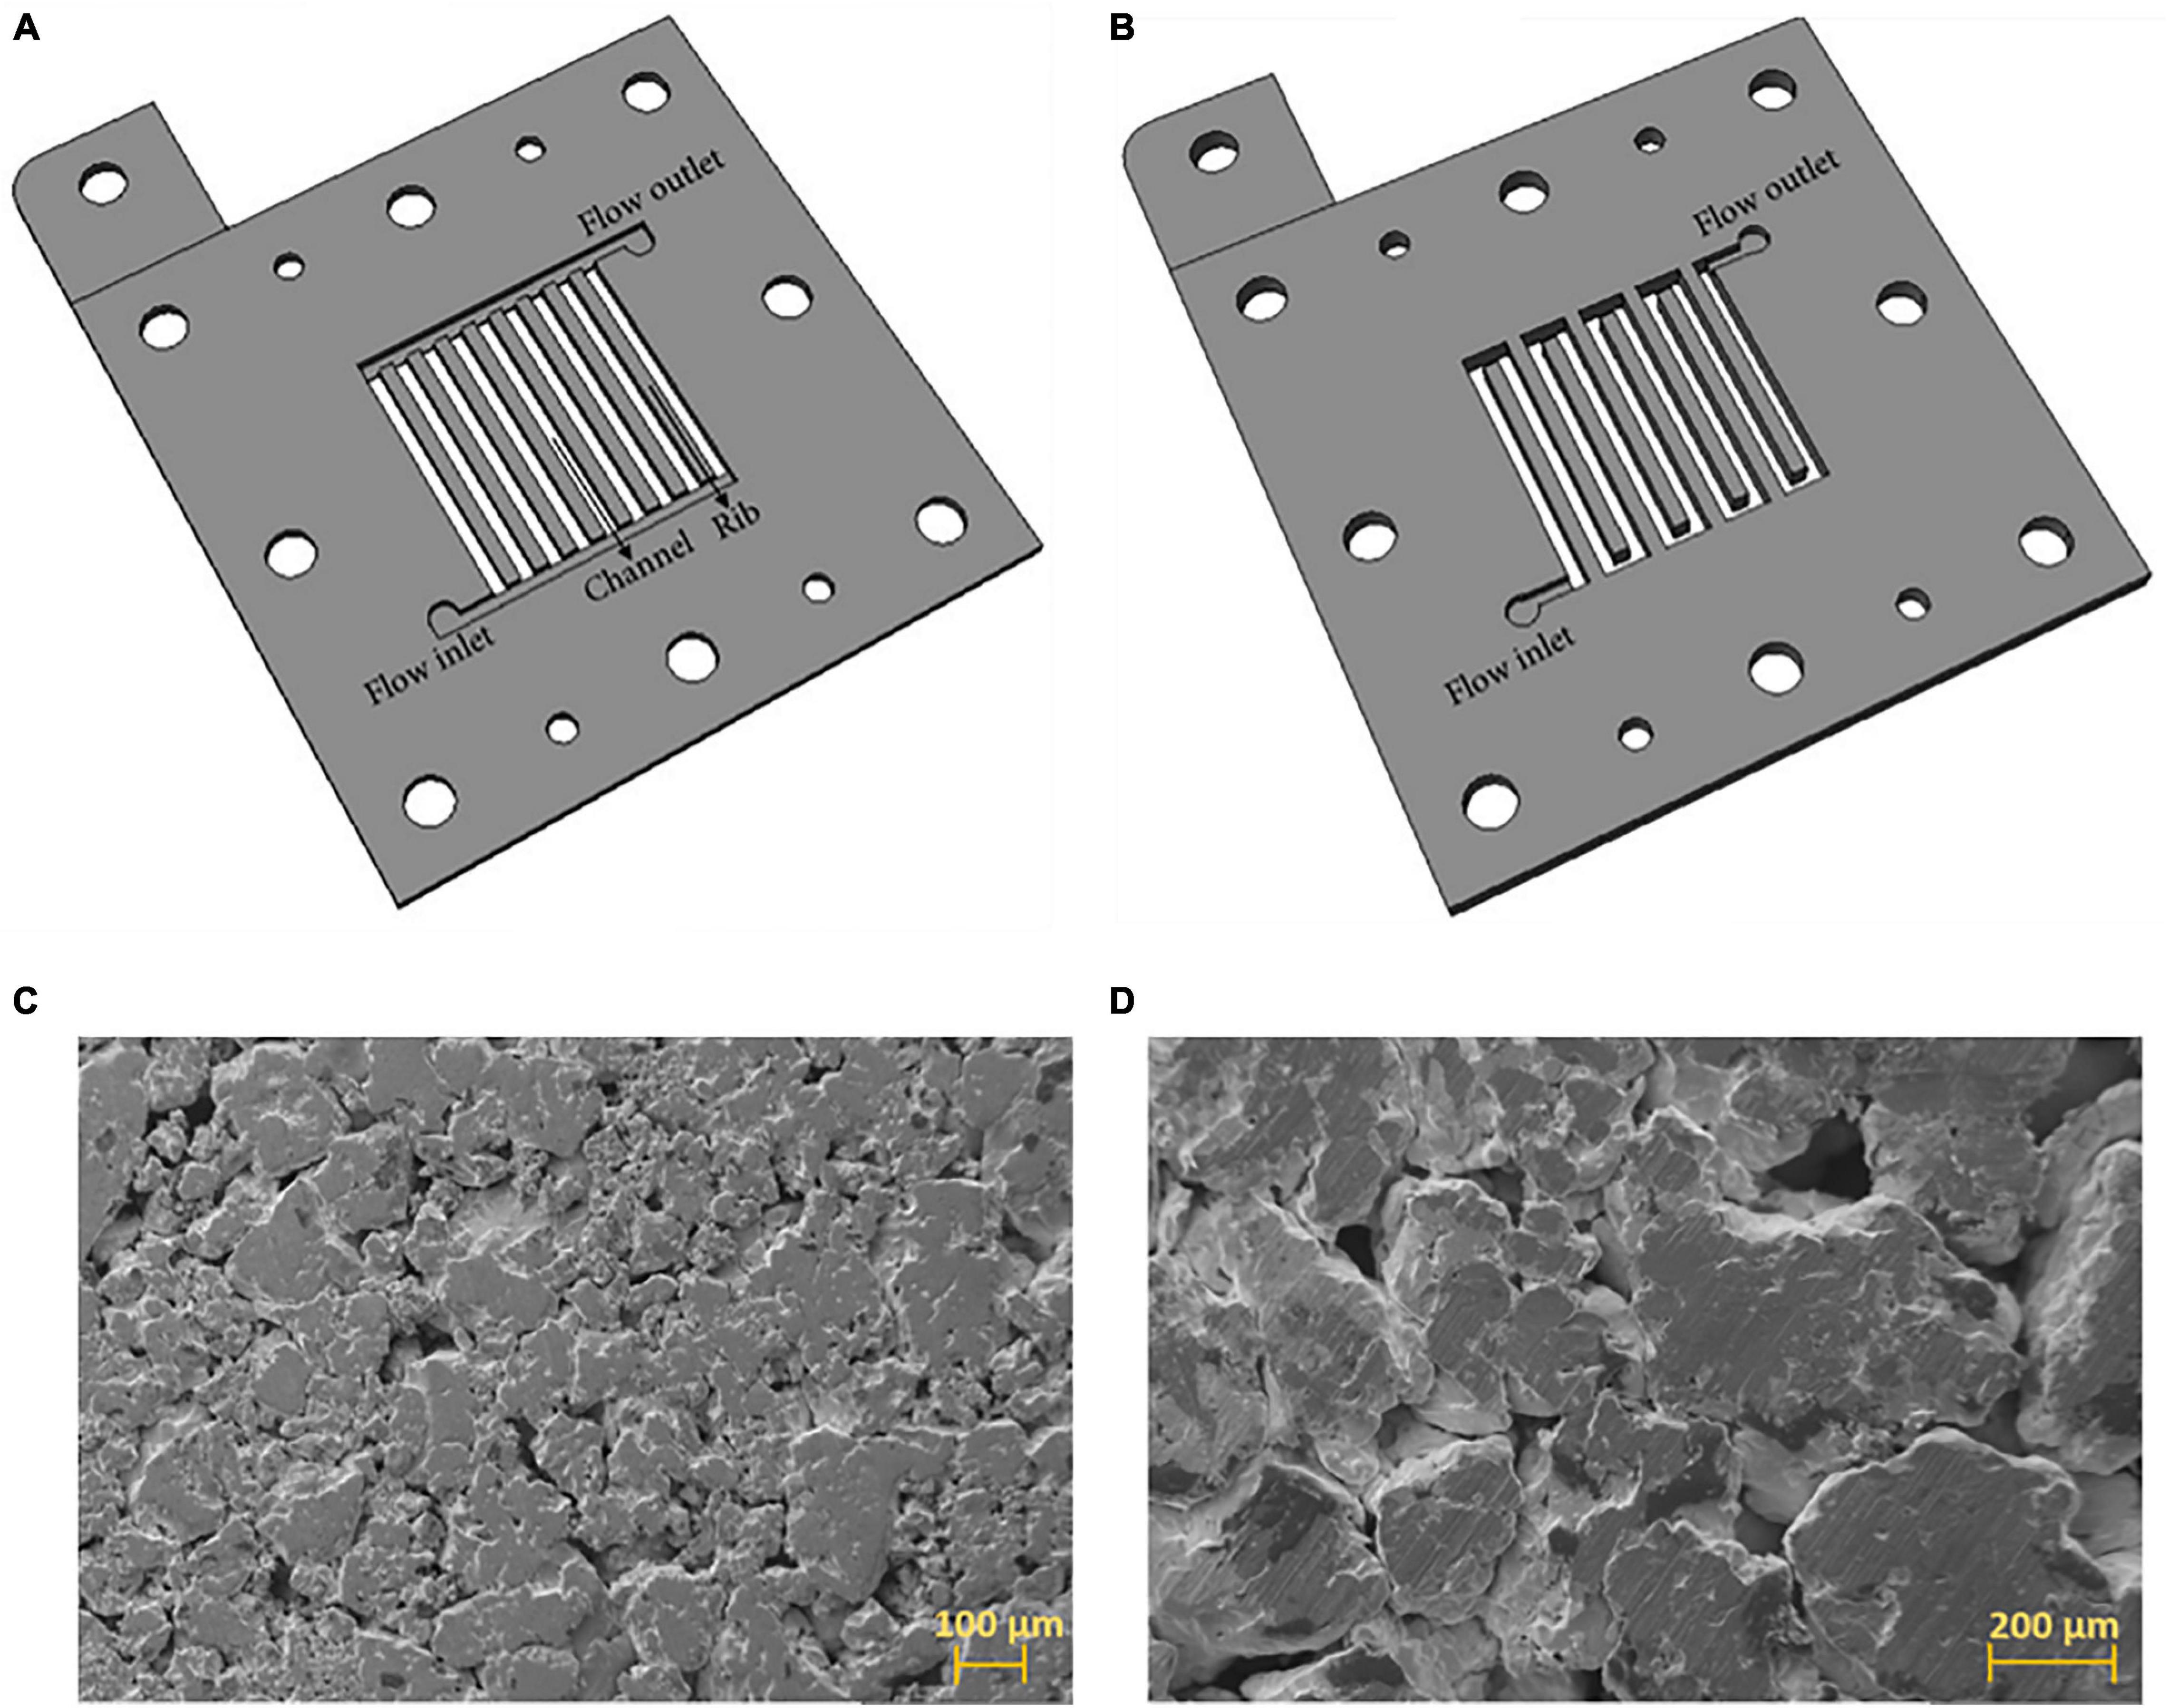
Figure 2. (A) Parallel flow-field design (PFF), (B) single–serpentine flow-field design (SSFF) (C) SEM image of the SP-PTL with an average pore diameter of 16 μm at 200× magnification (D) SEM image of the LP-PTL with an average pore diameter of 60 μm at 200× magnification.
Deionised water was supplied to the PEMWE cell from a reservoir using a digital peristaltic pump (Watson Marlow 323U). The inflowing deionised water was preheated to 80°C using a digital heated circulating bath (TC120, Grant Instruments Ltd.). The heated water was supplied to both electrodes, and the cell was operated at ambient pressure. Excess unreacted water and product O2 and H2 gases were returned to the water reservoir where the gases were separated and vented while the deionised water was recycled to the cell.
A Gamry Reference 3000 Galvanostat/Potentiostat with a Gamry 30k Booster (Gamry Instruments, United States) was used for the electrochemical testing. At each combination of operating parameters and design, a constant current of 27 A corresponding to a current density of 3.0 A cm–2 was applied to the cell for 45 min to ensure stability, and the corresponding cell voltage was measured.
Scanning electron microscopy (SEM, Zeiss EVO MA10, Carl Zeiss, United States) was used to examine the morphology of the surface of the PTLs. Five millimetre diameter disc of each PTL sample was imaged in a secondary electron imaging mode at an electron accelerating voltage of 10 kV and working distance range of 8–8.5 mm. The images were captured and collected using the built-in SmartSEM® image acquisition and processing software. Furthermore, the average pore diameter of the PTLs were determined using digital image analysis ImageJ software (ImageJ v1.52d). The analysed images were acquired from X-ray computed micro-tomography (ZEISS Xradia Versa 520, Carl Zeiss X-ray Microscopy Inc., Pleasanton, CA) using a procedure described previously (Majasan et al., 2019).
Design-of-Experiment Methodology
The first step in applying the DoE methodology is to identify the factors and levels under investigation, which requires a fundamental understanding of the basic physics of the process. Based on the present understanding of mass transport processes in PEMWE, the three factors considered for the experimental design were the anode flow-field design, the anode PTL, and the water flow rate. The water flow rate levels were chosen based on the range used in previous studies (Ito et al., 2010; Majasan et al., 2018). Two of the most common, yet disparate, flow-field designs (parallel and serpentine designs) (Ito et al., 2010; Majasan et al., 2018; Toghyani et al., 2018) were selected to show the effect of flow-field configuration. The range of anode PTL was selected based on various mean pore diameter that has been explored in the literature and previous studies by the authors (Grigoriev et al., 2009; Majasan et al., 2019). Hence, two PTLs having a mean pore diameter of 16 μm, labelled small-pore PTL (SP-PTL) and 60 μm, labelled large-pore PTL (LP-PTL), were selected.
The full-factorial design, which tests all possible conditions, was used for this study for a test matrix of three factors and two-levels, which implies 23 or 8 experiments. This design considers all the main effects and their interactions. The experimental design and analysis of the factorial experiments were performed using MINITAB 19 (PA, United States) statistical software. Each experiment was replicated to observe variation in results within the experimental trial, making a total of 16 experiments performed. The running order was randomised to minimise the effects of undesirable disturbances or external factors which were uncontrollable during the experiment.
A summary of the variables and the levels for the experiment are presented in Table 1. Each factor was studied at low and high levels. The regression model with three factors and their interactions is approximated by Equation 1:
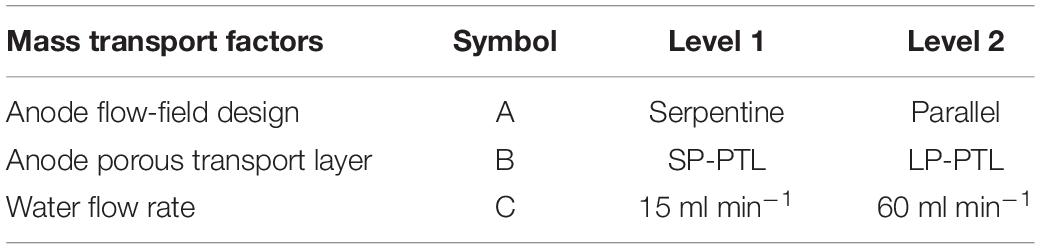
Table 1. Design factors and their levels.
where Yi represents the experimental response (e.g., the cell voltage), Xi is the coded variable (at low and high levels), bi represents the estimation of the principal effect of the factor i for the response Yi, whereas bij represents the estimation of the interaction effect between factor i and j for the response. The coefficient b0 represents the average value of the response of the eight combinations; b123 represents the interactions between three factors, and ε123 is a random error or residual component.
Results and Discussion
Electrochemical Performance
For each combination of operating parameter and geometric properties, a constant current of 27 A was applied to the cell for 45 min to ensure stable operation, and the corresponding cell voltage was measured. Table 2 presents the cell potential at various combinations of relevant factors and replicate using a “smaller the better” analysis to minimise power requirement in the PEMWE.
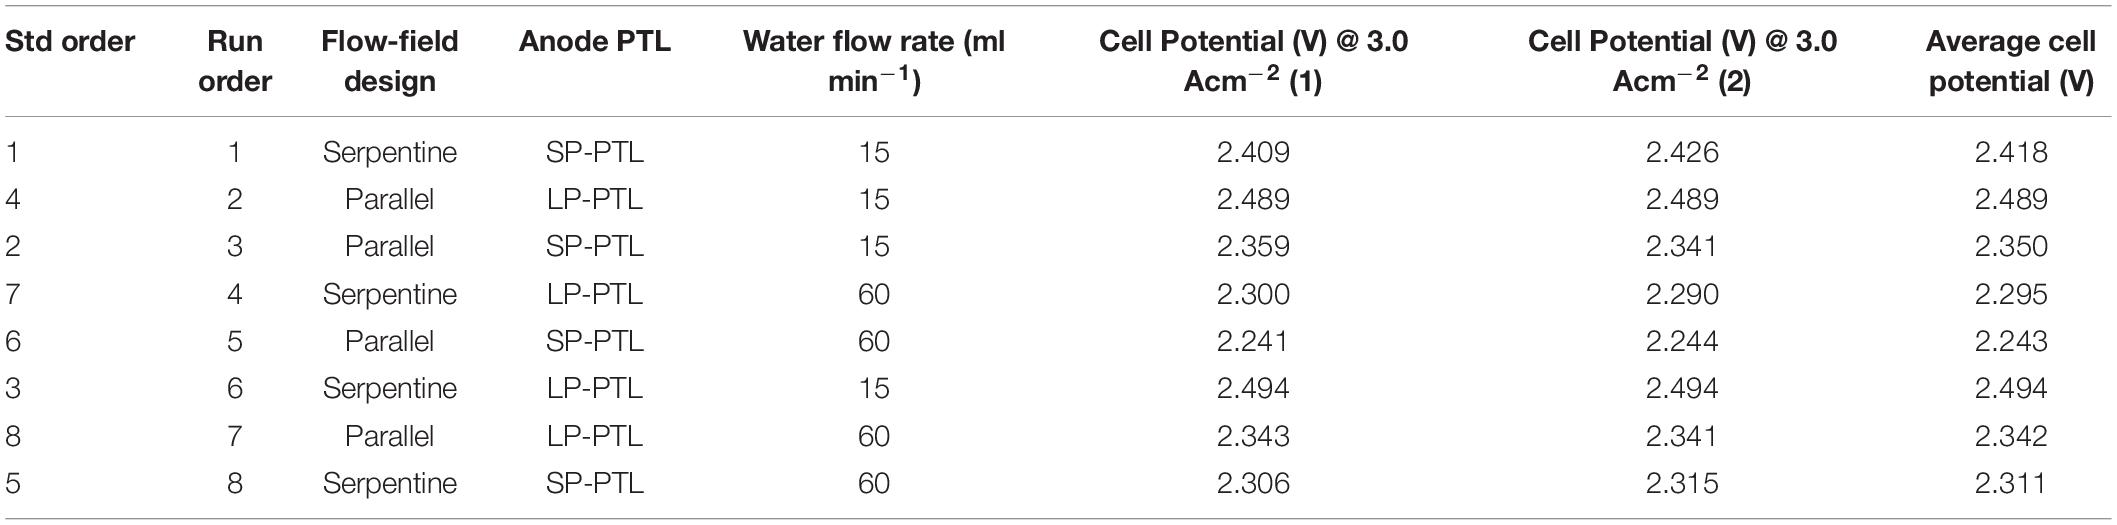
Table 2. Experimental design layout and results.
Figure 3 presents the performance of the various factor combinations in the PEMWE cell at a constant operating temperature of 80°C and ambient pressure, labelled according to the run order. It is evident that different mass transport parameter combinations influence cell performance differently. For instance, at the operational current density of 3.0 A cm–2, the cell voltage in the best-performing combination (P_SP_60) was about 250 mV lower than for the worst-performing combination (S_LP_15). This suggests that optimisation of PEMWE performance, especially at high current densities, requires identifying the best combination of component design and parameters.
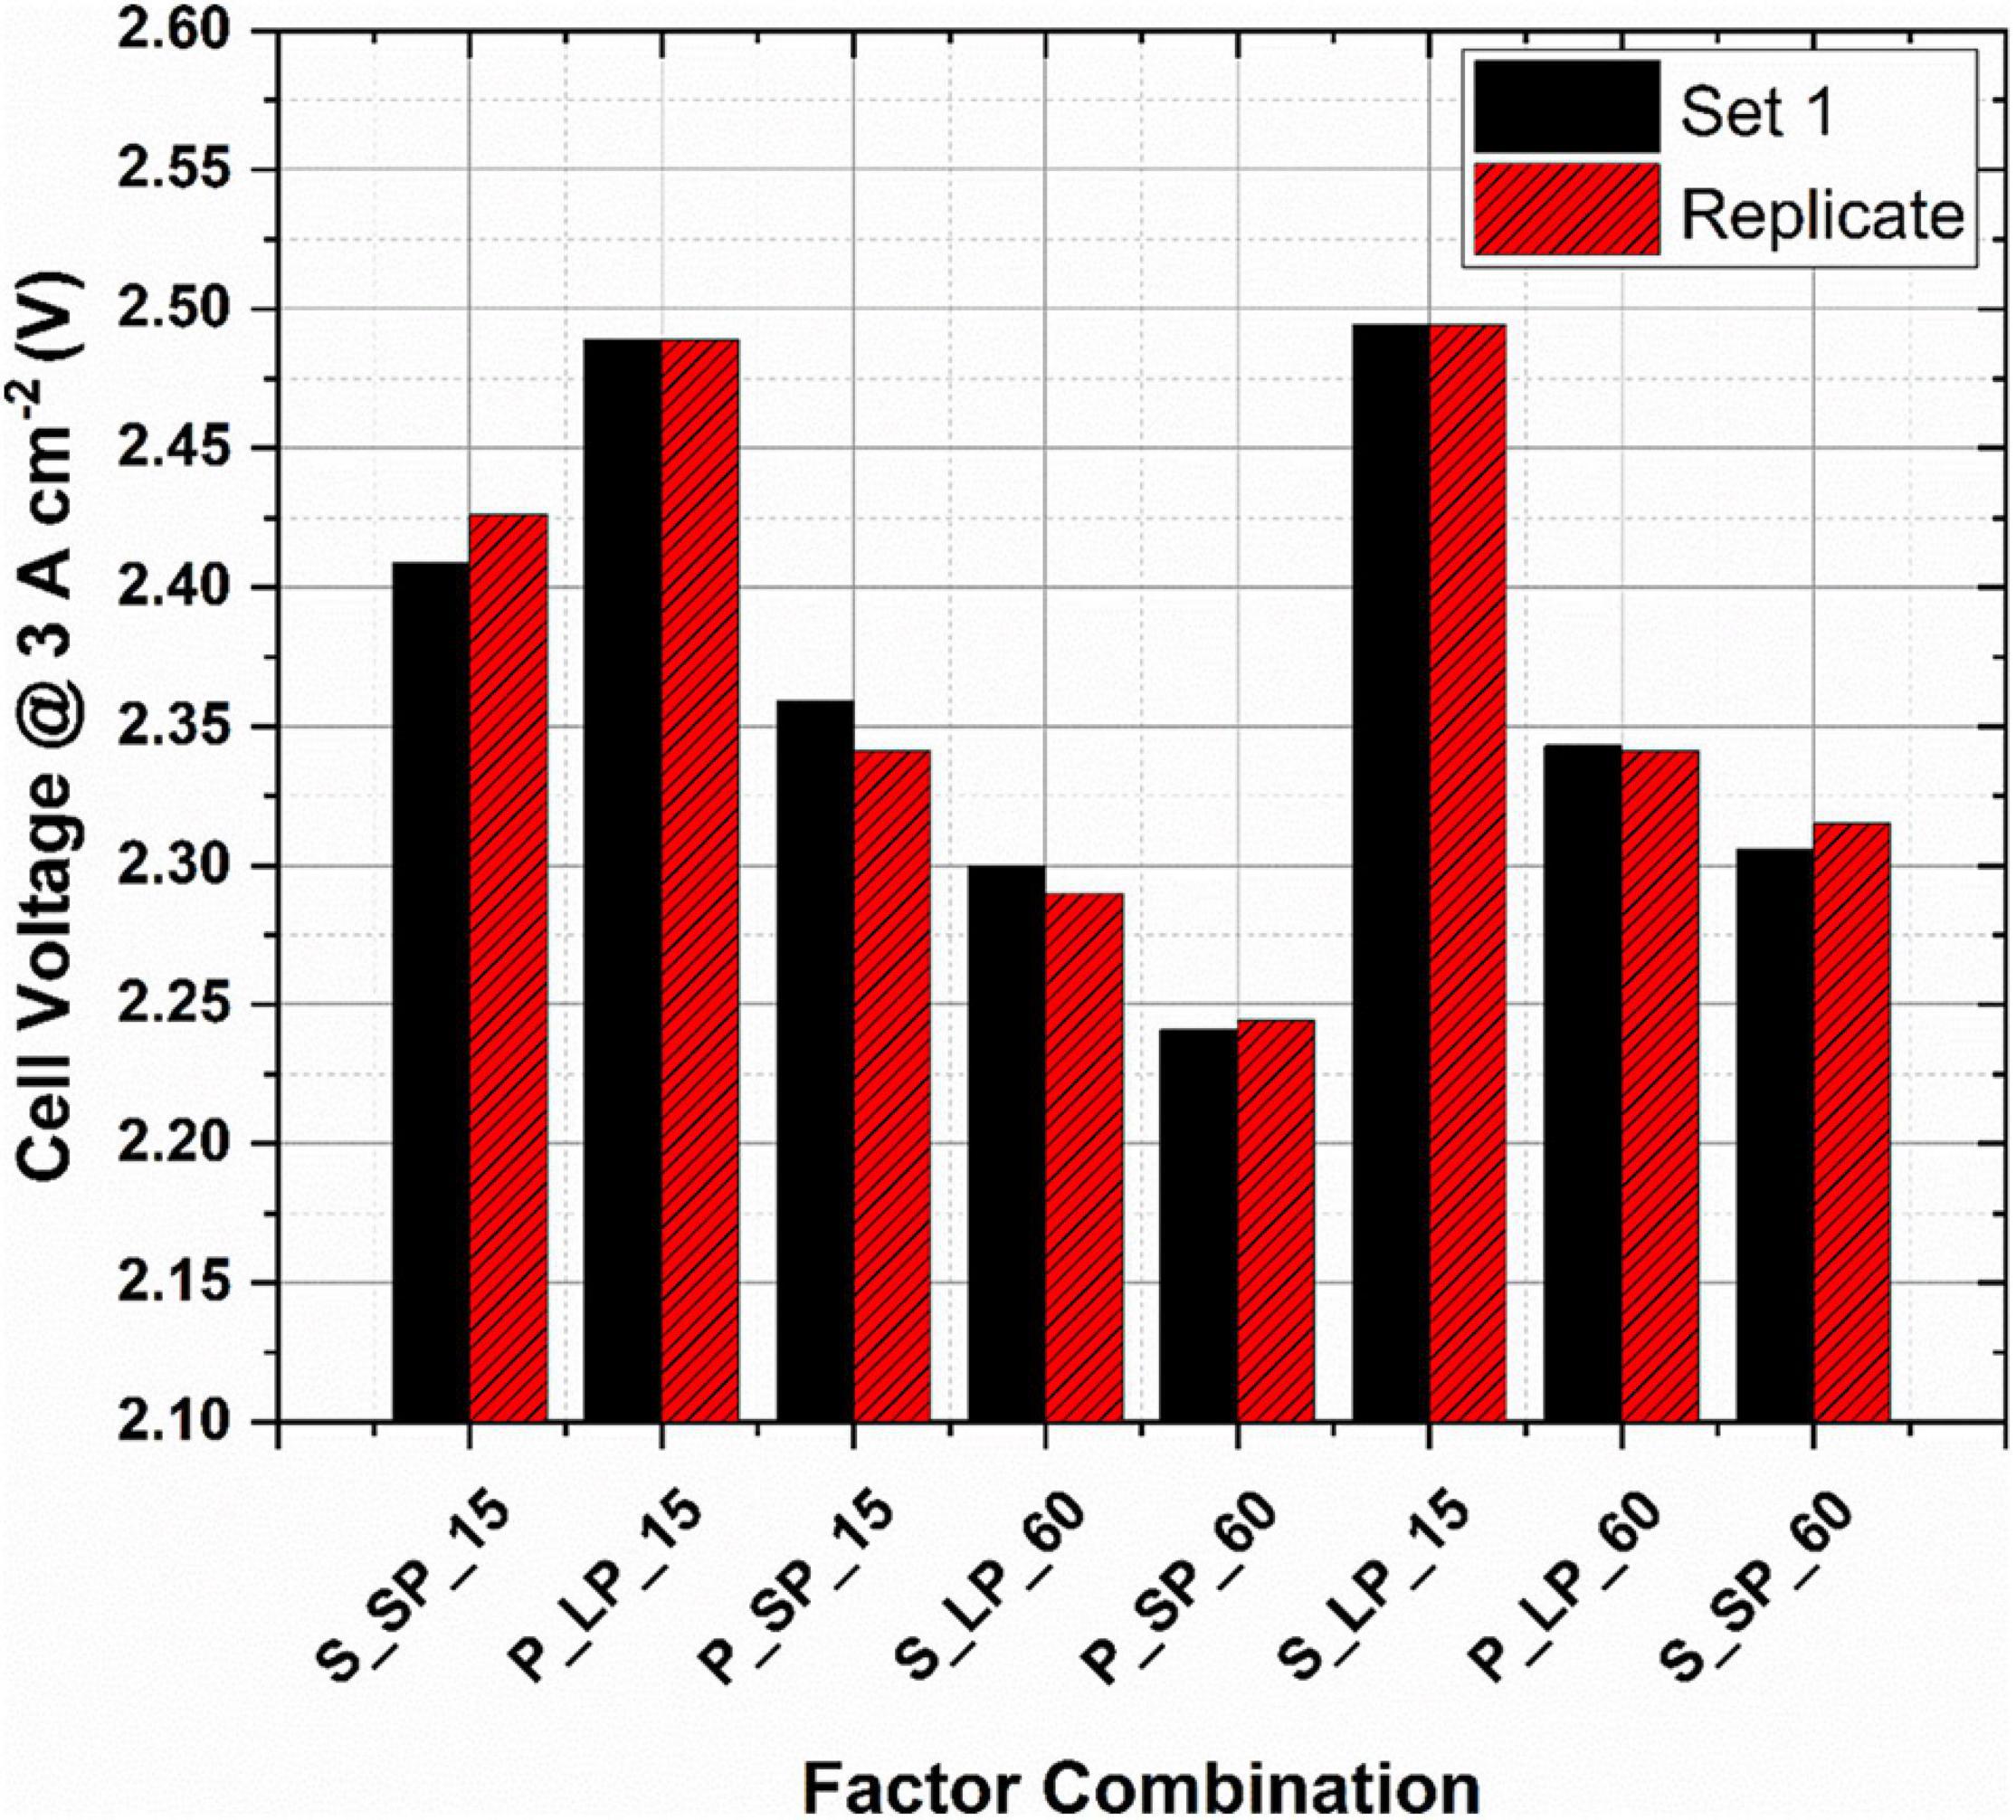
Figure 3. Cell voltage at the various design and parameter combinations (flow-field_PTL_water flow rate) at a constant current density of 3.0 A cm–2, operating temperature of 80°C and ambient pressure.
Analysis of Variance (ANOVA) Results of Experimental Data
The full factorial design was applied to establish the relationship between the cell performance (cell voltage at 3.0 A cm–2) and the influencing factors (anode flow-field design, anode PTL and water flow rate). The main tool for estimating the main and interaction effects of factors on the PEMWE performance is the analysis of variance (ANOVA). A confidence interval of 95% was selected for all statistical analysis.
Table 3 presents the ANOVA results, including the degrees of freedom (Df), the adjusted sum of squares (Adj SS), the adjusted mean of squares (Adj MS), F-values and P-values. The F-value for each factor is the ratio of the respective mean square effect to the mean square error, whereas the P-value tests the null hypothesis that the coefficient obtained for the variable is equal to zero (i.e., no effect) (Toghyani et al., 2019). Thus, a low P-value (in this study, P-value ≤0.05) indicates that the null hypothesis can be rejected and that the factor in question correlates with the response (cell voltage). Therefore, the F-value, used in conjunction with the P-value indicates how strongly a given factor influences the studied response (Oliveira et al., 2018). A larger F-value means that the factor has greater significance in obtaining the measured cell potential; an effect is considered statistically significant if P≤ 0.05 (Wu and Hamada, 2000). The effects plots, presented in later sections, illustrate the statistical analysis and provide the variation of significant effects. The model P-values of 0.000 (100% confidence level) and 0.003 (99.7%) indicate that all the individual factors and their two-way and three-way interactions are significant. At the last row of the table is the model’s summary in percent values along with the Standard error of regression (S). The R-Sq. value implies that 99.64% of the sample variation could be attributed to the parameters and indicate that < 1% of the total variation cannot be explained by the model implying that the model adequately fits the data. The similar values of the R-Sq. (predicted) R-Sq. and (adjusted) R-Sq. values suggest that the data is not overfitted to the model.
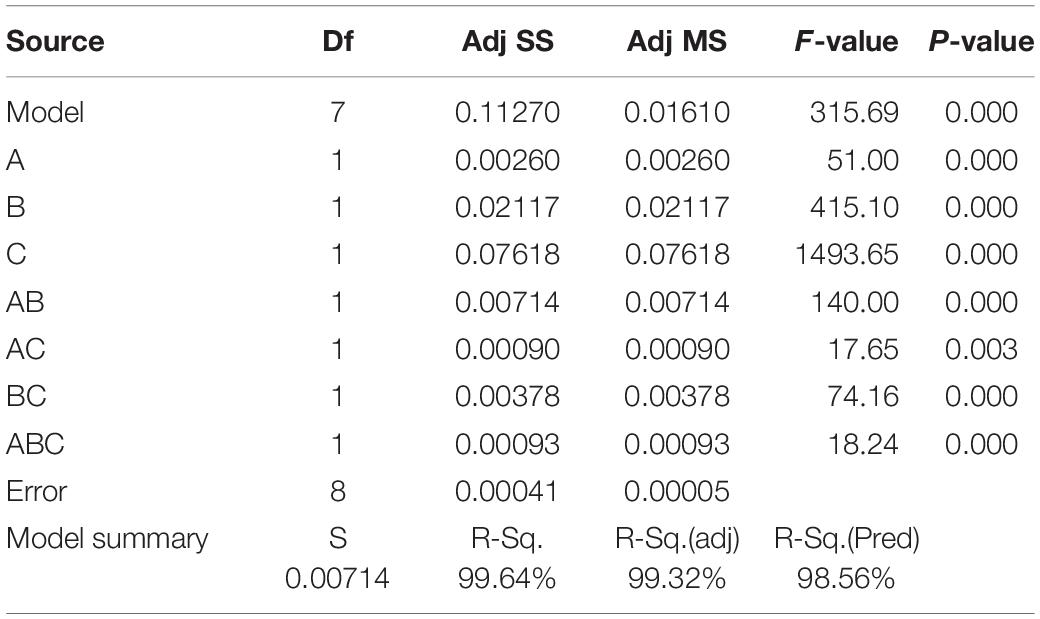
Table 3. Analysis of variance (ANOVA) of factors and interactions including the degrees of freedom (Df), the adjusted sum of squares (Adj SS), the adjusted mean of squares (Adj MS), F-values and P-values.
Normal Effects Plot
Figure 4 shows the normal plot of the standardised effects. The straight line in the plot indicates the points where the factors exhibit no effects. An interception of points with the line indicates that the factors are insignificant, and the effects are close to zero, whereas points lying away from the line signify factors with significant effects. At α=0.05, the significant effects have been labelled. As can be seen, all the studied factors and their two-way and three-way interactions are significant.
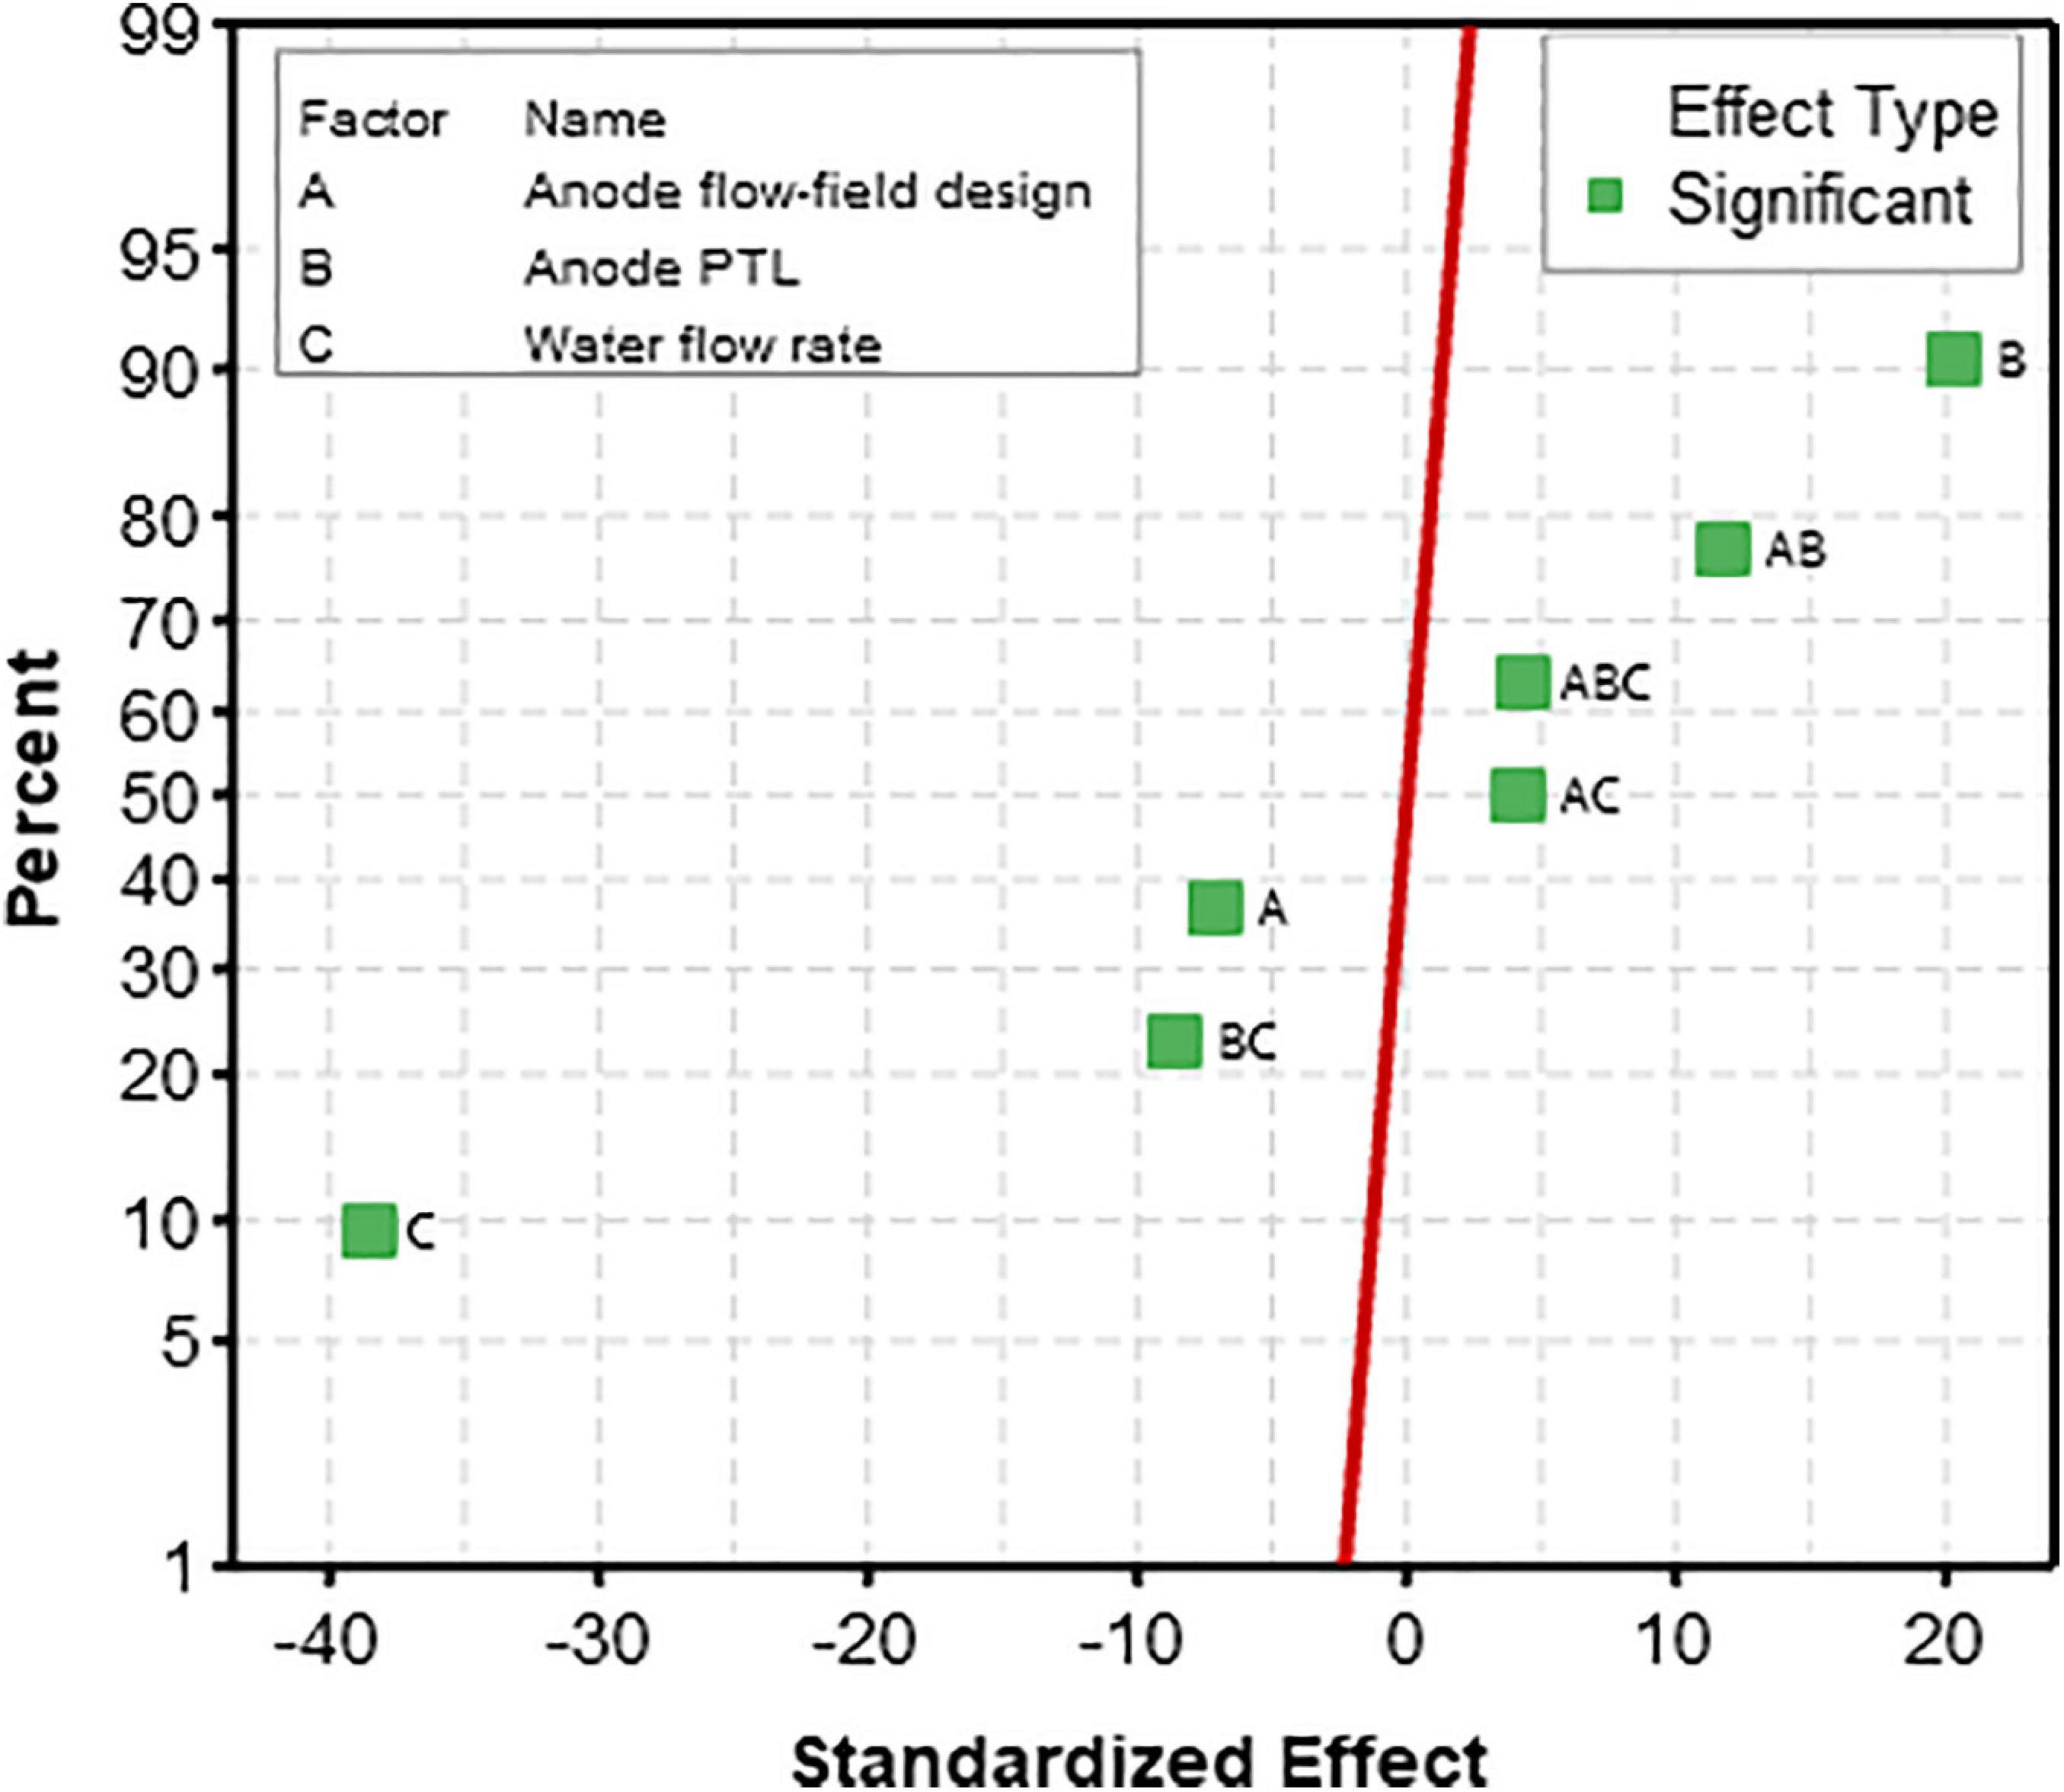
Figure 4. Normal plot of standardised effects of the mass transport parameters. The red line indicates where all the effects are zero. The effects furthest away from the line shows the most significant influence on output response.
Pareto Plot
The importance of each design factors and interactions can be graphically interpreted by constructing a Pareto chart, presented in Figure 5. Pareto chart is a bar graph arranged in descending order from top to bottom to visually depict which factors or interactions are most significant. It is clear from Figure 5 that factor C (water flow rate) has the most significant effect on the cell performance, followed by B (anode PTL), and then AB (interaction between anode flow-field design and anode PTL) and so on. It can be seen from the graph that all the three factors and their interactions are significant, as the standardised effects were greater than the margin error of 2.31, shown as a red line which denotes the minimum threshold of significance.
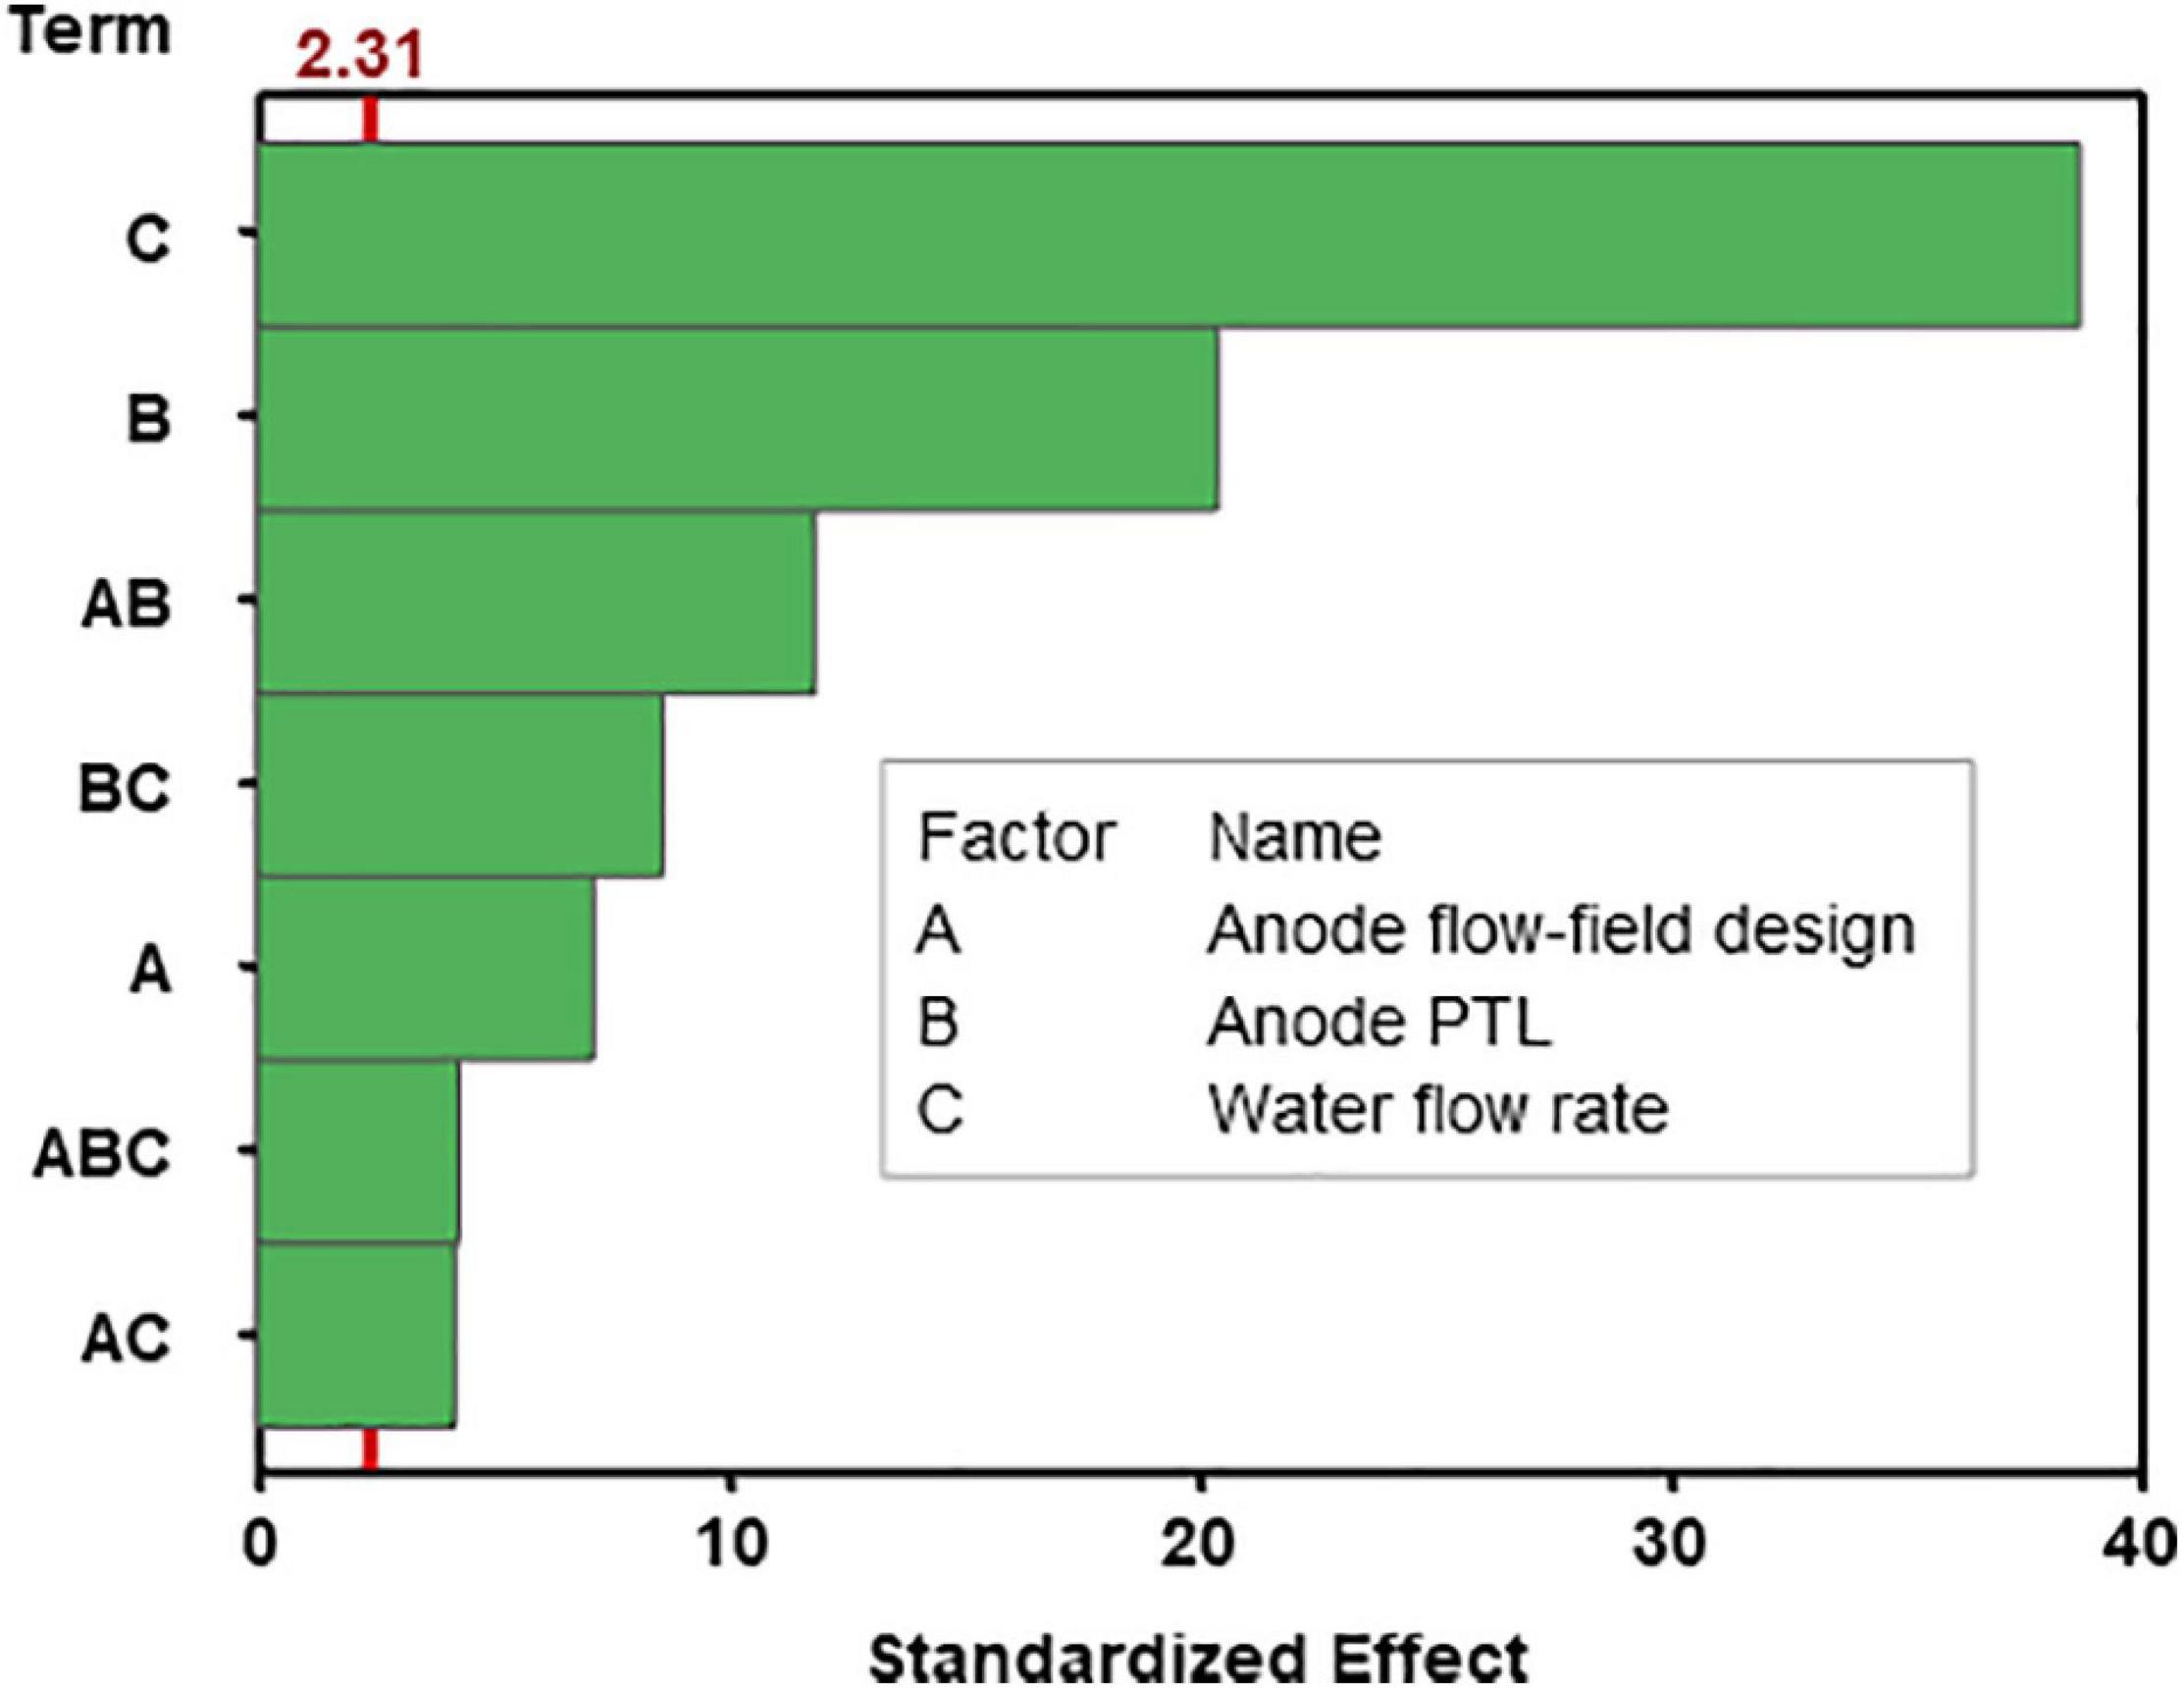
Figure 5. Pareto chart showing the relative significance of the investigated factors and interactions on the response (cell potential). The red line indicates the significance level based on the α-criteria set at 0.05 (95% confidence level). If a bar crosses this line, the corresponding effect is deemed significant.
Main Effects Plot
Figure 6 presents the main effect plot, which shows the PEMWE cell performance response to changing levels of each of the design factor. A line with steeper slope depicts a larger main effect, and a flatter line represents a less significant factor. The horizontal reference line at the middle of the plot shows the grand mean (the calculated average of all the studied response). To calculate the main effects, the mean response at the low or first level of the factor is subtracted from the mean response at the high or second level of the factor. As can be seen from Figure 6, the anode water flow rate has the most significant impact on performance and indicate that a higher water flow rate improves PEMWE performance. At its high setting of 60 ml min–1, the cell performance improved by ca. 140 mV compared to its low setting of 15 ml min–1, showing the most significant shift in performance when the factor levels are altered. This is followed by the effect of the anode PTL, which showed an improvement of about ∼80 mV when an SP-PTL (16 μm mean pore diameter) was used compared to LP-PTL (60 μm MPD). The least individual effect on the performance was observed in the anode flow-field design, which showed an improvement of ∼30 mV in the parallel design compared to the serpentine design.
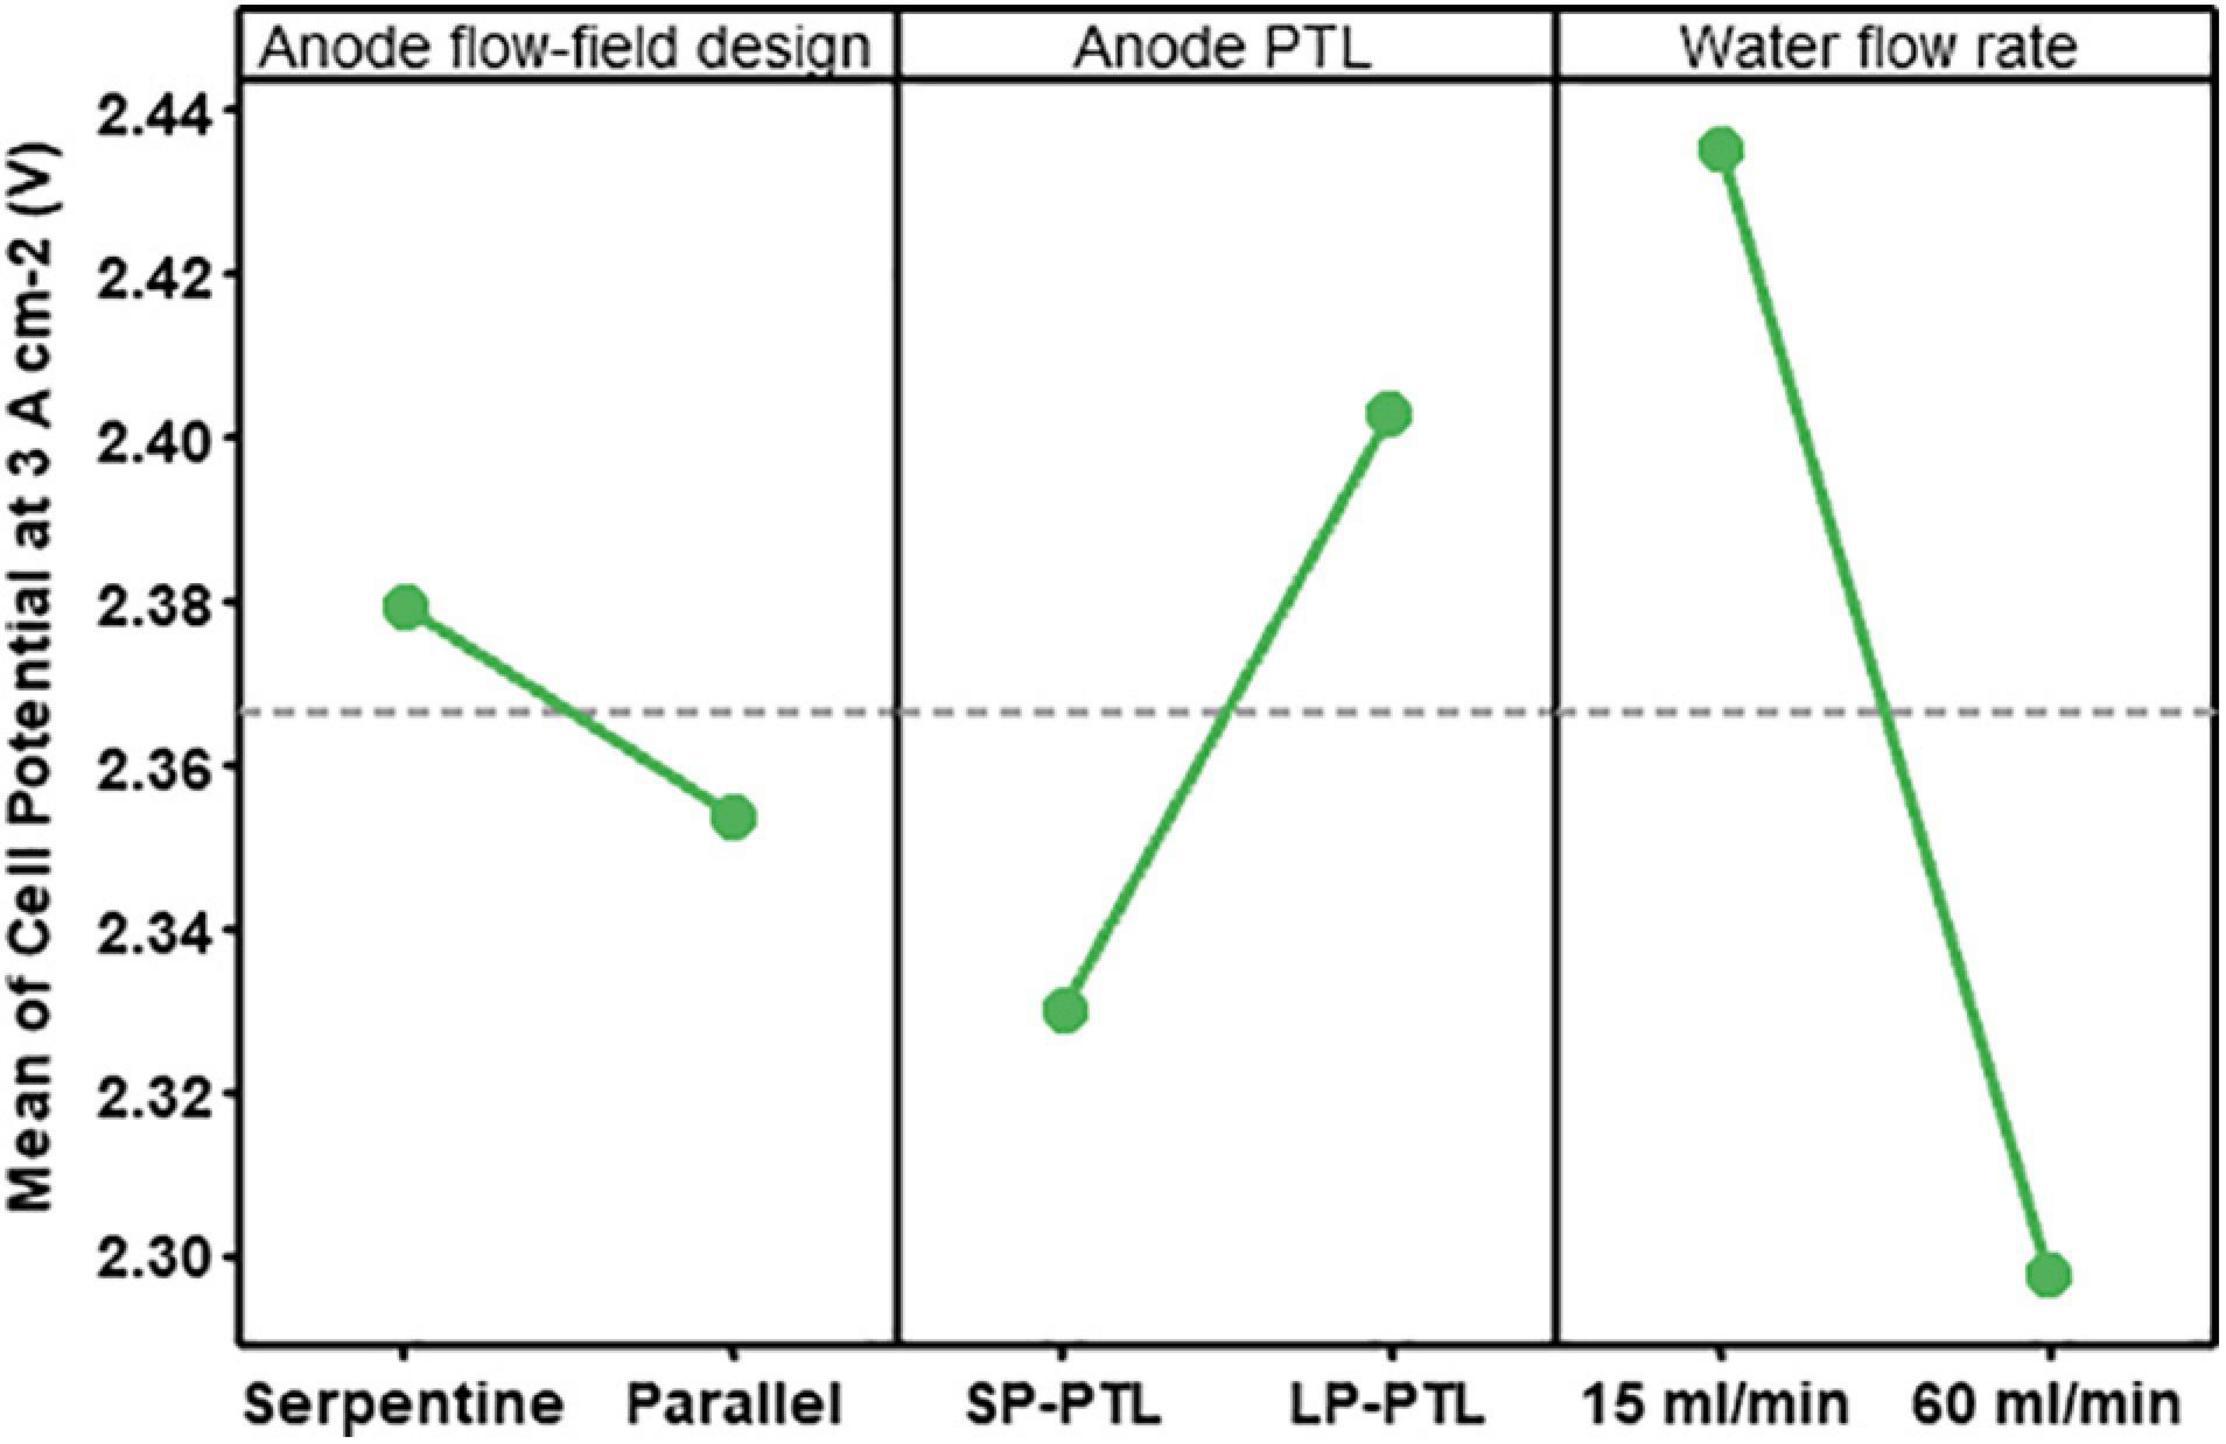
Figure 6. Effects of factor A (anode flow-field design, B (anode PTL), and C (water flow rate) on the cell performance at 80°C and ambient pressure.
These results are consistent with earlier studies in the literature, indicating that higher water flow rates ensure good reactant availability to the anode electrode and greater heat is supplied through the enthalpy of the higher flow stream. Also, from the two-phase flow perspective, slug length is shortened at higher flow, leading to reduced residence time; therefore, the mass transfer is enhanced, hence, better cell performance (Majasan et al., 2018). Further, the parallel flow-field design has been demonstrated to show better performance than the serpentine design in PEMWE applications, attributed to the longer flow path length in the serpentine design resulting in annular flow regime at a high current density which degrades cell performance. Also, smaller pore PTLs shows better overall performance attributed, for the most part, to better interfacial contact resistance and therefore, lower Ohmic losses.
Interaction Effects
Figure 7 shows the effect on the cell performance of varying one factor, keeping the second factor at its low and high level, and the third factor fixed (constant). These are called interaction plots because they show how the response (cell potential) is impacted by any two-factor combinations. In these plots, non-parallel lines indicate that the effect of one factor on the response (cell performance) depends on the setting of the other factor. The greater the lines depart from being parallel, the greater the strength of the interaction. In contrast, parallel lines indicate non-interaction (Jiju, 2014).
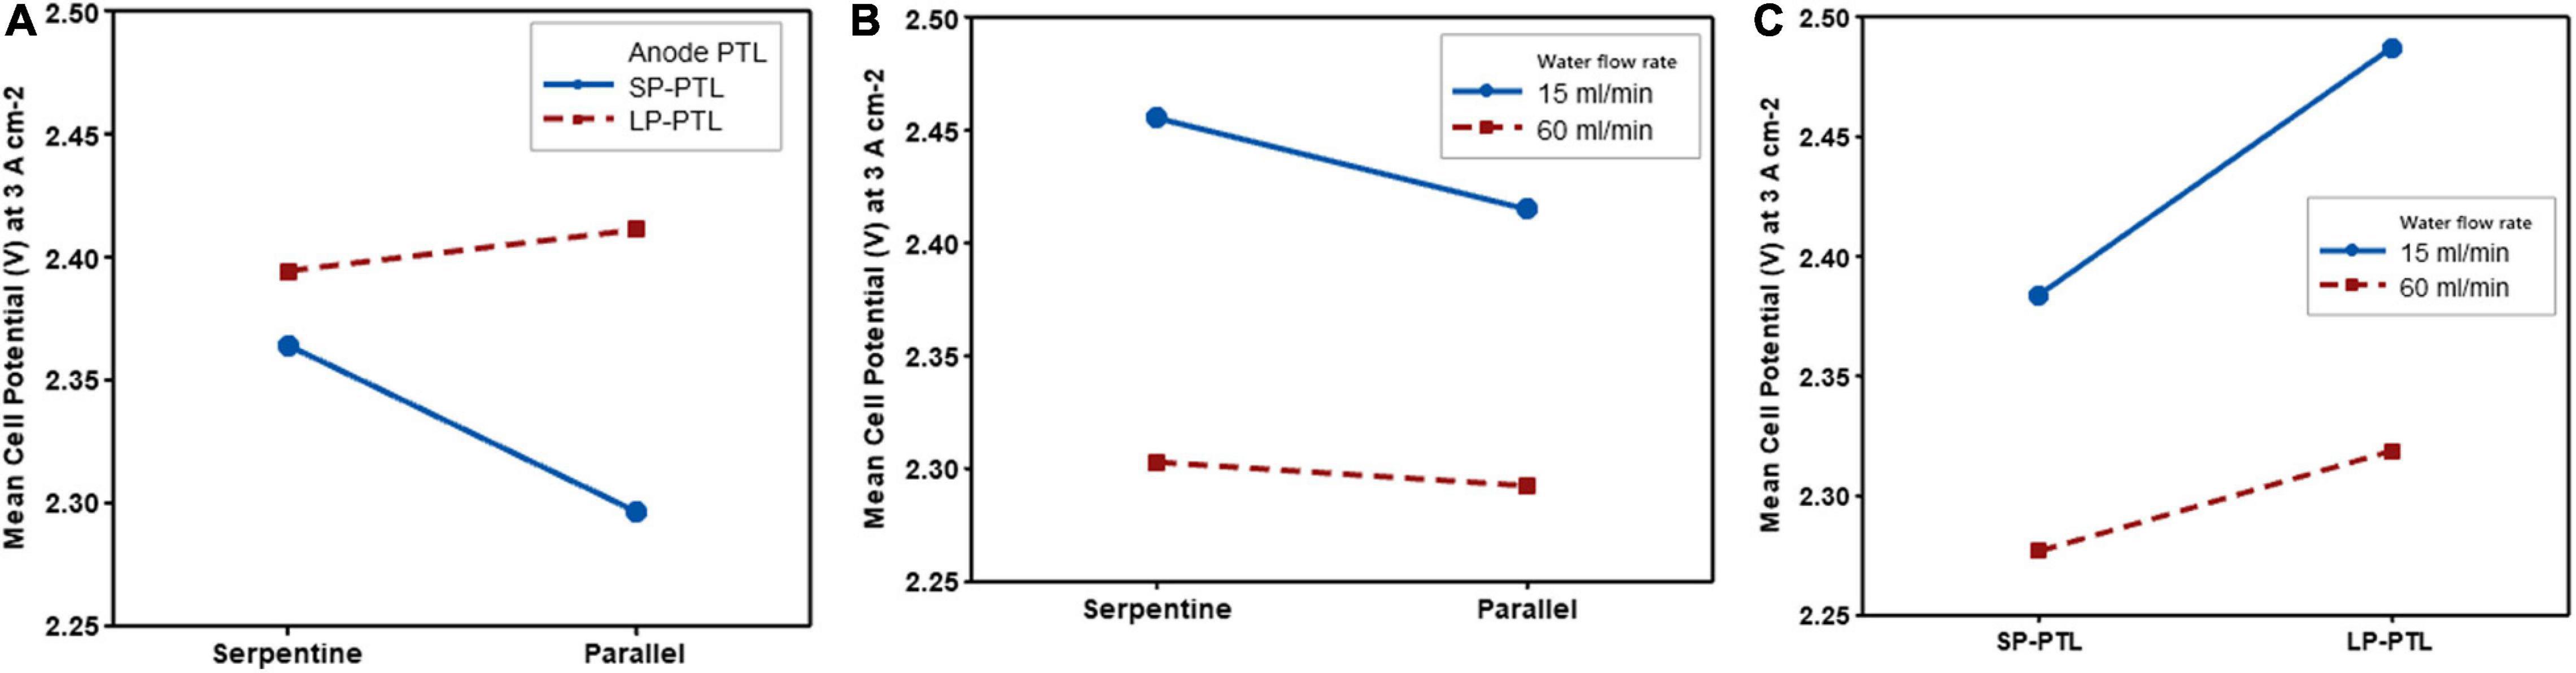
Figure 7. Interaction plots (anode flow-field design, anode PTL and water flow rate). (A) Interaction plot of anode PTL and anode flow-field design. (B) Interaction plot of water flow rate and anode flow-field design. (C) Interaction plot of water flow rate and anode PTL.
As shown in Figure 7A, the interaction of the anode flow-field and the anode PTL is evident, by the non-parallel lines, which signifies that the effect produced by the anode PTL is influenced by the type of flow-field used. The SP-PTL showed better cell performance with the parallel flow-field design, and conversely, the LP-PTL showed slightly better cell performance with the serpentine flow-field design. Overall, the cell performance is maximised (lowest cell potential) when the smaller pore PTL and parallel flow-field are combined.
From Figure 7B, it can be seen that there is an interaction between the anode flow-field and water flow rate, albeit weak, as the lines are almost parallel. This suggests that there is only a minor effect of the water flow rate for different anode flow-field design. However, the interaction plot indicates that the cell performance is maximised when a parallel flow-field design is combined with a high water flow rate.
Figure 7C illustrates the interaction plot between the water flow rate and anode PTL. The non-parallel lines indicate a strong interaction. As can be seen from the plot, the effect of anode PTL on cell performance is different at low and high levels of water flow rate. The cell performance is maximised at high water flow rate (60 ml min–1) in the small pore PTL. Conversely, the worst performance was observed at low water flow rate in the large pore PTL.
Regression Model
A regression model based on the statistically significant main effects and interactions is formed to predict the cell performance within the ranges of the factors selected. The estimated coefficients generated from the factorial analysis were used to obtain the predictive regression model of cell potential in coded variables given in Equation 2. In this model, a positive sign in front of the coefficient indicates an antagonistic effect and a negative sign indicates a synergistic effect on cell performance.
Figure 8 provides an analysis of the residuals, which allows examination of the goodness-of-fit of the regression model. In the Normal Probability plot (Figure 8A) the residuals are situated along the straight red normalisation line with minimal departures, indicating that the residuals are normally distributed, and the error is independent. The plot of residuals versus fitted values (Figure 8B) shows a random pattern of residuals on both sides of zero, with no dominance of either positive or negative residuals, indicating that the linear model provides a decent fit to the data. The histogram in Figure 8C suggests the possible presence of outliers (larger than average response or predictor values) due to the gap between the bars. In the residual versus order plot (Figure 8D) there is no apparent pattern in the data points, which implies that the variance is constant. Overall, the residual analysis, suggests that the model adequately describes the data and the ordinary least squares assumptions have been met.
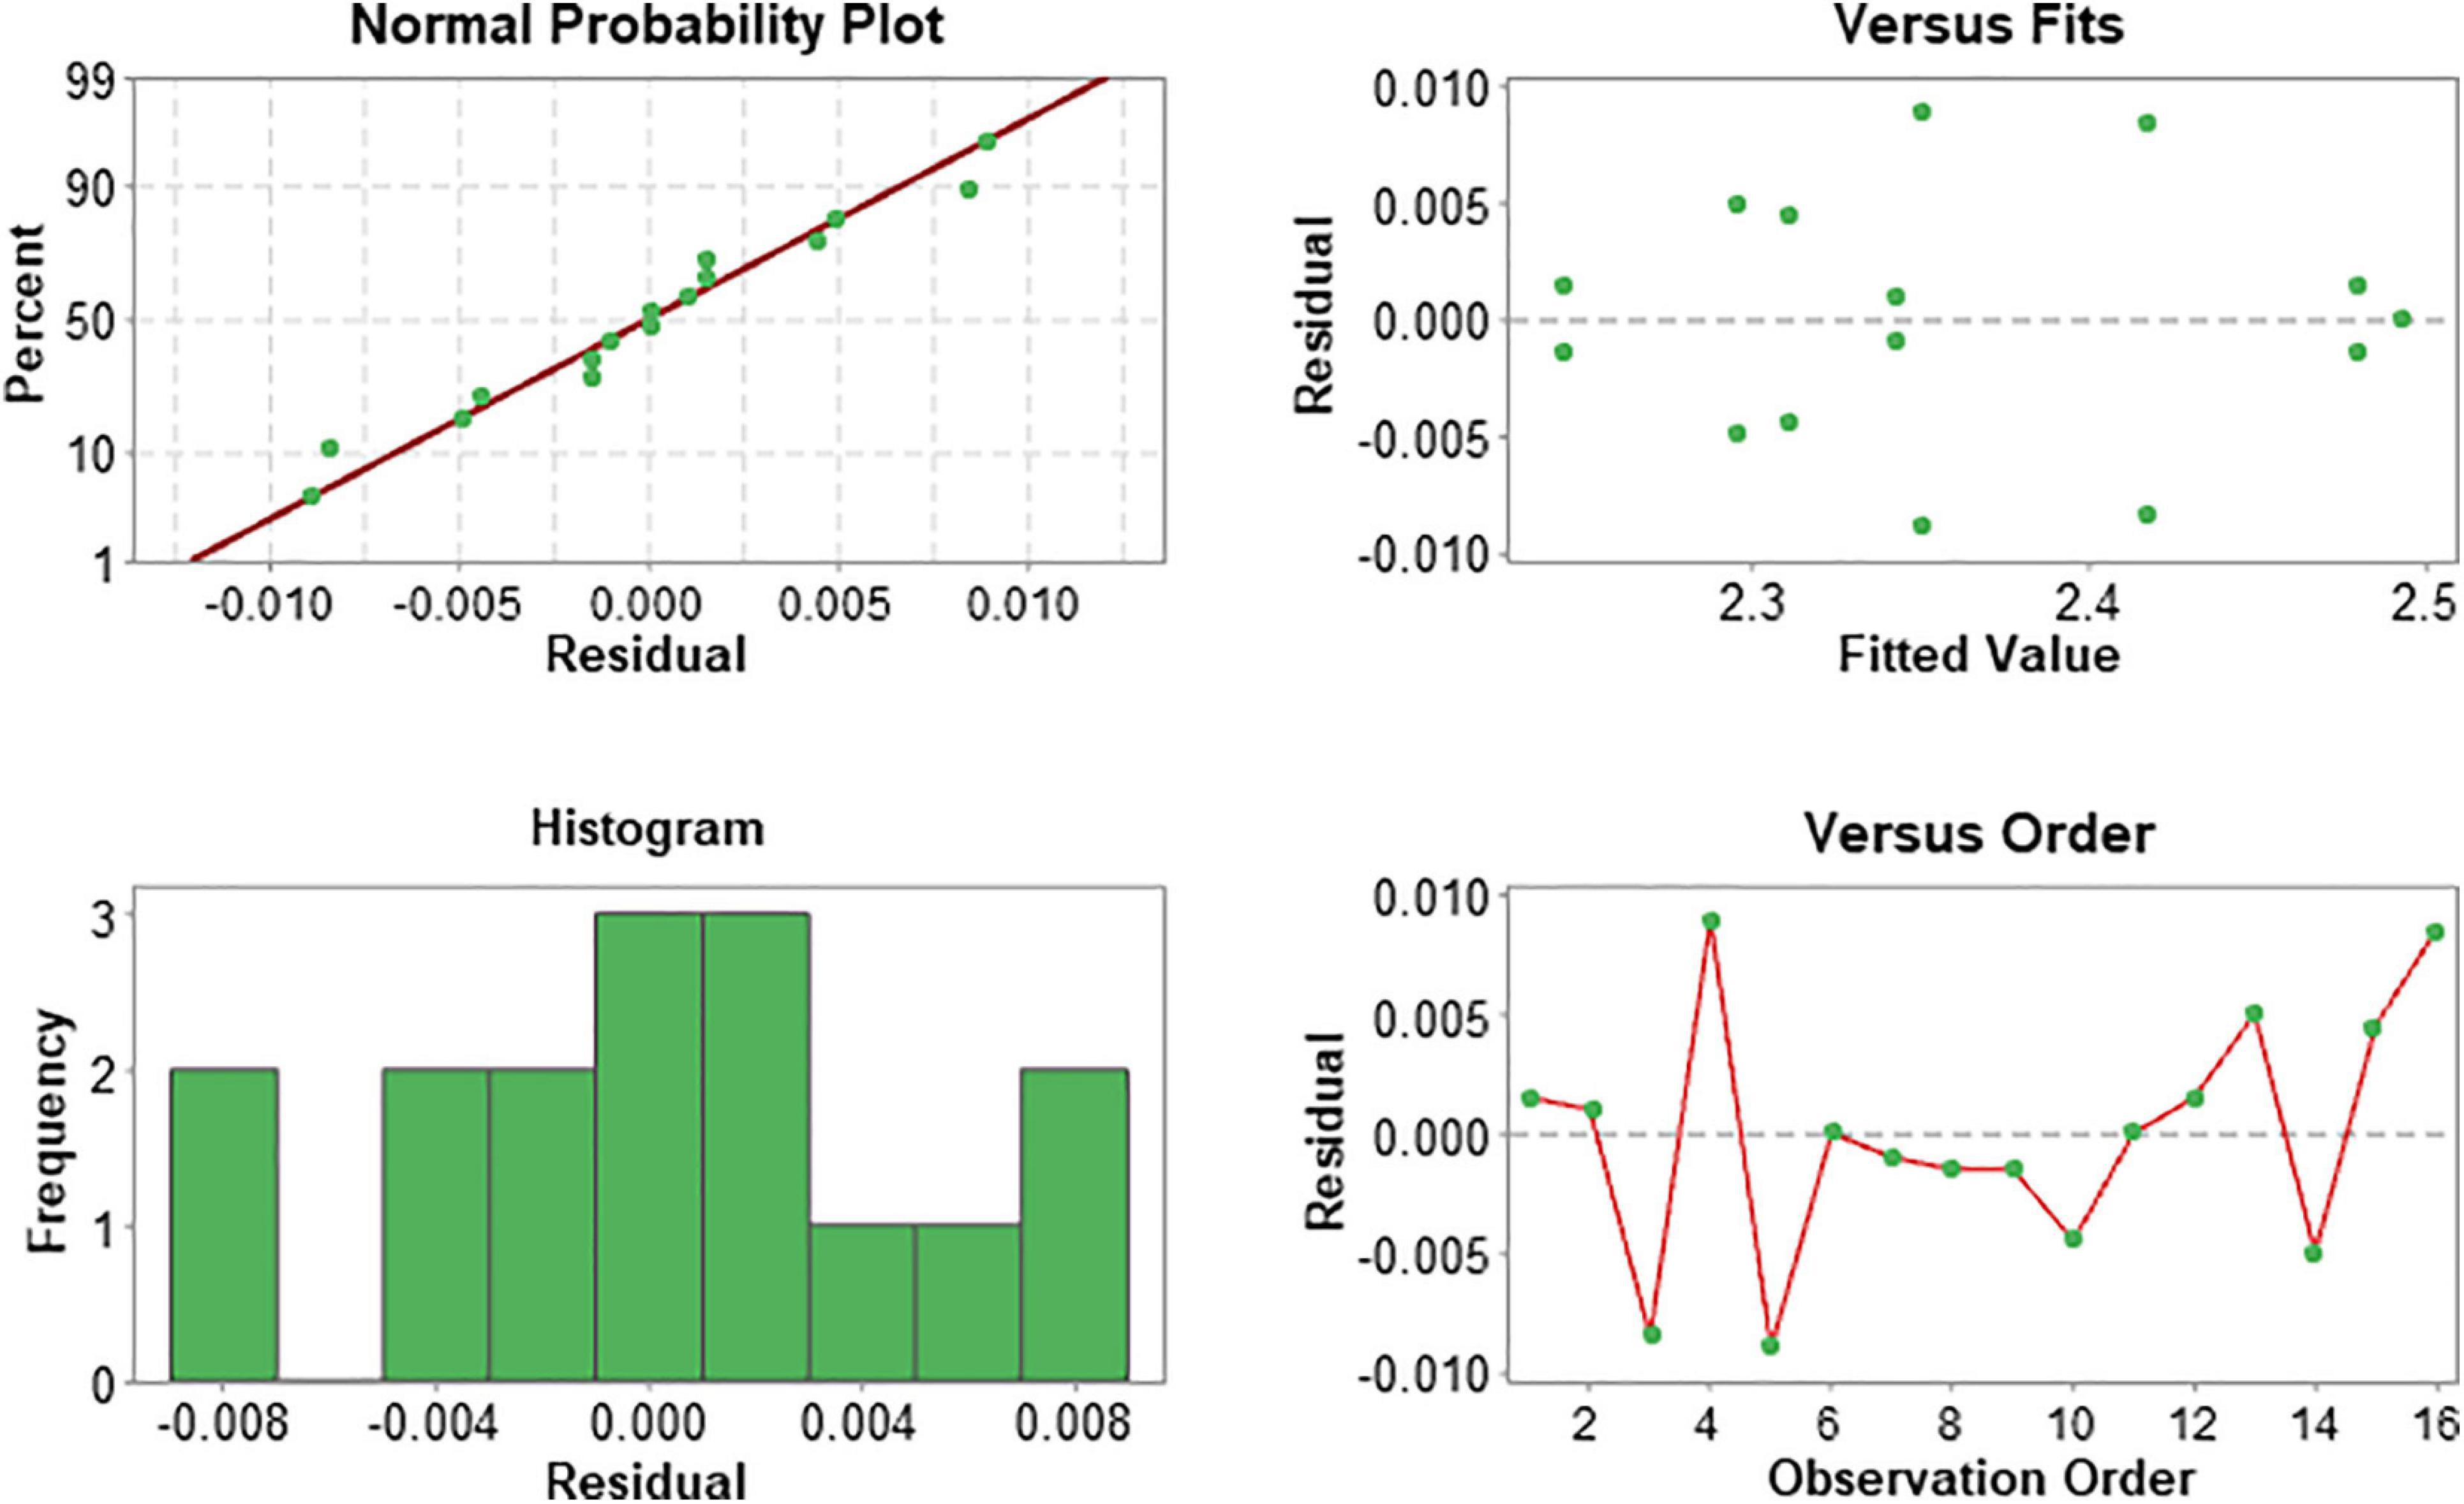
Figure 8. Upper left: Normal probability plot; upper right: residual-versus-fit plot; lower left: residual histogram; lower right: residual-versus-order plot. The graphs verify the random nature of the effects.
Conclusion
This study presents a full-factorial design of experiment (DoE) approach was applied to PEMWE performance based on mass transport factors. The main effects and interaction of operationally significant mass transport factors were investigated, and a regression model based on statistically significant factors was developed. Cell potential response at a current density of 3.0 A cm–2 are examined at two levels (high and low) of three factors namely, anode flow-field design, the anode PTL, and the water flow rate, to yield a two-level, three-factor (23) full factorial DoE. The main effects and two-factor interactions of each factor were examined to determine their effect on the cell voltage. Of the design and parameter considered, it was found that the combination of high water flow rate of 60 ml min–1, parallel flow-field design and small-pore PTL (16 μm mean pore diameter) yield the maximum PEMWE cell performance. It was demonstrated that the design of experiments methodology could be a useful tool for PEMWE characterisation.
Data Availability Statement
The original contributions presented in the study are included in the article/supplementary material, further inquiries can be directed to the corresponding author/s.
Author Contributions
JM: conceptualisation, methodology, formal analysis, investigation, and writing—original draft. JC: methodology, investigation, and writing. MM: formal analysis, investigation, writing—review, and editing. PS and DB: supervision, funding acquisition, and writing—review and editing. All authors contributed to the article and approved the submitted version.
Funding
The authors acknowledge the financial support of hydrogen and fuel cell research at the Electrochemical Innovation Lab (EIL) from the EPSRC through grants (EP/R023581/1; EP/P009050/1; EP/N032888/1; EP/M014371/1; EP/M009394; EP/L015749/1; and EP/K038656/1). JM acknowledges the support of Presidential Scholarship for Innovation and Development, Nigeria for funding his Ph.D. work.
Conflict of Interest
The authors declare that the research was conducted in the absence of any commercial or financial relationships that could be construed as a potential conflict of interest.
References
Babic, U., Suermann, M., Büchi, F. N., Gubler, L., and Schmidt, T. J. (2017). Critical review—identifying critical gaps for polymer electrolyte water electrolysis development. J. Electrochem. Soc. 164, F387–F399. doi: 10.1149/2.1441704jes
Barari, F., Morgan, R., and Barnard, P. (2014). A design of experiments (DOE) approach to optimise temperature measurement accuracy in Solid Oxide Fuel Cell (SOFC). J. Phys. Conf. Ser. 547:012004. doi: 10.1088/1742-6596/547/1/012004
Carmo, M., Fritz, D. L., Mergel, J., and Stolten, D. (2013). A comprehensive review on PEM water electrolysis. Int. J. Hydrog. Energy 38, 4901–4934. doi: 10.1016/j.ijhydene.2013.01.151
Dante, R. C., Escamilla, J. L., Madrigal, V., Theuss, T., De Dios Calderón, J., Solorza, O., et al. (2003). Fractional factorial design of experiments for PEM fuel cell performances improvement. Int. J. Hydrog. Energy 28, 343–348. doi: 10.1016/S0360-3199(02)00069-1
Dmitri, B., Wang, H., Hui, L., and Zhao, N. (eds) (2016). PEM Electrolysis for Hydrogen Production: Principles and Applications (1st ed.). Boca Raton, FL: CRC Press.
Flick, S., Schwager, M., McCarthy, E., and Mérida, W. (2014). Designed experiments to characterize PEMFC material properties and performance. Appl. Energy 129, 135–146. doi: 10.1016/j.apenergy.2014.05.009
Grigoriev, S. A., Millet, P., Volobuev, S. A., and Fateev, V. N. (2009). Optimization of porous current collectors for PEM water electrolysers. Int. J. Hydrog. Energy 34, 4968–4973. doi: 10.1016/j.ijhydene.2008.11.056
Hwang, C. M., Ishida, M., Ito, H., Maeda, T., Nakano, A., Hasegawa, Y., et al. (2011). Influence of properties of gas diffusion layers on the performance of polymer electrolyte-based unitized reversible fuel cells. Int. J. Hydrog. Energy 36, 1740–1753. doi: 10.1016/j.ijhydene.2010.10.091
Ito, H., Maeda, T., Nakano, A., Hasegawa, Y., Yokoi, N., Hwang, C. M., et al. (2010). Effect of flow regime of circulating water on a proton exchange membrane electrolyzer. Int. J. Hydrog. Energy 35, 9550–9560. doi: 10.1016/j.ijhydene.2010.06.103
Jiju, A. (2014). Design of Experiments for Engineers and Scientists: Second Edition. In Design of Experiments for Engineers and Scientists: Second Edition. Amsterdam: Elsevier.
Kahveci, E. E., and Taymaz, I. (2014). Experimental investigation on water and heat management in a PEM fuel cell using response surface methodology. Int. J. Hydrog. Energy 39, 10655–10663. doi: 10.1016/j.ijhydene.2014.04.195
Karthikeyan, P., Muthukumar, M., Shanmugam, S. V., Kumar, P. P., Murali, S., and Kumar, A. P. S. (2013). Optimization of operating and design parameters on proton exchange membrane fuel cell by using Taguchi method. Proc. Eng. 64, 409–418. doi: 10.1016/j.proeng.2013.09.114
Kaytakoǧlu, S., and Akyalçin, L. (2007). Optimization of parametric performance of a PEMFC. Int. J. Hydrog. Energy 32, 4418–4423. doi: 10.1016/j.ijhydene.2007.06.025
Lakshminarayanan, V., and Karthikeyan, P. (2016). Optimization of flow channel design and operating parameters on proton exchange membrane fuel cell using MATLAB. Periodica Polytechn. Chem. Eng. 60, 173–180. doi: 10.3311/PPch.8461
Li, H., Nakajima, H., Inada, A., and Ito, K. (2018). Effect of flow-field pattern and flow configuration on the performance of a polymer-electrolyte-membrane water electrolyzer at high temperature. Int. J. Hydrog. Energy 43, 8600–8610. doi: 10.1016/j.ijhydene.2018.02.171
Maier, M., Meyer, Q., Majasan, J., Tan, C., Dedigama, I., Robinson, J., et al. (2019). Operando flow regime diagnosis using acoustic emission in a polymer electrolyte membrane water electrolyser. J. Power Sourc. 424, 138–149. doi: 10.1016/j.jpowsour.2019.03.061
Majasan, J. O., Cho, J. I. S., Dedigama, I., Tsaoulidis, D., Shearing, P., and Brett, D. J. L. (2018). Two-phase flow behaviour and performance of polymer electrolyte membrane electrolysers: electrochemical and optical characterisation. Int. J. Hydrog. Energy 43, 15659–15672. doi: 10.1016/j.ijhydene.2018.07.003
Majasan, J. O., Iacoviello, F., Cho, J. I. S., Maier, M., Lu, X., Neville, T. P., et al. (2019). Correlative study of microstructure and performance for porous transport layers in polymer electrolyte membrane water electrolysers by X-ray computed tomography and electrochemical characterization. Int. J. Hydrog. Energy 44, 19519–19532. doi: 10.1016/j.ijhydene.2019.05.222
Medina, P., and Santarelli, M. (2010). Analysis of water transport in a high pressure PEM electrolyzer. Int. J. Hydrog. Energy 35, 5173–5186. doi: 10.1016/j.ijhydene.2010.02.130
Oliveira, L., Santos, J. C., Panzera, T. H., Freire, R. T. S., Vieira, L. M. G., and Scarpa, F. (2018). Evaluation of hybrid-short-coir-fibre-reinforced composites via full factorial design. Comp. Struct. 202, 313–323. doi: 10.1016/j.compstruct.2018.01.088
Palkar, R. R., and Shilapuram, V. (2015). Development of a model for the prediction of hydrodynamics of a liquid-solid circulating fluidized beds: a full factorial design approach. Powder Technol. 280, 103–112. doi: 10.1016/j.powtec.2015.04.045
Pessot, A., Turpin, C., Jaafar, A., Soyez, E., Rallières, O., Gager, G., et al. (2019). Contribution to the modelling of a low temperature PEM fuel cell in aeronautical conditions by design of experiments. Math. Comput. Simul. 158, 179–198. doi: 10.1016/j.matcom.2018.07.008
Rahim, Y., Janßen, H., and Lehnert, W. (2017). Characterizing membrane electrode assemblies for high temperature polymer electrolyte membrane fuel cells using design of experiments. Int. J. Hydrog. Energy 42, 1189–1202. doi: 10.1016/j.ijhydene.2016.10.040
Santarelli, M., Medina, P., and Calì, M. (2009). Fitting regression model and experimental validation for a high-pressure PEM electrolyzer. Int. J. Hydrog. Energy 34, 2519–2530. doi: 10.1016/j.ijhydene.2008.11.036
Schulze Lohoff, A., Kimiaie, N., and Blum, L. (2016). The application of design of experiments and response surface methodology to the characterization of a direct methanol fuel cell stack. Int. J. Hydrog. Energy 41, 12222–12230. doi: 10.1016/j.ijhydene.2016.05.248
Selamet, O. F., Pasaogullari, U., Spernjak, D., Hussey, D. S., Jacobson, D. L., and Mat, M. D. (2013). Two-phase flow in a proton exchange membrane electrolyzer visualized in situ by simultaneous neutron radiography and optical imaging. Int. J. Hydrog. Energy 38, 5823–5835. doi: 10.1016/j.ijhydene.2013.02.087
Suermann, M., Takanohashi, K., Lamibrac, A., Schmidt, T. J., and Büchi, F. N. (2017). Influence of operating conditions and material properties on the mass transport losses of polymer electrolyte water electrolysis. J. Electrochem. Soc. 164, F973–F980. doi: 10.1149/2.13517109jes
Toghyani, S., Afshari, E., Baniasadi, E., and Atyabi, S. A. (2018). Thermal and electrochemical analysis of different flow field patterns in a PEM electrolyzer. Electrochim. Acta 267, 234–245. doi: 10.1016/j.electacta.2018.02.078
Toghyani, S., Fakhradini, S., Afshari, E., Baniasadi, E., Abdollahzadeh Jamalabadi, M. Y., and Safdari Shadloo, M. (2019). Optimization of operating parameters of a polymer exchange membrane electrolyzer. Int. J. Hydrog. Energy 44, 6403–6414. doi: 10.1016/j.ijhydene.2019.01.186
Wu, C. F. J., and Hamada, M. (2000). Experiments: Planning, Analysis, and Parameter Design Optimization. New York, NY: John Wiley & Sons, Inc.
Keywords: polymer electrolyte membrane water electrolyser, two-phase flow, porous transport layer, pore-size, flow-field
Citation: Majasan JO, Cho JIS, Maier M, Shearing PR and Brett DJL (2021) Optimisation of Mass Transport Parameters in a Polymer Electrolyte Membrane Electrolyser Using Factorial Design-of-Experiment. Front. Energy Res. 9:643587. doi: 10.3389/fenrg.2021.643587
Received: 18 December 2020; Accepted: 16 March 2021;
Published: 16 April 2021.
Edited by:
Cesar Augusto Correia De Sequeira, University of Lisbon, PortugalReviewed by:
Tim Mays, University of Bath, United KingdomYanyan Sun, Technical University of Berlin, Germany
Copyright © 2021 Majasan, Cho, Maier, Shearing and Brett. This is an open-access article distributed under the terms of the Creative Commons Attribution License (CC BY). The use, distribution or reproduction in other forums is permitted, provided the original author(s) and the copyright owner(s) are credited and that the original publication in this journal is cited, in accordance with accepted academic practice. No use, distribution or reproduction is permitted which does not comply with these terms.
*Correspondence: Dan J. L. Brett, ZC5icmV0dEB1Y2wuYWMudWs=