 Xuqiang Duan
 Xu Zhao1
 Jianye Liu
94% of researchers rate our articles as excellent or good
Learn more about the work of our research integrity team to safeguard the quality of each article we publish.
Find out more
METHODS article
Front. Energy Res. , 30 March 2021
Sec. Sustainable Energy Systems
Volume 9 - 2021 | https://doi.org/10.3389/fenrg.2021.638437
This article is part of the Research Topic Application of Big Data, Deep Learning, Machine Learning, and Other Advanced Analytical Techniques in Environmental Economics and Policy View all 37 articles
Our research aims to analyze how the uncertainties and risks of the overseas oil & gas investment environment change over time and reveal the specific occurrence probabilities of risk on different levels. In the process of long-drawn overseas oil & gas investment that can last for 30 years or longer, it is difficult for investment decision-makers to grasp the occurrence probabilities and trends of some specific risks accurately and in a timely manner. The overseas risk assessment system has made great progress; however, it has remained elusive due to the challenge of too many complex and interweaved factors. With the advent of big data and artificial intelligence, more precise and specific risk evaluations can be conducted. Our research selects 25 indicators from six dimensions and applies a Cloud parameter Bayesian network algorithm to dynamically assess the oil and gas overseas investment risk of 10 countries. The results reveal how risk dynamics have changed over the past two decades. Our research may serve as a reference in future overseas oil & gas investment risk decision-making, and is also significant to outbound investing, engineering, and service projects. The proper use of risk assessment results can be conducive to potential investors who may invest in potential countries in the future.
As strategic resources are of paramount importance in the world today, oil & gas can directly affect economic development, political stability, and even the national security of a country. Although alternative energy has attracted increasing attention recently, both research institutions like EIA and giant oil companies like BP believe that alternative energy is unlikely to replace petroleum in the foreseeable future. For China, a developing country experiencing rapid economic growth, the growth of renewable and other non-fossil energies is insufficient in replacing the demand for coal. In the long-term, the use of oil and natural gas can reduce the use of coal (BP, 2020).
As of 2019, China's dependence on imported oil and natural gas has rapidly climbed to 72.6 and 42.1%, respectively. The security of the oil and gas supply is the most important issue for Chinese policy makers. Many scholars believe that overseas oil and gas investment is an important measure to improve the security of China's oil and gas supply (Duan et al., 2018). Through regression analysis of China's global investment tracking data and oil and gas import data, empirical tests have shown that overseas investments in oil and gas are conducive to improving China's oil and gas supply security (Zhao et al., 2020).
For overseas oil and gas investment projects, the most significant elements include a long life cycle, great uncertainty, high capital requirement, and irreversibility of the investments (Chapman and Ward, 2004). Due to the decade-long life cycles of such projects, they are exposed to a multitude of risk factors including the political environment of the resource countries (Bøe et al., 2019), economic conditions (Ma et al., 2020), cultural factors, religious factors (Weldegiorgis et al., 2017), as well as geological conditions (Asrilhant et al., 2007) and oil price risks (Chorn and Shokhor, 2006). Because of the intra relevance and complexity of risk management, the identification of risks is usually decided by managers and experts.
The risk analysis method was initially introduced to the petroleum industry by Kaufman in 1963 to facilitate the exploration and development of decision-making processes (Walls and Dyer, 1992). After Kaufman, studies of risk assessments for overseas oil and gas investments mainly focused on risk identification, risk impact analysis, and risk model construction (Huang et al., 2020). There are two main methods to analyze or measure the impact of risks: one is the statistical measurement method, based on historical data, and the other is the subjective probabilistic measurement method (Kumar and Gregory, 2013). A lot of research has been dedicated to building and improving project risk assessment models for the oil and gas industry. So far, a number of achievements have been put into practice (Xie et al., 2010). For example, after a series of studies of certain international oil and gas companies' management processes, Midttun et al. (2007) established a risk assessment model which introduced the real option method. However, the method has been used sparingly due to the difficulty of thoroughly and accurately quantifying uncertainty (Hsieh et al., 2019).
In the exploratory work of constructing risk assessment models, the bond between qualitative and quantitative methods is getting tighter and closer. Early studies on the risk assessment of emergencies were mainly focused on risk expectation, risk probability matrix, and the Borda value sequence method (Sachse et al., 2012). With the development of numerical methods and algorithms based on probability theory, analytical hierarchy processes (Kul et al., 2020), neural networks (Wang et al., 2013), cloud technologies (Ali et al., 2017), Bayesian networks (Huang et al., 2020), and knowledge elements (Duan et al., 2018) have been gradually applied in the risk assessment area. Driven by these methods, risk assessment systems have made great progress. However, each method has its limitations. Specifically, the analytics process is quite subjective and is greatly influenced by expert judgments. Neural network algorithms require a large scale of objective data at the starting point. Cloud theory's reasoning capability is low, therefore it is not suitable for complex and dynamic evaluation systems (Olusola et al., 2019). Further, the Bayesian network cannot function well when the node size is large.
To overcome the shortcoming of single approaches, hybrid risk assessment methods have been developed. Two examples follow here; in the assessment of CFPP investment risks of “One Belt, One Road” countries, a hybrid evaluation model (Yuan et al., 2019) has been built based on network process, entropy value, and the TODIM method. It was applied to rank the overall risk level of CFPP investment risks for the 23 “One Belt, One Road” countries. In assessing the renewable energy investment risks in countries along the “One Belt, One Road,” an ANP-cloud framework, which considers randomness, was constructed. The cloud model has been used to fully describe the randomness and fuzziness of information. The risk levels of 54 countries were tested under this framework. These hybrid methods have been applied in investment risk assessments in transportation, thermal power plants, non-ferrous metals, and renewable energy, but rarely in overseas oil and gas investments.
Cloud modeling is a powerful tool for uncertainty analysis in the field of big data and artificial intelligence. In the process of qualitative and quantitative conversion, it shows better expression ability for uncertain information. The Bayesian Network (BN) has outstanding abilities in expressing probability, handling uncertainty, and fusing multi-source information. These two models play important roles in the field of uncertain dynamic reasoning. Combining the two and applying the hybrid model into the dynamic assessment of environmental risks of overseas oil and gas investments has multiple advantages. Cloud modeling and BN are models capable of handling uncertainty. This fits well with the overseas oil and gas investment environment, which is often full of unexpected events and changes. Cloud modeling can effectively deal with randomness and fuzziness at the same time, resulting in more sophisticated and comprehensive consideration of risks. The BN has a flexible structure and can be applied to environmental assessment research in different countries.
There are three main contributions of this article. First, the index system of environmental risk assessment for overseas oil and gas investment was improved. Environmental constraints and state-related factors were added, enhancing the model's fit with the current status of overseas oil and gas investments. Second, a Cloud parameter Bayesian network has been constructed through the research. The new recommended model is capable of predicting the probability of high risks and evaluating specific risks within a time frame(s). Thus, the accuracy and dynamics of the risk assessment method are improved. Finally, this study contributes great practical importance. A comparative analysis was conducted of the overall evaluation of the investment environments of several oil and gas resource countries.
The following part of this article is organized into four sections. Section Methodology takes a closer look at the methods, the design of the index system, data sources, as well as the cloud parameter Bayesian network model we have built. Section Results presents the results drawn from running the model and conducting a simulation analysis of emergency events. Section Conclusion and Policy Implication provides the conclusions and policy recommendations.
In the field of investment risk assessment, the Analytic Hierarchy Process (AHP), Fuzzy Comprehensive Evaluation (FCE), Regression Approach, Time Series Method, Gray System Method, Neural Network Method, and other methods are extensively used. However, these methods have their limitations. AHP and FCE face difficulties in reflecting the objective state of things due to their subjectivity, since investors are likely to have different subjective probability assessments of the same project-specific uncertainty (Minli and Wenpo, 2012; Yuan et al., 2019). The Regression Approach strictly requires sample data and lacks the ability to analyze uncertainties. The Time Series Method and Gray System Method are mainly aimed at the prediction of the trend of the data series itself, without considering the internal influencing factors of the predicted object and the relationship between various factors, so they are not suitable for the prediction of the risk of international investment (Ke et al., 2012). As a machine learning method developed in recent years, the neural network method is of great value in solving complex non-linear problems (Wang et al., 2013). It automatically extracts reasonable rules by learning a large number of samples and has high learning and prediction ability. However, too many uncertainties in international investment will lead to training failure or over-fitting of the neural network model (Chandrinos et al., 2018). Overfitting refers to the uncertainty of international investment risk being analyzed as deterministic regularity by the neural network model, which reduces the prediction accuracy of the neural network model. Risk analysis often involves fuzzy and inconsistent decision information, which may be caused by a variety of reasons (Gómez-Fuster and Jiménez, 2020). However, determinism-based analysis methods often regard such uncertainties simply as the noise or error of the system, thus neglecting the important decision information that may be contained therein (Sobczyk et al., 2017).
As an intelligent data mining and knowledge discovery method, the Bayesian network's intelligent reasoning ability plays an important role in dealing with such uncertain and inconsistent information, and has widely been used in disease prediction and diagnosis, fault diagnosis, risk assessment, and prediction (Yan et al., 2008). The construction of the Bayesian network model mostly depends on expert knowledge, which is bound to be unconvincing and extraordinarily complex. If a Bayesian network with binary nodes have n parent nodes, there are 2nd table entries of the node in the CPT table, that is, the number of table entries grow exponentially with the number of parent nodes. Over-complex Bayesian networks will lead to problems of computational complexity and overfitting. Most scholars use the Noisy-OR gate model to solve this problem, but this method is limited to the case of binary node state, which has great limitations (Feng et al., 2020).
Wang was the first to combine the membership cloud with the Bayesian network to generate the conditional probability table of the Bayesian network with less expert workload (Wei, 2016). This model can be constructed with multi-valued nodes. Experimental results show that the statistical properties of the Bayesian network parameters generated by this method are basically consistent with the proportion of nodes given by experts, and it can effectively replace the work of experts.
When dealing with complex problems of uncertainties, the Bayesian Network (BN) uses the description of associations between system variables to replace the joint probability distribution, thus the amount of information in the system description is reduced. At the same time, because of the conditional independence between variables, the computational complexity of learning and reasoning has effectively been reduced.
Therefore, the Bayesian network has been widely used in pattern recognition, data mining, computational intelligence, and other fields. For a Bayesian network of a given structure, its Conditional Probability Table (CPT) can be constructed based on an expert knowledge method or data parameter learning method. Since different experts often provide different opinions based on their own professional judgments, the artificial subjective factors are key reasons in reducing the accuracy of networking reasoning in the expert knowledge method. The data parameter learning method helps the CPT fit the actual situation well. However, when a continuous node is the parent of the discrete node in the Bayesian network, problems such as difficulty in determining conditional probability and excessive construction workload may occur, resulting in modeling inefficiency.
Cloud modeling is a powerful tool for uncertainty analysis in the field of big data and artificial intelligence. The model functions well in conversing between qualitative information and quantitative data. Based on the reasoning ability of the Bayesian network and the knowledge expression ability of cloud theory, it is effective to combine the Bayesian network with cloud modeling theory (Jin et al., 2011). This paper adopts the Bayesian network parameter construction method, based on the cloud membership degree, to evaluate the risk of overseas oil and gas investments. The research aims to fully utilize the advantages of the two theories to provide scientific reference for decision-making and planning of overseas oil and gas investments.
The Bayesian network was initiated by Pro. According to the conditional independence between variables, the chain rule of joint probability solution is simplified and presented in the form of a directed acyclic graph (DAG). The Bayesian network can be represented by a binary group <G, P>. G represents a directed acyclic graph (DAG), which is composed of a random variable node V and an edge E showing the dependence between variables. P represents the conditional probability table of the dependence between the random variable node and its parent node. Given a set of random variables V, the Bayesian network is a joint conditional probability distribution on V, and its joint probability can be expressed as:
Where Pa (vi) represents all parent nodes of vi.
Elements in the universe of discourse x = {X} can map X to another ordered universe of discourse X' according to some rule F. In X', there is one and only one x' corresponding to x, then X' is the basic variable, and the distribution of membership degree in X' is called membership cloud, and x is called a cloud drop.
The cloud model can be represented by three eigenvalues: Expectation (Ex), Entropy (En), and Hyper Entropy (He).
Expectation (Ex) refers to the expectation of the spatial distribution of cloud drops. Ex is the most typical sample of concept quantification. Entropy (En) refers to the blur length of qualitative concepts in the cloud model. En reflects the range of qualitative concepts. Hyper entropy (He) refers to the uncertainty measurement of En. He is the En of En, which reflects the dispersion degree of cloud drops. The higher En is, the more discrete the distribution of cloud drops is.
The forward membership cloud generator (MCG) maps qualitative concepts to quantitative denotations, that is, the concrete realization of cloud drops generated by three eigenvalues of the cloud. The backward membership cloud generator (MCG−1) maps quantitative denotations to the qualitative concept, which is shown in Figure 1.
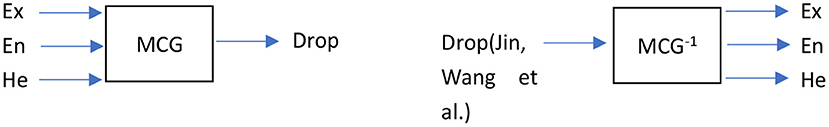
Figure 1. Forward and backward membership cloud generator (MCG &MCG−1).
Cloud theory is superior to the Bayesian network in knowledge representation, while the Bayesian network is superior to cloud theory in inferential capability (Jian et al., 2009). The cloud parameter Bayesian network proposed by Wang Wei combines the knowledge expression ability of the cloud and the reasoning ability of the Bayesian network. This model integrates the membership cloud model into the node parameters of the Bayesian network, transforming the cloud model into a CPT table of single a Bayesian network node. This integration greatly reduces the workload of experts in designing CPT tables and improves the design efficiency of the Bayesian network. The CPT generation process is as shown in Figure 2.
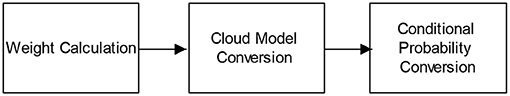
Figure 2. The CPT generation process.
1) Weight calculation
Weights include parent node weight, state weight, state impact factor, and state combination weight. The final result of weight calculation is the state combination weight, which is the basis of constructing the cloud cluster and generating CPT.
The parent node weight (WA) represents the influence of a single parent on a child node. State weight (Asrilhant et al., 2007) represents the degree of influence of the state changes of the parent node on the child nodes, and each state is divided into a corresponding set of state weights. Both WA and WS are constructed by expert knowledge and are inputs to the entire parameter generation model.
State impact factor (WAS) is the product of the weight of the parent node and its weight of each state. WAS represents how each state of a single parent node influences the child nodes. We set the weight of the i-th parent node as WAi and it has S states; represents the state weight of state I, the influence factor of each state of the parent node is: . State combination weight (WCS) represents the influence of state combination of all parent nodes on child nodes, and the sum of WAS of each node state under this state combination. For example, node B has n parent nodes; the state impact factor of these parent nodes of state y is represented as:
2) Cloud model conversion
The cloud model conversion discussed in this paper refers to the definition of a cloud cluster in the universe of discourse of state combination weights, and the design of a group of cloud generators according to the definition of a cloud cluster. A universal normal cloud model is adopted in this paper, since the first and last states of the nodes are monotonous, the states at both ends use the semi-cloud model. To be more specific, the first state uses the semi-falling cloud model, the last state uses the half-rising cloud model, and the intermediate state uses the standard cloud model. The Fibonacci method is generally used to construct the eigenvalues of the cloud. The rationale is that the closer to the center of universe of discourse, the lower the En and He of the cloud will be.
3) Conditional probability conversion
Conditional probability conversion is substituting the state combination weight of the parent node into the cloud generator to obtain a cloud drop, namely, the determination degree of the node under this state combination weight. Then, the determination degree of each state is normalized to obtain a table item of the CPT table. Repeating the above steps to calculate all the table entries, the entire CPT table is established.
The main algorithm steps are summarized as follows:
Let the state combination weight of the i-th parent node X of the desired node be WCSi, WCS = {WCSi|i ∈ N, 0 < i ≤ s}, s is the number of parent node state combinations. The eigenvalues of the cloud generator corresponding to the j-th state of X are Hej, Enj, and Exj, respectively.
Where M represents the state number of node X.
The CPT table is generated as follows:
a. Iterate over each value of WCS
b. Iterate over the state space of node X, let the eigenvalues of the J-th state cloud generator be Hej, Enj and Ex j
c. Generate a normal random number with the expected value Enj and the standard deviation Hej
d. Calculate the certainty degree of WCSi,
e. Output a drop with degree of certainty, drop (WCS i,μ)
f. Iterate over all states of X, normalize all cloud drops of the X state space, and save the normalized result to the CPT as one of the entries.
g. Iterate over WCS
h. Output CPT.
The cloud parameter Bayesian network is constructed and the inference operation is conducted according to the collected evidence. The only difference between the CPBN and BN is the CPT table construction process. Therefore, CPBN can use the BN's reasoning algorithm (such as elimination variable algorithm, clique tree reasoning algorithm, MCMC algorithm, etc.) to carry out probabilistic reasoning, to obtain the posterior probability of query variables, and to complete the final risk assessment.
Clique tree is an accurate BN inference algorithm. It can use the messaging mechanism to achieve convergence. The clique tree inference algorithm first transforms the Bayesian network into a quadratic structure and obtains the accurate result of the Bayesian network inference through the quadratic structure. SS=(CT, PP), clique tree (CT)=(C,S), where C is the cluster of the Bayesian network, S is the edge set in CT, probability potential (Chen et al., 2019) can be calculated from the probability distributions of the variables in each clique.
We use Netica, a Bayesian network analysis software which is widely used worldwide, to incorporate the Bayesian network into the node tree, to perform rapid probabilistic inference and to obtain the risk assessment result.
There are many rating institutions that provide professional ratings and analyses of macro investment risks worldwide (Table 1). Among them, six institutions study the overall comprehensive risks of countries, eight institutions focus on the risks of national debts, and the others focus their attention on countries' economic freedom, transparency index, global connectivity index, corruption index, and confidence index. Each of these institutions has their different rating objectives and classification methods. In addition, their index composition and emphasis are quite different (Table 2).
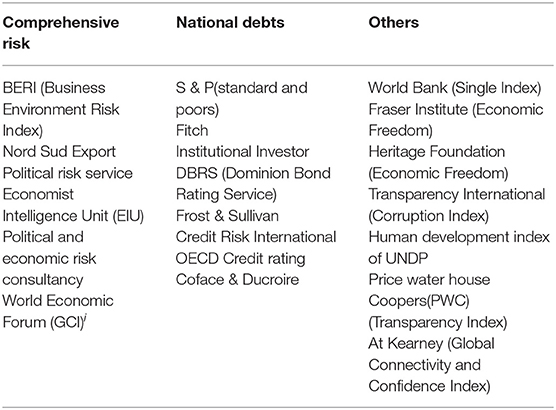
Table 1. Agencies studies macro investment risks.
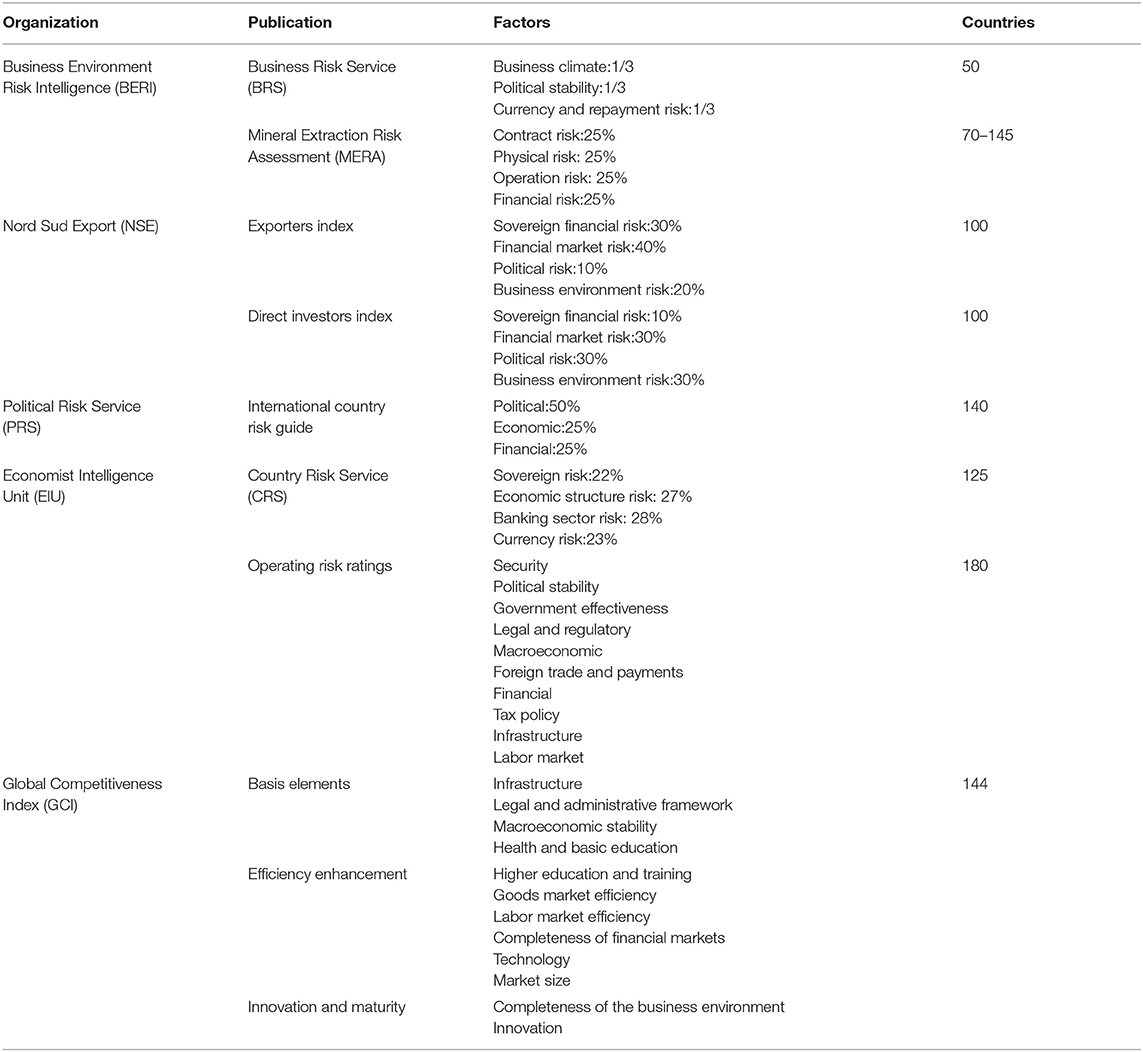
Table 2. Institutions that study the overall risk of countries and their index.
The risks faced by overseas oil and gas investments are aligned with the overall comprehensive risks of resource countries. However, BERI is the only institution, among the six institutions which study the overall risk of countries, that specifically considers the characteristics of the oil and gas industry when it provides the Mineral Extraction Risk Assessment (MERA) for the mining industry. MERA integrates the following risks into its analysis: contract risk, personnel and equipment damage risk, nationalization risk, and expropriation risk of oil and gas assets. However, the most important risk for oil and gas investments, the resource risk, has not been considered.
Overseas oil and gas investment projects face many risk factors due to their long time horizons. This research divided the risk factors affecting overseas oil and gas investments into six dimensions based on the principles of the importance of indicators, the accessibility of the basic data, and the feasibility of the evaluation process. The six dimensions are the resource risk, the market risk, the political risk, the economic risk, the investment environment risk, and the bilateral relations between countries. Twenty-five layers were selected under these six dimensions. As shown in Table 3, the research established a risk evaluation index system for overseas oil and gas investments.
Table 3. Oil and Gas Overseas Investment Environment Assessment Indicators (OGOIEAI).
(1) Resource Risk
Resource risk refers to the uncertainty of the reserves of oil and gas investment projects. The reserves, which can also be referred to as the resource condition, are the basis for investment decisions. The uncertainty is highly related to the investment stage. In early stages of exploration, due to an insufficient understanding of underground resources, large errors and high risks are inevitable in the prediction of proved reserves.
With an accumulated understanding through exploration, the uncertainty of reserves, as well as risk, decreases. Resource risks can be expressed as the impact of the uncertainty of the estimated proved resource quantity on economic benefits. Countries with abundant resources and great potential have high investment value (Wang et al., 2020).
(2) Market Risk
Market risk refers to the risk arising from market changes during the course of project operation. These changes affect the decision making through the entire life cycle of the oil and gas investment project. Market risk is an objective risk. Market risk encompasses many elements and factors. Generally speaking, the fluctuations of oil prices and exchange rates in resource countries are the most significant factors determining a project's profitability (Wu et al., 2019, 2020). Therefore, oil price risk and exchange rate risk were selected as market risk indicators.
(3) Political Risk
Due to the long life cycle of overseas oil and gas investment projects, the political situation, policies, and laws of resource countries are quite likely to change. The instability of national policies and the legal environment may affect the normal operation of a project, generating great risks.
Government efficiency reflects a local governments' capability and willingness to provide services and facilitates to foreign investors (Duan et al., 2018). Democratic accountability and regulatory quality reflect the extent of a government's corruption. If government officials cannot handle things fairly and impartially, foreign companies will find it difficult to conduct business with the local community, and thus have higher probability to suffer a loss.
(4) Economic Risk
A sound economic foundation of resource countries is essential to ensure the safety and return of overseas oil and gas investments. The GDP growth rate can reflect the economic environment for a country's long-term investment. The inflation rate has high impacts on the operating cost of enterprises, and the exchange rate can also cause uncertainty with respect to project financing costs.
(5) Investment Environment Risk
To evaluate the investment environment, this paper not only considers various obstacles in the process of contract execution, but also the compulsory requirements on registered assets by the resource countries (Olusola et al., 2019). In addition, the trend of tighter and higher environmental constraints in resource countries should be integrated into the consideration. Although oil and gas investments are warmly welcomed to promote local economic development, the waste discharge in the process of resource development has a long-lasting negative impact on the local environment. More and more environmental concerns have been raised and transformed into operating costs. In other words, the concerns shake the investment profitability and decision-making process. This paper selects the following indicators for investment environment risk: Cost of business start-up procedures (% of GNI per capita), Net inflows of foreign direct investment (% of GDP), Environmental sustainability policy and institutional ratings, Forest area (% of land area), Renewable electricity output (% of total), and Co2 emissions (kg /PPP $GDP).
(6) Bilateral Relations between Countries
The success of Chinese companies' overseas investments can be largely influenced by the strength of diplomatic relationships and trade tightness. Therefore, bilateral relations should be incorporated into the index system. This paper selects the following indicators for bilateral relation risk: bilateral trade volume, exports to China /GDP, and imports from China/economic and trade cooperation with China.
The geographically uneven distribution of oil and gas resources and the mismatch between supply and demand stirs up overseas oil and gas investment (Tan and Barton, 2017). China has invested and operated over 100 oil & gas projects worldwide. According to investment scale and potential, we chose 10 representative countries for our research objects. They are Brazil and Ecuador in South America, Chad and South Sudan in Africa, Iraq and the United Arab Emirates in the Middle East, Kazakhstan and Turkmenistan in Central Asia, Indonesia in Southeast Asia, and Russia. Data sources of relevant indicators are shown in Table 3, to facilitate the construction of CPBN, we abbreviate all the indicators due to the maximum character of node name in Netica is 30.
The CPBN is established based on the logical level between the factors of oil & gas overseas investment environment assessment indicators, as shown in Figure 3.
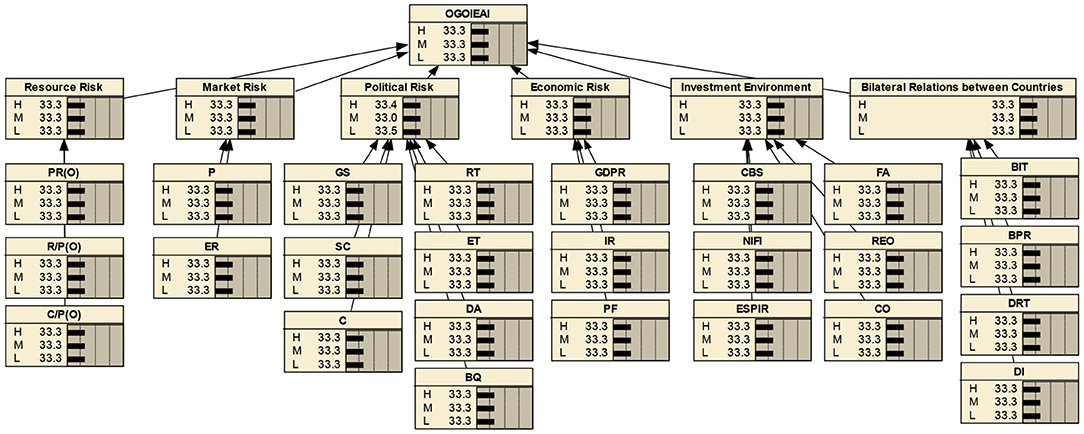
Figure 3. CPBN of oil and gas overseas investment environment risk.
We input the probability distribution of the two-layer root nodes and the CPT of the sub-nodes into Netica. The number of CPT table entries is exponential with parent nodes and the workload of the CPT table explodes when parent nodes increase. With 200 BN results of cloud parameters, we comprehensively evaluate the investment environment of 10 typical oil & gas resource countries from 2000 to 2019 and determine the degree of subordination of overseas investment risk as low (L), moderate (M), and high (H). Due to limited space, we present the cloud parameter BN inference visualization result of Brazil's oil & gas investment assessment in 2019, as shown in Figure 4.
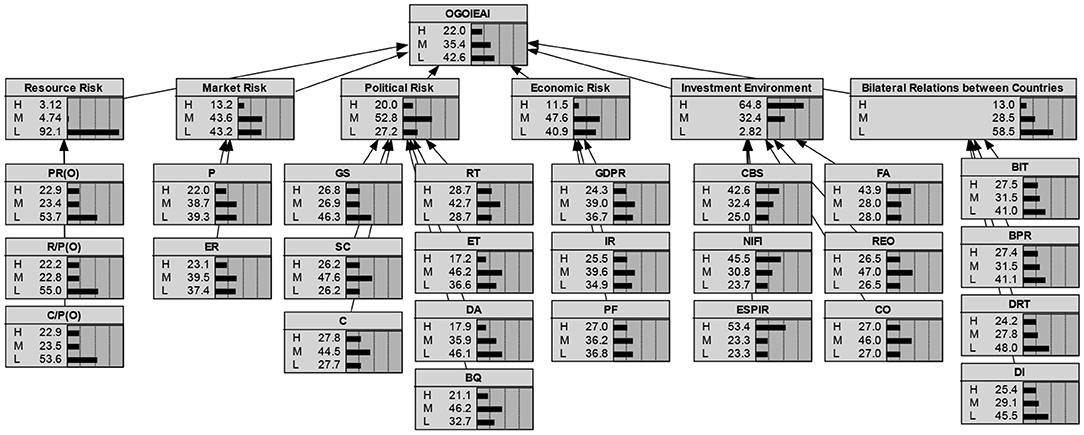
Figure 4. Oil and gas investment risk assessment of Brazil in 2019.
A silent transforming investment environment in Brazil can be visually observed in the form of a graph, as shown in Figure 5.
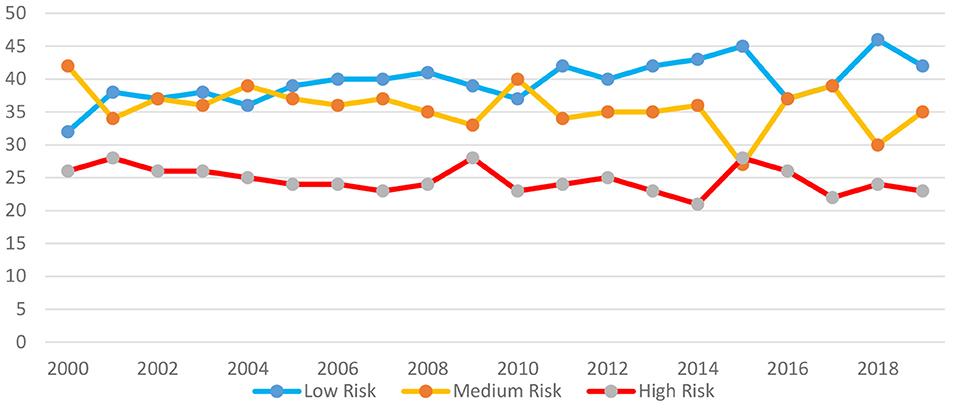
Figure 5. Oil &gas investment environment risk in Brazil from 2000 to 2019.
The Netica results show that the risk of investment in Brazil's oil & gas industry over the years exhibits a downward trend from being a moderate risk to being a low risk. The investment risk (low risk, medium risk, high risk) has changed from 32, 42, and 26 to 42, 35, and 23 which is the result of the relatively good investment environment in Brazil.
Since 2015, there have been some fluctuations in the investment environment in Brazil due to the country's favorable resource prospects and investment incentive policies, the probability of high risks is gradually decreasing, as it turns out. China won the Ribella field in a consortium bid with Total and Shell in 2013. The Ribella field, located in the Santos basin in 2,000 meters of water south-east of Rio de Janeiro, is estimated to hold 12 billion barrels of oil reserves, making it the world's largest offshore field. In 2019, China won Buzios and Aram field, and in the foreseeable future, Chinese oil companies will invest billions in funds for exploration and development in Brazil. Thus, Chinese companies need to be more cautious because of recent evolving uncertainties in in Brazil.
With Netica, we obtain the specific values of the risk assessment for various dimensions and illustrate the following representative sub dimensions.
The result of resource risk assessment is shown in Figure 6. The oil resource risk in Brazil has always been low. This risk trend chart exhibited a downward trend from 2001 to 2014, which increased in 2015 and has been relatively stable with a slight decline since then, and the probability of low risk remains above 70%. This situation is mainly affected by the growth of oil storage and exploitation in recent years.
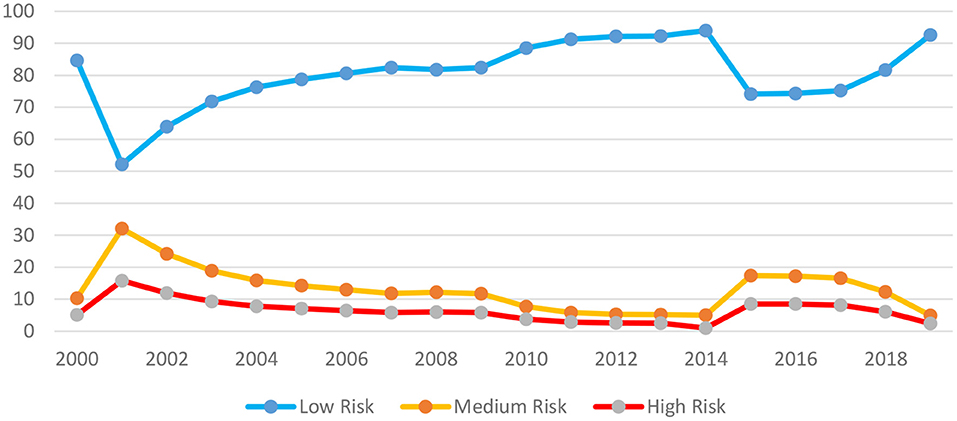
Figure 6. Resource risk in Brazil from 2000 to 2019.
From a macro point of view, the oil and gas market in Brazil is a magnet for foreign investment. Brazil's oil & gas exploration and development started from onshore resources, developed into a shallow continental shelf, and completed the historical leap by developing deep water pre-salt oil & gas. Since Brazil opened its oil and gas market to FDI in 1997, the market has been booming thanks to the influx of international companies. However, compared to the 60,000 wells in neighboring Argentina and four million wells in the US, only 30,000 wells have been drilled in Brazil. The oil exploration market is still in its infancy.
The result of political risk assessment is shown in Figure 7. The political situation in Brazil showed a clear process of gradual deterioration from 2007 to 2012 and then a gradual recovery since 2012. Brazil has built a representative democratic political system. Since 2015 Brazil has been suffering a series of political upheavals. Brazil has maintained smooth relations with China in the past couple of years. There is good development momentum in bilateral relations and trade.
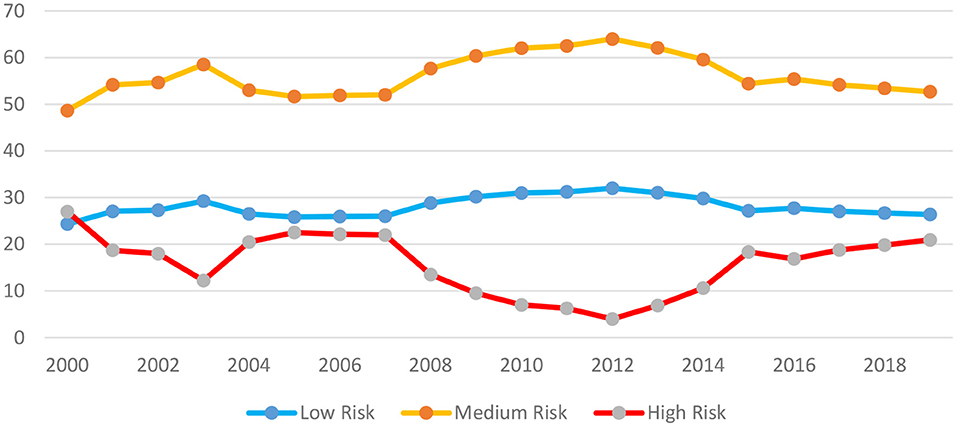
Figure 7. Political risk in Brazil from 2000 to 2019.
The result of economic risk assessment is shown in Figure 8, which shows a dramatic picture. In recent years, Brazil has been suffering an economic downturn, currency depreciation, and fiscal and inflation pressures. Consecutive quarters of negative economic growth in 2015 and 2016 compelled the government to implement a series of adjustment measures with a focus on restoring fiscal balance. The economy remained stable in 2017 and 2018, with a real GDP growth of 1.1%. However, due to the impact of the international economic environment, the economy declined in 2019. Brazil will actively attract foreign capital and expand foreign trade, but the probability fluctuations of the risk level are more volatile in the near future.
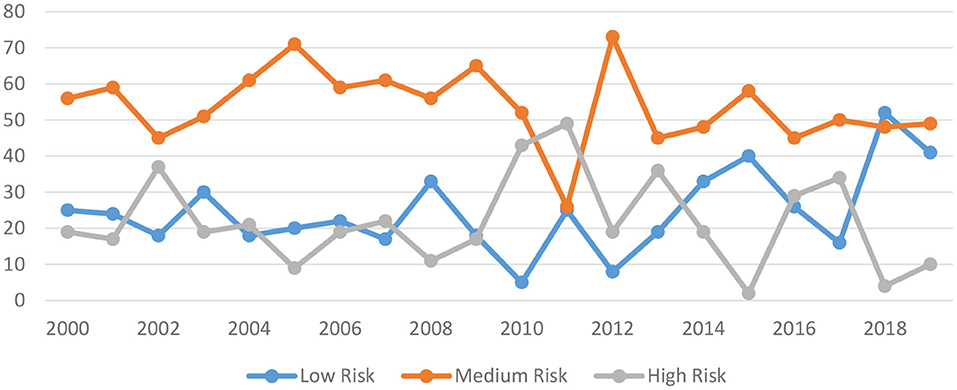
Figure 8. Economical risk in Brazil from 2000 to 2019.
As shown in Figure 9, although there are still many problems in Brazil's environmental constraints, Brazil's investment environment risk has been low and stable. Brazil has done a good job of developing clean energy, largely relying on domestic capital. The carbon emissions have been falling every year since 2014. Brazil has the highest proportion of renewable energy in the context of global economic power, the proportion of renewable energy is 75%. Less than 4.5% of electricity is generated by coal in Brazil, while the same input generates 70% in China. Strict environmental protection policies impose binding forces on oil and gas investment enterprises.
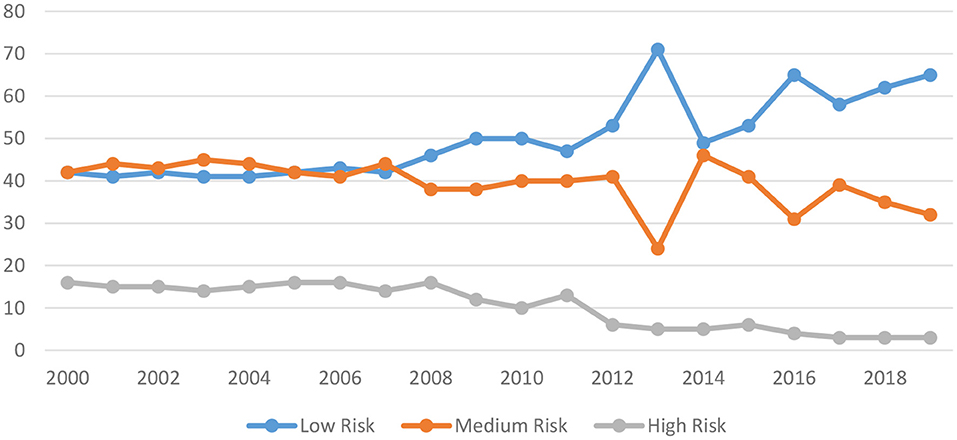
Figure 9. Investment environment risk in Brazil from 2000 to 2019.
The risk analysis of four dimensions analyzes the risk changes of oil & gas investment in Brazil from various perspectives, the comprehensive action of various factors formed the final investment environment risk trend.
The above simulation results are based on existing data in the data resource. We then revise the model parameters to consider the impact of possible sudden political or economic risks on oil investment risk. We introduce the new node information into the cloud parameter BN and use the joint tree reasoning algorithm to carry out reasoning calculation, so as to obtain the new membership degree of the emergency risk of overseas oil & gas investment. In this paper, the variable control method is used to analyze the impact of emergencies on the investment risk in Brazil in combination with the investment situation of Brazil in 2019.
There is no doubt that the more stable the government, the less likely the country is to experience political upheaval and the more attractive it will be to oil & gas investors. We consider the main factors affecting the stability of the government, simulate the sudden political events, and analyze the dynamic trend of the risk level probability of the sudden political events.
Through the analysis of the original data of political risk dimension indicators from 2000 to 2018, we can identify several indicators that were significantly affected by political events at several time points when political risk changes greatly. According to various forecasting reports issued by the Brazilian central bank and other institutions, combined with the political risk assessment results of Brazil, the change range of indicators under the scenario simulation is roughly estimated. Therefore, based on the existing information, the risk assessment model node of Brazil's oil & gas investment is modified as follows:
(a) Government stability is at a high risk level, and the degree of membership (low, moderate, high) may be set to 0, 30, or 70.
(b) Socioeconomic Conditions is at a moderate risk level, and the degree of membership (low, moderate, high) may be set to 0, 70, 30.
(c) Oil price fluctuation is at a low risk level, and the degree of membership (low, moderate, high) may be set to 80, 20, 0.
(d) Inflation rate is at a moderate risk level, and the degree of membership (low, moderate, high) may be set to 0, 90, 10.
(e) Exchange rate is at a moderate risk level. It is advisable to set the degree of membership (low, moderate, high) to 40, 60, 0.
(f) GDP growth rate is at a moderate risk level, and the degree of membership (low, moderate, high) may be set to 20, 80, 0.
(g) Net inflows of foreign direct investment is at a high risk level, and the degree of membership (low, moderate, high) may be set to 0, 20, 80.
As illustrated in the above figure, under the simulated political event scenario, the variation of oil & gas investment risk in Brazil (low, medium, high) is 30.0, 37.9, 32.1. In other words, sudden political events make Brazil a medium-risk investment target country. Analyzing this sudden political event and understanding the risk composition affected by it can help overseas investors to formulate countermeasures quickly, adjusting investment decisions in time and preventing losses effectively.
As the largest country in South America, Brazil has suffered several economic and financial crises. The economic growth of Brazil has been declining since 2011. In particular in 2015 and 2016, Brazil's GDP declined 3.8%. In February 2016 Moody's cut Brazil's sovereign debt rating to junk status resulting in a very bad outlook. The International Monetary Fund's latest World Economic Outlook has further downgraded its growth forecasts for Brazil over the next 2 years and sees the country mired in a long and deep recession.
We assume that there was a major shock to the Brazilian economy in 2019. The selection criteria of indicators in the scenario simulation refers to 4.3.1. According to the existing information, the node of the risk assessment model for investment in Brazil is modified as follows:
(a) Oil price fluctuation is at a low risk level, and we still set the degree of membership (low, moderate, high) to 80, 20, 0.
(b) Exchange rate is at a moderate risk level, and the degree of membership (low, moderate, high) may be set to 60, 60, 0.
(c) Government stability is at a moderate risk level, and the degree of membership (low, moderate, high) may be set to 0, 60, 40.
(d) Socioeconomic Conditions is at a moderate risk level, and it may be appropriate to set the degree of membership (low, moderate, high) to 20, 80, 0.
(e) GDP growth rate is at a high risk level, and the degree of membership (low, moderate, high) may be set to 0, 20, 80.
(f) Cost of business start-up procedures is at a moderate risk level. It is advisable to set the (low, moderate, high) membership degree to 20, 80, 0.
(g) Net inflows of foreign direct investment is at a high risk level, and the degree of membership (low, moderate, high) may be set to 0, 20, 80.
The newly acquired simulation results indicate that oil & gas investment risk (low, medium, high) in a sudden economic event scenario is (35.5, 38.0, 26.5). It can therefore be inferred that the oil & gas investment risk in Brazil is at a moderate risk level.
In general, there is no possibility of sudden change in resource risk, and the political, economic, and investment environment will have an emergency situation, so we simulated the model, considering the sudden political or economic risk for oil as the influence of investment risks.
Combining industry consensus and classification criteria of professional risk rating agencies, we selected 25 indicators from six dimensions to measure the oil and gas overseas investment environment; environmental constraints and state-related factors were added, improving the system's fit with the current status of overseas investments. We applied the Cloud parameter Bayesian network algorithm to dynamically evaluate oil and gas overseas investment risk of 10 resource countries. This new recommended model is capable of quantizing the probability of high risks and evaluating specific risks within time frame(s). Compared with those static numbers for risk rating agencies worldwide, our research results show the annual variation of risk dynamics over the past two decades. The evaluation period of overseas oil and gas investment is short and difficult; by using CPBN, a rapid and efficient quantitative evaluation of environment risk can be vividly conducted. In summary, our simulation results show that the risk level of investing in oil & gas projects in Brazil, Kazakhstan, Turkmenistan, Indonesia, and Russia is low. In terms of investing in Ecuador and United Arab Emirates, the risk levels are moderate. The other three countries which include Chad, South Sudan, and Iraq have been suffering political or economic crises, and their investment risks have therefore been experiencing increasing trends. Experts involved in oil and gas investment decisions verified our results. Their risk management experience of investing oil & gas projects in Brazil is similar to our model. This method can also be applied to investment, engineering, and service projects. The proper use of risk assessment results can be conducive to those potential investors who will invest in potential countries in the future.
From the results of evaluation, investors should prioritize the expansion of projects under the premise that the economic value meets the requirements in low-risk countries such as Russia, Indonesia etc. For those countries with medium risk levels, it is important for executives and policy makers to evaluate the investment risk according to different dimensions to avoid foreseeable increasing risks affecting feasibility and profitability of investments. Investors should identify risks in a timely manner from high-risk countries like South Sudan and Iraq and avoid worthless investments. Our simulation results are based on existing data in the data resource, which is still macroscopic and not updated regularly. This leads to our model only being able to evaluate the investment risk at the national level. But resource risks and contract-related risks vary widely from region to region within the same country. We therefore suggest that governments and national oil companies establish a targeted data and information service pool to monitor the changing investment environment risks of potential investment projects in real time. Corporations and academic institutions should remain in touch via information sharing to construct the cornerstone of a prospective overseas investment insurance system. The more data accumulates, the more precise and specific the risk evaluation is in the age of big data and artificial intelligence (Desai et al., 2020).
The original contributions presented in the study are included in the article/supplementary material, further inquiries can be directed to the corresponding author/s.
DL: proposer and supervisor of this research. XZ: chief of method application exploration. JL and SZ: providing related data. All authors contributed to the article and approved the submitted version.
The authors declare that the research was conducted in the absence of any commercial or financial relationships that could be construed as a potential conflict of interest.
Ali, A., Warren, D., and Mathiassen, L. (2017). Cloud-based business services innovation: a risk management model. Int. J. Inform. Manag. 37, 639–649. doi: 10.1016/j.ijinfomgt.2017.05.008
Asrilhant, B., Dyson, R. G., and Meadows, M. (2007). On the strategic project management process in the UK upstream oil and gas sector. Omega 35, 89–103. doi: 10.1016/j.omega.2005.04.006
Bøe, K. S., Jordal, T., Mikula, S., and Molnár, P. (2019). Do political risks harm development of oil fields? J. Econ. Behav. Organ. 157, 338–358. doi: 10.1016/j.jebo.2018.01.005
Chandrinos, S. K., Sakkas, G., and Lagaros, N. D. (2018). AIRMS: a risk management tool using machine learning. Expert Syst. Appl. 105, 34–48. doi: 10.1016/j.eswa.2018.03.044
Chapman, C., and Ward, S. (2004). Why risk efficiency is a key aspect of best practice projects. Int. J. Project Manage. 22, 619–632. doi: 10.1016/j.ijproman.2004.05.001
Chen, C., Limao, Z., and Kong Tiong, R. L. (2019). A novel learning cloud Bayesian network for risk measurement. Appl. Soft Comp. 87. doi: 10.1016/j.asoc.2019.105947
Chorn, L. G., and Shokhor, S. (2006). Real options for risk management in petroleum development investments. Energy Econ. 28, 489–505. doi: 10.1016/j.eneco.2006.03.002
Desai, J. N., Pandian, S., and Vij, R. K. (2020). Big data analytics in upstream oil and gas industries for sustainable exploration and development: a review. Environ. Technol. Innov. 21:101186. doi: 10.1016/j.eti.2020.101186
Duan, F., Ji, Q., Liu, B.-Y., and Fan, Y. (2018). Energy investment risk assessment for nations along China's Belt & Road Initiative. J. Clean. Prod. 170, 535–547. doi: 10.1016/j.jclepro.2017.09.152
Feng, X., Jiang, J.-, c., and Wang, W.-,f. (2020). Gas pipeline failure evaluation method based on a Noisy-OR gate bayesian network. J. Loss Prev. Process Ind. 66. doi: 10.1016/j.jlp.2020.104175
Gómez-Fuster, J. M., and Jiménez, P. (2020). Probabilistic risk modelling for port investments: a practical approach. Case Stud. Transport Policy 8, 822–831. doi: 10.1016/j.cstp.2020.06.001
Hsieh, H.-C., Sofia, B., and Vu, T. H. C. (2019). The effects of economic policy uncertainty on outward foreign direct investment. Int. Rev. Econ. 64, 377–392. doi: 10.1016/j.iref.2019.08.004
Huang, J., Liu, J., Zhang, H., and Guo, Y. (2020). Sustainable risk analysis of China's overseas investment in iron ore. Res. Policy 68:101771. doi: 10.1016/j.resourpol.2020.101771
Jian, W., Xiao, W.-,j., Sheng, W., and Wang, S.-,w. (2009). An improved effectiveness evaluation method based on grey cloud model. Microcomp. Inf.
Jin, B., Wang, Y., Liu, Z., and Xue, J. (2011). A trust model based on cloud model and bayesian networks. Proc. Envi. Sci. 11, 452–459. doi: 10.1016/j.proenv.2011.12.072
Ke, L., Xiaoliu, S., Zhongfu, T., and Wenyan, G. (2012). Grey clustering analysis method for overseas energy project investment risk decision. Syst. Eng. Proc. 3, 55–62. doi: 10.1016/j.sepro.2011.11.008
Kul, C., Zhang, L., and Solangi, Y. A. (2020). Assessing the renewable energy investment risk factors for sustainable development in Turkey. J. Clean. Prod. 276. doi: 10.1016/j.jclepro.2020.124164
Kumar, M., and Gregory, M. J. (2013). An exploration of risk management in global industrial investment. Risk Manage. 15, 272–300. doi: 10.1057/rm.2013.8
Ma, H., Sun, Z., and Fang, C. (2020). Risk assessment of transnational oil investment in Central Asia using a fuzzy comprehensive evaluation method. Regional Sustainability 1(1): 11–19. doi: 10.1016/j.regsus.2020.06.002
Midttun, A., Dirdal, T., Gautesen, K., Omland, T., and Wenstøp, S. (2007). Integrating corporate social responsibility and other strategic foci in a distributed production system: a transaction cost perspective on the North Sea offshore petroleum industry. Corp. Govern. Int. J. Business Soc. 7, 194–208. doi: 10.1108/14720700710739822
Minli, Z., and Wenpo, Y. (2012). Fuzzy comprehensive evaluation method applied in the real estate investment risks research. Phys. Proc. 24, 1815–1821. doi: 10.1016/j.phpro.2012.02.267
Olusola, A., Nurse, J. R. C., Martin, A., and New, A. (2019). Cyber risk assessment in cloud provider environments: current models and future needs. Comp. Security 87. doi: 10.1016/j.cose.2019.101600
Sachse, H., Jungermann, H., and Belting, J. M. (2012). Investment risk – the perspective of individual investors. J. Econ. Psychol. 33, 437–447. doi: 10.1016/j.joep.2011.12.006
Sobczyk, E. J., Kicki, J., Wiktoria, S., and Szuwarzyński, M. (2017). Support of mining investment choice decisions with the use of multi-criteria method. Res. Policy 51, 94–99. doi: 10.1016/j.resourpol.2016.11.012
Tan, S. H., and Barton, P. I. J. (2017). Optimal shale oil and gas investments in the United States. Energy 141, 398–422. doi: 10.1016/j.energy.2017.09.092
Walls, M. R., and Dyer, J. S. (1992). Risk propensity and firm performance: a study of the petroleum exploration industry. Manage. Sci. 42, 939–1092. doi: 10.1287/mnsc.42.7.1004
Wang, D., Tong, X., and Wang, Y. (2020). An early risk warning system for outward foreign direct investment in mineral resource-based enterprises using multi-classifiers fusion. Res. Policy 66. doi: 10.1016/j.resourpol.2020.101593
Wang, Z., Li, H., and Jia, Y. (2013). A neural network model for expressway investment risk evaluation and its application. J. Transp. Syst. Eng. Inform. Technol. 13, 94–99. doi: 10.1016/S1570-6672(13)60118-X
Wei, W. J. (2016). An threat assessment method based on cloud parameters bayesian network. Comp. Technol. Dev.
Weldegiorgis, F. S., Mesfin, B., and Sturman, K. (2017). Looking for oil, gas and mineral development in Ethiopia: Prospects and risks for the political settlement. Extr. Ind. Soc. 4, 151–162. doi: 10.1016/j.exis.2016.12.003
Wu, D., Huang, J.- b., and Zhong, M.-r. (2020). Prediction of metal futures price volatility and empirical analysis based on symbolic time series of high-frequency. Trans. Nonferrous Met. Soc. China 30, 1707–1716. doi: 10.1016/S1003-6326(20)65332-8
Wu, Y., Wang, J., and Ji, S. (2019). Renewable energy investment risk assessment for nations along China's Belt & Road Initiative: an ANP-cloud model method. Energy 190. doi: 10.1016/j.energy.2019.116381
Xie, G., Yue, W., Wang, S., and Lai, K. K. (2010). Dynamic risk management in petroleum project investment based on a variable precision rough set model. Technol. Forecast. Soc. Change 77, 891–901. doi: 10.1016/j.techfore.2010.01.013
Yan, D. W., Liang-Xian, G. U., and Pan, L. (2008). A study of new method for weapon system effectiveness evaluation based on bayesian network. Comp. Technol. Dev. 4, 209–213.
Yuan, J., Li, X., Xu, C., Zhao, C., and Liu, Y. (2019). Investment risk assessment of coal-fired power plants in countries along the Belt and Road initiative based on ANP-Entropy-TODIM method. Energy 176, 623–640. doi: 10.1016/j.energy.2019.04.038
Keywords: overseas oil and gas investment, dynamic, risk assessment, CPBN, big data
Citation: Duan X, Zhao X, Liu J, Zhang S and Luo D (2021) Dynamic Risk Assessment of the Overseas Oil and Gas Investment Environment in the Big Data Era. Front. Energy Res. 9:638437. doi: 10.3389/fenrg.2021.638437
Received: 06 December 2020; Accepted: 22 February 2021;
Published: 30 March 2021.
Edited by:
Yongping Sun, Hubei University of Economics, ChinaReviewed by:
Muhammad Mohsin, Jiangsu University, ChinaCopyright © 2021 Duan, Zhao, Liu, Zhang and Luo. This is an open-access article distributed under the terms of the Creative Commons Attribution License (CC BY). The use, distribution or reproduction in other forums is permitted, provided the original author(s) and the copyright owner(s) are credited and that the original publication in this journal is cited, in accordance with accepted academic practice. No use, distribution or reproduction is permitted which does not comply with these terms.
*Correspondence: Dongkun Luo, Y2hvdXl1bmZhdEAxNjMuY29t
Disclaimer: All claims expressed in this article are solely those of the authors and do not necessarily represent those of their affiliated organizations, or those of the publisher, the editors and the reviewers. Any product that may be evaluated in this article or claim that may be made by its manufacturer is not guaranteed or endorsed by the publisher.
Research integrity at Frontiers
Learn more about the work of our research integrity team to safeguard the quality of each article we publish.