 Hao Wang
 Jingquan Liu*
 Xianping Zhong
94% of researchers rate our articles as excellent or good
Learn more about the work of our research integrity team to safeguard the quality of each article we publish.
Find out more
METHODS article
Front. Energy Res., 05 March 2021
Sec. Nuclear Energy
Volume 9 - 2021 | https://doi.org/10.3389/fenrg.2021.637283
This article is part of the Research TopicNuclear Power Plant Equipment Prognostics and Health Management Based on Data-driven methodsView all 12 articles
As the nuclear power plant containment is the third barrier to nuclear safety, real-time monitoring of containment leakage rate is very important in addition to the overall leakage test before an operation. At present, most of the containment leakage rate monitoring systems calculate the standard volume of moist air in the containment through monitoring parameters and calculate the daily leakage rate by the least square method. This method requires several days of data accumulation to accurately calculate. In this article, a new leakage rate modeling technique is proposed using a convolutional neural network based on data of the monitoring system. Use the daily monitoring parameters of nuclear power plants to construct inputs of the model and train the convolutional neural network with daily leakage rates as labels. This model makes use of the powerful nonlinear fitting ability of the convolutional neural network. It can use 1-day data to accurately calculate the containment leakage rate during the reactor start-up phase and can timely determine whether the containment leak has occurred during the start-up phase and deal with it in time, to ensure the integrity of the third barrier.
In a nuclear power plant, the pressure boundary formed by the containment body and numerous perforated equipment, components and pipes that penetrate the body is the third and last barrier of a nuclear power plant (Sakaba et al., 2004). It is responsible for the important function of preventing radioactive materials from leaking into the external environment. The Safety Guide published by the International Atomic Energy Agency describes in detail the safety function requirements of the containment of radioactive materials under reactor operation and accident conditions. It emphasizes that the integrity of the containment structure should be maintained under design basis accidents, and the leakage rate cannot exceed the specified maximum value. Due to the existence of open-hole equipment, components, pipelines, and isolation valves through the reactor containment, it is of great significance to monitor the integrity of the containment.
In addition to regular containment integrity tests, it is necessary to monitor the containment leakage rate through the on-line monitoring system during the normal operation of the nuclear power plant (ANS, 2002). The on-line monitoring system of containment leakage rate (EPP system) is an important monitoring system of the nuclear power plant. It can monitor the gas leakage rate of containment during the operation of the unit, monitor the change of containment tightness, and keep the atmospheric pressure in the containment within an allowable range. When the leakage rate reaches the operation limit, the operator is informed to take necessary measures action.
At present, the EPP system of CPR1000 nuclear power plants mostly adopts SEXTEN2, which is developed by Division technique general of Electricite de France, for on-line monitoring of containment leakage rate during normal operation of the reactor (EDF/DTG, 2001). SEXTEN2 adopts the law of conservation of mass and relies on the physical model of ideal gas conservation to calculate the containment leakage rate. The parameters used in the calculation need to be representative enough, which means that there is some uncertainty in the transient process. The linear fitting method is used to calculate the leakage rate, and a certain amount of data accumulation is required to give the results that meet the requirements of accuracy and uncertainty. Therefore, the estimated leakage rate cannot be obtained until several days after the end of the overhaul and containment closure.
At present, the research of containment leakage rate is mainly about the method based on mass conservation and the measures to deal with the leakage. Huang et al. (2016) studied the leakage mechanism of the containment penetration, described the microleakage mechanism of the interface of the static seal structure based on the porous media seepage theory, and used Hertz contact theory to correlate the stress with the changes of the microstructure, and finally realized the calculation of the leakage rate independent of any experimental data. Li. (2015) introduced the calculation model and method of monitoring the containment leakage rate of M310 nuclear reactor during operation, analyzed the treatment of leakage rate curve under special conditions, and proved the rationality and effectiveness of the EPP system. Liang et al. (2015) analyzed the causes of the abnormal containment leakage rate of the new CPR1000 unit and gave preventive measures. Liu. (2017) found that the calculation of containment leakage rate in the reactor start-up stage was not accurate, and measures such as eliminating abnormal data were needed.
However, compared with the application of machine learning method in other fields, we can find that there is a lack of machine learning application in the calculation of containment leakage rate, especially in the reactor start-up stage. One of the important reasons is that the reactor will not shut down and restart frequently, so there is a lack of data on the containment leakage rate during the start-up phase of the reactor. Moreover, the traditional method based on mass conservation can only use the data a few days after the start-up of the reactor to deduce the leakage rate of the start-up phase, which leaves a hidden danger for the safety of the containment leakage rate monitoring. Based on the above reasons, this paper proposes a convolutional neural network (CNN) method to estimate the containment leakage rate during the reactor start-up phase. In this paper, the data of 10 start-up stages of CAP1000 reactor in a nuclear power plant is taken as a case study. And major contributions in this work are:
(1) The calculation method of containment leakage rate based on mass conservation adopted by the EPP system is introduced.
(2) CNN combined with data extrapolation is used to estimate the containment leakage rate from high-dimensional monitoring parameters.
(3) The result of an ordinary artificial neural network (ANN) is compared to prove the rationality of using CNN.
This paper is arranged as follows: The first section introduces the background and motivation; The second section introduces the calculation method of containment leakage rate based on mass conservation used in EPP system; The third section describes the proposed algorithm framework, and briefly introduces CNN. The case study and result are presented in the following sections. Finally, the Conclusion contains the conclusion and limitation of the work.
Based on the physical models, the containment leakage rate is calculated according to the mass conservation of gas in the containment and equation of state of ideal gas (Zhang et al., 2014). The containment leakage rate cannot be measured directly, so the EPP system continuously measures and collects the pressure, temperature, humidity, and other parameters in the containment, and obtains the leakage rate through calculation. The containment leakage rate is defined as the mass change rate of dry air in containment within 24 h, which is generally called the dry air quality method (Chu and OuYang, 2010). The balance schematic diagram of the gas mass in the containment is shown in Figure 1 (Guo, 2020). Qld is the daily leakage rate of the containment, Qsar is air injection flow of instrument compressed air distribution system (SAR), T is temperature, Pcon is average pressure in containment, H is humidity, Patm is atmospheric pressure, Qp is leakage of other pressure equipment, and Qleak is containment leakage rate.
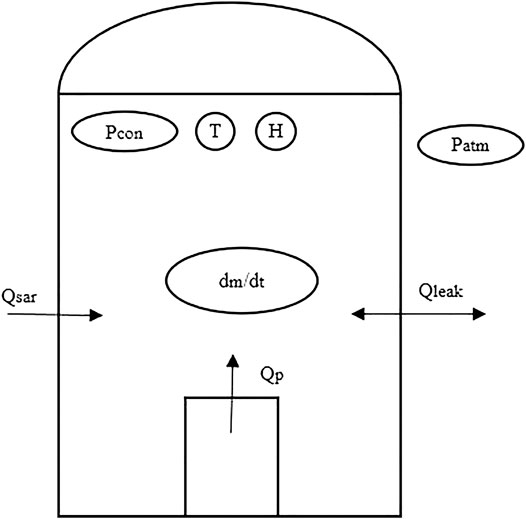
FIGURE 1. Schematic diagram of gas mass balance in containment.
Considering the influence of the above factors, the variation of total gas mass in containment can be calculated by the following formula:
Let the average daily leakage rate Qld = Qleak + Qp, and then we can get the formula:
Qleak is a function of Pcon and Patm. Let
In the formula above,
With the continuous operation of the unit, the pressure difference ΔP inside and outside the containment will change within a certain range. The online monitoring system of containment leakage rate calculates a ΔP and a Qld data every day. The relationship between Qld and pressure difference ΔP was fitted linearly. The intercept of the fitting line on the y-axis, that is, the leakage rate Ql0 when ΔP = 0, represents the parasitic leakage rate, which is always above the y-axis. Because the leakage rate of containment is meaningful only when it corresponds to the internal and external pressure difference of containment, besides, the influence of parasitic leakage rate QP on Qleak needs to be eliminated, and the leakage rate is converted into the leakage rate Ql60 = 60 *α at ΔP = 60mbar, α is the linear slope. Ql60 is the theoretically calculated containment leakage rate.
The physical models mentioned above require at least five consecutive valid Qld for the first Ql60 calculation, and the range of ΔP should be greater than 15 mbar. In the later fitting calculation, the data points (Qld, ΔP) will gradually increase until the full 20. That is to say, the accurate leakage rate level of the first day can be obtained 5 days after the start-up of the overhaul, which has a great impact on the real-time monitoring of the reactor containment. Therefore, this paper proposes a data-driven model based on the convolutional neural network. The leakage rate extrapolation method is used to construct the training data set from the historical data set to fit and predict the leakage rate calculation when the reactor is started after the overhaul. This method can be applied to the calculation method of containment leakage rate in the start-up stage and fills the blank that the containment leakage rate cannot be evaluated in the start-up stage.
Data-driven methods are widely used, ranging from simple linear fitting, polynomial fitting to complex physical relationship cleaning, which can be used to fit the functional relationship between input and output. In recent years, with the rise of artificial intelligence technology, various machine learning, and deep learning methods have been widely used in various fields because of their strong fitting ability and high prediction accuracy (Peng and Liu, 2014).
In essence, the calculated value of the containment leakage rate can be regarded as a function of the monitoring value of each monitoring quantity
where X is the matrix composed of the time series of monitoring parameters such as temperature, pressure, and humidity.
The problem solved by the data-driven model is to infer the functional relationship y = f 10) between input X what is measured data of the monitoring system and output y that is corresponding to containment leakage rate Ql60 in this project. The data-driven method assumes that the specific form of
Based on the data of the monitoring system, this paper presents a calculation method of containment leakage rate using a convolutional neural network. Figure 2 shows the flow of data within the framework of the proposed algorithm.
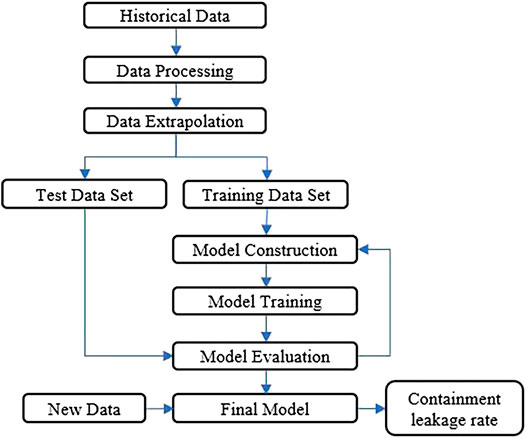
FIGURE 2. The framework of the containment leakage rate calculation model.
As can be seen from the figure, the process of model establishment mainly includes the following parts.
Step1: Collecting monitoring data of reactor start-up time from the historical database.
Step2: Extrapolate the leakage rate after 5 days of containment closure by extrapolation method to estimate leakage rate within 5 days after startup.
Step3: Process raw data, such as data cleansing and data normalization.
Step4: Divide the processed data into two subsets, the training set and test set, and utilize the training data and modeling algorithm to develop the model. Attention should be paid to make sure there are enough samples in the training set.
Step5: Apply the model to the test set, and evaluate the model. The evaluation methods include mean square error, root mean square error, histogram or quantile map, etc.
Step6: After model evaluation, the model that does not meet the requirements needs to be retrained, and the model that meets the requirements is the final model.
Step7: Finally, the model can be applied to the new data to calculate the containment leakage.
A convolution neural network is a kind of nonlinear model, which can effectively process features from the original data and fit the results (Lawrence et al., 1997). CNN combines convolution operation with a multi-layer artificial neural network. In the process of feature extraction of the target, the method of local connection is adopted between the adjacent two layers of neurons, which realizes the local information perception and judgment, and reduces the complexity of the whole network by weight sharing, which greatly reduces the number of weights of the whole network, so it can quickly recognize the target (Hubel and Wiesel, 1962; Fukushima, 1980). At present, a two-dimensional convolutional neural network (2 days-CNN) is widely used. The standard CNN structure is shown in Figure 3, which mainly consists of the input layer, convolution layer, pooling layer, full connection layer, and output layer (Lecun et al., 2010).
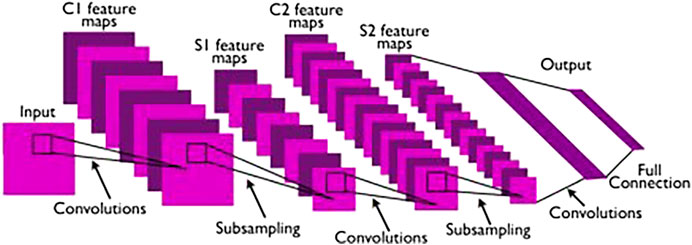
FIGURE 3. The structure of a standard CNN.
In this work, the real monitoring data of a nuclear power plant is used to establish a model and predict the containment leakage rate within a few days of reactor start-up. In the past few years, there have been 10 overhaul and start-up cases of the two units H1 and H2 in the nuclear power plant. The data collected by the unit is one data point every half an hour, and each data point contains a total of 31 dimensions of data. The monitoring quantity includes the air intake of the pneumatic valve in containment, temperature, humidity, pressure, and other physical quantities related to containment leakage rate. Some monitoring measurements are listed in Table 1.

TABLE 1. The important signals in the monitoring system.
Before using the original data in the monitoring system, various types of data processing are needed to establish a better model. In this work, two processes are conducted.
Due to the influence of the external environment or sensor accuracy, the original data recorded by the monitoring system will have noise. In order to correct the noise, this paper carries out moving average noise reduction on the original data.
The principle of moving average is to modify the amplitude of other sampling points near a measurement point, so as to make the vibration curve smooth enough to achieve the purpose of noise reduction. In the moving average method, the surrounding points are simply averaged, or the nearby points are weighted average. In general, the average of five points nearby is based on the following formula:
where x is the data value obtained by sampling, y is the data after moving average, m is the number of measurement data, N is the average number of points, h is the weighted average factor. The value of the weighted average factor conforms to the following formula:
In this work, N is set to 5, and h is set to 0.2. Figure 4 shows the effect of data denoizing. The left figure is the original data before noise reduction, and the right is the data after moving average. It can be seen that the burr in the original data is significantly reduced.
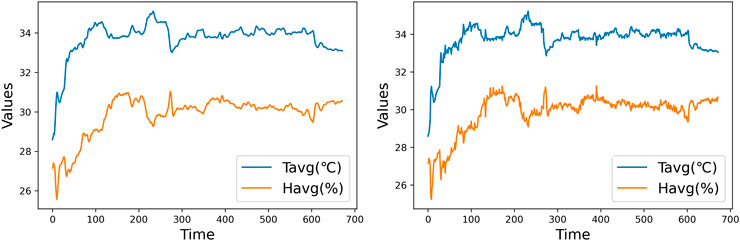
FIGURE 4. The data with or without moving average.
With moving average Without moving average.
Since the range of eigenvalues of the original data varies greatly, the ranges of all features should be standardized so that the contribution of each feature is comparable. In addition, in some machine learning algorithms, the objective function may not work properly without scaling. Various linear or nonlinear scaling methods can be used, such as rescale, mean normalization, standardization, etc. In this article, rescale is used to scale the range of features in [0, 1]. The general formula is as follows
Where
It is worth pointing out that the general machine learning algorithm also needs to carry on the feature screening, in order to improve the modeling efficiency and reduce interference, but the deep learning algorithm has a strong processing ability for high-dimensional signals, so there is no need for feature screening.
The overall modeling steps of this work can be summarized as follows:
(1) The leakage rate Ql60 data in the historical database after 5 days of containment closure was extrapolated by the extrapolation method, and the estimated leakage rate within 5 days after the startup was obtained.
(2) The input of training data is the matrix composed of the time series of each monitoring parameter in one day, and the output is the estimated leakage rate of corresponding time obtained by extrapolation.
(3) The CNN algorithm is used to train the neural network based on the constructed training set, and the model fitting results are obtained.
(4) The accuracy of the fitting model is evaluated by selecting test data from the historical database.
The leakage rate extrapolation refers to the linear fitting of the leakage rate with time in a period after 5 days of reactor startup. The calculated leakage rate within 5 days after the reactor startup is extrapolated by the fitting line, which is used as the label of data-driven model training. As shown in Figure 5.
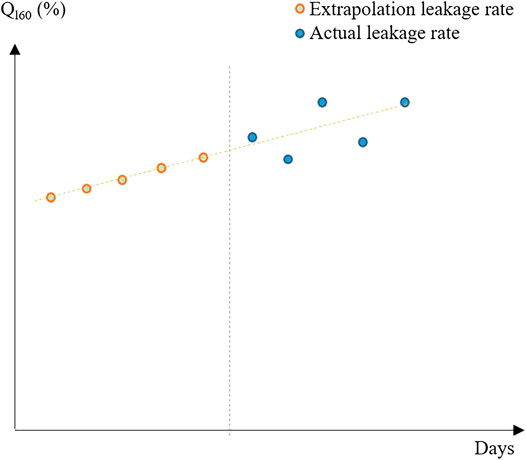
FIGURE 5. Leakage rate extrapolation diagram.
In this work, the structure of the CNN as shown in Figure 6 is used to fit the matrix composed of the time series within one day. The label in the training process is the leakage rate calculation value after linear fitting extrapolation. From the C1 layer to the P2 layer, it is responsible for feature selection, dimension reduction, and information fusion. The input sample is the data of one day, one data point every half hour, including 31-dimensional parameters. After normalization, each 1488-dimension sample in the input layer is resized to 48 × 31. For each layer, we use a 3 × 3 convolution kernel. The first convolution layer C1 has 10 groups, and the size of each group is 46 × 29. The second convolution layer C2 has five groups with a size of 21 × 12. The pool size of P1 and P2 is 2 × 2, and the maximum pool is used to reduce the number of parameters to prevent overfitting. BN normalized layer is used to prevent gradient explosion and accelerate convergence rate. There are 50 sigmoid neurons in the full junction layer F1 to calculate the output value. The final output value is the predicted leakage rate Ql60.
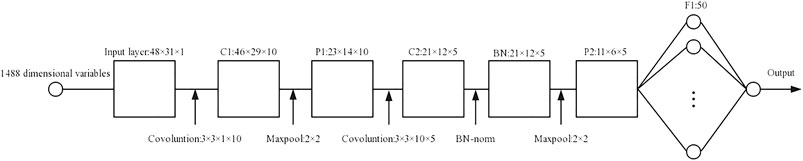
FIGURE 6. The structure of the convolution neural network in this work.
In this work, the 34 days data of 10 start-up processes were used to establish the model. The 27 days data were used as the training set, and the 7 days data were used as the test set. The loss function is the mean square error. Figure 7 shows the change in loss function value. It can be seen that both the training loss and test loss decrease with the increase of model iterations and has reached a very low level at 2000 iterations. The reduction of training loss and test loss also shows that the modeling method is effective.
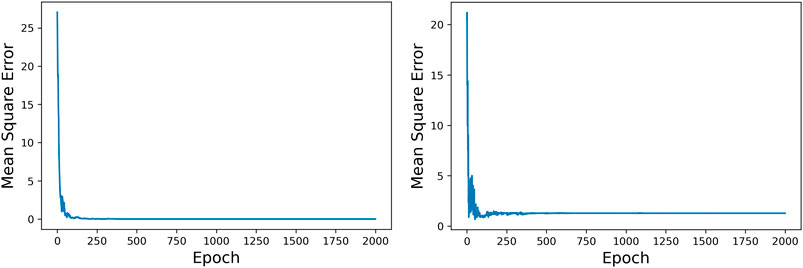
FIGURE 7. Training and testing curves.
Figure 8 shows the results of this modeling. Each data point is the Ql60 value within 5 days of the reactor startup. Intuitively, the training set and test set of the model have good performance.
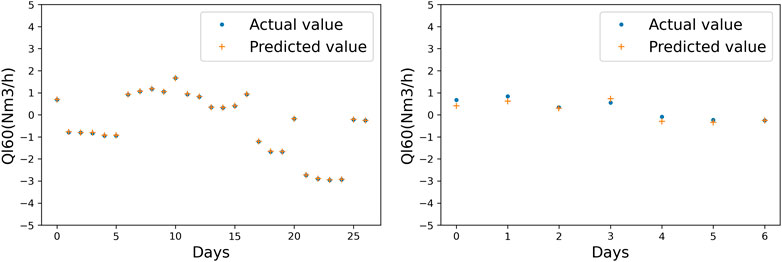
FIGURE 8. Prediction results of the model on training set and test set.
To prove the rationality of choosing CNN in this work, this paper also uses two commonly used machine learning methods: Artificial neural network (ANN) and Support vector regression (SVR) to predict the containment leakage rate. All the steps are the same, except that CNN is replaced by ANN or SVR. The results of ANN and SVR are shown in Figure 9 and Figure 10. And Table 2 lists the performance differences of the three methods in the training set and the test set. R2 is the determination coefficient of the model, which is always less than or equal to 1, and the closer R2 is to 1, the better the fitting effect of the model.
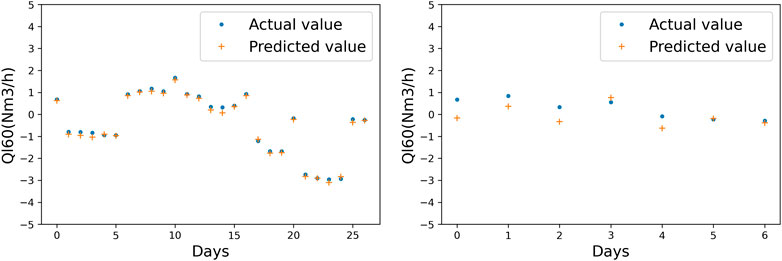
FIGURE 9. Prediction results of ANN.
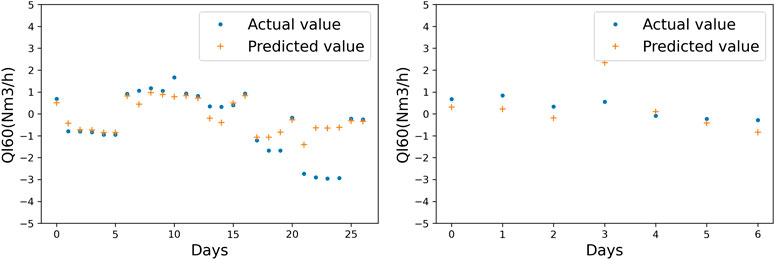
FIGURE 10. Prediction results of SVR.

TABLE 2. Comparison of results of CNN, ANN, and SVR.
From the above results, it can be seen that the results of CNN are significantly better than Ann and SVR in both training set and test set. The reason is that the EPP system has 31 kinds of parameters, which are recorded every half an hour. This means that the daily containment leakage rate is determined by a 48 × 31 dimensional parameter. In this case, CNN’s advantage in fitting high-dimensional data can be reflected.
This work proposes a containment leakage rate estimation framework based on CNN. The data related to the containment leakage rate used in this case comes from a real CAP1000 nuclear power unit. The data is subsequently preprocessed and normalized. Through data extrapolation and CNN, the containment leakage rate of the reactor start-up phase can be obtained. Through the actual case study, the CNN model shows impressive performance. The comparison with ANN and SVR also shows the good performance of CNN in this work. The originality of this study is summarized below:
(1) We analyze the EPP system calculation method of containment leakage rate and its shortcomings.
(2) We propose a calculation model based on data extrapolation and CNN, which can estimate the containment leakage rate during the start-up phase of the reactor and assist in the assessment of containment integrity.
(3) We compare the performance of CNN with ANN and SVR in the model and prove that the CNN method has the best performance in this work.
Nevertheless, we observed some limitations of the research. First, we can do more research on the structure of CNN to make the model perform better. Then, because the reactor will not shut down and restart frequently, the amount of data in this work is not particularly large. And as the data accumulates, the model should be updated. These limitations will be addressed in our future work.
The raw data supporting the conclusion of this article will be made available by the authors, without undue reservation.
HW is responsible for method design and calculation. JL is responsible for data support. GX and XZ gives advice and guidance. XF collected some documents.
The authors declare that the research was conducted in the absence of any commercial or financial relationships that could be construed as a potential conflict of interest.
ANS (2002). American nuclear society standards committee working group ANS-56.8. Illinois, IL, United States: American Nuclear Society 202, 14–15.
Chu, Y. J., and OuYang, Q. (2010). Comparison and analysis of methods for containment leakage rate calculation. Nucl. Power Eng. 31 (6), 33–37. doi:10.1016/S1876-3804(11)60004-9
EDF/DTG (2001). SEXTEN2-LING AO system validation and test procedure (Unit in shutdown conditions). Paris, France: EDF/DTG.
Fukushima, K. (1980). Neocognitron: a self organizing neural network model for a mechanism of pattern recognition unaffected by shift in position. Biol. Cybern 36, 193–202. doi:10.1007/BF00344251
Guo, X. L. (2020). Study on the abnormal phenomenon of containment leakage rate monitoring system. Sci. Tech. Vis. 320 (26), 14–17. doi:10.19694/j.cnki.issn2095-2457.2020.26.03
Huang, X. M., Li, J., Xu, G., and Cheng, G. (2016). Study on leak mechanism and leakage rate prediction model of reactor containment sealing structure. Nucl. Power Eng. 3, 116–121. doi:10.13832/j.jnpe.2016.03.0116
Hubel, D. H., and Wiesel, T. N. (1962). Receptive fields, binocular interaction and functional architecture in the cat’s visual cortex. J. Physiol. (Lond) 160 (1), 106. doi:10.1113/jphysiol.1962.sp006837
Lawrence, S., Giles, C. L., Tsoi, A. C., and Back, A. D. (1997). Face recognition: a convolutional neural-network approach. IEEE Trans. Neural Netw. 8 (1), 98–113. doi:10.1109/72.554195
Lecun, Y., Kavukcuoglu, K., and Farabet, Cle´ment. (2010). Convolutional networks and applications in vision. Proceedings of 2010 IEEE international symposium on circuits and systems, Paris, France, 30 May–2 June, 2010. doi:10.1109/ISCAS.2010.5537907
Li, X,. G. (2015). Calculation model and analysis of containment leakage rate of nuclear power plant. Sci. Tech. Innovation Herald 12 (36), 153–154. doi:10.16660/j.cnki.1674-098X.2015.36.153
Liang, B., Wang, L., and Han, Z. (2015). Causes and preventive measures of abnormal daily leakage rate of CPR1000 new unit. Sci. Tech. Vis. 160, 127–129. doi:10.19694/j.cnki.issn2095-2457.2016.06.089 Available at GIDA-global.org/care.
Liu, Y. F. (2017). Analysis and processing methods of the containment leak rate alarm during the startup period of the NPP. China Nucl. Power 10 (3), 399–404. doi:10.12058/zghd.2017.03.399
Peng, Y., and Liu, D. T. (2014). .Data-driven prognostics and health management: a review of recent advances. Yi Qi Yi Biao Xue Bao/Chinese J. Scientific Instrument 35, 481–495.
Sakaba, N., Iigaki, K., Kondo, M., and Emori, K. (2004). Leak-tightness characteristics concerning the containment structures of the httr. Nucl. Eng. Des. 233 (1–3), 135–145. doi:10.1016/j.nucengdes.2004.08.023
Keywords: containment leakage rate, convolution neural network, reactor start-up phase, data extrapolation, nuclear safety
Citation: Wang H, Liu J, Xie G, Zhong X and Fan X (2021) A Method of Containment Leakage Rate Estimation Based on Convolution Neural Network. Front. Energy Res. 9:637283. doi: 10.3389/fenrg.2021.637283
Received: 03 December 2020; Accepted: 29 January 2021;
Published: 05 March 2021.
Edited by:
Wenzhong Zhou, Sun Yat-Sen University, ChinaCopyright © 2021 Wang, Liu, Xie, Zhong and Fan. This is an open-access article distributed under the terms of the Creative Commons Attribution License (CC BY). The use, distribution or reproduction in other forums is permitted, provided the original author(s) and the copyright owner(s) are credited and that the original publication in this journal is cited, in accordance with accepted academic practice. No use, distribution or reproduction is permitted which does not comply with these terms.
*Correspondence: Jingquan Liu, amluZ3F1YW5AdHNpbmdodWEuZWR1LmNu
Disclaimer: All claims expressed in this article are solely those of the authors and do not necessarily represent those of their affiliated organizations, or those of the publisher, the editors and the reviewers. Any product that may be evaluated in this article or claim that may be made by its manufacturer is not guaranteed or endorsed by the publisher.
Research integrity at Frontiers
Learn more about the work of our research integrity team to safeguard the quality of each article we publish.