 Huimin Yun
 Ziliang Wang
 Ruixu Wang
 Xiaotao Bi
 Wei-Hsin Chen
- 1Beijing Advanced Innovation Center for Soft Matter Science and Engineering, Beijing University of Chemical Technology, Beijing, China
- 2Department of Chemical and Biological Engineering, The University of British Columbia, Vancouver, BC, Canada
- 3Innovation Centre, BC Research Inc., Richmond, BC, Canada
- 4Department of Aeronautics and Astronautics, National Cheng Kong University, Taiwan, Taiwan
Auto-thermal operation of biomass torrefaction can help avoid additional heat investment and the associated costs to the system. This work provides a general method for relating the feedstock-specific parameters to the energy balance and pre-diagnosing the potential of auto-thermal for different biomass torrefaction and pyrolysis systems. Both solid and gas thermal properties under various torrefaction conditions and their influences to the torrefaction system energy balances are considered. Key parameters that influence the process auto-thermal operation are analyzed, which include torrefaction reaction heat, torrefaction conditions, drying method, biomass species, and inert N2 flowrate. Equations of torgas and biomass higher heating values (HHVs), as well as the torrefaction reaction heat at different operating conditions are developed. It is found that torgas and biomass HHVs increase with torrefaction temperature and biomass weight loss. Torrefaction reaction heat has a linear relationship with the biomass weight loss, with a positive slope at 250–260°C, and a negative slope at 270–300°C, which indicates that torrefaction shifts from endothermic to exothermic at ∼270°C. Applying advanced drying technology and avoiding the use of N2 can help the system achieve auto-thermal operation at lower torrefaction temperature and residence time, thus leading to a higher process energy efficiency and product yield. This is the first work to relate the micro level element changes of biomass to the macro level process energy balances of the torrefaction system. This work is important in design and operation of the torrefaction system in both pilot and industrial scales to improve process efficiency and predict product quality in a reliable and economic manner.
Introduction
The utilization of raw biomass faces several challenges, e.g., low bulk energy density, hydrophilicity, and high transportation energy requirement. Torrefaction, a form of mild pyrolysis, is an effective treatment to upgrade biomass quality. Torrefaction is carried out at relatively low temperature (200–300°C) and near-atmospheric pressure in the presence of no or low oxygen (Wang et al., 2018b). N2 is commonly used to provide an anoxic environment in laboratory studies (Wang et al., 2018a). During torrefaction, biomass is decomposed, and condensable and non-condensable volatiles are released. Those volatiles, called torgas, can be combusted to provide heat for the torrefaction and the drying processes. When the heat contained in the torgas is sufficient to provide the heat requirements for the drying and the torrefaction processes, the process is considered as auto-thermal. Auto-thermal torrefaction operation can help avoid additional heat input and the associated energy costs, and mitigate carbon dioxide emissions from the biomass torrefaction process(Yun et al., 2020).
To achieve auto-thermal torrefaction operation, drying heat, torrefaction reaction heat and torgas combustion heat need to be examined. A few studies have reported energy integration of the torrefaction system, in which, however, either drying is excluded from the scope of analysis (Ohliger et al., 2013; Mobini et al., 2014; Atienza-Martínez et al., 2018), or the energy consumption for specific drying technologies has not been taken into account (Nanou et al., 2016; Mcnamee et al., 2016; Haseli, 2018; Gallego et al., 2020). Torrefaction reaction heat demand and torgas combustion heat release vary with biomass species and torrefaction severities (Ohliger et al., 2013). The heat requirement of a torrefier under given operating conditions was evaluated to explore the feasibilities of integrating torrefaction with other processes or units, e.g., pellet production process (Mobini et al., 2014), other thermochemical conversion processes (Anuar et al., 2017; Atienza-Martínez et al., 2018), piston engine unit (Director and Sinelshchikov, 2019), and power generation plant (Sermyagina et al., 2016; Haseli, 2019). Torrefaction operating conditions were optimized to obtain torrefied materials with high HHVs while maximizing mass yield (Chin et al., 2013; Lee and Lee, 2014; Chen et al., 2015a). On the other hand, boundaries of operating conditions for auto-thermal torrefaction have been rarely addressed. Bergman et al. (2005) performed an energy balance analysis based on experimentally determined HHV of torrefied wood and calculated calorific values of torgas, with torrefaction reaction heat being neglected. In the process model developed by Haseli (2018), simple correlations between composition and lower heating value of torrefied biomass at different weight loss were derived from literature. Dependencies on operating conditions, however, were not identified. Ranges of only three parameters, namely initial moisture content, torrefaction temperature, and residence time, were reported in both studies.
Being aware of the limitations of previous studies, this work aims to outline a general framework for including the feedstock-specific parameters into the process energy balance analysis to predict the overall performance of the torrefaction system. The well-defined boundaries of practical torrefaction auto-thermal operation will provide a suitable range of operating conditions to guide the design of the commercial torrefaction process. This work is particularly important in design and operation of a torrefaction or pyrolysis system on a large scale, where process efficiency is of major interest. With adequate knowledge from laboratory scale torrefaction tests, it avoids engineering trails and predicts product properties in a reliable and economic manner. To our knowledge, this is the first work to relate the micro level element changes of biomass to the macro level process energy balances of the torrefaction system. Also, impacts of using different drying technologies and inert N2 in the torrefaction auto-thermal operation are analyzed.
Materials and Methods
Figure 1 shows a typical energy integration configuration, which is used in this study. The wet biomass (with the moisture content of M0, and bone-dry mass flow rate of ) is initially dried and then torrefied with α of biomass weight becoming volatiles, named as torgas, as shown in Eq. (1). The torgas is combusted and recycled to provide heat for biomass torrefaction and drying in sequence.
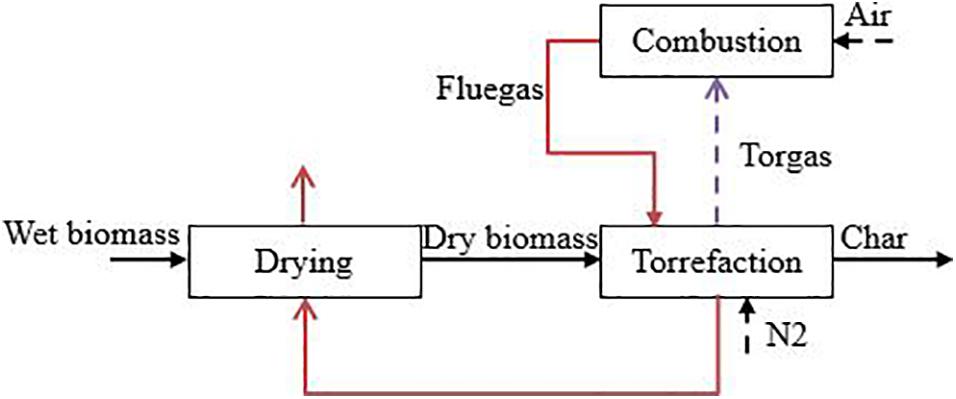
Figure 1. Flow chart of integrated torrefaction system.
The enthalpy available from the flue gases (Qcom,in GJ/h) is defined by the energy balance over the combustion process in Eq. (2).
where (t/hr) is the mass flow rate of the dry biomass entering the torrefier, α is the fractional biomass weight loss in torrefaction, and HHVtor (GJ/t) is the higher heating value of the torgas, and ξcom is the thermal efficiency of the combustion process.
The enthalpy flow required for the torrefaction process (Qtor) is given by Eq. (3).
Where △Htor(Ttor) is the torrefaction reaction heat at temperature Ttor, △hN2 is the sensible heat that required for N2 flow to increase from the ambient temperature to Ttor, and ξtoris the thermal efficiency of the torrefier.
The enthalpy flow required for the drying process is expressed as Eq. (4).
Where is the amount of water removed from the wet biomass in t/hr; hV is the latent heat of evaporation of the water, in GJ/t, and ξdry is the thermal efficiency of the dryer. The water evaporated is given by Eq. (5):
Thus,
The auto-thermal operating condition can thus be expressed by equating the heat available from the flue gases with the heat required for torrefaction and drying, as in Eq. (7).
Equation (7) can be simplified to Eq. (8).
Torrefaction Reaction Heat
The torrefaction reaction heat has been measured experimentally and predicted by models in several studies, as summarized in Table 1, and its value varies widely from 255 to −3,500 kJ/kg. The reported torrefaction reaction heat depends on the composition of the woody biomass and the torrefaction operating conditions. Biomass usually contains around 30% hemicellulose, 50% cellulose, and 20% lignin, and the proportions vary between softwood and hardwood species. Thermogravimetric (TGA) analyses have revealed that hemicellulose is the most active component, decomposing between 200 and 300°C; cellulose degrades between 275 and 350°C, and lignin is the least reactive and decomposes over the range from 200 to 600°C (Rath et al., 2003). Many experiments have revealed that the decomposition of hemicellulose is slightly exothermic (Rath et al., 2003; Khezami et al., 2005; Yang et al., 2007; Faleeva et al., 2018). Cellulose decomposes via competing and overlapping endothermic volatile formation and exothermic char formation (Mok and Antal, 1983; Milosavljevic et al., 1996; Rath et al., 2003; Khezami et al., 2005; Cho et al., 2010). Rath et al. (2003) suggested that the overall heat of biomass pyrolysis depends on the competition between exothermic char formation and endothermic volatile formation reactions, as shown in Eq. (9) (Rath et al., 2003),
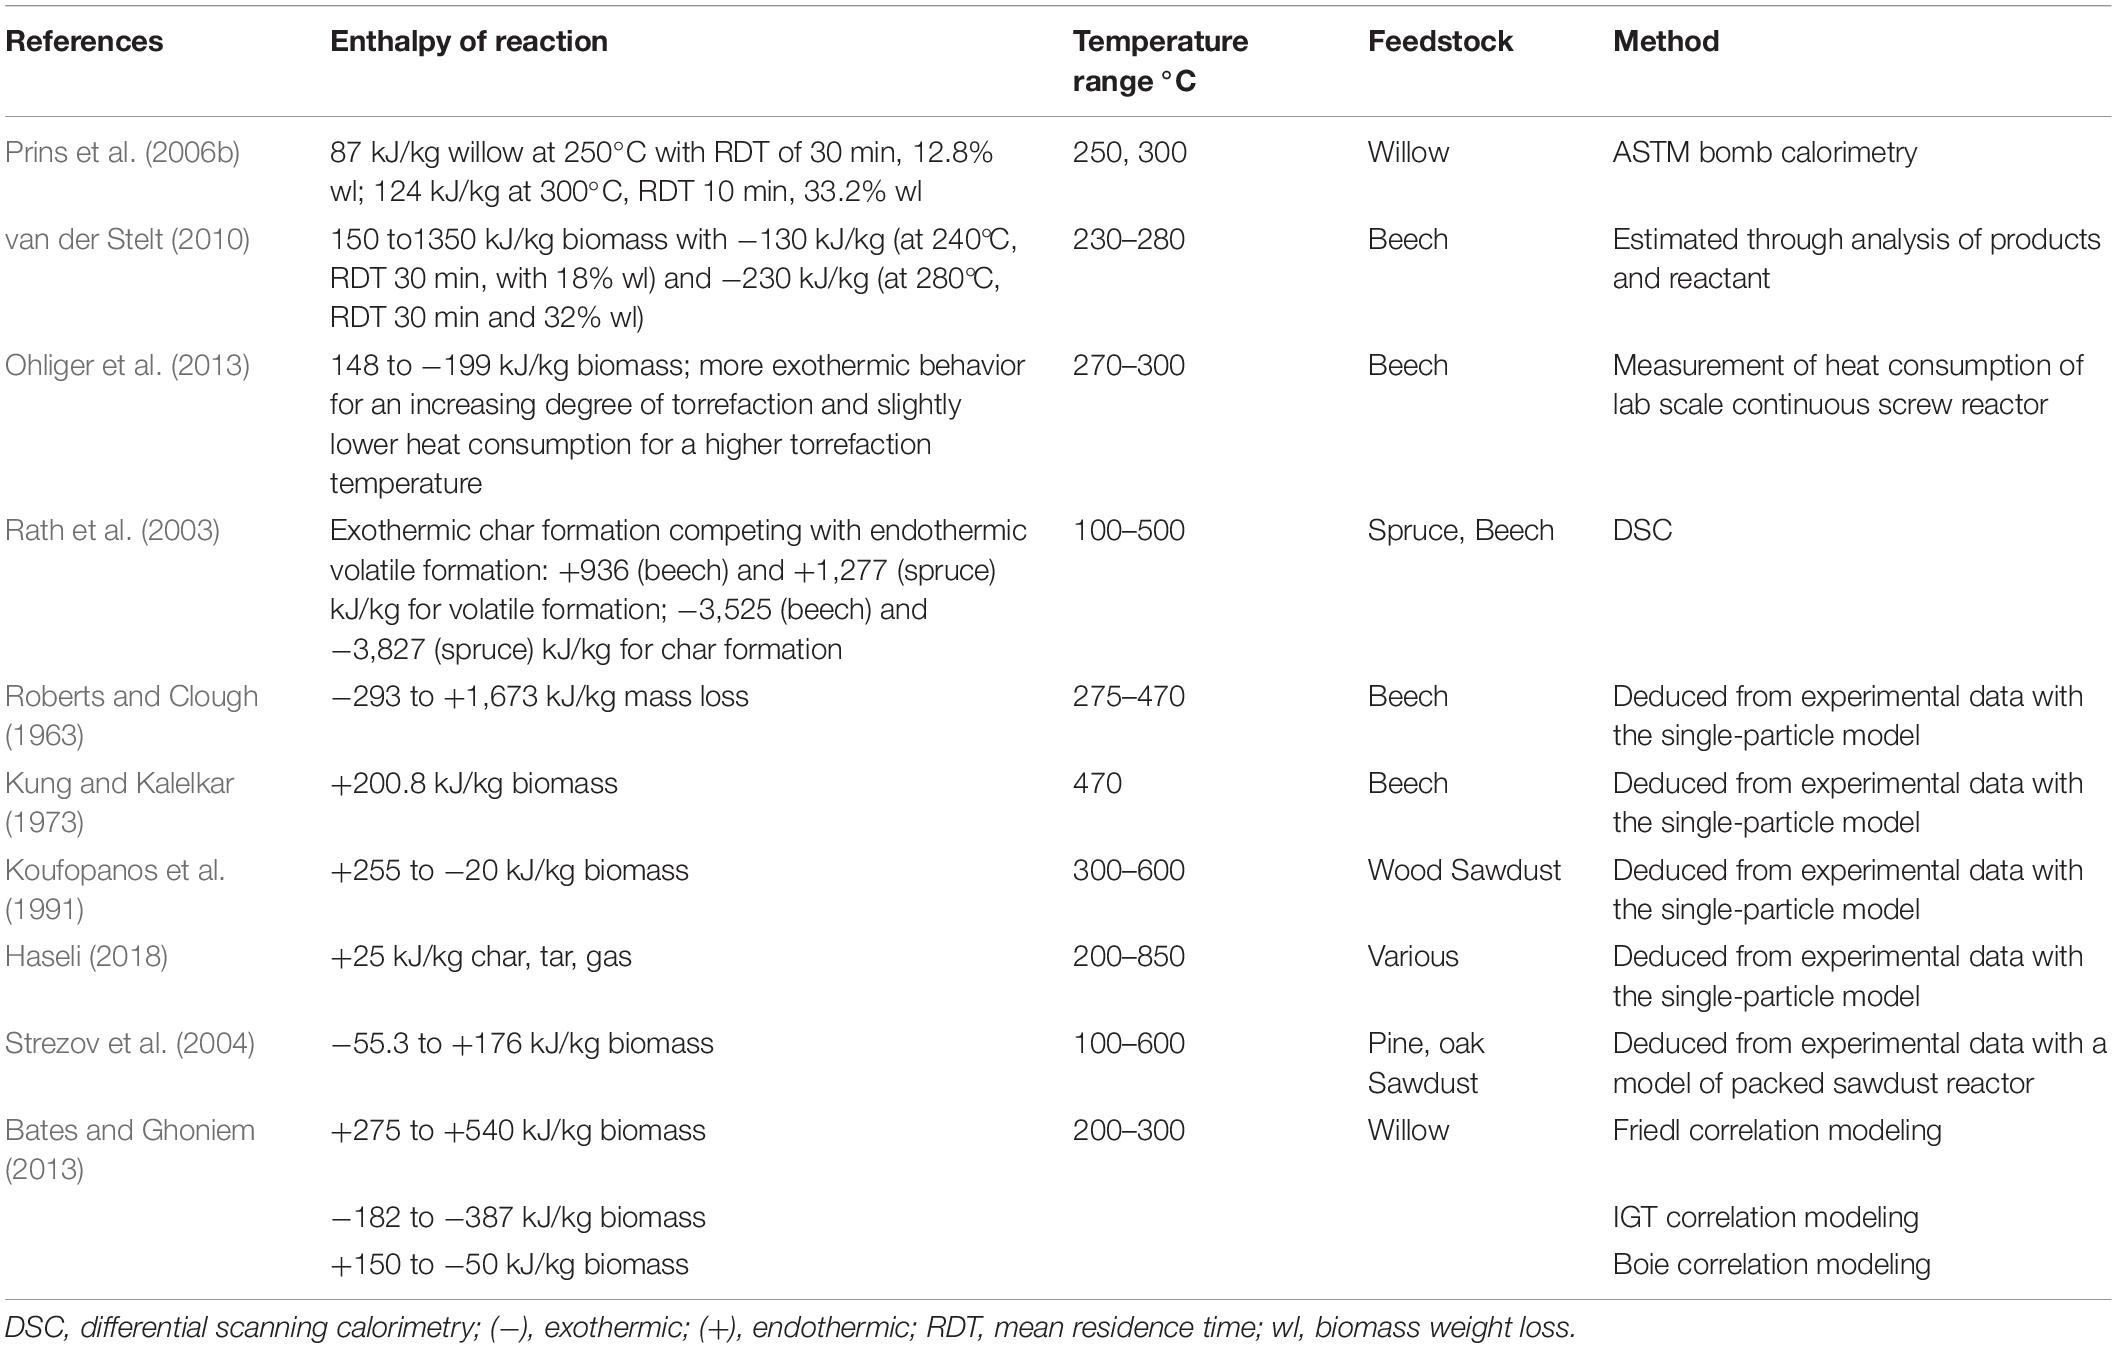
Table 1. Experimentally measured or deduced enthalpy of reaction for torrefaction and pyrolysis.
where βchar is the mass fraction of char in the product with units of (kg char/kg biomass); △Hexo and △Hendo are the exothermic heat of char formation and endothermic heat of volatile formation, respectively.
The same observations are also reported by Mok and Antal (1983), and Milosavljevic et al. (1996). The trends of char formation and volatile formation are highly dependent on operating conditions. Rath et al. reported that in a biomass pyrolysis experiment using differential scanning calorimetry (DSC), the char yield is higher when a larger sample is used, and when the calorimeter sample is covered with a cap. Possibly because the use of a lid hinders the evaporation and diffusion of volatiles, thus enhancing the char formation reactions. Other operating conditions may also enhance char formation, such as rapid heating (Milosavljevic et al., 1996) and at elevated pressure (Mok and Antal, 1983). Many studies observed an apparent shift from endothermic to exothermic behavior as the reaction proceeds (Rath et al., 2003; van der Stelt, 2010; Ohliger et al., 2013; Faleeva et al., 2018), suggesting that during biomass pyrolysis, volatile formation is dominant at the beginning, whereas char formation becomes more important in the later stages.
Drying Heat Requirement
Theoretical energy consumption of the drying process can be estimated as the sum of sensible heat required to raise the temperature of wet biomass to the drying temperature from its initial temperature, and the latent heat required to evaporate the moisture content. The energy required for water evaporation ranges from 2265 (at 100°C, 1 atm) to 2,570 kJ/kg (25°C) water evaporated depending on the wet-bulb temperature (Fushimi et al., 2010).
The actual drying operation typically consumes much more energy than the theoretical value, usually more than 1.5 times of the thermodynamic minimum value. This is due to the barriers or mass transfer resistances to moisture removal: additional heat is required to break the bond and release bonded moisture, heat losses, heat transfer resistances, etc. Various measures are available to improve the energy efficiency of the dryer. One way is to improve the heat and mass transfer rates by using fluidized beds or rotary drums. Another method is to recover latent heat of water. Drying technologies developed to recover the latent heat include multi-stage drying, heat pump drying, and self-heat recuperative drying technologies as shown in Table 2. However, applying advanced drying technologies require additional capital investment.

Table 2. Energy consumption of different advanced drying technologies.
In the current study, for a preliminary analysis, we have considered two types of drying technologies for evaluating the system with the auto-thermal operation: conventional drying technology with drying heat of 3.0 MJ/kg water evaporated, and advanced drying technology with 1.0 MJ/kg water evaporated, respectively.
Results
Torgas HHVs
The composition of combustion flue gases is determined by the composition of the torgas and the combustion conditions, primarily the air/fuel ratio which determines whether combustion is complete or incomplete. The torgas composition is complex, including dozens and even hundreds of individual components, with only the most abundant compounds being identified. Few experimental studies have been reported to evaluate the chemical composition of the torgas at different torrefaction conditions (Bergman et al., 2005; Prins et al., 2006b; Deng et al., 2009; Obernberger and Thek, 2010; Chen et al., 2015b; Wang, 2017). In this study, the torgas HHVs are calculated based on the torgas composition reported by Prins et al. (2006b) (see Table 3). These authors provided relatively complete composition data for the torgas under different torrefaction conditions. The biomass element evolution model developed by Bates and Ghoniem (2012), to be used in this study, is also based on the experimental data of Prins et al. (2006b).
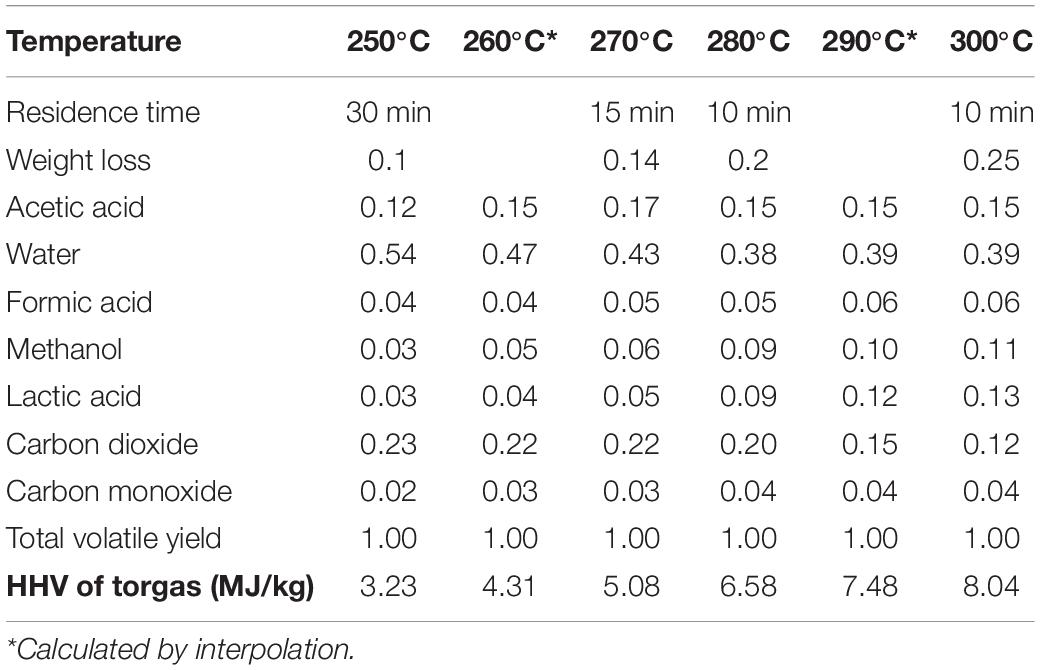
Table 3. Torgas compositions and HHVs at different torrefaction conditions (Prins et al., 2006b).
The torgas HHVs increase with torrefaction temperature and biomass mass loss, due to the decrease in the fraction of the non-combustible components (primarily water and CO2) in the gas mixture. The predicted values and their dependence on temperature compare well with published experimental results (Prins et al., 2006b; van der Stelt, 2010; Bates and Ghoniem, 2012; Hu et al., 2018). van der Stelt (2010) reported values of 1–8 MJ/kg for the lower heating value (LHV) of volatiles produced during beech and willow torrefaction (2010). Prins et al. (2006b) estimated the LHV of torgas ranges from 4.9 to 10.6 MJ/kg. Based on the experimental data of Prins et al. (2006b), Bates and Ghoniem (2012) applied the Boie’s correlation for the HHV and reported that for mass loss between 0 and 50%, the average HHVs of the total volatiles ranges from 4.43 to 10.6 MJ/kg. In this study, the least-square regression of literature HHV data has been carried out to identify the dependence of torgas HHV on torrefaction temperature and weight loss, with Eq. (10) obtained,
where T is the temperature in °C and wl is fractional biomass weight loss during torrefaction.
Biomass HHVs
The composition of solid biomass has been determined based on PROXANAL, ULTANAL, and SULFANAL analysis. The initial biomass composition of the wet biomass is given in Supplementary Appendix A, and the correlations to quantify thermal properties of biomass are provided in Supplementary Appendices B–D. Changes during the drying process are determined by the extent of moisture removal. To represent the development of the biomass composition during torrefaction, C-H-O ternary diagrams are commonly used (Chen et al., 2013). Peduzzi et al. (2014) proposed a linear evolution of the C-H-O element of the torrefied solid as a function of biomass weight loss based on Prins’ and Nocquet et al. (2014) experimental data as shown in Table 4.
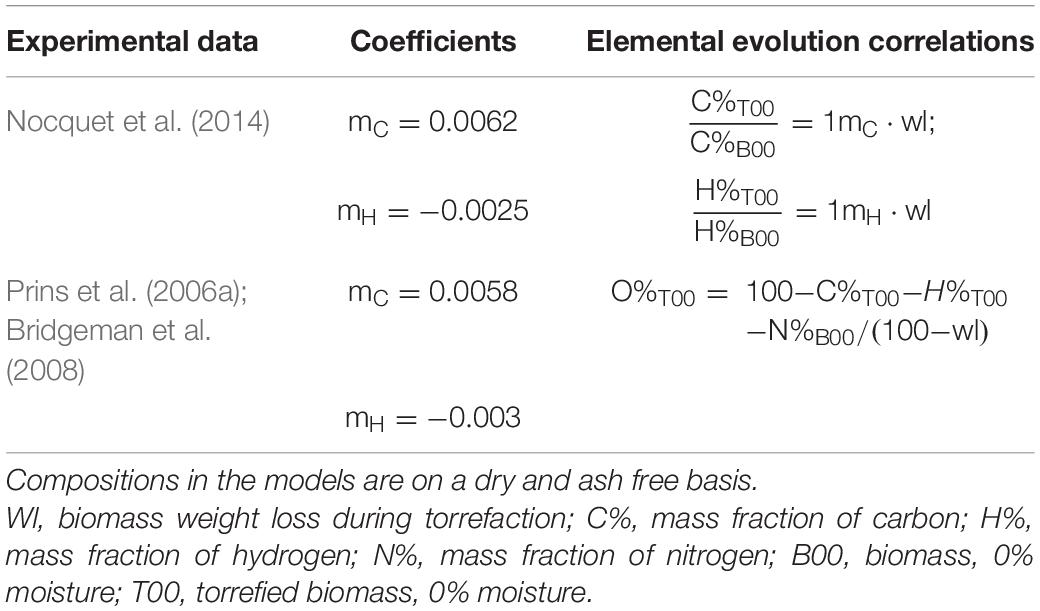
Table 4. Literature reported solid elemental evolution models (Peduzzi et al., 2014).
The torrefied biomass element evolution model of Bates and Ghoniem (2012) is adopted in this study, in which the elemental composition of the biomass was related to the torgas composition and the biomass weight loss reported by Prins et al. (2006b), as shown in Eq. (11).
Where j indicates elements of C, H, O, N, and ash, MFj,biomass is the mass fraction of element j in the dry biomass. MFj,torgas is the mass fraction of element j in the torgas, with the values of 18, 7, 75, 0, and 0% for the element of C, H, O, A, and ash, respectively, obtained by a least-square regression of 18 sets of experimental data from Prins et al. (2006b) and Bates and Ghoniem (2012).
The instantaneous biomass HHVs can be quantified according to the correlations proposed by Boie, Dulong, Grummel, and Davis, Mott and Spooner, and IGT (Supplementary Appendix C). Rönsch and Wagner (2012) compared these correlations and revealed that the correlation developed by Mott and Spooner is the most reliable for wood. Therefore, the Mott and Spooner correlation is used here to estimate the HHV of the solid biomass (see Eq. 12).
Where xdm is the mass fraction of the element on dry and ash free basis, the coefficients are 144.5, 610.2, 40.3, and 31.0 Btu/bl for a1, a2,a3, a4, and a5, respectively. Figure 2 shows the variation of biomass HHV with torrefaction temperature and residence time. The biomass HHV ranges from 22 to 36 MJ/kg due to the increase in carbon content and tends to increase with increasing temperature and residence time. Temperature has a more significant effect on biomass HHV than residence time. The calculated HHV is slightly higher than the experimental value, which is usually around 15 MJ/kg for wood, 22–28MJ/kg for the torrefied wood, and 36 MJ/kg for coal, respectively. This deviation is due to (a) the quantified biomass HHVs here are based on models without allowing heat loss of the biomass combustion, which is not applicable in real operation. Considering a 20% heat loss, the calculated HHV of torgas and biomass will be close to the reported experimental value; and (b) discrepancies between different correlations to quantify biomass HHV: Boie, Dulong, Grummel, and Davis, Mott and Spooner, and IGT correlations predict results significantly different from each other (Kieseler et al., 2013). Ohliger et al. (2013) evaluated the LHV of torrefied beech wood and found that the LHV ranges from 21 to 25.6 MJ/kg and increases when biomass weight loss increases from 0.2 to 0.5.
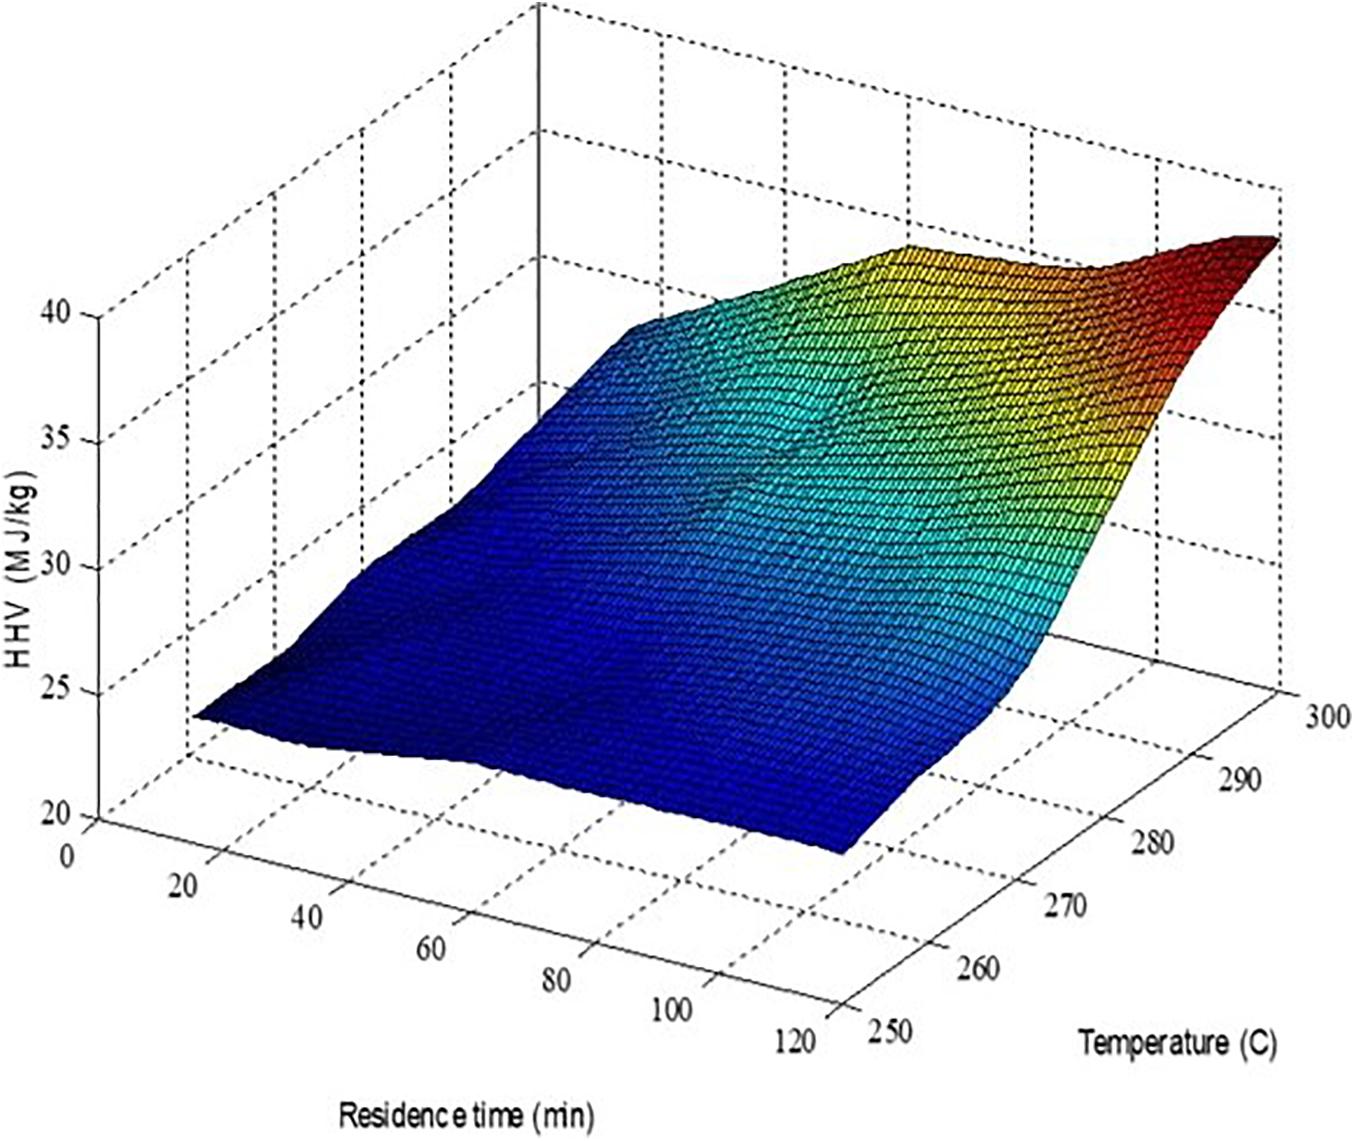
Figure 2. Calculated torrefied biomass HHVs as a function of torrefaction temperature and residence time.
Solid and Volatile Product Energy Yields
The solid product energy yield ηs and the volatile product energy yield ηv are energy efficiency indicators of the biomass fuel production process, which are defined by Eqs. (13) and (14). For a process with solid as the desired product, a higher ηs is expected.
Where HHVdb, HHVtorb, and HHVtorgas indicate the HHVs of the initial dry biomass, the torrefied biomass and the torgas at different torrefaction conditions, respectively.
Figure 3 shows the calculated solid and volatile energy yields from this study and the, other studies. The energy yield of the solid phase in the current study shows a linear decrease with increasing biomass weight loss at 250–300°C, and appears higher than the values in other studies. Here, since torrefied biomass is the desired product, a lower biomass weight loss is preferred, which, however, may lead to lower HHVs of the torgas, so that auto-thermal operation is not achievable. Therefore, there should be a set of torrefaction operating conditions, defined by temperature and weight loss (T, wl) to enable auto-thermal operation. The optimal operation corresponds to conditions within this envelope at which the highest ηs can be achieved, given the torrefied biomass will meet the quality requirement. This topic will be investigated in later sections.
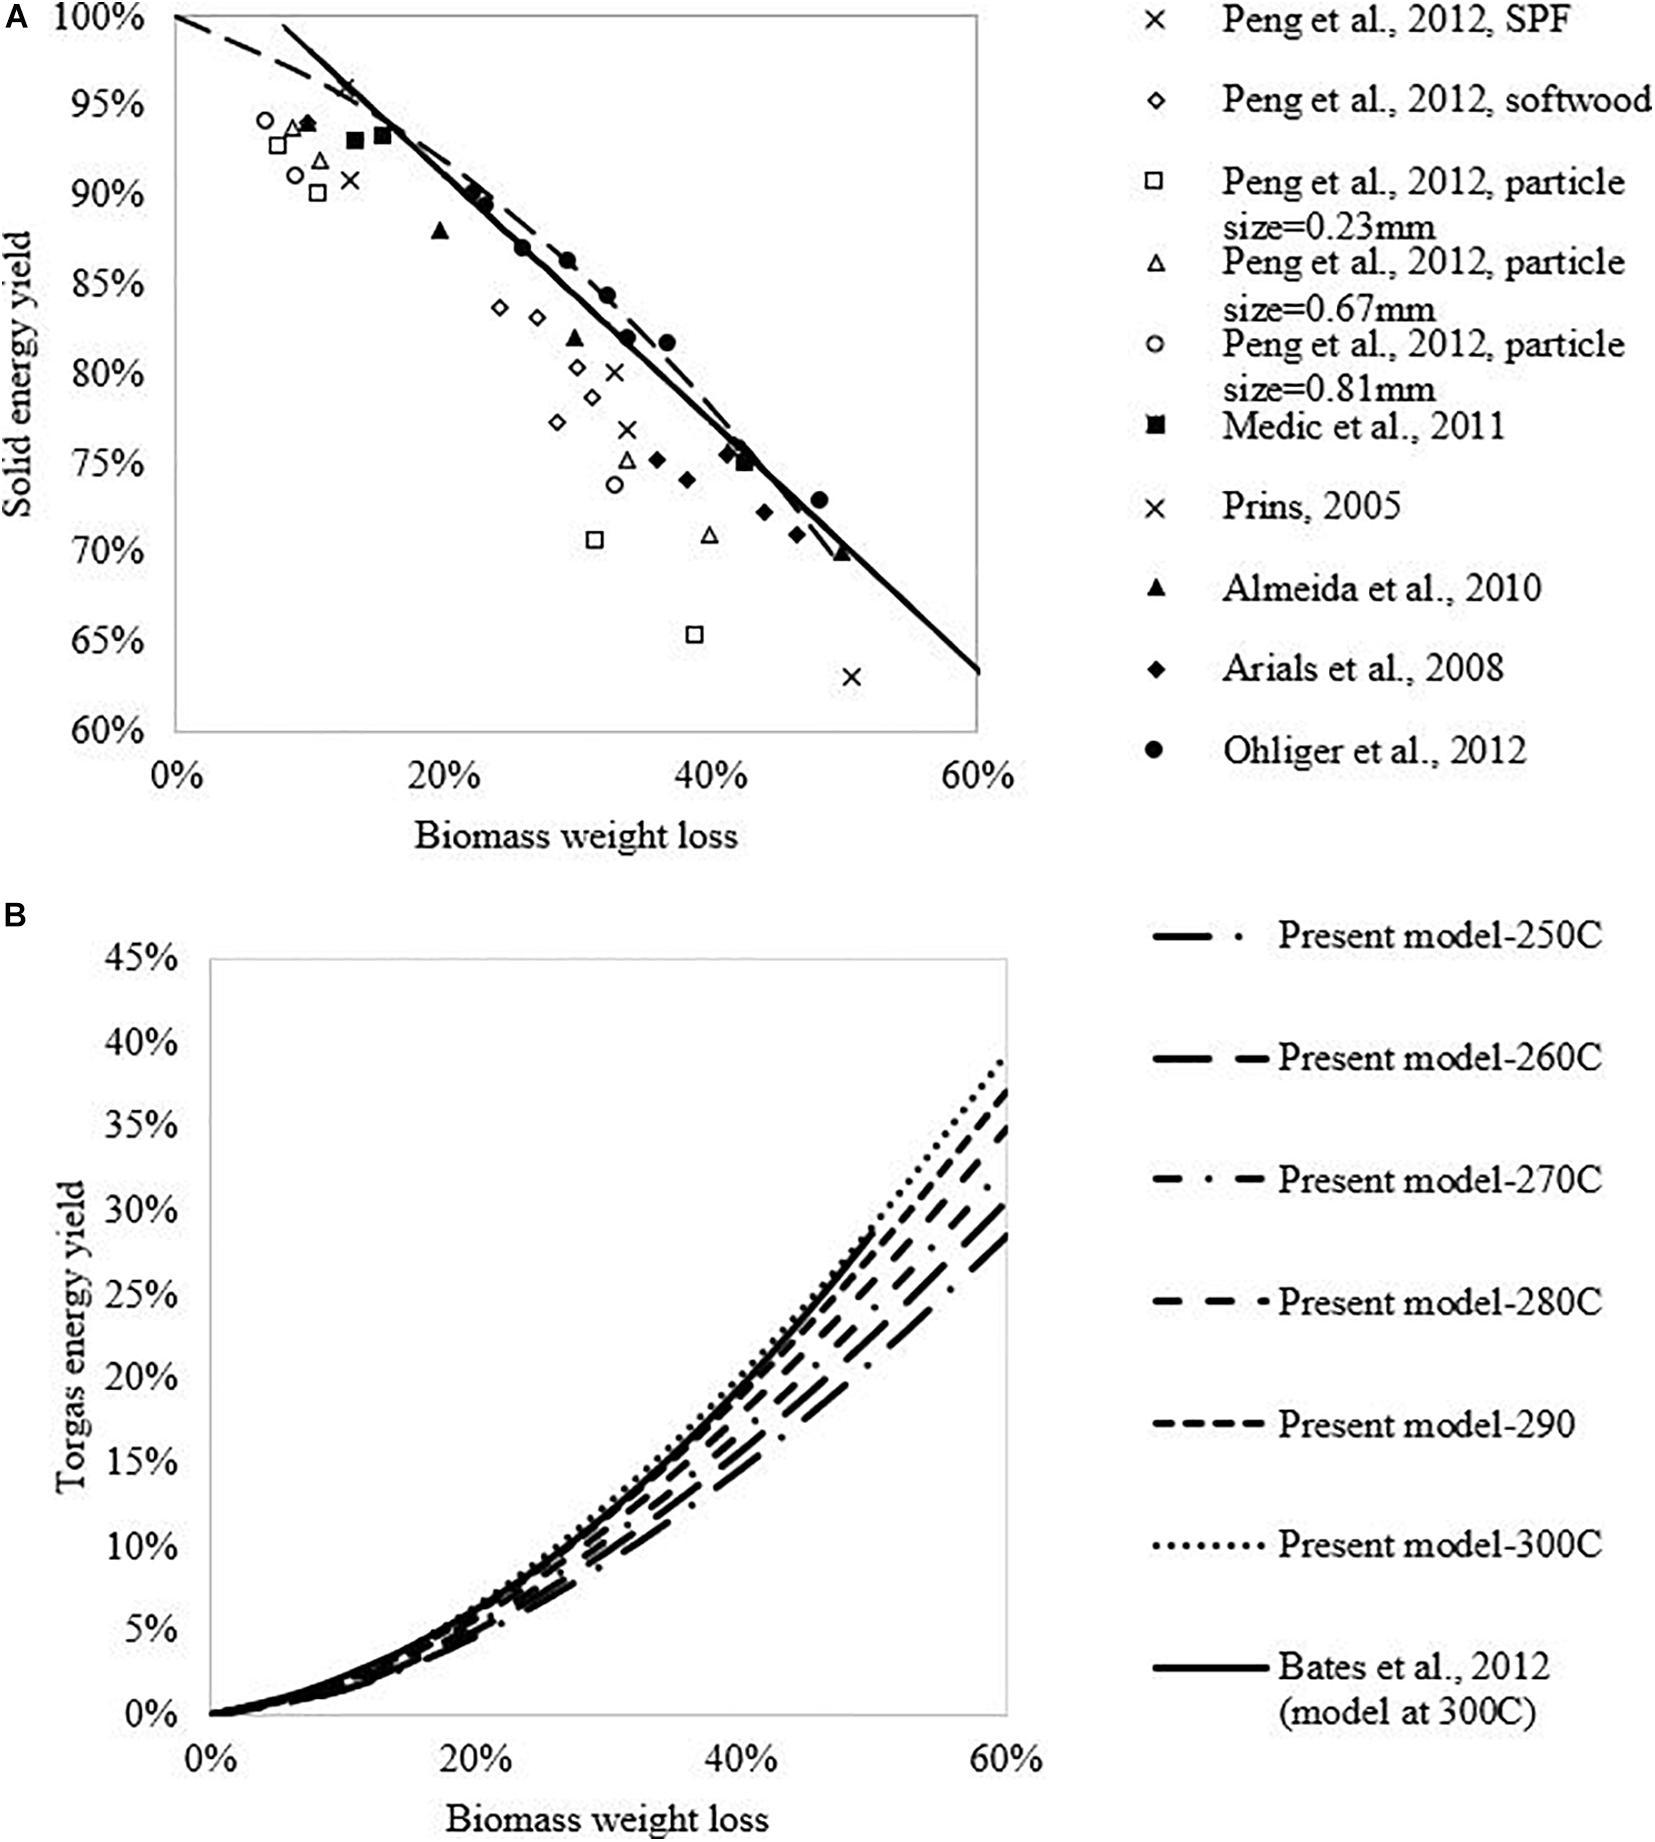
Figure 3. Solid phase and volatile phase energy yields at different biomass weight loss and torrefaction temperature in comparison with the literature data. (A) Solid energy yield; (B) Torgas energy yield.
The volatile energy yields at different torrefaction temperatures are presented in Figure 3B, which increase sharply with increasing biomass weight loss, and the results are comparable to the prediction by Bates and Ghoniem model (2012).
Torrefaction Reaction Heat
The torrefaction reaction heat can be quantified as the sum of standard heat of reaction and the integral of the change in heat capacity (see Eq. 15). The standard heat of reaction can be calculated based on the difference between the standard heat of formation for the products (i.e., char and torgas) and the standard heat of formation for the reactants (dry biomass). The standard heat of formation for solid biomass [] can be quantified based on its HHV, which has been discussed in section “Biomass HHVs.” Quantification of the heat of formation and the specific heat capacity for solid biomass are presented in Supplementary Appendices B, D, respectively. The heat of formation for torgas () can be obtained by the summation of individual compound’s heat of formation, as shown in Eqs. (15) and (16).
Figure 4 shows that the torrefaction heat of reaction has a linear relationship with the biomass weight loss at different torrefaction temperatures: with a positive slope at 250 and 260°C and negative slope at 270, 280, 290, and 300°C. Besides, the overall torrefaction heat appears to be endothermic when torrefaction is conducted at 250–270°C, and exothermic when torrefaction takes place at 280–300°C with biomass weight loss higher than 23%. The phenomenon may be explained by the competition between volatile-forming (endothermic) and char-forming (exothermic) processes: the former is expected to dominate at the beginning of biomass decomposition, while the later dominates when the temperature and biomass weight loss increase. Similar observations have been reported in Rath et al. (2003); Ohliger et al. (2013), Faleeva et al. (2018), and van der Stelt (2010). This study predicts that the shift from endothermic to exothermic reaction occurs at about 23% biomass weight loss, whereas it was observed by Rath et al. to occur at 21% of biomass weight loss at a temperature above 280°C and by Bates and Ghoniem (2012) to occur above 280°C without biomass weight loss specified.

Figure 4. Torrefaction heat at different torrefaction temperature and biomass weight loss.
The linear relationship between torrefaction heat of reaction and biomass weight loss at different temperatures is expressed by Eq. (17), with fitted a and b values summarized in Table 5. It should be noted that torrefaction weight loss increases with increasing torrefaction temperature and residence time. The quantified endothermic and exothermic heat of torrefaction at different temperatures are presented in Table 6.
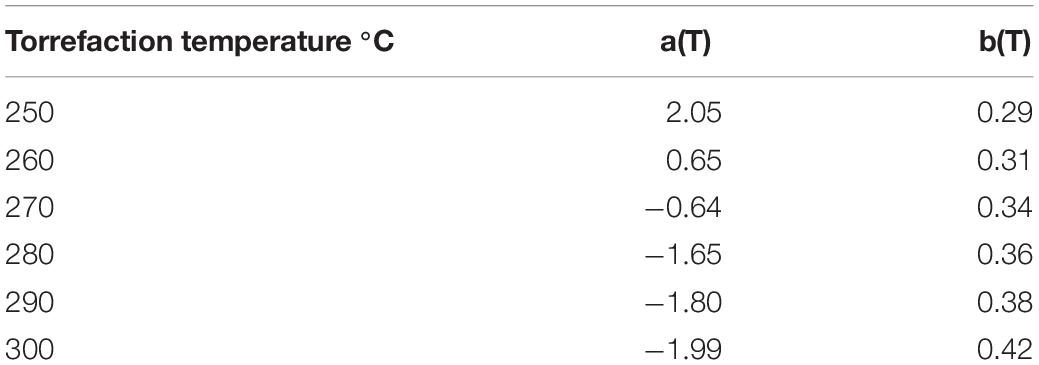
Table 5. Linear correlations between torrefaction reaction heat and weight loss at different temperatures.
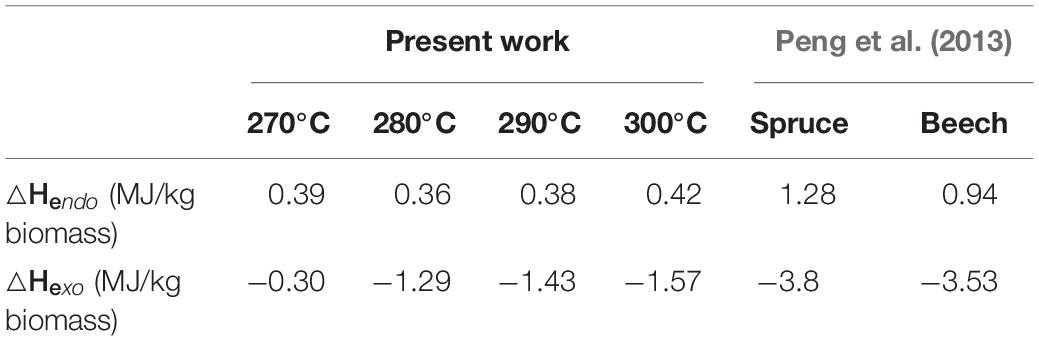
Table 6. Endothermic and exothermic heat of torrefaction reaction at different temperatures in this study and literature data.
Auto-Thermal Operation Boundaries of Torrefaction System
The torrefaction reaction conditions can impact the energy balance of the overall torrefaction process. The auto-thermal operating boundaries are defined as the condition (temperature, biomass weight loss or mean residence time) under which the whole system can be operated auto-thermally without the need of additional thermal energy input. The requirement for auto-thermal operation of the system can be determined by combining Eqs. (8) and (10), leading to Eq. (18).
Here the coefficient a(T) and b(T) at different temperatures are taken from Table 5. 20% of heat losses from wall surface conduction and convection are assumed for the drying, torrefaction, and combustion processes.
Influence of Drying Technology
Figure 5 shows the impact of drying technology on the auto-thermal operation boundaries. The initial biomass moisture content is assumed to be 33 wt%wb, and no N2 is used in the system. It is seen that in comparison with conventional technology, advanced drying technology can help the system achieve auto-thermal operation at lower torrefaction temperature and lower biomass weight loss. For example, if the torrefaction reactor is operated at 300°C, to ensure auto-thermal operation, about 15% of biomass weight loss has to be achieved when advanced drying technology is applied, which would be 23% of biomass weight loss if conventional drying technology is applied. Higher biomass weight loss will lead to a lower char yield, which is not preferred for solid biomass fuel production. Thus, the application of advanced drying technology can help achieve high solid product yield but may increase the use of additional electricity for recovering latent heat of water vapor.
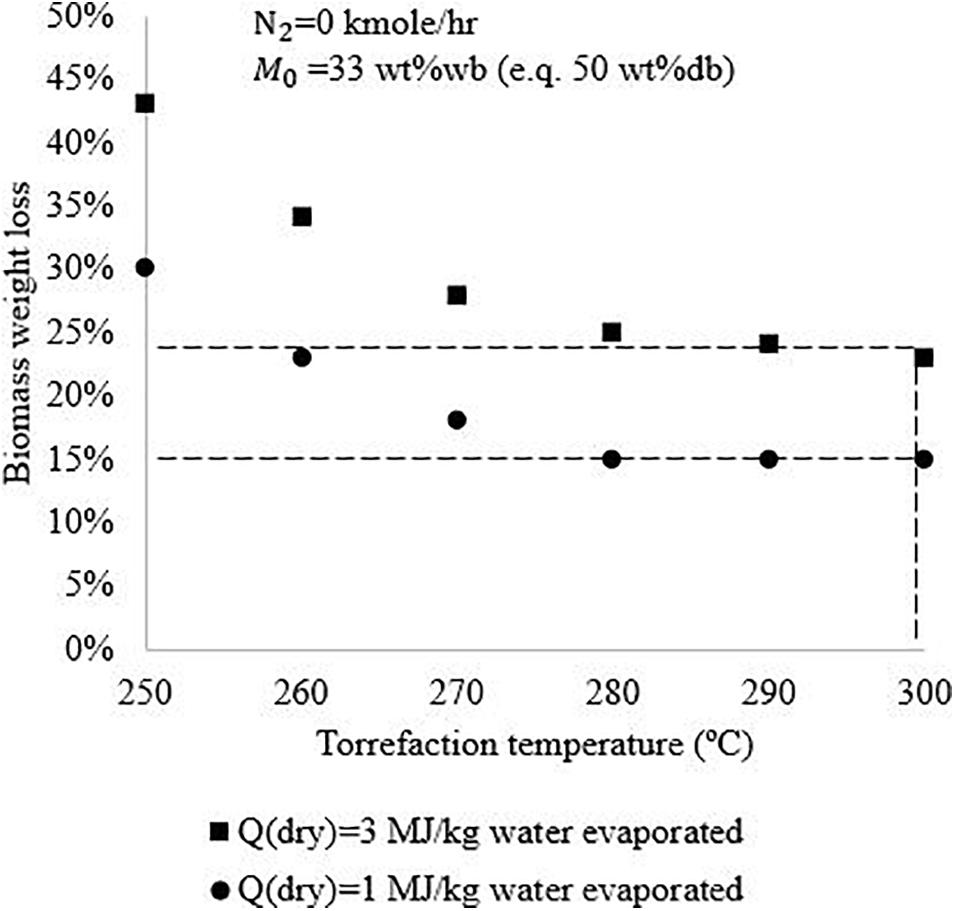
Figure 5. Auto-thermal operation boundaries of biomass torrefaction process using conventional drying technology and advanced drying technology.
Influence of N2 Flow
Figure 6 shows N2 flowrate influences on process auto-thermal operation boundaries. The biomass initial moisture content is assumed to be 33 wt%wb, with the use of conventional drying technology. It is revealed that avoiding use of N2 enables the process enables the process achieve auto-thermal operation at lower torrefaction temperature and lower biomass weight loss. For example, when torrefaction is operated at 300°C, the system can achieve auto-thermal operation with 23% of biomass weight loss without the use of N2, and need 28% of biomass weight loss when N2 is used. The implication is that N2 should be avoided for torrefaction either by selecting reactors which do not require carrying gases (e.g. moving bed or screw reactors) or by recycling non-condensable torgas or combustion flue gases as the carrying gases.
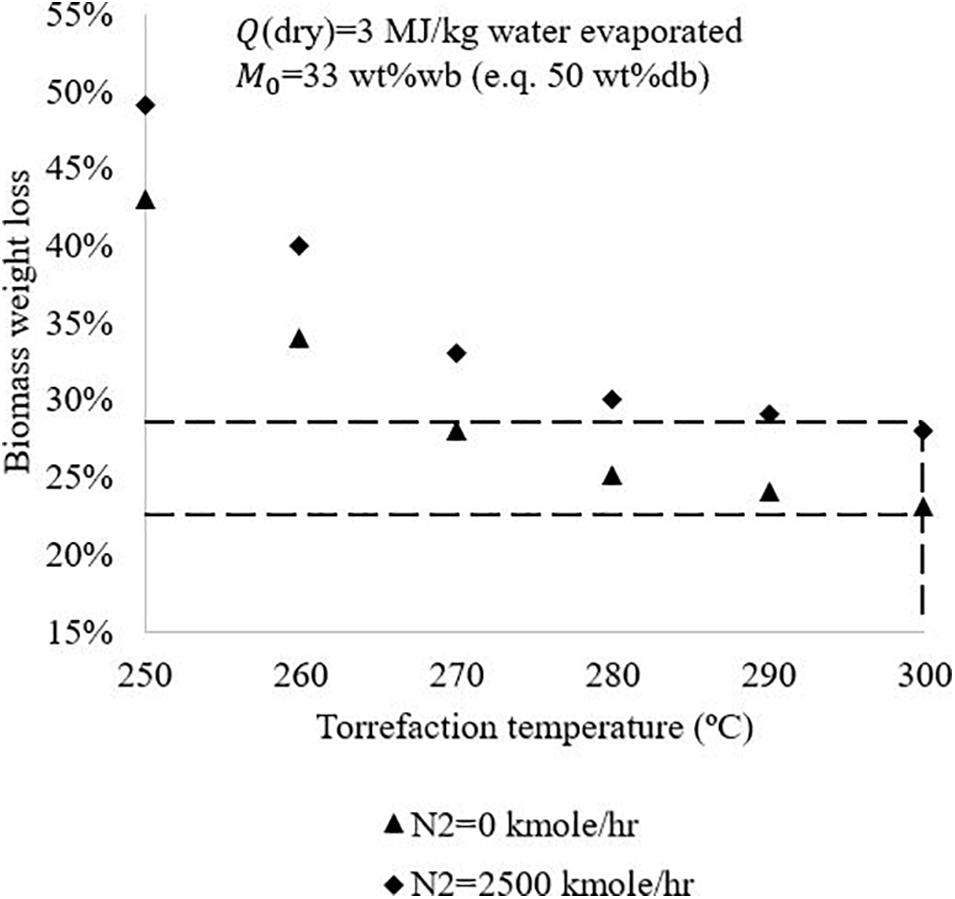
Figure 6. Influence of N2 flowrate used for torrefaction on the torrefaction process auto-thermal boundary.
Impact of Biomass Moisture Content
Biomass initial moisture content determines the amount of water to be removed from the drying process, which in turn will influence the auto-thermal operation boundaries. For given torrefaction conditions and drying technology, it is important to diagnose whether the system can achieve auto-thermal operation for a given biomass feedstock. The maximum moisture content of the biomass Momax on the wet basis at which auto-thermal operation can be achieved with a given drying technology can be calculated by Eq. (19), which can be derived from Eqs. (8) and (18).
Figure 7 shows values for Momax for different drying technologies (a): Q (dry) = 3.0 MJ/kg water evaporated; (b): Q (dry) = 1.0 MJ/kg water evaporated. All the scenarios presented are assumed not to use N2. For example, for a biomass feedstock with 50 wt%wb and with the conventional drying technology, auto-thermal operation can be achieved if torrefaction is operated at 250°C with at least 58% of biomass weight loss, or 280°C with 35% weight loss. If the advanced drying technology is applied as shown in Figure 7B, the system can achieve auto-thermal operation when torrefaction is carried out at 250°C with 38% biomass weight loss. It should be noted that the maximum moisture content Momax would be different for other scenarios with different biomass composition, torrefaction conditions, biomass torrefaction kinetics, drying technology, heat loss, and N2 flowrate. Present work provides a general method to pre-determine whether it is feasible to have the system operated auto-thermally, to assist in selecting appropriate design and operation strategies.
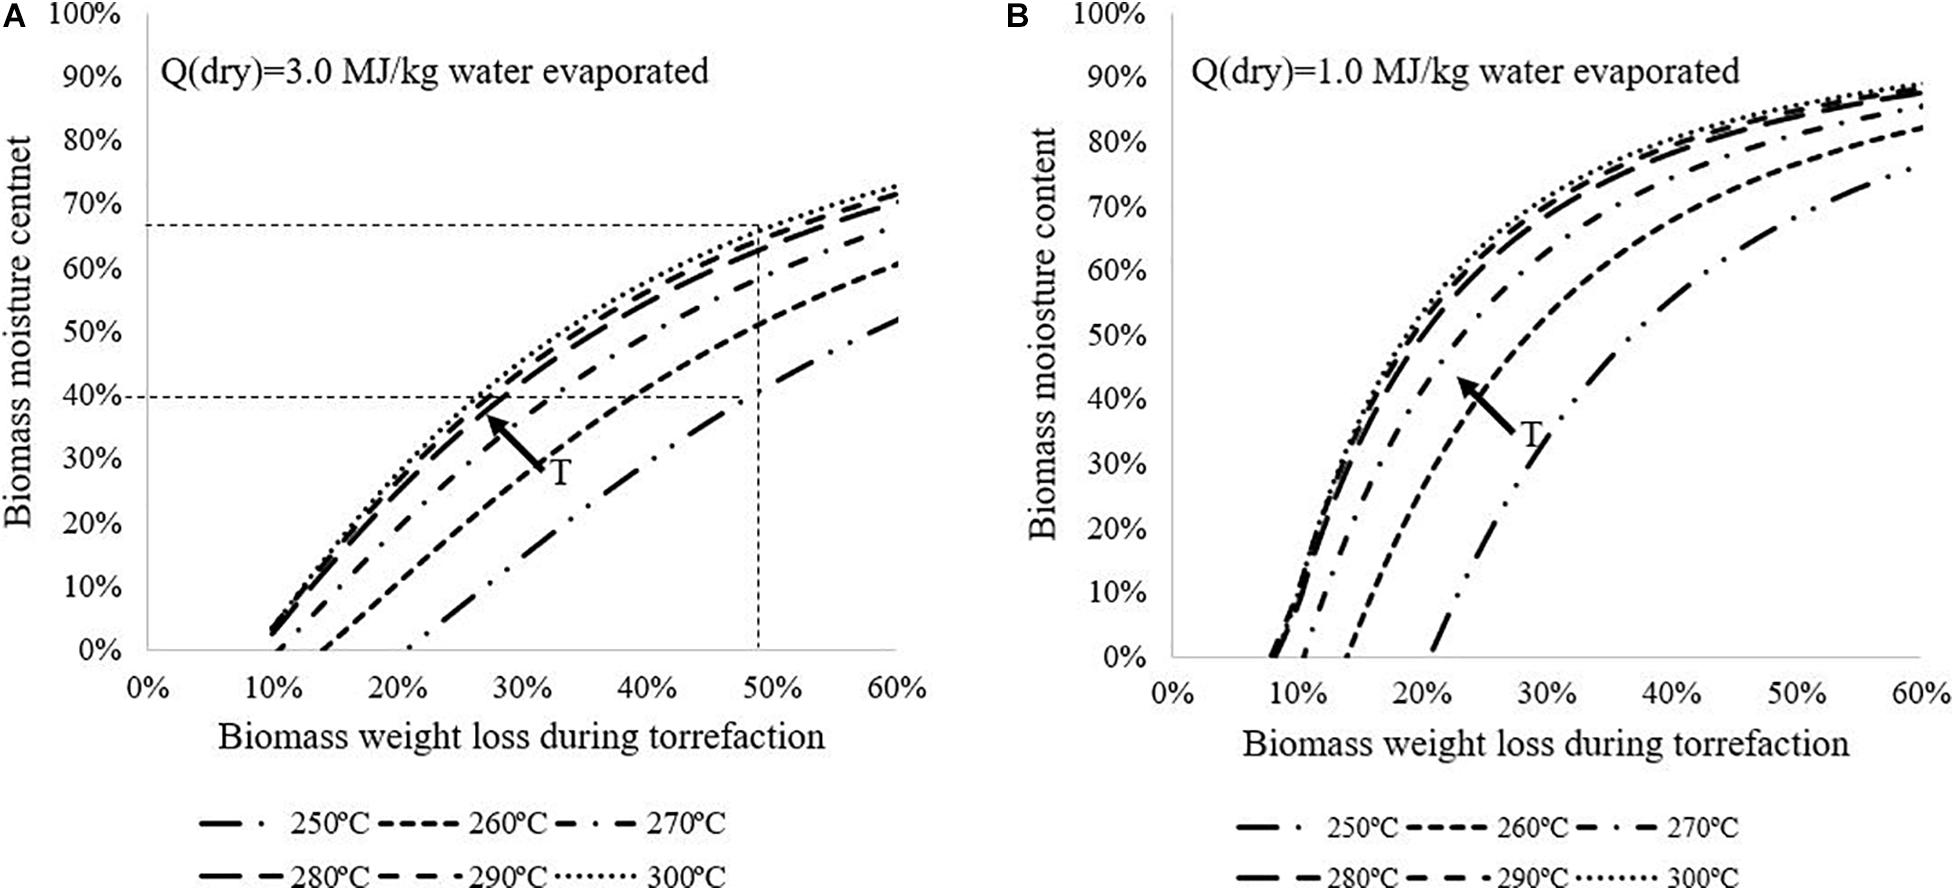
Figure 7. Maximum biomass moisture content (on wet basis) for achieving auto-thermal operation with different drying technologies and torrefaction conditions without N2 use: (A): Q(dry) = 3.0 MJ/kg water evaporated; (B): Q(dry) = 1.0 MJ/kg water evaporated.
Practical Implications and Limitations of This Study
This work provides a general method to investigate the auto-thermal operation boundaries of biomass torrefaction or pyrolysis processes, which is particularly important in design and operation in both pilot and industrial scales, as it can help avoid engineering trials, improve process efficiency and predict product quality reliably and economically. However, the conclusions are limited because (1) torrefaction boundaries vary for different biomass species; and (2) it is a lack of systematically experimental work to investigate the elemental evolutions of biomass in both solid and gas phases during torrefaction and pyrolysis processes. Current work is based on one set of experimental data, which reports torgas compositions at different torrefaction operating conditions. The thermal properties of solid biomass, as well as the torrefaction reaction heat at different torrefaction conditions, are predicted based on developed models. Further experiments are suggested to be carried out to investigate the element changes of biomass in both solid and gas phases and the reaction heat changes at different operating conditions. With adequate experimental work, this work is a mode of compiling data in an effective tool to be used to identify efficient operation envelops of biomass torrefaction process. This work, along with the requirement on product qualities, set general guidelines in the design and operation of such a process.
Conclusion
In this work, auto-thermal operation boundaries of biomass torrefaction or pyrolysis have been defined and investigated. Several key parameters that influence the process auto-thermal operation are analyzed, which include drying technology, biomass initial moisture content, inert N2 gas flowrate, and torrefaction conditions. Torgas and biomass HHVs, as well as the torrefaction reaction heat, are also estimated based on elemental changes.
It is found that torgas HHV and biomass HHV increase with torrefaction temperature and biomass weight loss. Torrefaction reaction heat has a linear relationship with the biomass weight loss, with a positive slope at 250 and 260°C, and a negative slope at 270–300°C, which indicates that the torrefaction shifts from endothermic to exothermic at a torrefaction temperature of ∼270°C when that the endothermic volatile formation reactions are taken over by the exothermic char formation reactions.
Sensitivity analyses of auto-thermal operation revealed that the advanced drying technology can help the system achieve auto-thermal operation at lower torrefaction temperature and residence time, thus leading to a higher process energy efficiency and product yield. Applying inert N2 flow narrows the auto-thermal operation boundaries and should be avoided or replaced.
Overall, the auto-thermal operation of the torrefaction system varies for different biomass species and different process configurations. Approaches from the present work provide a general method to pre-diagnose the potential of auto-thermal for different torrefaction systems.
Data Availability Statement
The datasets presented in this study can be found in online repositories. The names of the repository/repositories and accession number(s) can be found in the article/Supplementary Material.
Author Contributions
HY: conceptualization, methodology, formal analysis, investigation, resources, data curation, writing – original draft, and visualization. ZW: writing – review and editing. RW: writing – review and editing. XB: conceptualization, writing – review and editing, supervision, project administration, and funding acquisition. WC: project administration. All authors contributed to the article and approved the submitted version.
Funding
This work was funded by the Natural Science and Engineering Research Council (NSERC) of Canada, Strategic Partnership Program, #STPGP 493769, and the Chinese Scholar Council (CSC).
Conflict of Interest
ZW was employed by company BC Research Inc. The remaining authors declare that the research was conducted in the absence of any commercial or financial relationships that could be construed as a potential conflict of interest.
Acknowledgments
We were grateful to a scholarship from the Chinese Scholar Council (CSC), a research grant from the Korea Institute of Science and Technology (KIST), and a strategic collaborative grant from Natural Science and Engineering Research Council of Canada (NSERC).
Supplementary Material
The Supplementary Material for this article can be found online at: https://www.frontiersin.org/articles/10.3389/fenrg.2021.636938/full#supplementary-material
References
Anuar, M. S., Al-attab, K. A., and Zainal, Z. A. (2017). Gasifier-torrefier using syngas as the thermal agent. Energy Convers. Manag. 149, 79–86. doi: 10.1016/j.enconman.2017.06.085
Atienza-Martínez, M., Ábrego, J., Mastral, J. F., Ceamanos, J., and Gea, G. (2018). Energy and exergy analyses of sewage sludge thermochemical treatment. Energy 144, 723–735. doi: 10.1016/j.energy.2017.12.007
Bates, R. B., and Ghoniem, A. F. (2012). Biomass torrefaction: modeling of volatile and solid product evolution kinetics. Bioresour. Technol. 124, 460–469. doi: 10.1016/j.biortech.2012.07.018
Bates, R. B., and Ghoniem, A. F. (2013). Biomass torrefaction: modeling of reaction thermochemistry. Bioresour. Technol. 134, 331–340. doi: 10.1016/j.biortech.2013.01.158
Bergman, P. C. A., Boersma, A. R., Zwart, R. W. R., and Kiel, J. H. A. (2005). Torrefaction for Biomass Co-firing in Existing Coal-fired Power Stations. Report ECN-C–05-013. Petten: Energy Research Centre of the Netherlands (ECN).
Bridgeman, T., Jones, J., Shield, I., and Williams, P. (2008). Torrefaction of reed canary grass, wheat straw and willow to enhance solid fuel qualities and combustion properties. Fuel. 87, 844–856. doi: 10.1016/j.fuel.2007.05.041
Brammer, J. G., and Bridgwater, A. V. (1999). Drying technologies for an integrated gasification bio-energy plant. Renew. Sustain. energy Rev. 3, 243–289. doi: 10.1016/S1364-0321(99)00008-8
Chen, L., Dupont, C., Salvador, S., Grateau, M., Boissonnet, G., and Schweich, D. (2013). Experimental study on fast pyrolysis of free-falling millimetric biomass particles between 800 C and 1000 C. Fuel 106, 61–66. doi: 10.1016/j.fuel.2012.11.058
Chen, W. H., Huang, M. Y., Chang, J. S., and Chen, C. Y. (2015a). Torrefaction operation and optimization of microalga residue for energy densification and utilization. Appl. Energy 154, 622–630. doi: 10.1016/j.apenergy.2015.05.068
Chen, W.-H., Peng, J., and Bi, X. T. (2015b). A state-of-the-art review of biomass torrefaction, densification and applications. Renew. Sustain. Energy Rev. 44, 847–866. doi: 10.1016/j.rser.2014.12.039
Chin, K. L., H’ng, P. S., Go, W. Z., Wong, W. Z., Lim, T. W., Maminski, M., et al. (2013). Optimization of torrefaction conditions for high energy density solid biofuel from oil palm biomass and fast growing species available in Malaysia. Ind. Crops Prod. 49, 768–774. doi: 10.1016/j.indcrop.2013.06.007
Cho, J., Davis, J. M., and Huber, G. W. (2010). The intrinsic kinetics and heats of reactions for cellulose pyrolysis and char formation. ChemSusChem 3, 1162–1165. doi: 10.1002/cssc.201000119
Chua, K. J., Chou, S. K., and Yang, W. M. (2010). Advances in heat pump systems: a review. Appl. Energy 87, 3611–3624. doi: 10.1016/j.apenergy.2010.06.014
Deng, J., Wang, G. J., Kuang, J. H., Zhang, Y. L., and Luo, Y. H. (2009). Pretreatment of agricultural residues for co-gasification via torrefaction. J. Anal. Appl. Pyrolysis 86, 331–337. doi: 10.1016/j.jaap.2009.08.006
Director, L. B., and Sinelshchikov, V. A. (2019). Numerical modeling of torrefaction reactor integrated in energy technological complex. Energy 167, 1194–1204. doi: 10.1016/j.energy.2018.11.044
Faleeva, J. M., Sinelshchikov, V. A., Sytchev, G. A., and Zaichenko, V. M. (2018). Exothermic effect during torrefaction. J. Phys. Conf. Ser. 946:012033. doi: 10.1088/1742-6596/946/1/012033
Fushimi, C., Kansha, Y., Aziz, M., Mochidzuki, K., Kaneko, S., Tsutsumi, A., et al. (2010). Novel drying process based on self-heat recuperation technology. Dry. Technol. 29, 105–110. doi: 10.1080/07373937.2010.482719
Gallego, L. J., Cardona, S., Martínez, E., and Rios, L. A. (2020). Valorization of palm-oil residues: integrated production of a good quality bio-coal and electricity via torrefaction. Waste Biomass Valorization 11, 2273–2284. doi: 10.1007/s12649-018-0459-7
Haseli, Y. (2018). Process modeling of a biomass torrefaction plant. Energy Fuels 32, 5611–5622. doi: 10.1021/acs.energyfuels.7b03956
Haseli, Y. (2019). Simplified model of torrefaction-grinding process integrated with a power plant. Fuel Process. Technol. 188, 118–128. doi: 10.1016/j.fuproc.2019.02.008
Hu, Q., Yang, H., Xu, H., Wu, Z., Lim, C. J., Bi, X. T., et al. (2018). Thermal behavior and reaction kinetics analysis of pyrolysis and subsequent in-situ gasification of torrefied biomass pellets. Energy Convers. Manag. 161, 205–214. doi: 10.1016/j.enconman.2018.02.003
Khezami, L., Chetouani, A., Taouk, B., and Capart, R. (2005). Production and characterisation of activated carbon from wood components in powder: cellulose, lignin, xylan. Powder Technol. 157, 48–56. doi: 10.1016/j.powtec.2005.05.009
Kieseler, S., Neubauer, Y., and Zobel, N. (2013). Ultimate and proximate correlations for estimating the higher heating value of hydrothermal solids. Energy Fuels 27, 908–918. doi: 10.1021/ef301752d
Koufopanos, C. A., Papayannakos, N., Maschio, G., and Lucchesi, A. (1991). Modelling of the pyrolysis of biomass particles. Studies on kinetics, thermal and heat transfer effects. Can. J. Chem. Eng. 69, 907–915. doi: 10.1002/cjce.5450690413
Kung, H. C., and Kalelkar, A. S. (1973). On the heat of reaction in wood pyrolysis. Combust. Flame 20, 91–103. doi: 10.1016/S0010-2180(73)81260-X
Lee, S. M., and Lee, J. W. (2014). Optimization of biomass torrefaction conditions by the gain and loss method and regression model analysis. Bioresour. Technol. 172, 438–443. doi: 10.1016/j.biortech.2014.09.016
Liu, Y., Aziz, M., Kansha, Y., and Tsutsumi, A. (2012). Drying energy saving by applying self-heat recuperation technology to biomass drying system. Chem. Eng. Trans. 29, 577–582. doi: 10.3303/CET1229097
Mcnamee, P., Adams, P. W. R., McManus, M. C., Dooley, B., Darvell, L. I., Williams, A., et al. (2016). An assessment of the torrefaction of North American pine and life cycle greenhouse gas emissions. Energy Convers. Manag. 113, 177–188. doi: 10.1016/j.enconman.2016.01.006
Milosavljevic, I., Oja, V., and Suuberg, E. M. (1996). Thermal effects in cellulose pyrolysis: relationship to char formation processes. Ind. Eng. Chem. Res. 35, 653–662. doi: 10.1021/ie950438l
Mobini, M., Meyer, J. C., Trippe, F., Sowlati, T., Fröhling, M., and Schultmann, F. (2014). Assessing the integration of torrefaction into wood pellet production. J. Clean. Prod. 78, 216–225. doi: 10.1016/j.jclepro.2014.04.071
Mok, W. S. L., and Antal, M. J. (1983). Effects of pressure on biomass pyrolysis. II. Heats of reaction of cellulose pyrolysis. Thermochim. Acta 68, 165–186. doi: 10.1016/0040-6031(83)80222-6
Mujumdar, A. S. (2004). Research and development in drying: recent trends and future prospects. Dry. Technol. 22, 1–26. doi: 10.1081/DRT-120028201
Nanou, P., Carbo, M. C., and Kiel, J. H. A. (2016). Detailed mapping of the mass and energy balance of a continuous biomass torrefaction plant. Biomass Bioenergy 89, 67–77. doi: 10.1016/j.biombioe.2016.02.012
Nocquet, T., Dupont, C., Commandre, J. M., Grateau, M., Thiery, S., and Salvador, S. (2014). Volatile species release during torrefaction of wood and its macromolecular constituents: part 1 – experimental study. Energy 72, 180–187. doi: 10.1016/j.energy.2014.02.061
Obernberger, I., and Thek, G. (2010). The Pellet Handbook: The Production and Thermal Utilisation of Biomass Pellets, 1st Edn. London: Routledge.
Ohliger, A., Förster, M., and Kneer, R. (2013). Torrefaction of beechwood: a parametric study including heat of reaction and grindability. Fuel 104, 607–613. doi: 10.1016/j.fuel.2012.06.112
Peduzzi, E., Boissonnet, G., Haarlemmer, G., Dupont, C., and Maréchal, F. (2014). Torrefaction modelling for lignocellulosic biomass conversion processes. Energy 70, 58–67. doi: 10.1016/j.energy.2014.03.086
Peng, J. H., Bi, X. T., Sokhansanj, S., and Lim, C. J. (2013). Torrefaction and densification of different species of softwood residues. Fuel 111, 411–421. doi: 10.1016/j.fuel.2013.04.048
Prins, M. J., Ptasinski, K. J., and Janssen, F. J. J. G. (2006a). More efficient biomass gasification via torrefaction. Energy 31, 3458–3470. doi: 10.1016/j.energy.2006.03.008
Prins, M. J., Ptasinki, K. J., and Janssen, F. J. J. G. (2006b). Torrefaction of wood Part 2. Analysis of products. J. Anal. Appl. Pyrolysis 77, 35–40. doi: 10.1016/j.jaap.2006.01.001
Rahman, M. S., Perera, C. O., and Thebaud, C. (1997). Desorption isotherm and heat pump drying kinetics of peas. Food Res. Int. 30, 485–491. doi: 10.1016/S0963-9969(98)00009-X
Rath, J., Wolfinger, M. G., Steiner, G., Krammer, G., Barontini, F., and Cozzani, V. (2003). Heat of wood pyrolysis. Fuel 82, 81–91. doi: 10.1016/S0016-2361(02)00138-2
Roberts, A. F., and Clough, G. (1963). Thermal decomposition of wood in an inert atmosphere. Symp. Combust. 9, 158–166. doi: 10.1016/S0082-0784(63)80022-3
Rönsch, S., and Wagner, H. (2012). Calculation of Heating Values for the Simulation of Thermo-Chemical Conversion Plants with Aspen Plus. leipzig: Deutsches Biomasseforschungszentrum.
Sermyagina, E., Saari, J., Kaikko, J., and Vakkilainen, E. (2016). Integration of torrefaction and CHP plant: operational and economic analysis. Appl. Energy 183, 88–99. doi: 10.1016/j.apenergy.2016.08.151
Strezov, V., Moghtaderi, B., and Lucas, J. A. (2004). Computational calorimetric investigation of the reactions during thermal conversion of wood biomass. Biomass Bioenergy 27, 459–465. doi: 10.1016/j.biombioe.2004.04.008
van der Stelt, M. J. C. (2010). Chemistry and Reaction Kinetics of Biowaste Torrefaction. Ph.D. Thesis, Technische Universiteit Eindhoven, Eindhoven.
Wang, Z. (2017). Biomass Torrefaction in Slot-Rectangular Spouted Beds. Ph.D. Thesis, University of British Columbia, Vancouver, BC.
Wang, Z., Li, H., Lim, C. J., and Grace, J. R. (2018a). Oxidative torrefaction of spruce-pine-fir sawdust in a slot-rectangular spouted bed reactor. Energy Convers. Manag. 174, 276–287. doi: 10.1016/J.ENCONMAN.2018.08.035
Wang, Z., Lim, C. J., and Grace, J. R. (2018b). Biomass torrefaction in a slot-rectangular spouted bed reactor. Particuology 42, 154–162. doi: 10.1016/J.PARTIC.2018.02.002
Yang, H., Yan, R., Chen, H., Lee, D. H., and Zheng, C. (2007). Characteristics of hemicellulose, cellulose and lignin pyrolysis. Fuel 86, 1781–1788. doi: 10.1016/j.fuel.2006.12.013
Keywords: biomass, torrefaction, auto-thermal operation, heat integration, energy balance, elemental changes, auto-thermal operation boundaries
Citation: Yun H, Wang Z, Wang R, Bi X and Chen W (2021) Identification of Suitable Biomass Torrefaction Operation Envelops for Auto-Thermal Operation. Front. Energy Res. 9:636938. doi: 10.3389/fenrg.2021.636938
Received: 02 December 2020; Accepted: 01 March 2021;
Published: 23 March 2021.
Edited by:
Mohammad Rehan, King Abdulaziz University, Saudi ArabiaReviewed by:
Young-Kwon Park, University of Seoul, South KoreaCheng Tung Chong, Shanghai Jiao Tong University, China
Muhammad Amjad, University of Engineering and Technology, Lahore, Pakistan
Copyright © 2021 Yun, Wang, Wang, Bi and Chen. This is an open-access article distributed under the terms of the Creative Commons Attribution License (CC BY). The use, distribution or reproduction in other forums is permitted, provided the original author(s) and the copyright owner(s) are credited and that the original publication in this journal is cited, in accordance with accepted academic practice. No use, distribution or reproduction is permitted which does not comply with these terms.
*Correspondence: Xiaotao Bi, dG9ueS5iaUB1YmMuY2E=; eGJpQGNoYmUudWJjLmNh
†These authors share first authorship