
95% of researchers rate our articles as excellent or good
Learn more about the work of our research integrity team to safeguard the quality of each article we publish.
Find out more
ORIGINAL RESEARCH article
Front. Energy Res. , 25 March 2021
Sec. Smart Grids
Volume 9 - 2021 | https://doi.org/10.3389/fenrg.2021.634912
This article is part of the Research Topic Flexible and Active Distribution Networks View all 16 articles
 Shengxia Cai*
 Ying Li
The efficient application of battery energy storage system (BESS) technology can effectively alleviate the uncertainty and volatility caused by distributed generations (DGs) and loads, and reduce their adverse effects on the power grid. More efficient applications could delay equipment capacity upgrades, improve equipment utilization, save costs, and increase the system hosting capacity for renewable energy. However, the application of BESS is restricted by its high cost and limited policy support. It is, therefore, necessary to carry out an economic evaluation of BESS, considering its flexibility and improvement of reliability, alongside incentive policy research to promote its deployment. This study on BESS involves four key aspects: 1) It proposes a reliability-benefit model for BESS, considering the value of electricity in the national economy. 2) It describes a flexibility improvement benefit calculation model for BESS, built with the definition of flexibility indexes of distribution network related to BESS, and considering the capacity, charge, and discharge constraints. 3) A reliability improvement benefit calculation model of BESS was built, and the present study proposes a detailed calculation flow of economic evaluation model for BESS users considering net present value (NPV) index and dynamic payback period (DPP) index. 4) An impact analysis of different prices and incentive policies on BESS business models is also carried out, with the present study finally presenting an incentive policy based on flexibility and reliability improvement. The results of the IEEE 33-node test system show that flexibility and reliability improvement can effectively reflect the benefit and cost of BESS, and that incentive policies can help to promote the development of BESS technology.
Along with the expansion of industry on a global scale, comes excessive energy consumption, environmental degradation, and global warming, which seriously affect humans and the development of society. Traditional fossil energy generation has brought about an increasingly serious energy consumption crisis and problems of environmental pollution (Zhang et al., 2017; Xiao et al., 2018; Yang et al., 2018). In the face of global energy and environmental constraints, many countries have put energy conservation and energy efficiency in the foremost strategic position, making full use of as many renewable energies as possible to promote the efficient and clean use of energy. Future power grids need to be flexible enough to adapt to the new situation of high penetration of renewable energy, multiple uncertain perturbations, even various natural and man-made disasters (Shao et al., 2017). Energy storage is one of the key technologies for a future power grid with high penetration of renewable energy due to its capability to separate the production and consumption of electrical energy from time and space (Li and Hedman, 2015). Rational use of energy storage to achieve multiple functional values can effectively mitigate the uncertainty and volatility caused by distributed generations (DGs) and loads, reducing the impact on the grid, and potentially delaying equipment capacity upgrades, improving equipment utilization, and saving costs (Kuleshov et al., 2019), which play a catalytic role in enhancing the flexibility of the distribution network.
Research and economic analysis of battery energy storage systems (BESS) have been carried out in terms of the method and intensity of subsidies (Fang et al., 2018), operating and maintenance costs (Bruninx et al., 2016), comprehensive environmental and other benefits (Lee et al., 2011), and the economy of participating in grid regulation (Yang et al., 2020). The literature (Li and Hedman, 2015) establishes an economic evaluation model for BESS with high penetration of renewable energy. The average cost of conventional generation is reduced when the system is connected to BESS, and BESS can increase the utilization of conventional power generation in the system. Other studies (Mahmoodi et al., 2015) have established the economics of microgrid systems where BESS participates in the regulation, and the proposed strategy could achieve the lowest cost operation of the system. Literature (Yan et al., 2016) establishes a costing model for grid power generation that includes BESS, which effectively reduces the operating cost of the system. Other literature on the subject (Xu and Tong, 2017) investigates the economic value of BESS, operated by a consumer who seeks to maximize the long-term expected payoff (utilities perceived from energy consumption minus energy cost) and define the value of storage as net benefits to the consumer obtained by optimally operating the storage.
Due to its flexible power input/output characteristics (Zhang et al., 2018), BESS is widely and flexibly applied on the grid side, user side, and power supply side, which can effectively achieve demand-side management (Shu and Jirutitijaroen, 2014), eliminate peak and valley differences between day and night (Lu et al., 2009), smooth load and power fluctuations (Bitaraf and Rahman, 2018), improve power equipment utilization, and reduce power supply costs (Cleary et al., 2015). The rapid development of BESS technology provides power systems with greater flexibility, safety, higher power quality, and self-healing capabilities. Literature (Kuleshov et al., 2019) evaluates the economic attractiveness of BESS and identifies the conditions under which solar BESS can operate profitably. Another study (Maghouli et al., 2016) considers the uncertainty of wind turbines in assessing the impact of BESS on the system, and the inclusion of BESS saves the operating costs of the system and increases the flexibility of the grid. In a study by Huang and Wang (2016), a value assessment methodology was proposed for BESS that aimed to facilitate large-scale PV energy access. The results show that energy storage can alleviate the grid modification workload and power constraints associated with large-scale distributed PV grid connections. Other literature by You et al. (2016) investigated the flexible economic dispatch of hydrogen BESS.
In order to promote the development of energy storage, many countries have introduced incentive policies. The United States has introduced the Better Energy Storage Technology Act, Best and the Promotional Grid Storage Act of 2019 to reduce costs and extend the life of energy storage systems. This policy focuses on the research and development of grid-scale energy storage systems and developed a battery recycling incentive to collect, store and transport waste lithium-ion batteries to promote sustainable energy development. The United Kingdom Department for Business, Energy and Industrial Strategy has invested heavily in the cost of energy storage, developing projects to improve the intelligence and flexibility of the grid, and has published the strategic report, Upgrading our Energy System: Smart Systems and Flexibility Plan (Ofgem, 2017). Currently, the energy storage market policy has entered the “post-guidance” stage, and the future commercialization and scale-up of energy storage in China will require strong support from policy and the market.
The main contributions of this paper are first, that it proposes a reliability-benefit model for BESS, considering the value of electricity in the national economy. A flexibility improvement benefit calculation model of BESS was then built with the definition of flexibility indexes of distribution networks related to BESS, considering capacity and charge and discharge constraints. A reliability improvement benefit calculation model of BESS was built with the detailed calculation flow presented, considering the net present value (NPV) index and dynamic payback period (DPP) index. Finally, the impact analysis of different prices and incentive policies on the BESS business models is carried out, and the incentive mechanism and policy based on flexibility and reliability improvement is presented.
The rest of the paper is organized as follows. Benefit/Cost Evaluation of BESS in Distribution Network introduces the benefit/cost evaluation of BESS in a distribution network. Economic Evaluation and Optimization of BESS Allocation Considering its Value on Flexibility and Reliability Improvement proposes the economic evaluation of BESS considering its flexibility and reliability values. Economic Evaluation of BESS Considering its Flexibility and Reliability Improvement Benefits discusses the case study, results, and incentive policy before Incentive Mechanism and Policy for BESS Based on Economic Evaluation Considering its Flexibility and Reliability Improvement Benefits outlines conclusions.
The roles that the BESS system plays in a distribution network can be summarized in terms of energy dimension, time dimension, and place dimension, respectively. From the perspective of the energy dimension, it plays a role in power, electricity, and capacity support. From the perspective of time, it plays a role in static, dynamic, and instantaneous energy transfer support. From the perspective of place, it plays a role in the source, the user, and in grid support. Many benefits can be brought from BESS. In this paper, we focus on its benefits for flexibility and improving the reliability of the distribution network.
The BESS deployment can improve the flexibility of the distribution network via the revenue from the auxiliary service of peak dispatching.
The flexibility improvement benefit for peak dispatching Ffle is:
where Ffle,dis, Cfle,ch are the benefit of BESS discharging and the cost of BESS charging, respectively.
The mathematical model for the benefit of BESS discharging Ffle,dis is:
where Pdis,jk, is the power of the kth discharge of BESS j. Tdis,jk is the time of the kth discharge of BESS j, and Fdis,jk is the unit discharge benefit of the kth discharge of BESS j.
The mathematical model for the cost of BESS charging Cfle,ch is as follows:
where M is the number of BESS, Kj is the number of charging periods per day of BESS j. Pch,jk is the time of the kth charge of BESS j. Tch,jk is the time of the kth charge of BESS j and Cch,jk is the unit charge cost of the kth charge of BESS j.
The BESS deployment can also improve the reliability of the distribution network. The reliability benefits of BESS in the distribution network are mainly reflected in reduced outage losses when a system failure occurs. BESS can supply power to the load in a timely manner, which improves the reliability of load points. The reliability improvement benefit Frel of BESS is as follows:
where n is the number of load points. Nj is the number of outages at load point j.
The capital costs of BESS for primary investment construction usually consist of two parts: the cost of a storage unit and the cost of the Power Conversion System (PCS).
where CIN is the capital cost of BESS for investment. NESS is the number of BESS; CQ and CP are the cost of per capacity storage unit (Yuan/kWh) and the cost of unit power of PCS (Yuan/kW) respectively; Qi and Pi are the capacity and the rated power of the ith BESS.
Harmonize the time scales and discount the annual operation and maintenance (O&M) costs to present value considering the time value of money as follows.
where CO&M is the present value of the O&M cost of the BESS.
The impact of BESS on distribution network flexibility is studied from the perspective of two aspects of the flexible adequacy of the distribution network capacity and the voltage deviation at the nodes with the BESS involvement. Hence, the following two indicators, line capacity margin and node voltage deviation rate, are proposed to reflect the flexibility of regulating node voltage in distribution lines and distribution networks.
The distribution line capacity margin reflects the upward flexibility of the distribution line to load fluctuations
where
The overall node deviation reflects the node voltage quality in one unit of time in the distribution network.
where
To study the impact of BESS on the flexibility of the distribution network, we consider the BESS
where
The first objective function is the total cost of the system operation, including the cost of purchasing power from the grid, the cost of grid losses, and the cost of BESS devices operating.
where T is the total number of dispatching hours, T = 24 h.
The second objective function is the node voltage deviation.
where
(1) Charge state constraints of BESS
where
(2) Flexibility constraints
(3) Power flow constraints
where
(4) Node voltage constraints
where Vi,min and Vi,max are the minimum and maximum value of node voltage, respectively.
The BESS deployment can improve the reliability of the distribution network via the formation of a microgrid or isolated power system. When the outage occurs in the external power grid, it can keep the power supply service on some critical loads in islanding mode. Therefore, the islanding division is very important. A breadth-first search method (Li et al., 2018) is used to determine whether the current state can meet the power demand of the islanded load during the outage period, taking into account the wind and photovoltaic (PV) power generation at the sequential Monte Carlo sampling moment and the SOC of the BESS. Figure 1 shows the process of islanding division.
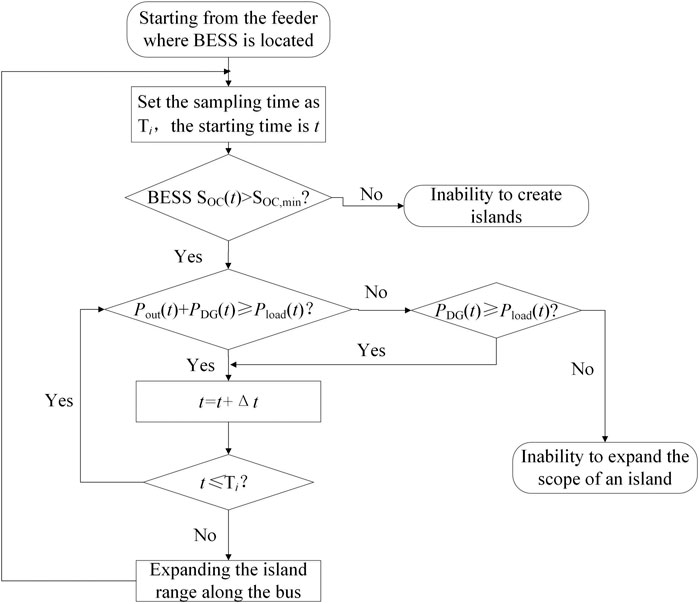
FIGURE 1. Process of islanding division.
The system average interruption duration index (SAIDI) is the reliability index in this paper.
Based on the sequential Monte Carlo method, the process for assessing the reliability of the distribution network is as follows:
(1) Import network topology parameters.
(2) Obtain time-series distribution of BESS SOCs based on flexibility scheduling results.
(3) Sample the normal operation time and repair time of each component of the simulation system, and find the minimum normal operation time of all components as the normal operation time of the system. Obtain the whole system operation fault sequence, and accumulate the total simulation time.
(4) Determine the loss of power due to a component failure according to the structure of the grid.
(5) Determine whether BESS is available based on SOC. If the BESS is available, the island is zoned as described above, to determine islanding division and load outages.
(6) Determine the simulation time, if it is less than the set time, go back to step 2, otherwise continue to step 7.
(7) Calculate reliability indexes and reliability benefits.
The net present value (NPV) index and the dynamic payback period (DPP) are used to evaluate the economics of BESS owners. The specific evaluation metrics are as follows.
The NPV takes into account the time value of money and discounts the net cash flows occurring each year over the life of the project to the sum of the present values at the same point in time, usually chosen as the total present value discounted to the beginning of the year of investment, based on a benchmark discount rate.
where
The annual net benefit of the BESS is set to R. C is the cost of BESS construction, and the NPV to the user over the whole life cycle is:
The NPP, which takes into account the time value of money, is calculated by accumulating the present value of the project's net income from year to year at a benchmark rate of return until the time required to recover the entire initial investment.
In an investment project where the dynamic payback period is set to Tp, the computational model is as follows.
When annual net income is equal.
where R is the net income for each year, i is the benchmark rate of return, and C is the cost of BESS construction.
In this paper, the maximum discharge depth of the battery is set to 80%. The annual net benefit R consists of three components, namely, Fgov for government subsidies of BESS projects, Frel for the reliability improvement benefit, and Ffle for the peak power feed-in under the peak-transfer incentive policy. Figure 2 shows the economic evaluation process of BESS considering its flexibility and reliability values.
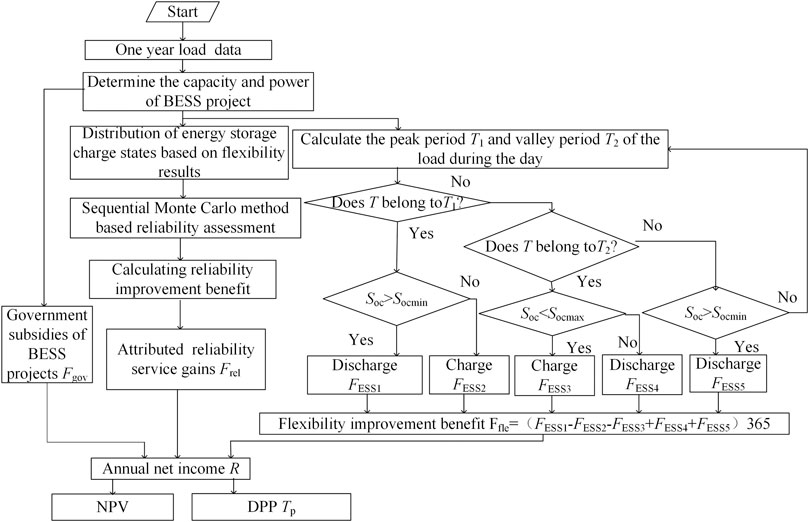
FIGURE 2. Economic evaluation process of BESS considering its flexibility and reliability values.
A modified IEEE 33-node distribution system is used in this paper, as shown in Figure 3. This section converts the multi-objectives model into a single-objective optimization model using the linear weighted summation method, and adopts the particle swarm optimization algorithm to solve it. BESS economic evaluation is based on the benefits of flexibility through peak tariff and reliability assessment for reliability improvement benefit.
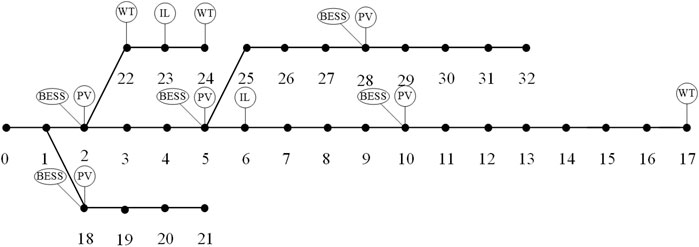
FIGURE 3. An modified IEEE 33-node distribution system.
This paper analyzes the benefits of BESS in three scenarios.
Scenario 1: BESS only participates in cutting peaks and filling valleys.
Scenario 2: BESS participates in peak shifting based on time-of-use tariffs.
Scenario 3: Reliability evaluation of BESS according to the distribution obtained in Scenario 2 to obtain reliability improvement benefit.
In the IEEE 33-node distribution system, 500 kW distributed PV is connected at nodes 2, 5, 10, 18, and 28, and 500 kW wind power is connected at nodes 17, 22, and 24, respectively. The rated power and the rated capacity of the BESS is 150 kW and 800 kWh, which is connected to nodes 2, 5, 10, 18, and 28, respectively. The interruptible load is connected to nodes 6 and 23. The optimized scheduling cycle is 24 h. The power purchase tariff is a time-sharing tariff, based on the newly implemented time-sharing tariff for industrial loads in Tianjin power grid from October 5, 2020, in which 8:00–15:00 and 18:00–23:00 are peak periods with a tariff of 1.072 RMB yuan, 7:00–8:00 and 11:00–18:00 are flat periods with a tariff of 0.6836 RMB yuan, and 23:00–7:00 are valley periods with a tariff of 0.4042 RMB yuan.
The unit capacity cost of the BESS equipment is 2.5 million RMB yuan/MWh. The power cost is one million RMB yuan/MW. The operation and maintenance cost as a percentage of investment cost is 0.37%, and the availability of the BESS equipment is 95%.
The load, PV, and wind power curves for a typical day in a certain area are shown in Figure 4.
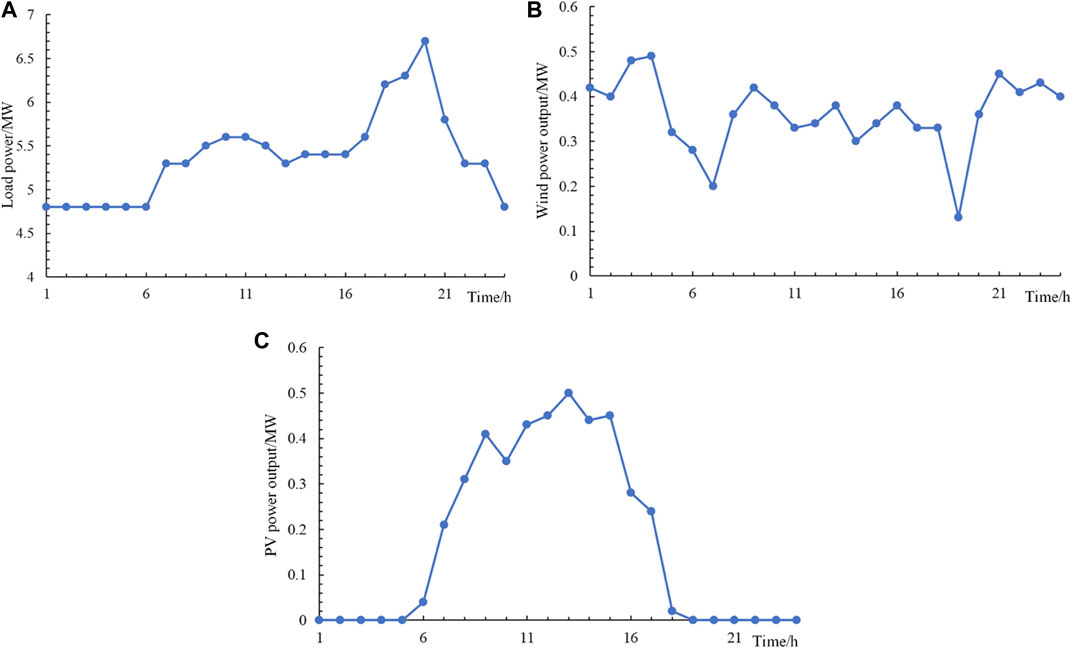
FIGURE 4. The load, PV, and wind power curves on a typical day in a certain area. (A) The load curve on a typical day in a certain area. (B) Wind power output on a typical day in a certain area. (C) PV power output on a typical day in a certain area.
The peak load moment is 19:00, and the line capacity flexibility index with or without BESS is analyzed comparatively, as shown in Figure 5. It can be seen that the line capacity flexibility is not enough without BESS, but after adding BESS, the line capacity and margin flexibility is greatly improved. The voltage change is shown in Figure 6, and the voltage is also significantly improved after the BESS is added.
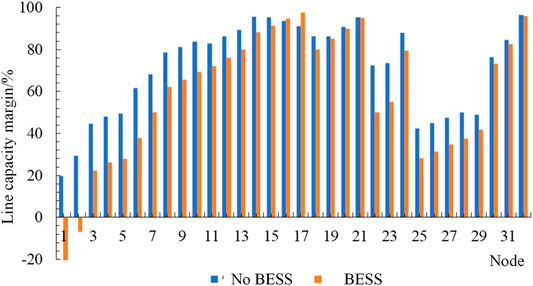
FIGURE 5. Line capacity margin.
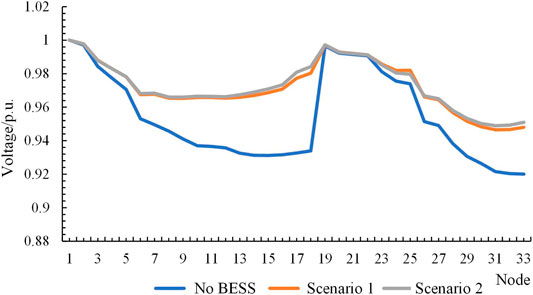
FIGURE 6. Node voltage of the system.
Due to the integration of PV and wind power, the peak and valley moments of the net load have been changed. Scenario one only takes into account the actual net load changes without considering the time-sharing tariff of peak and valley. From Figure 7, it can be seen that the optimal scheduling results for scenario one are only for the net load cut. The optimized scheduling for Scenario 2 results in partial BESS being discharged and recharged at peak and valley times is shown in Figure 8, in addition to charging at the valley time when electricity prices are low. Table 1 shows the specific charging and discharging results of BESS in Scenarios 2 and 3. From Table 2, it can be seen that the returns for Scenario 3 are much higher than those for Scenario 2.
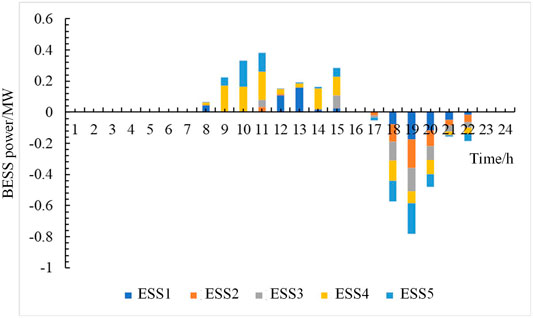
FIGURE 7. Optimization scheduling results of Scenario 1.
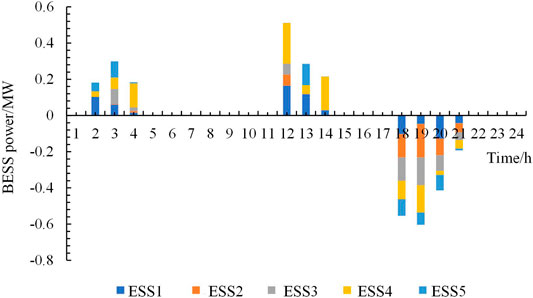
FIGURE 8. Optimization scheduling results of Scenario 2.
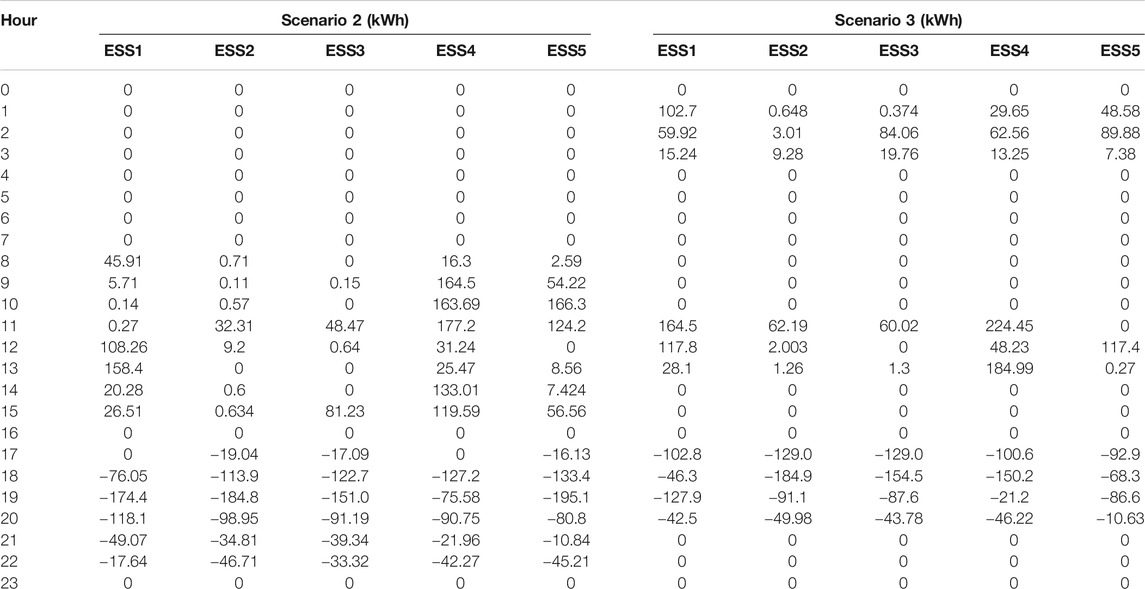
TABLE 1. Charging and discharging results of BESS in Scenario 2 and Scenario 3.
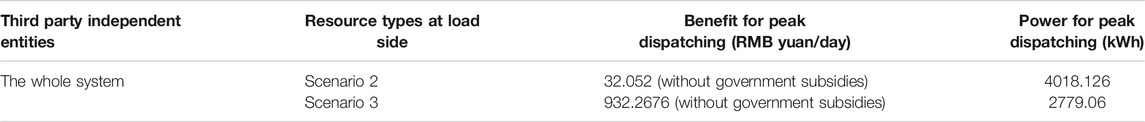
TABLE 2. Benefit for peak dispatching.
Through the above analysis, the line capacity flexibility index and the flexible adaptability index of voltage deviation are improved to different degrees by the optimal scheduling of BESS using flexibility resources. The flexibility of line capacity margin without adding BESS is not as high as the system flexibility after adding BESS. After adding BESS, the line overload is eliminated, the flexibility of other line capacity margins is also improved to some extent, and the system voltage deviation is significantly improved. The different charging and discharging time of BESS makes the flexibility improvement benefit different, and the charging and discharging of BESS change according to the peak-valley tariff and the actual peak-valley difference of the power grid can improve the economy more.
In this paper, we simulated the outage loss reduction for a certain BESS capacity and charge/discharge power based on the SOC distribution of BESS obtained from the flexible BESS optimization scheduling results, and analyze the reliability benefits of BESS. The results of islanding are shown in Figure 9, which shows that the BESS maximizes the power supply to the outage load nearby, improves the reliability of the system’s power supply, and increases the power margin of the user side load. The average outage cost per unit of power lost during load point outages is determined by the load type, outage duration, and the value of electricity per kWh in the national economy.
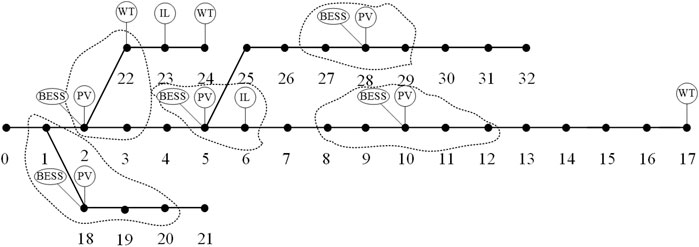
FIGURE 9. Islanding division result.
Considering the different peak and valley time-sharing tariffs for load types, the load types include large industry, general commercial and other, agricultural production, and residential. The peak-valley time-sharing tariffs for the Tianjin power grid are shown in Table 3.
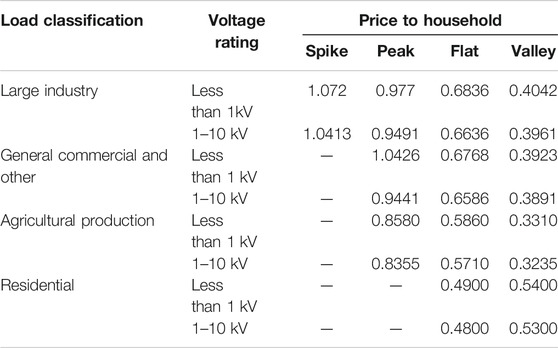
TABLE 3. Peak and valley tariffs for different load types in the Tianjin power grid.
The system has a total of 32 lines and 31 load points with four load types: residential, commercial, agricultural, and industrial loads. The BESS availability rate is taken as 95% and the Monte Carlo simulation sample size is taken as 20,000. The fault rate and average fault duration of each load point are calculated to obtain the annual average outage time. The fault rate of the line is 0.065, the fault rate of the transformer is 0.015, the fault rate of the breaker is 0.006, the repair time of the line is 5, the repair time of the transformer is 200, and the repair time of the breaker is 4. The average user outage time before adding BESS is calculated from the current grid data, and the average user outage time after adding BESS is calculated from the results of BESS islanding division and distribution network data. Further power for reliability improvement is calculated. The specific national economy generates industrial output per kWh of electricity reference. The reliability gains are 3–5 times the output value per kWh of electricity in the national economy. The reliability improvement gains are shown in Table 4.

TABLE 4. Benefit for reliability improvement.
The NPV and DPP of a BESS project are analyzed based on the established economic model that considers flexibility gains and reliability improvement gains. Additionally, add a government subsidy factor to the flexibility gains and an electricity value factor to the reliability gains. The discount rate i is 10%. The formula for calculating the subsidy amount is as follows.
Subsidy amount (RMB yuan) = Average discharge power (kW) × Time (1–4 h) × Government subsidy factor (RMB yuan/kWh) + 0.5 × (Average discharge power (kW) ×Time (5–6 h) ×Government subsidy factor (RMB yuan/kWh))
Figure 10 analyzes the dynamic payback period in the subsidized price range of 0–2 RMB yuan/kWh for BESS discharges, with the DPP decreasing significantly as the subsidized price increases.
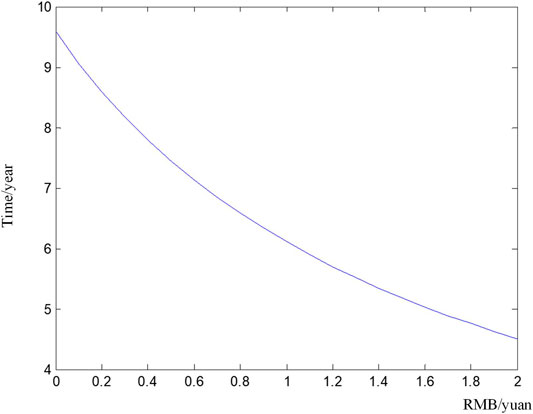
FIGURE 10. DPP of BESS for government subsidy price changes.
The range of national economic value of electricity is 5–15 RMB yuan/kWh with a DPP as shown in Figure 11. The larger the reliability gain, the shorter the DPP, considering the national economic electricity value of different industries. BESS can significantly improve system reliability gains.
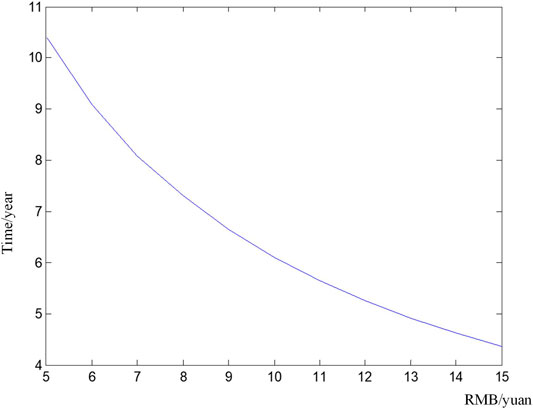
FIGURE 11. Dynamic payback period for BESS in the face of changes in national electricity production.
From the above analysis, we can see that government price subsidies, feed-in tariffs, and the value of electricity production in the national economy are all important factors that influence the DPP of users.
An improved electric ancillary services market is advocated.
To reflect the benefits of BESS on the flexibility improvement of distribution network, it is recommended that the design takes into account not only the peak-valley price but also the flexibility price for peak dispatching.
Considering the value of BESS on reliability improvement, it is recommended that reliability price be designed so that BESS is encouraged to be deployed to support power grid operation and improve power supply performance. The reliability benefit evaluation of BESS to the grid should consider the influence of the value of electricity in the national economy.
For low carbon goal achievement, more and more renewable energies are sometimes encouraged by financial subsidies. However, because of the intermittence and randomness characteristics of renewable energy resources, they bring more and more challenges to power grid operation. The frequency and voltage regulations need to be supported by traditional power plants, which contradict renewable energy requirements. In these situations, large-scale BES can be applied to regulate the frequency and voltage.
Subsidize large-scale BESS will help phase out less-efficient and high-pollution power plants. Power plant owners are encouraged to replace lost capacity with BESS or other clean energy sources. Reasonable government subsidies can accelerate the dynamic payback period of BESS and facilitate the rapid development of BESS projects.
Since the price of BESS is reducing, future policy should consider the impact of reducing the price of BESS. A decline in these costs will eventually make the BESS economically available without any subsidies. To promote the rapid development of BESS on a large scale, a detailed subsidy mechanism at multiple-stages that aims to reduce costs should be integral to its deployment. Establishing a BESS subsidy platform or launching an app to apply for subsidies could put this into practice, which could facilitate the simplification of subsidy procedures, visualization of subsidy programs, and diversification of compensation methods.
It is suggested that investors and interested parties of BESS, and investment management structures be established. These would be responsible for managing investment in and the operation of BESS. This would also contribute to adjusting policy and the regulatory system for BESS as well as developing a licensing system.
BESS + diversified business models, including community energy trading based on BESS, virtual power plants, and power sale packages based on BESS services, are needed. We suggest that a BESS network like the grid is built. The integration of BESS networks and the power grid will help promote the development of BESS and the optimal dispatch of the power grid with more accuracy and reliability.
This paper presents an economic evaluation of BESS, considering improvements to its flexibility and reliability. Corresponding incentive mechanism research is proposed to promote its deployment. We analyzed the impact of BESS on active distribution networks along with the impact of BESS on the flexibility and reliability of the distribution network, providing a reference basis for the value of BESS in the distribution network. The following main conclusions were drawn from this study:
(1) Detailed calculation flow of economic evaluation model for users of BESS considering NPV evaluation index and dynamic payback period evaluation index, which provides a reference for the evaluation of distributed BESS value.
(2) Stimulate the BESS auxiliary regulation to participate in grid flexibility improvement. Participation in the peaking market will not only recover costs and profits by using time-of-use tariffs, but also increase the revenue of BESS by participating in peaking, which will shorten the payback time and promote the further development of BESS.
(3) To promote the participation of BESS reliability gains, the reliability gains of BESS are closely related to the value of electricity production in the national economy: the larger the value of electricity production in the national economy, the more obvious the reliability gains of BESS.
(4) The economics and flexibility of BESS provide incentives that reduce investment pressure on investors and shorten the payback costs, increase returns, and promote the healthy and flexible development of the BESS market.
The original contributions presented in the study are included in the article/Supplementary Material, further inquiries can be directed to the corresponding author.
SC: methodology, formal analysis, validation, writing original draft, editing, and visualization. YL: data curation, resources, writing, review, and editing. All authors contributed to the article and approved the submitted version.
This work was Supported by State Key Laboratory of Reliability and Intelligence of Electrical Equipment (No. EERI_KF2020006), Hebei University of Technology, and the National Natural Science Foundation of China (NSFC 51361135704).
The authors declare that the research was conducted in the absence of any commercial or financial relationships that could be construed as a potential conflict of interest.
Bitaraf, H., and Rahman, S. (2018). Reducing curtailed wind energy through energy storage and demand response. IEEE. Trans. Sustain. Energ. 9 (1), 228–236. doi:10.1109/tste.2017.2724546
Bruninx, K., Dvorkin, Y., Delarue, E., Pandzic, H., Dhaeseleer, W., and Kirschen, D. S. (2016). Coupling pumped hydro energy storage with unit commitment. IEEE Trans. Sustain. Energ. 7 (2), 786–796. doi:10.1109/tste.2015.2498555
Cleary, B., Duffy, A., O’Connor, A., Conlon, M., and Fthenakis, V. (2015). Assessing the economic benefits of compressed air energy storage for mitigating wind curtailment. IEEE. Trans. Sustain. Energ. 6 (3), 1021–1028. doi:10.1109/tste.2014.2376698
Fang, X., Hodge, B.-M., Bai, L., Cui, H., and Li, F. (2018). Mean-variance optimization-based energy storage scheduling considering day-ahead and real-time LMP uncertainties. IEEE Trans. Power Syst. 33 (6): 7292–7295. doi:10.1109/tpwrs.2018.2852951
Huang, B., and Wang, C. (2016). “Value assessment of energy storage to support large scale PV integration,” in IEEE PES asia-pacific power and energy engineering conference (APPEEC). Xi’an, China (IEEE), 2131–2136.
Kuleshov, D., Peltoniemi, P., Kosonen, A., Nuutinen, P., Huoman, K., Lana, A., et al. (2019). Assessment of economic benefits of battery energy storage application for the PV‐equipped households in Finland. J. Eng. 2019 (18), 4927–4931. doi:10.1049/joe.2018.9268
Lee, J., Jeong, S., Han, Y. H., and Park, B. J. (2011). Concept of cold energy storage for superconducting flywheel energy storage system. IEEE Trans. Appl. Supercond. 21 (3), 2221–2224. doi:10.1109/tasc.2010.2094177
Li, Z., Li, Y., Zhang, D., and Yu, J. (2018). Influence analysis of energy storage device on reliability of distribution network and its optimal allocation. Power Syst. Technology, 42 (11), 3676–3683. doi:10.13335/j.1000-3673.pst.2018.0723
Li, N., and Hedman, K. W. (2015). Economic assessment of energy storage in systems with high levels of renewable resources. IEEE. Trans. Sustain. Energ. 6 (3), 1103–1111. doi:10.1109/tste.2014.2329881
Lu, M., Chang, C., Lee, W., and Wang, L. (2009). Combining the wind power generation system with energy storage equipment. IEEE Trans. Industry Appl. 45 (6), 2109–2115. doi:10.1109/TIA.2009.2031937
Maghouli, P., Soroudi, A., and Keane, A. (2016). Robust computational framework for mid‐term techno‐economical assessment of energy storage. IET. Gener. Transm. Dis 10 (3), 822–831. doi:10.1049/iet-gtd.2015.0453
Mahmoodi, M., Shamsi, P., and Fahimi, B. (2015). Economic dispatch of a hybrid microgrid with distributed energy storage. IEEE. Trans. Smart Grid 6 (6), 2607–2614. doi:10.1109/tsg.2014.2384031
Ofgem (2017). Upgrading our energy system-smart systems and flexibility plan. Available at: https://assets.publishing.service.gov.uk/government/uploads/system/uploads/attachment_data/file/633442/upgrading-our-energy-system-july-2017.pdf.
Shao, C., Shahidehpour, M., Wang, X., Wang, X., and Wang, B. (2017). Integrated planning of electricity and natural gas transportation systems for enhancing the power grid resilience. IEEE. Trans. Power Syst. 32 (6), 4418–4429. doi:10.1109/tpwrs.2017.2672728
Shu, Z., and Jirutitijaroen, P. (2014). Optimal operation strategy of energy storage system for grid-connected wind power plnts. IEEE Trans. Sustain. Energ. 5 (1), 190–199. doi:10.1109/tste.2013.2278406
Xiao, Y., Wang, X., and Bie, Z. (2018). Review on electricity market towards high proportion of renewable energy. Proc. CSEE 38 (3), 663–674. doi:10.13334/j.0258-8013.pcsee.172424
Xu, Y., and Tong, L. (2017). Optimal operation and economic value of energy storage at consumer locations. IEEE. Trans. Automat. Contr. 62 (2), 792–807. doi:10.1109/tac.2016.2572046
Yan, N., Xing, Z. X., Li, W., and Zhang, B. (2016). Economic dispatch application of power system with energy storage systems. IEEE. Trans. Appl. Supercond. 26 (7), 1–5. doi:10.1109/tasc.2016.2598963
Yang, J., Zhang, N., Wang, Y., and Kang, C. (2018). Multi-energy system towards renewable energy accommodation: review and prospect. Automation. Electric. Power. Syst. 42 (4), 11–24. doi:10.7500/AEPS20171002004
Yang, H., Shen, W., Yu, Q., Lu, J., Jiang, Y., Ackom, E., et al. (2020). Coordinated demand response of rail transit load and energy storage system considering driving comfort. CSEE J. Power Energ. Syst. 6 (4), 749–759. doi:10.17775/CSEEJPES.2020.02590
You, S., Hu, J., Zong, Y, and Lin, J. (2016). Value assessment of hydrogen-based electrical energy storage in view of electricity spot market. J. Mod. Power Syst. Clean. Energ. 4 (4), 626–635. doi:10.1007/s40565-016-0246-z
Zhang, C., Cheng, H., Liu, L., Wang, Z., Lu, J., and Zhang, X. (2017). Adaptability index and evaluation method for power transmission network structure with integration of high-penetration renewable energy. Automation. Electric Power Syst. 41 (21), 55–61. doi:10.7500/AEPS20170615005
Keywords: battery energy storage system, flexibility, reliabiity, economic evaluation, policy
Citation: Cai S and Li Y (2021) Incentive Policy for Battery Energy Storage Systems Based on Economic Evaluation Considering Flexibility and Reliability Benefits. Front. Energy Res. 9:634912. doi: 10.3389/fenrg.2021.634912
Received: 29 November 2020; Accepted: 01 February 2021;
Published: 25 March 2021.
Edited by:
Hao Yu, Tianjin University, ChinaReviewed by:
Changgang Li, Shandong University, ChinaCopyright © 2021 Cai and Li. This is an open-access article distributed under the terms of the Creative Commons Attribution License (CC BY). The use, distribution or reproduction in other forums is permitted, provided the original author(s) and the copyright owner(s) are credited and that the original publication in this journal is cited, in accordance with accepted academic practice. No use, distribution or reproduction is permitted which does not comply with these terms.
*Correspondence: Shengxia Cai, Q2Fpc2hlbmd4aWE3N0BuYW5rYWkuZWR1LmNu
Disclaimer: All claims expressed in this article are solely those of the authors and do not necessarily represent those of their affiliated organizations, or those of the publisher, the editors and the reviewers. Any product that may be evaluated in this article or claim that may be made by its manufacturer is not guaranteed or endorsed by the publisher.
Research integrity at Frontiers
Learn more about the work of our research integrity team to safeguard the quality of each article we publish.