 Zhaoyang Qu1,2
 Zhenming Zhang
- 1School of Computer Science, Northeast Electric Power University, Jilin, China
- 2Jilin Engineering Technology Research Center of Intelligent Electric Power Big Data Processing, Jilin, China
- 3State Grid Jilin Electric Power Company Limited, Changchun, China
- 4State Grid Inner Mongolia Eastern Electric Power Company, Hohhot, China
Aiming at the problem of insufficient accuracy and timeliness of transmission line parameters in the grid energy management system (EMS) parameter library, a dynamic optimization method of transmission line parameters based on grey support vector regression is proposed. Firstly, the influence of operating conditions and meteorological factors on the changes of parameters is analyzed. Based on this, the correlation quantification method of transmission line parameters is designed based on Pearson coefficient, and the influence coefficient value is obtained. Then, with the influence coefficient as the constraint condition, a method for selecting strong influence characteristics of line parameters based on improved Elastic Net is proposed. Finally, based on the grey prediction theory, a grey support vector regression (GM-SVR) parameter optimization model is constructed to realize the dynamic optimization of line parameter values under the power grid operation state. The effectiveness and feasibility of the proposed method is verified through the commissioning of the reactance parameters of the actual local loop network transmission line.
Introduction
Overhead transmission lines are the main components of the power grid. Various advanced calculations of the power system, such as grid modeling, state estimation, power flow calculation, and relay protection settings, require accurate transmission line parameters (Bendjabeur et al., 2019). In the calculation of the actual transmission line parameters, most of the power system operators use electrical equipment to artificially apply a certain voltage after the transmission line is erected and not put into operation, and calculate the double-ended electrical parameters of the line through precision measuring instruments (Xiao et al., 2016). However, when the transmission line is energized and operated, affected by the operating conditions of the transmission network, line environment, seasonal changes and other factors, there are certain differences between the actual line parameters and the parameter values originally calculated (Asprou et al., 2018; Yu et al., 2018). The transmission line parameter error will seriously reduce the calculation accuracy of the state estimation in the local grid area, then affect the accuracy of the calculation results of various advanced applications based on the state estimation, and seriously interfere with the analysis and control of the power system by dispatchers (Liu et al., 2020). Therefore, studying the accuracy and dynamic modification of transmission line parameters has important theoretical and practical significance.
For a long time, in order to improve the accuracy of transmission line parameters, domestic and foreign experts have carried out many related researches on transmission line parameter estimation and parameter optimization, which can be divided into two main categories:
1) Based on power grid state estimation, expand calculations from different angles, such as augmented state estimation method (Xue et al., 2014), normal equation estimation method (Tang et al., 2018), Kalman filter estimation method (Wang et al., 2019c) and residual sensitivity analysis method (Su et al., 2019). Among them, the literature (Wang et al., 2019a; Kong et al., 2020) proposed a method to generate suspicious lines by calculating measurement deviation and line balance state, and used variable step integration method to estimate the parameter correction value of suspicious lines. Literature (Xue et al., 2019) proposed a comprehensive method based on PQ decoupling combined with augmented state estimation and sensitivity methods to achieve line parameter error correction. Literature (Viafora et al., 2019) proposes a two-step state estimation algorithm that takes into account line temperature. However, these methods generally face the problem of ill-conditioned coefficient matrix. In particular, a large range of line parameters can be extended to state values to achieve the solution of parameter values, which results in too high matrix dimensions, seriously affected state estimation results, and the calculated parameter values cannot meet the basic accuracy requirements of various advanced applications of power grid energy management system.
2) Based on the measured value of the transmission line section, the parameter optimization based on artificial intelligence algorithm includes particle swarm optimization method (Qu et al., 2018; Zhu et al., 2020), genetic algorithm (Shi et al., 2009; Li et al., 2020) and Tabu search method (Dai, 2020). Among them, the literature (Huang et al., 2019) proposed a method for estimating line parameters of distribution network based on radial basis function neural network, which can obtain accurate line parameters by using the measured values at both ends of the line. In literature (Ren et al., 2019; Dutta et al., 2020), multi-time SCADA and PMU measurements of a single line are respectively used for parameter estimation. Simulation results can effectively estimate the impedance parameters of the line. Literature (Ghiasi et al., 2019) trained and learned a large number of multi-section active power data, the sparsity of the line parameter difference and the practical lasso algorithm are used to correct and solve the suspicious line. This type of method has become the mainstream research idea, which provides important reference and theoretical guidance for subsequent research.
Based on the above research on various optimization methods, the current transmission line parameter estimation or optimization method has two shortcomings in the solution calculation: ① The effective influence of the line operation mode on the parameters is not considered and calculated, resulting in the lack of precision of parameter values. ②The calculation of transmission line parameters in the revised scheme cannot be combined with the state data of the latest line operation mode. Only historical data is used to calculate line parameter values, and the generated parameter values are not real-time, and it is not appropriate to be applied to advanced real-time calculations of various power grids.
Transmission line parameters such as resistance (R), reactance (X) and susceptance (B) are the prerequisites for modern power system operation, control and planning research (Salam, 2020). In this paper, by analyzing the internal and external factors that interfere with the line parameters during the operation of the transmission line, the relevant influencing factors reflecting the operating conditions of the line and the natural environmental parameters are initially determined, and the degree of influence is quantified. Then, a strong-influence feature selection model based on the constraint of the influence coefficient is constructed to break the limitation of the specific input quantity of the traditional electrical calculation model. More comprehensive line parameter influence characteristics are considered as parameter optimization considerations. Based on grey prediction theory, a grey support vector regression (GM-SVR) parameter optimization model is constructed to achieve dynamic adjustment of line parameter values under power grid operation.
Related Influencing Factors and Quantification of Transmission Line Parameters
Analysis of Related Influencing Factors of Transmission Line Parameters
The transmission grid will generate heat during long-distance transmission (Zhang et al., 2019). As the demand on the load side of the transmission grid changes, the line operation mode must be adjusted as needed, which will cause the heat generation of the line to change. At the same time, the air convection heat flow and solar radiation in the natural environment around the line will also cause the line to generate heat. Since the transmission line is a metal conductor, which is a good conductor of heat, there is obvious thermal expansion and contraction. With the temperature change caused by internal or external factors of the line, the resistivity and sag of the line will change, which will cause the line length and cross-sectional area to be different from the initial parameter values (Wang et al., 2019b; Beňa et al., 2020). In addition, the transmission lines are affected by severe weather (Sony and Chettiar, 2020), the geometric uniform distance of the three-phase conductors and the geomagnetic field in special areas are also different from the original parameter calculation scenarios (Zhu et al., 2018; Qu et al., 2019).
Therefore, for different transmission lines erected in different scenarios, the leading factors that affect line parameter values are different, but through in-depth impact analysis of the line's multi-period historical operation data and meteorological environment data, there are still traces to follow. Based on the measurement of the supervisory control and data acquisition system (SCADA) of the grid, the paper extracts the internal operating mode factors that affect the parameter changes such as active power, reactive power, current, and voltage amplitude at both ends of the line. Based on the monitoring of the National Meteorological Data Center, the external natural environmental factors that affect the change of parameters such as temperature and wind speed in the area where the line is located are extracted.
Quantification of Related Influencing Factors Based on Pearson Coefficient
This paper analyzes the correlation between measured data and transmission line parameters, and designs a method for quantifying the correlation of parameter influencing factors based on Pearson coefficients to quantify the degree of influence between each influencing factor and line parameters.
The specific quantitative method steps are as follows:
Step1: Extract the SCADA measurement characteristic data at both ends of the line through the transmission line ID. At the same time, in the process of considering the operation mode of the line, the influence of the natural environment of the line on the parameters itself is further considered, and meteorological environmental data in the area where the line is located are extracted.
Step2: Fuse the extracted line operation mode and meteorological environment data based on time series to construct a complete dataset of influencing factors:
In the Eq. 1:
Step3: In order to accurately measure the degree of influence of transmission line parameter influence characteristics on each parameter value, a correlation quantification function based on Pearson correlation coefficient is designed:
In the Eq. 2:
Step4: Impact trend analysis. Analyze the closeness and influence trend between variables according to the magnitude and the sign of
Strong Influence Feature Selection Method Based on Improved Elastic Net
The purpose of strong influence feature selection is to lay the foundation for establishing an optimal route parameter optimization model. Excluding redundant influence features, only the independent variables that have a strong influence on the parameter value are included in the training data set, which effectively alleviates the computational cost caused by high-dimensional training features.
The principle of the Elastic Net (Zhao et al., 2020) algorithm is to add two penalty items on the basis of least squares. It is often used to process sample data with multi-collinearity, especially when there is a high degree of correlation between data features. However, the double shrinkage of traditional Elastic Net leads to low efficiency and high bias in the selection of strong influence features. In order to correct this effect, the quantized value Pearson influence coefficient is eliminated as the constraint condition, and the quantized value
The solution process of Elastic Net influence characteristic coefficients is divided into three stages:
First, the Ridge regression coefficient is determined, and then the lasso shrinkage coefficient is used.
Then, let
In the Eq. 3:
Finally, after establishing each influencing feature coefficient, the strong influencing feature selection with line parameters can be obtained by Eq. 4:
Dynamic Optimization of Transmission Line Parameters
The entire optimization process in this paper consists of two parallel stages. The first stage uses the multi-dimensional feature time series data in the transmission line parameter strong influence characteristic dataset to construct a single characteristic grey model to dynamically predict the next time section strong influence characteristic value. The second stage uses the strong adaptability and fault tolerance of support vector regression (Cao et al., 2017), and trains the support vector regression (SVR) parameter optimization model based on the complete and strong impact feature dataset, and sets the parameter deviation coefficient and deviation floating factor constrained optimization relationship to ensure that the optimization result is within the acceptable accuracy range. At the same time, the real-time strong influence characteristic value of grey prediction is used as the input of the parameter optimization model, and the iterative calculation completes the solution of the optimization model line parameters.
Prediction Model of Strong Influence Eigenvalues Based on GM (1,1)
As a forecasting method that adapts to systems with uncertain factors, the grey forecasting method is predicted by observing the future value of historical data series (Hu et al., 2020). Aiming at the characteristics of weak randomness on the load side during the operation of the power system. Use discrete random numbers to evolve time series data with strong influence characteristics into generated numbers. The randomness of the generated number sequence is significantly weakened and contains characteristic operation laws. Furthermore, a dynamic model in the form of grey differential equations is established to complete the accurate prediction of the eigenvalues of strong influence in real-time conditions.
It is known that a certain transmission line parameter strongly influences the characteristic element sequence data:
Where
Construct the GM (1,1) transmission line parameter strong influence characteristic grey prediction model, and dynamically calculate the predicted value.
Where
The time response sequence of the grey prediction model with strong influence characteristics of transmission line parameters is:
According to the originally selected method of generating the grey sequence of the strong-influence feature value, it is restored to the original feature sequence, so as to obtain the predicted value of the next time section during the operation of the transmission line accordingly.
Dynamic Optimization Algorithm of Transmission Line Parameters Based on GM-SVR
The strong-influence eigenvalue prediction model realizes the prediction of the operating conditions and meteorological conditions of the transmission line, and integrates it into the transmission line parameter SVR predictor, designs the dynamic optimization algorithm of the transmission line parameters based on GM-SVR, and dynamically solves the parameter optimization The specific execution steps are as follows:
Step 1: Organize the training dataset of strong influence features
The transmission line parameters of the corresponding time section during the steady state operation of the power system
Step 2: The kernel function of the optimization model is determined. From the input space to the feature space, the traditional mapping method will lead to an explosive increase in dimensionality. The radial basis kernel function has the characteristics of strong locality and stability. It is widely used in the regression analysis process of massive samples and is effective Reduce the calculation amount and storage space of the parameter optimization model.
In the Eq. 11,
Step 3: Set the parameter optimization coefficients of the transmission line, and establish the cost function.
Most of the parameter deviations are within the scope of the grid standards, it will not affect the follow-up power system state estimation and other related advanced applications, More attention should be paid to the excessive deviation of the parameters caused by the real-time changes of the transmission line operating conditions and meteorological conditions, so the optimization coefficient value is to ensure that the parameter value is constrained within an acceptable accuracy range.
Where
Step 4: Establish the dynamic optimization relationship of line parameters, namely SVR regression model, to fit the relationship between the strong influencing characteristic variables and the transmission line parameter variables.
The constraints
Step 5: In order to realize the dynamic prediction of the optimization model and further improve the accuracy of the tuning results, the strong influence characteristic value
Experimental Analysis
In this paper, a local loop transmission network in a province is taken as an example, and the method proposed in the article is used to optimize and debug the loop network reactance parameters. Figure 1 shows the simulation topology connection of the ring-type power grid system based on Matlab/Simlink (In the Figure 1, the red component represents the power node, the blue component represents the 220 KV plant node, and the green component represents the transmission line).
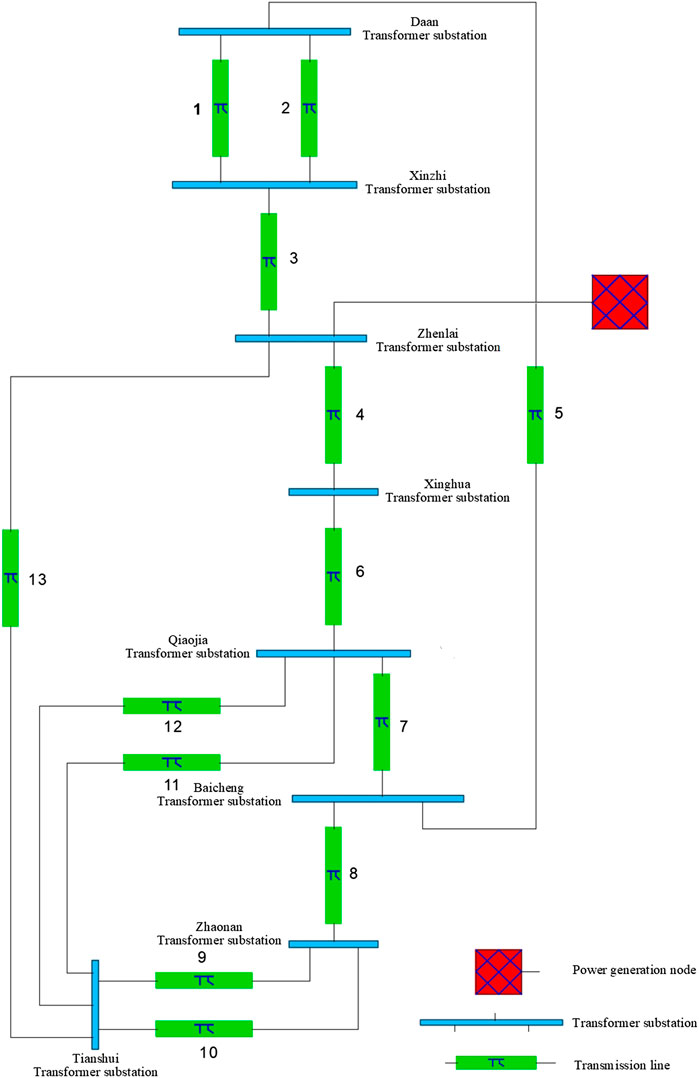
FIGURE 1. Network topology connection.
The historical measurement data of the ring network area within 1 year were extracted from the SCADA database of the Provincial Dispatching Center and the database of the National Meteorological Center. By weighing the transmission line parameter optimization accuracy and the computational cost caused by the model learning long-time section dataset, the training dataset is diluted on the premise that the parameter optimization accuracy meets the actual application. The time section interval is set to 3 h, including Measurement of 2,920 moments. According to the analysis of electrical mechanism, after the characteristics irrelevant to parameter correction of line cross-section features are preliminarily screened out, there are still as many as 10 associated attributes in the section dataset extracted and constructed.
Solving the Influence Coefficient of Transmission Line Parameters
In order to reduce the interference of low-impact features in the historical section dataset to the later model training, the correlation between transmission line parameters and each impact feature was analyzed and quantified. In this stage, considering that there is little difference in significant influence rules between different circuits in the same local ring network area, and in order to avoid weakening the influence relationship between measurement features and parameters over a long time span. Statistical experimental analysis was carried out around the concentration time of the Zhenxin line in May. Quantify the influence of the measurement characteristics of the first and last ends of the transmission line and the meteorological measurement characteristics on the reactance value.
Through correlation analysis and quantitative results, it can be found that the absolute value of the Pearson correlation coefficient of the transmission line's first-end active power (P), first-end current (I) and ambient temperature and reactance parameter (X) are greater than 0.7. It shows that the five transmission line measurement characteristics have a strong influence on the parameter values under the time sequence state, and they are not negligible characteristics when training the reactance value correction model.
Strong Influence Feature Weight Calculation
Using the complete dataset of influence factors of transmission line parameters constructed to verify the advantages of ElasticNet-r based strong influence feature selection method in this paper. The Ridge algorithm, Lasso algorithm, Elastic Net algorithm and this algorithm are used to compare the selection simulation results and model performance. Specific experiments are as follows:
Verify the filtering effect of different algorithms in strongly influencing feature selection. The initial alpha of each algorithm is set to 0.1, and max_iter is set to 10,000. Elastic Net algorithm and ElasticNet-r algorithm’s L1_ratio is set to 0.5. In the process of model training, the value of the super-parameter is iteratively adjusted, and the feature selection result under the optimal state of different algorithms is strongly influenced, as shown in Figure 2.
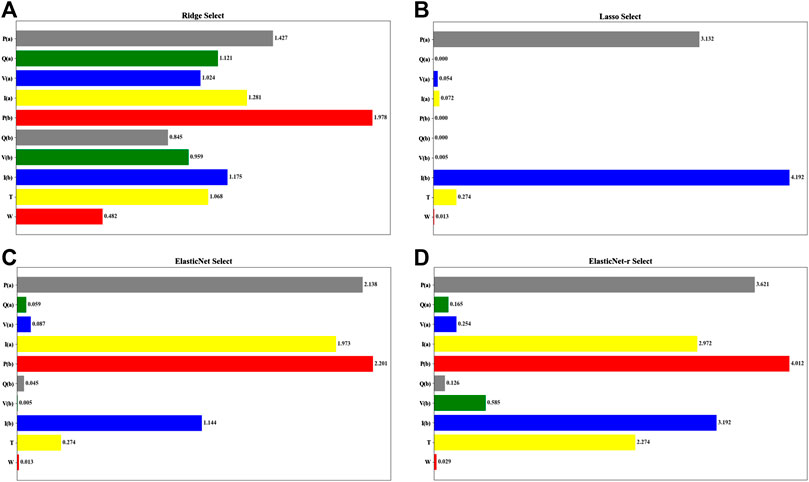
FIGURE 2. Comparison of the selection results of different algorithms with strong influence.
From Figures 2A–D, it can be seen that each algorithm uses model training on a complete dataset of transmission line parameters to determine the corresponding weights for different features, and then achieves the retention and elimination of influencing features.
Circuit Reactance Parameter Tuning
Taking the selected line “Head end active power,” “Head end current,” “Terminal active power,” “Terminal current,” and “Environment temperature” as input characteristics, and the optimized value of transmission line parameters as output. Establish a dynamic optimization model for GM-SVR transmission line parameters, the result of tuning the reactance parameters of the experimental loop network is shown in Table 1, and it is compared with the tuning result of the engineer combining the least square method and his own experience.
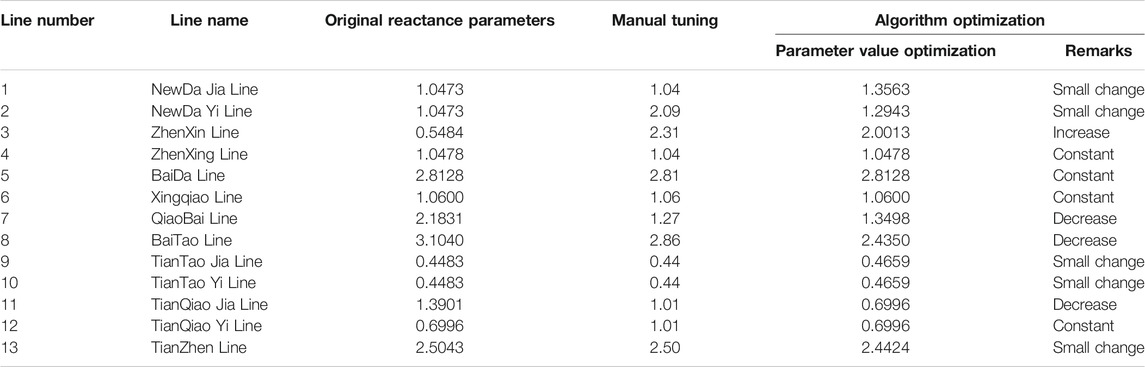
TABLE 1. Dynamic optimization of transmission line parameters.
Table 1 shows that the method in this paper can be adapted to different transmission lines and has a certain generalization ability. At the same time, comparing the least square method of each line and the results of manual tuning, the accuracy value cannot meet the accuracy requirements of the reactance parameter value of the transmission line, and it is highly dependent on the experience of the engineer, resulting in the timeliness of the optimized parameter result value, which cannot be long-term Maintain the accuracy of the power system's advanced calculation results such as state estimation. The method in this paper only parameter optimization models trained and learned through historical datasets, without manual experience. The parameter optimization results can meet the accuracy requirements of reactance parameters, and as long as the training sample coverage is long enough Time section, the parameter tuning results are sufficient to have good timeliness.
Validation Verification of Transmission Line Parameter Optimization Method
In order to verify the effectiveness of the algorithm optimization parameter values, the transmission line parameter values optimized by the algorithm are filled into the state estimation program simulation module of a provincial smart grid dispatching technical support system, and the results of the transmission line state estimation are observed. Figure 3A is the state estimation result using the original parameters:
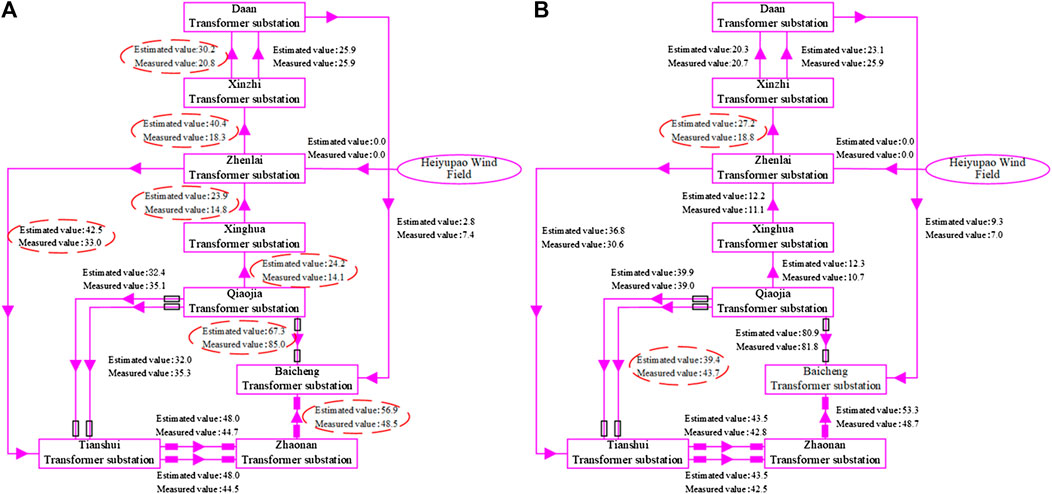
FIGURE 3. Using original parameters (A) and optimized parameters (B) for state estimation.
China power grid stipulates that the state estimation qualification threshold for the active power measurement of 220 kV grid lines is 6.1 MW. Figure 3A uses the original parameters for state estimation. The results show that the residual error of seven lines exceeds the threshold, which exceeds 50% of the total number of lines in the local ring network.
It can be seen from Figure 3B that only two lines (ZhenXin Line and TianZhen Line) have residuals exceeding the qualified threshold, and the state estimation active residuals of the remaining lines are all small, and the overall residuals are significantly smaller than when the original parameters are used. The pass rate of state estimation has been significantly improved.
Conclusion
This paper proposes a new method for dynamic optimization of transmission line parameters based on grey support vector regression (GM-SVR), which effectively improves the accuracy and timeliness of transmission line parameters in the grid energy management system (EMS) parameter library. The time series changes of transmission line parameters are affected by the operating conditions of the power grid and the complex meteorological environment. The strong influence feature selection model of the proposed method can accurately screen out features that have a strong impact on transmission line parameters. The limitation of specific input quantity is broken when solving line parameter values based on electrical mechanism modeling.
The analysis and verification results of actual engineering examples show that the optimized transmission line parameters of this method can significantly improve the pass rate of power grid state estimation. It is of reference significance for the accurate monitoring of power grid operation status and the safe dispatch of power system. However, this method still has shortcomings in considering the influence of parameters such as the geomagnetic field and the geometric distance between lines in special areas. This will be a subject to be studied in depth in the next stage.
Conflict of Interest
Author ML was employed by the State Grid Jilin Electric Power Company Limited, China. Author MC was employed by the State Grid Inner Mongolia Eastern Electric Power Company, China. Author YZ was employed by the State Grid Jilin Electric Power Company Limited, China.
The remaining authors declare that the research was conducted in the absence of any commercial or financial relationships that could be construed as a potential conflict of interest.
Data Availability Statement
The original contributions presented in the study are included in the article/Supplementary Material, further inquiries can be directed to the corresponding author.
Author Contributions
ZQ: designed this study. ML: contributed to the strong influence feature selection method based on improved Elastic Net. ZZ: contributed to transmission line parameter optimization algorithm and article experimental analysis. MC: collected and cleansed the data. YZ: performed the related influencing factors and quantitative analysis of transmission line parameters. All authors contributed to the writing of the article and all agreed to the submitted version of the article.
Funding
This paper was supported in part by science and technology innovation development plan project of Jilin (201830817), National Natural Science Foundation of China (Grant No. 51437003).
References
Asprou, M., Kyriakides, E., and Albu, M. M. (2018). Uncertainty bounds of transmission line parameters estimated from synchronized measurements. IEEE Trans. Instrumen. Measure. 68 (8), 2808–2818. doi:10.1109/TIM.2018.2867966
Bendjabeur, A., Kouadri, A., and Mekhilef, S. (2019). Novel technique for transmission line parameters estimation using synchronised sampled data. IET Gener., Transm. Distrib. 14 (3), 506–515. doi:10.1049/iet-gtd.2019.0702
Beňa, Ľ., Gáll, V., Kanálik, M., Kolcun, M., Margitová, A., Mészáros, A., et al. (2020). Calculation of the overhead transmission line conductor temperature in real operating conditions. Electr. Eng. 9, 1–12. doi:10.1007/s00202-020-01107-2
Cao, J., Fang, Z., Qu, G., Sun, H., and Zhang, D. (2017). An accurate traffic classification model based on support vector machines. Int. J. Network Mgmt 27 (1), e1962. doi:10.1002/nem.1962
Dai, Y. (2020). Real-time dynamic line rating of transmission lines using live simulation model and Tabu search. IEEE Trans. Pow. Deliv. 8, 1. doi:10.1109/TPWRD.2020.3014911
Dutta, R., Patel, V., Chakrabarti, S., Sharma, A., Das, R. K., and Mondal, S. (2020). Parameter estimation of distribution lines using SCADA measurements. IEEE Trans. Instrument. Measure. 70, 1–11. doi:10.1109/TIM.2020.3026116
Ghiasi, S. M. S., Abedi, M., and Hosseinian, S. H. (2019). Mutually coupled transmission line parameter estimation and voltage profile calculation using one terminal data sampling and virtual black-box. IEEE Access 7, 106805–106812. doi:10.1109/access.2019.2901813
Hu, Z., Xu, X., Su, Q., Zhu, H., and Guo, J. (2020). Grey prediction evolution algorithm for global optimization. Appl. Math. Model. 79, 145–160. doi:10.1016/j.apm.2019.10.026
Huang, R., Guo, M. F., and Chen, Y. W. (2019). Parameter estimation of distribution system based on radial basis neural network. Electr. Eng. 20 (4), 42–46.
Kong, X. L., Zhang, X. Y., Wang, C. S., Li, P., Yu, L., and Jiang, X. D. (2020). “Adaptive self-optimizing state estimation method of distribution network in complex condition,” in Proceedings of the CSEE, Lisbon, Portugal, October 18–20, 2020. Available at: http://kns.cnki.net/kcms/detail/11.2107.TM.20200828.1626. 005.html.
Li, Z. X., Zhang, J. T., Chen, Y. X., Weng, H. L., and Lv, L. P. (2020). A new fault location algorithm of line voltage cross-correction for three-terminal transmission lines based on dynamic calculation of real-time parameters. Power Syst. Technol. 44 (2), 761–768. doi:10.13335/j.1000-3673.pst.2019.0690
Liu, Y., Wang, B., Zheng, X., Lu, D., Fu, M., and NengLing, T. (2020). Fault location algorithm for non-homogeneous transmission lines considering line asymmetry. IEEE Trans. Power Deliv. 35 (5), 2425–24378. doi:10.1109/TPWRD.2020.2968191
Qu, Z., Dong, Y., Qu, N., Wang, L., Li, Y., Zhang, Y., et al. (2019). “Survivability evaluation method for cascading failure of electric cyber physical system considering load optimal allocation. Math. Prob. Eng. 2019 (2), 1–15. doi:10.1155/2019/2817586
Qu, Z., Zhang, Y., Qu, N., Wang, L., Li, Y., and Dong, Y. (2018). Method for quantitative estimation of the risk propagation threshold in electric power CPS based on seepage probability. IEEE Access 6, 68813–68823. doi:10.1109/access.2018.2879488
Ren, P., Abur, A., and Lev-Ari, H. (2019). “Tracking transmission line parameters in power grids observed by PMUs,” in 2019 IEEE milan power tech, Milan, Italy, June 23–27, 2019 (Piscataway, NJ: IEEE), 1–6.
Salam, M. A. (2020). Transmission line parameters and analysis. Fundamentals of electrical power systems analysis. Singapore: Springer.
Shi, Z. B., Li, Y., and Yu, T. (2009). “Short-term load forecasting based on LS-SVM optimized by bacterial colony chemotaxis algorithm,” in 2009 international conference on information and multimedia technology, Jeju Island, South Korea, December 16–18, 2009 (Piscataway, NJ: IEEE), 306–309.
Sony, M., and Chettiar, M. V. (2020). Stochastic modelling of weather-related transmission line outages. Int. J. Oper. Res. Inf. Syst. 11 (1), 66–82. doi:10.4018/ijoris.2020010103
Su, H., Li, P., Fu, X., Yu, L., and Wang, C. (2019). Augmented sensitivity estimation based voltage control strategy of active distribution networks with pmu measurement. IEEE Access 7, 44987–44997. doi:10.1109/ACCESS.2019.2908183
Tang, K. J., Dong, S. F., and Song, Y. H. (2018). A real-time N-1 AC power flow calculation method based on FPU-CPU heterogeneous computing framework. Proceed. CSEE 38 (15), 4329–4338+4633. doi:10.13334/j.0258-8013.pcsee.172148
Viafora, N., Morozovska, K., Kazmi, S. H. H., Laneryd, T., Hilber, P., and Holbøll, J. (2019). Day-ahead dispatch optimization with dynamic thermal rating of transformers and overhead lines. Elec. Power Syst. Res. 171, 194–208. doi:10.1016/j.epsr.2019.02.026
Wang, C., Centeno, V. A., Jones, K. D., and Yang, D. (2019a). Transmission lines positive sequence parameters estimation and instrument transformers calibration based on PMU measurement error model. IEEE Access 7, 145104–145117. doi:10.1109/access.2019.2944818
Wang, R. H., Lu, Z. W., Wang, Y. L., Yang, C., and Li, C. Y. (2019b). Research on influence of line arrester on lightning protection performance of 66kV double-circuit transmission lines on the same tower. J. Northeast Elec. Power Univ. 39 (5), 17–22.
Wang, Y., Sun, Y., Dinavahi, V., Cao, S., and Hou, D. (2019c). Adaptive robust cubature Kalman filter for power system dynamic state estimation against outliers. IEEE Access 7, 105872–105881. doi:10.1109/access.2019.2932261
Xiao, Y., Fan, Y., Cheng, L., and Deng, J. (2016). A parameter measurement theory of single and double circuit AC transmission lines. Proceed. CSEE 36 (20), 5515–5522+5727. doi:10.13334/j.0258-8013.pcsee.152393
Xue, A. C., Zhang, Z. Y., Zhang, J. M., Chang, N. C., and Bi, T. S. (2014). An augmented state estimation method for transmission line parameters based on maximum normal measurement rate. Autom. Electr. Power Syst. 38 (10), 61–65. doi:10.1109/PESGM.2015.7285847
Xue, A., Xu, F., Xu, J., Chow, J. H., You, H., and Bi, T. (2019). Correction of phasor measurements independent of transmission line parameters. IEEE Transa. Smart Grid 11 (1), 346–356. doi:10.1109/TSG.2019.2921819
Yu, X. L., Zhang, H. X., and Wang, M, X. (2018). An algorithm for power system state estimation considering line temperature. Proceed. CSEE 38 (9), 2561–2570+2824. doi:10.13334/j.0258-8013.pcsee.171161
Zhang, S., Dong, X., Xing, Y., and Wang, Y. (2019). “Analysis of influencing factors of transmission line loss based on GBDT algorithm,” in In 2019 international conference on communications, information system and computer engineering (CISCE), Haikou, China, July 5–7, 2019 (Piscataway, NJ: IEEE), 179–182.
Zhao, G., Hu, J., He, J., and Wang, S. X. (2020). A novel current reconstruction method based on elastic Net regularization. IEEE Trans. Instrument. Measure. 69 (10), 7484–7493. doi:10.1109/TIM.2020.2984819
Zhu, H., Yu, Z. X., and Yan, J. T. (2018). UHV line tree barrier to predict the rsk of transmission and simulation analysis. J. Northeast Elec. Power Univ. 38 (2), 21–27. doi:10.19718/j.issn.1005-2992.2018.02.004
Keywords: transmission line parameters, strong influence feature selection, parameter correction, grey support vector regression, elastic net algorithm
Citation: Qu Z, Li M, Zhang Z, Cui M and Zhou Y (2021) Dynamic Optimization Method of Transmission Line Parameters Based on Grey Support Vector Regression. Front. Energy Res. 9:634207. doi: 10.3389/fenrg.2021.634207
Received: 27 November 2020; Accepted: 13 January 2021;
Published: 17 February 2021.
Edited by:
Yang Li, Northeast Electric Power University, ChinaReviewed by:
Chen Liang, Nanjing University of Information Science and Technology, ChinaShaoyan Li, North China Electric Power University, China
Copyright © 2021 Qu, Li, Zhang, Cui and Zhou. This is an open-access article distributed under the terms of the Creative Commons Attribution License (CC BY). The use, distribution or reproduction in other forums is permitted, provided the original author(s) and the copyright owner(s) are credited and that the original publication in this journal is cited, in accordance with accepted academic practice. No use, distribution or reproduction is permitted which does not comply with these terms.
*Correspondence: Zhenming Zhang, MTUxNDMyODk1MjJAMTYzLmNvbQ==