 Changyong Lin1
 Malin Song
95% of researchers rate our articles as excellent or good
Learn more about the work of our research integrity team to safeguard the quality of each article we publish.
Find out more
ORIGINAL RESEARCH article
Front. Energy Res. , 23 February 2021
Sec. Sustainable Energy Systems
Volume 9 - 2021 | https://doi.org/10.3389/fenrg.2021.630847
This article is part of the Research Topic Green Finance, Renewable and Non-Renewable Energy, and COVID-19 View all 26 articles
The development of renewable energy in Fujian province has entered a bottleneck period in recent years. Considering the impact of COVID-19, how to formulate the provincial energy development strategy based on the 14th Five-year Plan is an important issue that need to be addressed for Fujian. This paper constructs a provincial Computable General Equilibrium model to analyze the cost of energy transition to renewable resources and tries to find a better pathway that integrated into account social efficiency and cost. The simulation results show that after the implementation of energy substitution, the actual electricity price will increase by about 1.6% and the electricity consumption in various sectors will also decrease, especially in the secondary industry. Overall, the marginal impact of energy substitution on the economy is significant.
Under the impact of COVID-19, the global economy has been hit hard, and the uncertainty of the energy transition has further widened. On the one hand, economic recovery needs to rely on cheaper traditional fossil energy and the pull force of energy-intensive industries. On the other hand, the anti-globalization caused by COVID-19 has made countries around the world pay more attention to energy supply security, which will bring about the renewable energy industry some new development opportunities. With a new round of industrial revolution, the contradiction between energy supply and demand has become increasingly prominent. Moreover, the increasingly serious negative effects of fossil energy utilization on the environment and energy security have become a great challenge for world economic development (Wei et al., 2019). Therefore, increasing the proportion of renewable energy and transitioning to a low-carbon energy system has become the primary goals of all countries (Watari et al., 2019).
China, the largest developing economy, has been undergoing rapid urbanization and industrialization. However, with the rapid economic growth, a series of energy problems have appeared one after another and there is huge pressure for promoting energy conservation and emission reduction (Shao et al., 2016). The coal-dominated energy supply has been meeting the requirements of electricity demand and rapid economic growth, but it also leads to environmental challenges (He et al., 2017). Thus, developing renewable energy and upgrading energy structure plays a strategically important role in China’s sustainable development (Ji and Zhang, 2019).
Fujian is a coastal province in China, which has advantages in renewable energy endowment with limited coal endowment, and the renewable energy resources has a large room for utilization. In recent years, with the strong support of national policies and the promotion of industrial policies, the proportion of renewable energy consumption in Fujian has increased continuously. However, with the development of renewable energy, Fujian has also encountered the problem of rapid expansion of the subsidy funding gap and path dependence. In this context, encouraging renewable energy power generation to participate in electricity market competition and forcing the connection to the grid with a competitive price will become the main development direction. And achieving green transformation at a lower cost has become an urgent problem in Fujian.
With rich renewable energy resources, Fujian has enormous potential for renewable power generation. The water resources in Fujian are abundant, and with good water conservancy facilities construction conditions. According to the statistics from the International Renewable Energy Agency (IRENA), the global hydropower weighted average Levelized Cost of Energy (LCOE) has increased from US$0.037/kWh in 2010 to US$0.047/kWh in 2019. Although the cost has increased, the LCOE is still lower than the cheapest new fossil fuel power generation cost. Recently, Fujian’s hydropower generation has become stable at around 30 billion kWh, and installed hydropower capacity is about 11,560 MW in 2019, approximately 85% of technically developable resources. Under the constraints of existing technology, hydropower resources have been almost exhausted and future development is limited.
In the past ten years, the cost of onshore wind power has dropped by 40%, reaching US$0.053/kWh in 2019. However, the areas with rich onshore wind energy resource tend to be economically developed, where population density is high and land resources are scarce. Thus onshore wind power development will always be restricted due to the location, and the contradiction of “wind without field” is prominent. Moreover, with the equipment upgrading, such as large-capacity offshore wind turbines, offshore wind farms have begun to take advantage of economies of scale. The overall power generation cost has dropped by 40%, and the installed cost has dropped by 18%. As of September 2019, the installed capacity of offshore wind power in Fujian was 49.0MW, accounting for 7% of the cumulative installed capacity of the country.
With the improvement of China’s key technologies for photovoltaic power generation, the conversion efficiency and manufacturing yield have increased significantly. Meanwhile, the supporting costs have also been declining. Between 2010 and 2019, the price of solar panels and the overall cost of power generation has dropped by 90% and 80%, respectively. In 2019, the cumulative installed capacity of photovoltaic power generation in Fujian was 1.69 million kW, with a rising trend. Distributed photovoltaic power generation may be the dominant trend in the future. However, since 2016, the development of solar energy in Fujian has faced difficulties, with low power generation and large fluctuations. The instability of photovoltaic power generation puts forward higher requirements for power grid peak and frequency modulation.
Overall, the amount of renewable energy power generation in Fujian has continued to increase. However, the proportion of renewable energy consumption is still low. Besides, with the gradual elimination of subsidies, the cost of renewable energy is still expensive compared with fossil energy. How to accelerate the green energy transformation and improve the renewable energy efficiency in a way that conforms to the resource characteristics of Fujian? And which kind of renewable energy consumption structure has the advantages of both efficiency and cost? To solve the prominent contradiction between energy supply and demand, these questions should be carefully considered and answered. Therefore, this paper aims to figure out the impacts and economic cost of renewable energy development and energy transition in Fujian.
The contributions and innovations of this article are as follows. First, taking Fujian as a studying case, this paper constructs a provincial CGE model based on the standard CGE model. Second, the previous studies that focus on the cost of the energy transition at the provincial level are limited. This paper simulates and analyzes the effects of the substitution of different renewable energy sources, and further evaluates the efficiency and cost of different energy transition paths. Third, this paper tries to find a more efficient pathway for Fujian’s renewable energy development based on the simulation results and the characteristics of energy utilization in Fujian.
The rest of this paper is organized as follows: Literature Review reviews some related literature. Methodology introduces the construction of the provincial CGE model. Simulation Results analyzes the simulation results. And Conclusion proposes some targeted policy suggestions.
So far, countries around the world have implemented different strategies for the energy transition. The United States and Germany play the leading role, and these two countries have explored more mature transition paths (Dong et al., 2016). Driven by the goal of ensuring energy security, the United States has promoted the national energy transformation through technological revolution, e.g., the shale gas revolution (Tran and Smith, 2017). Germany carries out the top-level system design according to the resource endowment, aiming at speeding up the transformation to a renewable energy-based consumption structure (Dong et al., 2016). The EU uses quantitative indicators to encourage members to accelerate renewable energy development, with fixed electricity prices or premium subsidies, as well as carbon trading or carbon taxes. Combining carbon standards, the energy transition continues to be accelerated (Lebelhuber and Steinmüller, 2019; Schmid et al., 2019). Among emerging economies, India has continuously increased the proportion of renewable energy through policies such as fixed electricity price and renewable quota system (Lawrenz et al., 2018). Brazil has gradually improved its long-term dependence on hydropower, oil and gas by supporting the construction of new energy sources and introducing renewable energy bidding and auction mechanisms (Gils et al., 2017). Other countries have also successively formulated energy development plans, placing renewable energy in an important strategic position (Akuru et al., 2017; Davidescu et al., 2018).
By observing the pathways in energy transition in different countries, we can find that the influencing factors of a country’s energy transition efficiency include resource endowment, energy technology innovation, subsidies and incentives for renewable energy, competitiveness, laws and the market role in energy resource allocation (Rodrigues et al., 2016; Guo et al., 2019). And countries with higher energy transition efficiency usually implement a package of plans and measures.
For a long time, China’s energy consumption structure has been uneven, heavily dependent on coal and imported oil. Geng and Ji (2014) argued that even though China’s energy self-sufficiency rate remained at a relatively high level, the energy supply security had been facing multiple challenges. Qin (2018) suggested that the energy transition pressure in China was huge. In recent years, China has introduced a series of incentive policies to encourage the development of renewable energy and clean coal utilization technologies (Chen et al., 2019). Many scholars have focused on the factors affecting the optimization of China’s energy structure. For example, Qin (2018) analyzed the reserves, production and consumption status of various energy resources in China. They pointed out that coal, natural gas and renewable energy would become the three pillars of China’s energy system. Wang et al. (2018) and Yang et al. (2019) studied China’s energy transformation and economic development through transnational comparison, they concluded that the feasible path of China’s energy transformation could be divided into three stages. Dou and Cui (2016) suggested that a high proportion of renewable energy development target would have a large negative impact on the economy. Yu et al. (2017) argued that energy storage was the precondition of large-scale integration and consumption of renewable energy system (RES). However, China’s energy storage industry was at the exploration stage and far from commercialization, which restricted the development of RES to a certain extent. Burandta et al. (2019) suggested that the Chinese government needed to increase the interaction and incentive measures of stakeholders to ease the resistance of local participants to the low-carbon transition.
According to the analysis of the current state of the energy transition in domestic and abroad, we find that different countries adopts various measures of transition, and even the same measure can exert heterogeneous effects. Increasing the consumption proportion and reducing the cost of renewable energy are the main goals of all countries. However, considering that renewable energy is intermittent, random and highly volatile, it is still a big challenge to integrate large shares of variable renewable energy into the power system (Gils et al., 2017). And the relatively high cost of renewable energy conversion and services are a common dilemma faced by many countries and regions (Hirth and Steckel, 2016). Besides, the current energy storage technology is not yet sufficient for increasing energy demand, and issues such as the competition between renewable energy and land for food production will become severe challenges in the energy transition process (Poulsen and Lema, 2017; Amigues and Moreaux, 2019).
There is no consensus yet on how to balance the relationship between transition efficiency and energy cost. Gils et al. (2017) found that the expansion of wind and solar power was more cost-efficient than the construction of additional hydroelectric plants by employing REMix energy system model. Aboumahboub et al. (2020) thought a diverse renewable energy supply through cost-optimal combination of solar PV and wind and benefiting from spatial smoothing effects of a powerful transmission grid leads to a lower storage demand than in a solar-dominated supply with low inter-regional connectivity. Wang and Zhang (2018) proposed that sufficient regulatory resources were needed to respond the load fluctuations to ensure a real-time balance of the power system. With renewable energy access to the grid on a large-scale, the difficulty in balance of the peak and valley is also increased. When regulatory resources are insufficient, it is necessary to choose to abandon wind and solar energy. Tran and Smith (2017) argued that the challenges for transformation toward renewable energy mainly include grid reliability, energy storage, system cost, and system lifetime.
The CGE model, which is a computer-based simulation, can be used to analyze the interaction of the entire economy and the inside relationships. In the CGE simulation, a general equilibrium condition can be seen as benchmark case, and a new general equilibrium will be achieved after introducing policy shocks. Babatunde et al. (2017) concluded that the application of CGE model on the field of climate change is important and numerous, especially in China. They identified the current state-of-the-art and summarized the major drivers of low carbon economy that are analyzed in the current researches. Based on the recursively dynamic CGE model, Ojha et al. (2020) discussed the role of carbon tax on policy goals in emerging economies from three aspects: faster GDP growth, greater inclusiveness and greener economy. Cui et al. (2020) analyzed the economic and environmental feasibility of reducing renewable power cuts in China. Based on the 2015–2017 renewable power reduction rate, they used a dynamic multi-sectoral CGE model to simulate the reduction in renewable energy cuts between 2021–2030. Lin and Wu (2020) constructed a recursive dynamic CGE model to predict oil demand and further studied the influences of electric vehicles on oil demand, macroeconomics and emissions. They found that in China, the oil demand could reach its peak in 2029 due to the development of electric vehicles. By using the CGE model, Xiao et al. (2020) set the eight policy scenarios to analyze the economic and environmental effects of reduction in electricity prices and coal output, and further proposed some policy targets. Huang et al. (2020) discussed several policies about clean energy transformation on income gap in China through dynamic CGE mode. Their results suggest that the low-carbon policies are important to achieve NDC targets.
In summary, most studies on energy transition at different countries usually focus on the macro and national levels, and there are limited researches focus on the cost of the energy transition at the provincial level. This paper tries to fill up the research gap. Based on the characteristics of energy utilization in Fujian Province, this paper investigates the impact of different renewable energy substitutions on transition costs by conducting a provincial CGE model.
Based on the standard CGE model, this paper combines the characteristics of the provincial economy to construct a provincial CGE model, the details are presented in Figure 1. The production sector is the principal component of production activities, which purchases intermediate inputs from the commodity market, as well as capital and labor inputs from the factor market. The commodities produced by the production sector flow into the commodity market, and the factor payment is allocated to the factor market.
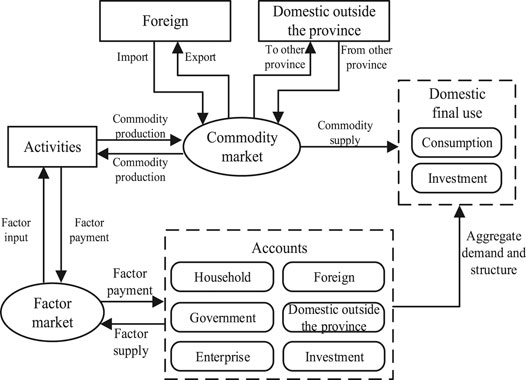
FIGURE 1. Model structure of CGE.
The source of the commodity market is life activities within the province, and the output of the commodity market ultimately supplies four types of final use, which are consumption, investment, net export, and inter-provincial net outflow. In the factor market, factor payment is paid to each subject of the national account, which include resident account, government account, enterprise account, foreign account, and domestic provincial account. There are also taxes and transfer payments across accounts, and each account satisfies the principle of income and expenditure balance. The demand for commodities in each account constitutes aggregate demand. Thus, the CGE model completes the macroscopic closure.
The production activities of the production sectors are described by the production function, and the structure is shown in Figure 2. This project refers to the setting of the mainstream CGE model and adopts the setting of the 6-layer production function. Among them, energy input is separated from intermediate input and is combined with capital and labor input requirements. In the first layer of nesting, the CES function includes two types of inputs, which are “factor-energy” and “non-energy intermediate input”. “Factor-energy” is composed of two types of inputs, including labor and capital-energy. Non-energy intermediate input is calculated according to the Leontief function based on the proportion of different intermediate inputs, and “Energy-capital” is composed of capital and energy investment.
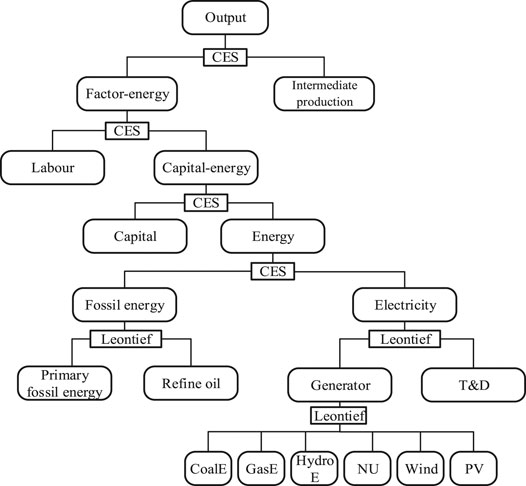
FIGURE 2. Production function structure.
As for energy input, the model adopted in this study is divided into non-electric and electric power input. Non-electric energy input includes primary fossil energy and refined oil. Different energy varieties within non-electric energy are generally difficult to be replaced. For example, refined oil is mainly used in the field of transportation or used as raw material input in chemical production, which cannot be replaced by other energy resources in a short time. And as the price of refined oil is much higher than that of coal, coal demand in the industrial sector (such as power generation) cannot be easily substituted. Therefore, the production function of non-electric energy input is set to be the Leontief function.
To meet the needs of electricity price policy determination, the power sector is split by referring to the input structure of different power in the Global Trade Analysis Project (GTAP) database when designing the CGE model structure. The split power supply consists of intermediate inputs in power generation as well as transmission and distribution. Since electricity is inseparable from transmission and distribution inputs from power generation enterprises to end-users, the production function of the power supply is Leontief type, that is, for each unit of electricity provided to the terminal, the proportion of input to power generation and input to transmission and distribution remains the same. Besides, the power generation sector has been divided into six types, including electricity, coal power, gas power, hydropower, nuclear power, wind power, and photovoltaic power. Since there won’t be huge changes in the power supply structure in the short term, then in the static model, it is assumed that the structure proportions of these six kinds of power supplies remains unchanged. When considering changes in the power supply structure, it can also be calculated by adjusting the structural coefficients of the Leontief function of the power sector.
As for the CES function, taking the production function of total output as an example, the specific form is shown in Eq. 1. Among them,
Deducing form teh CES function, the input variables has the following identity relationship. Among them,
The CES functions at each level of the production function are similar in form to the above formula and they are not described here. Besides, for intermediate inputs, the functions are Leontief type, which are presented in Eq. 4 and Eq. 5. Among them,
In the final demand, the investment function is calculated according to the Leontief function, that is, the internal structure of the investment product remains unchanged. The consumption function uses the linear expenditure system function. In the case of maximum consumer utility, it satisfies the following equation:
After obtaining the first-order optimization conditions for Eq. 6, the consumption function can be derived as Eq. 7. Where,
In the Input-Output table of Fujian, the power sector is taken as a whole. In order to describe the characteristics of the power sector, the power sector needs to be further split. The splitting process first needs to determine the composition of different types of power sources and transmission and distribution in power costs. As for the proportion of transmission and distribution costs in the cost structure, it can be obtained by dividing the transmission and distribution price by the retail electricity price in the National Energy Administration’s “2017 National Electricity Price Regulatory Bulletin”. As for the proportion of other power sources, according to the on-grid electricity prices of different power sources and the on-grid electricity rates of different power sources in Fujian Province in 2018 China Power Yearbook, the on-grid costs of different power sources can be calculated, and then the proportion of the on-grid costs of different power sources in the terminal power cost can be calculated. The Input-Output table shows the data of value quantity, but different physical quantities of electricity are needed when considering the impact of energy transformation. Therefore, when considering the input of the power sector in the production function, the conversion of physical quantities and value quantities is required.
The corresponding physical quantity can be calculated according to Eq. 8 for every one unit of electricity consumption. Among them,
As the prices of different power sources are different, when simulating changes in the power supply structure, by adjusting
The Input-Output table is the key to construct the CGE model, and its compilation requires a large amount of national economic accounting data. Generally, the input-output table is compiled every 5 years. At present, the latest data in Fujian Province is the 2017 Fujian Input-Output Table compiled in 2020, which contains 142 departments. In order to facilitate the construction of the model, this paper merges and splits the Input-Output table and the power production and supply department is divided into the transmission and distribution department and six power generation departments. In the process of splitting, the total input of each transmission, distribution, and different power supply is determined according to the proportion of the total input in the power department. Then, according to the input structure of different power sources in the GTAP database, the input structure of the split department is decomposed. Besides, other departments are merged according to the features of the industry, and finally, the Input-Output table of 30 sectors can be obtained. The department settings are presented in Table 1, and the Social Accounting Matrix (SAM) table is compiled based on data from Fujian Statistical Yearbook, Fujian Financial Yearbook, China Statistical Yearbook, and China Financial Yearbook.
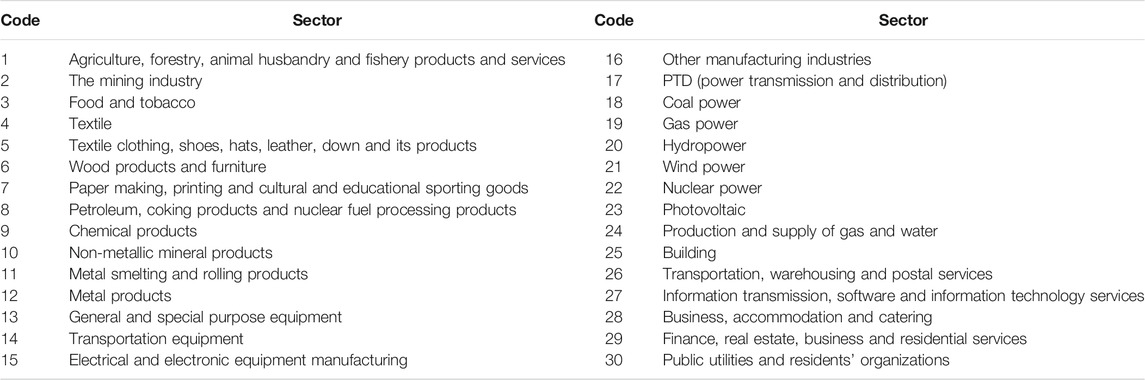
TABLE 1. The settings of 30 sectors.
The power generation structure of Fujian is shown in Figure 3. Among them, coal and gas power generation account for 52.1% in total. Besides, nuclear power and hydropower generation account for 44.6% in total, while wind and photovoltaic power generation only account for 3.3% in total. Since coal power generates the highest carbon emissions for each unit electricity production, this paper assumes that coal power will be gradually replaced by other power sources during the simulation process.
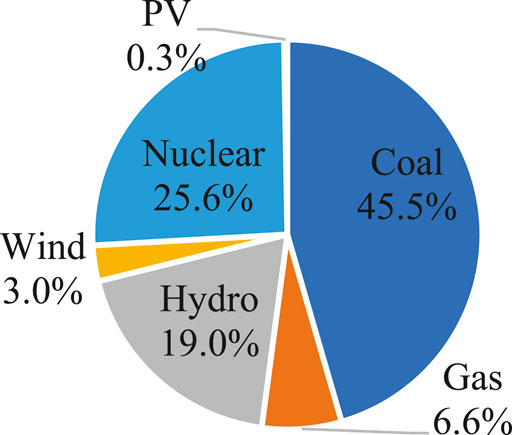
FIGURE 3. Fujian’s power generation structure in 2017.
In the simulated scenario, we first separately examine the impact of increasing the proportion of hydropower, nuclear power, wind power and photovoltaic in the power generation structure. The following four scenarios correspond to the impact of a 1% increase in the share of these four sources in the power generation structure, and the simulation results are shown in Figure 4. It can be seen from Figure 4 that only an increase in the proportion of hydropower will lead to a positive increase in economic output. The increases in the proportion of nuclear power, wind power, and photovoltaics will lead to a decline in economic output, and photovoltaics have the greatest impact on economic output. Conversely, the growth of hydropower will cause the price of electricity to fall, while the growth of nuclear power, wind power, and photovoltaics will lead the price of electricity to increase.
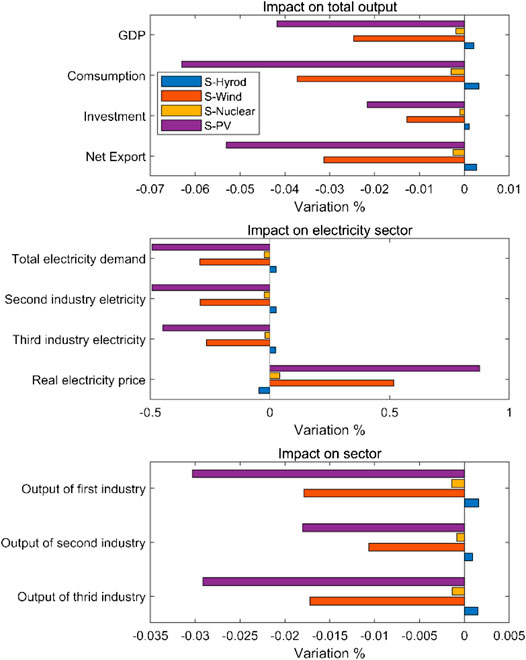
FIGURE 4. The marginal impact of different power sources growth.
According to the power structure of Fujian Province’s 13th Five-Year Plan and the power generation structure in 2017, the changes in the power structure of Fujian Province by 2020 are calculated and the overall changes in the power structure are simulated. Besides, according to the growth rate of different power supply structures in the 13th Five-Year Plan, the annual growth rate of different power supply installations can be calculated. Under the condition that the operating hours of power generation remain unchanged, the growth rate of installed power supply is the same as that of power generation, then the change of power structure can be calculated accordingly.
As can be seen from Table 2, wind power and photovoltaic power generation have the most forceful development momentum. During the “13th Five-Year Plan” period, wind power has increased by 184%, with an average annual growth rate of 23.22%. Photovoltaic power generation has increased by 500%, with an average annual growth rate of 43.10%. Hydropower was almost unchanged. Compared with 2017, in the energy consumption structure of Fujian Province in 2020, the proportion of wind power, photovoltaic power, and hydropower will change by 2.2, 0.95, and 3.64%, respectively. According to the analysis in The Influence of Different Power Supply Changes, the increase in the proportion of hydropower will lead to a positive increase in economic output. However, hydropower in Fujian was almost unchanged during the 13th Five-Year Plan. Therefore, there is a contradiction between renewable energy development and economic development.
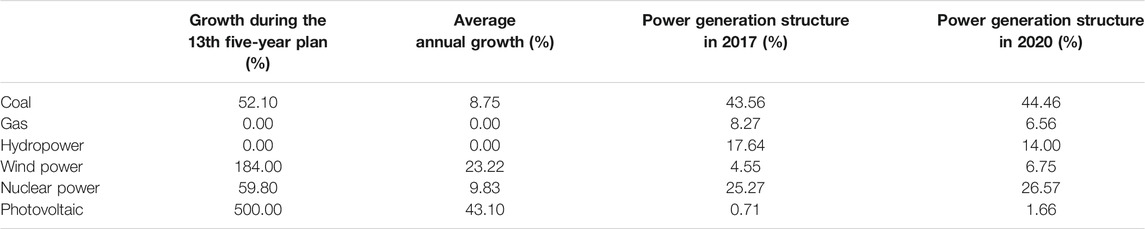
TABLE 2. Changes in power generation structure.
Table 3 lists the simulation results of the macroeconomic impact. The power structure transition will reduce Fujian’s GDP by 0.08%. However, the impact varies across national accounts. Compared to fossil energy generation, the renewable energy sector has a higher value added and therefore leads to higher incomes for household and enterprise. However, the overall level of tax burden in the renewable energy sector is low and even subsidies are required, thus leading to lower government income. Real electricity prices will rise by 1.64% due to the higher cost of generating electricity from renewable sources, which will also have a negative impact on consumption, investment and net exports.
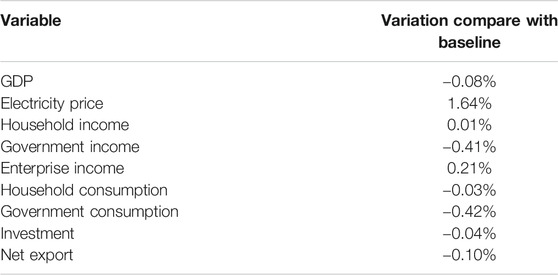
TABLE 3. Impact on macroeconomic.
The increase in the actual electricity price will lead to cost raise in various sectors and negatively affect the output of each department. Meanwhile, producers will respond to electricity price raises and substitute electricity input by other factor inputs. Hence, electricity consumption in various sectors will decline, which can be illustrated by Figure 5. Among them, the electricity consumption of electrical and electronic equipment fell the most, with a drop of 1.64%. Electricity consumption in the mining industry has fallen less, only by 0.98%.

FIGURE 5. Changes in electricity consumption by sector.
This paper applies the provincial CGE model to analyze the cost of the energy transition to renewable resources, taking Fujian as an studying case. The simulation results show that the growth of hydropower will cause the price of electricity to fall, and positive effect the gross output. However, the growth of nuclear power, wind power, and photovoltaics will lead the price of electricity to increase and have a negative impact on the economy. According to the 13th Five-Year Plan of Fujian Province, the energy transition will increase actual electricity price by about 1.6%, and the GDP will decline by 0.08%. The electricity consumption of each sectors will also be affected. Overall, the marginal impact of energy substitution on the economy is significant. Therefore, the future energy development pattern of Fujian should gradually shift to the clean energy system.
On April 15, 2020, the document entitled “the notice on the formulation of the 14th Five-year Plan for the development of renewable energy” was released, which stressed that the market-based low-cost development strategy of renewable energy would be highlighted in the future. Therefore, the development of renewable energy in Fujian during the 14th Five-Year Plan period must focus on the strategy of “four revolutions and one cooperation”. It is necessary for Fujian to scientifically put forward a renewable energy development plan based on energy resource endowment and renewable energy development status. Through this way, the costs of the renewable energy can be continuously reduced, and the goal of high efficiency and high-quality can be obtained. According to the above discussions and conclusions, we put forward the following suggestions.
First, to better utilize renewable energy resources, it is necessary to systematically evaluate Fujian’s energy endowment and coordinate the relationship between the renewable energy development and national land planning. According to the above analysis, the impact of different types of renewable energy development on Fujian’s economic output is heterogeneous. However, the development of renewable energy also needs to fully consider the feasibility of planning. The government should scientifically demonstrate the development goals and principal task based on renewable energy resource endowment. Moreover, related local departments should comprehensively assess the current status of renewable energy development in Fujian, and carefully analyze influencing factors such as the endowment constraints, technological development trends, and the ability to absorb renewable energy technologies. Besides, the government needs to put forward reasonable overall goals and specify the subclass goals.
Second, it is essential to promote local electricity consumption and inter-provincial electricity transmission. The local government of Fujian needs to focus on the energy balance in East China and increase their influence on surrounding areas. The electricity demand from other provinces will also help to promote the development of renewable energy in Fujian and the highly efficient transmission network provides the indemnification for optimal resource allocation. Thus, effective measures are needed to actively improve renewable energy demand and expand inter-provincial transmission. Besides, the optimal power resource allocation should be improved with the marketization of power spot.
Finally, the government should fully consider the affordability of the economy when developing renewable energy. According to the simulation results, in addition to hydropower, the development of other renewable energy sources will lead to a decline in economic output. Therefore, how to develop renewable energy while ensuring economic growth is a key issue worthy of government attention. Fujian can take various measures to promote cooperation among universities and scientific research institutions, and encourage innovation and technological progress in utilization of renewable energy. The environment with intellectual property protection will promote the extension of the renewable energy industry chain, making new industries the main driving force for economic growth.
The original contributions presented in the study are included in the article/Supplementary Material, further inquiries can be directed to the corresponding authors.
CL, Writing‐original draft, Formal Analysis, Methodology, Software; YL, Writing‐review & editing, Investigation, Software; QC, Writing‐original draft, Conceptualization, Data curation; PS, Writing‐review and editing, Methodology; MS, Writing‐review and editing, Funding acquisition, Supervision, Validation, Project administration; WW, Writing‐review and editing, Methodology, Validation.
This paper is supported by the National Natural Science Foundation of China (Grant No. 71934001) and National Social Science Fund of China (Grant No. 20ZDA084).
Authors CL, YL, QC, PS were employed by the company State Grid Fujian Electric Power Co., Ltd.
The remaining authors declare that the research was conducted in the absence of any commercial or financial relationships that could be construed as a potential conflict of interest.
Aboumahboub, T., Brecha, R. J., Shrestha, H. B., Fuentes, U., Geiges, A., Hare, W., et al. (2020). Decarbonization of Australia's energy system: integrated modeling of the transformation of electricity, transportation, and industrial sectors. Energies 13 (15), 3805. doi:10.3390/en13153805
Akuru, U. B., Onukwube, I. E., Okoro, O. I., and Obe, E. S. (2017). Towards 100% renewable energy in Nigeria. Renew. Sustain. Energy Rev. 71, 943–953.
Amigues, J.-P., and Moreaux, M. (2019). Competing land uses and fossil fuel, and optimal energy conversion rates during the transition toward a green economy under a pollution stock constraint. J. Environ. Econ. Manag. 97, 92–115. doi:10.1016/j.jeem.2019.03.006
Babatunde, K. A., Begum, R. A., and Said, F. F. (2017). Application of computable general equilibrium (CGE) to climate change mitigation policy: a systematic review. Renew. Sustain. Energy Rev. 78, 61–71. doi:10.1016/j.rser.2017.04.064
Burandt, T., Xiong, B., Löffler, K., and Oei, P.-Y. (2019). Decarbonizing China's energy system - modeling the transformation of the electricity, transportation, heat, and industrial sectors. Appl. Energy 255, 113820. doi:10.1016/j.apenergy.2019.113820
Chen, C., Xue, B., Cai, G., Thomas, H., and Stückrad, S. (2019). Comparing the energy transitions in Germany and China: synergies and recommendations. Energy Rep. 5, 1249–1260. doi:10.1016/j.egyr.2019.08.087
Cui, Q., Liu, Y., Ali, T., Gao, J., and Chen, H. (2020). Economic and climate impacts of reducing China's renewable electricity curtailment: a comparison between CGE models with alternative nesting structures of electricity. Energy Econ. 91, 104892. doi:10.1016/j.eneco.2020.104892
Davidescu, S., Hiteva, R., and Maltby, T. (2018). Two steps forward, one step back: renewable energy transitions in Bulgaria and Romania. Publ. Adm. 96 (3), 611–625. doi:10.1111/padm.12522
Dong, J., Feng, T.-t., Sun, H.-x., Cai, H.-x., Li, R., and Yang, Y. (2016). Clean distributed generation in China: policy options and international experience. Renew. Sustain. Energy Rev. 57, 753–764. doi:10.1016/j.rser.2015.12.171
Dou, X., and Cui, H. (2016). Low-carbon society creation and socio-economic structural transition in China. Environ. Dev. Sustain. 19 (5), 1577–1599. doi:10.1007/s10668-016-9834-3
Geng, J.-B., and Ji, Q. (2014). Multi-perspective analysis of China's energy supply security. Energy 64, 541–550. doi:10.1016/j.energy.2013.11.036
Gils, H., Simon, S., and Soria, R. (2017). 100% renewable energy supply for Brazil-the role of sector coupling and regional development. Energies 10 (11), 1859.
Guo, P., Kong, J., Guo, Y., and Liu, X. (2019). Identifying the influencing factors of the sustainable energy transitions in China. J. Clean. Prod. 215, 757–766.doi:10.1016/j.jclepro.2019.01.107
He, G., Zhang, H., Xu, Y., and Lu, X. (2017). Editorial: clean power transition in China. Resour. Conserv. Recycl. 117, 262–263. doi:10.1016/j.resconrec.2016.10.009
Hirth, L., and Steckel, J. C. (2016). The role of capital costs in decarbonizing the electricity sector. Environ. Res. Lett. 11 (11), 114010. doi:10.1088/1748-9326/11/11/114010
Huang, H., Roland-Holst, D., Wang, C., and Cai, W. (2020). China's income gap and inequality under clean energy transformation: a CGE model assessment. J. Clean. Prod. 251, 119626. doi:10.1016/j.jclepro.2019.119626
Ji, Q., and Zhang, D. (2019). How much does financial development contribute to renewable energy growth and upgrading of energy structure in China?. Energy Pol. 128, 114–124. doi:10.1016/j.enpol.2018.12.047
Lawrenz, L., Xiong, B., Lorenz, L., Krumm, A., Hosenfeld, H., Burandt, T., et al. (2018). Energy pathways for the low-carbon transformation in India-A model-based analysis. Energies 11 (11), 3001. doi:10.3390/en11113001
Lebelhuber, C., and Steinmüller, H. (2019). How and to which extent can the gas sector contribute to a climate-neutral European energy system? A qualitative approach. Energy Sustain. Soc. 9 (1), 23. doi:10.1186/s13705-019-0207-2
Lin, B., and Wu, W. (2020). The impact of electric vehicle penetration: a recursive dynamic CGE analysis of China. Energy Econ. 94, 105086. doi:10.1016/j.eneco.2020.105086
Ojha, V. P., Pohit, S., and Ghosh, J. (2020). Recycling carbon tax for inclusive green growth: a CGE analysis of India. Energy Pol. 144, 111708. doi:10.1016/j.enpol.2020.111708
Poulsen, T., and Lema, R. (2017). Is the supply chain ready for the green transformation? The case of offshore wind logistics. Renew. Sustain. Energy Rev. 73, 758–771. doi:10.1016/j.rser.2017.01.181
Qin, J. (2018). “The status and prospect of new energy and renewable energy in China,” in AIP Conference Proceedings 1971, Hangzhou, China, April 14–15, 2018, 030021.
Rodrigues, S., Torabikalaki, R., Faria, F., Cafôfo, N., Chen, X., Ivaki, A. R., et al. (2016). Economic feasibility analysis of small scale PV systems in different countries. Sol. Energy 131, 81–95. doi:10.1016/j.solener.2016.02.019
Schmid, D., Korkmaz, P., Blesl, M., Fahl, U., and Friedrich, R. (2019). Analyzing transformation pathways to a sustainable European energy system-Internalization of health damage costs caused by air pollution. Energy Strategy Rev. 26, 100417. doi:10.1016/j.esr.2019.100417
Shao, S., Luan, R., Yang, Z., and Li, C. (2016). Does directed technological change get greener: empirical evidence from Shanghai's industrial green development transformation. Ecol. Indicat. 69, 758–770. doi:10.1016/j.ecolind.2016.04.050
Tran, T. T. D., and Smith, A. D. (2017). fEvaluation of renewable energy technologies and their potential for technical integration and cost-effective use within the U.S. energy sector. Renew. Sustain. Energy Rev. 80, 1372–1388. doi:10.1016/j.rser.2017.05.228
Wang, C., Engels, A., and Wang, Z. (2018). Overview of research on China's transition to low-carbon development: the role of cities, technologies, industries and the energy system. Renew. Sustain. Energy Rev. 81, 1350–1364. doi:10.1016/j.rser.2017.05.099
Wang, J., and Zhang, L. (2018). “Analysis of the impact of heating-thermal generators flexibility expansion on promoting renewable energy integration based on production cost simulation,” in 2018 2nd IEEE Conference on Energy Internet and Energy System Integration (EI2). Beijing, China, August 1, 2018.
Watari, T., McLellan, B. C., Giurco, D., Dominish, E., Yamasue, E., and Nansai, K. (2019). Total material requirement for the global energy transition to 2050: a focus on transport and electricity. Resour. Conserv. Recycl. 148, 91–103. doi:10.1016/j.resconrec.2019.05.015
Wei, Y.-M., Liang, Q.-M., Wu, G., and Liao, H. (2019). Effects of clean and renewable energy on national energy security. Energy Econ., 253–270. doi:10.1108/978-1-83867-293-520191010
Xiao, K., Li, F., Dong, C., Cai, Y., Li, Y., Ye, P., et al. (2020). Unraveling effects of coal output cut policy on air pollution abatement in China using a CGE model. J. Clean. Prod. 269, 122369. doi:10.1016/j.jclepro.2020.122369
Yang, W., Zhao, R., Chuai, X., Xiao, L., Cao, L., Zhang, Z., et al. (2019). China's pathway to a low carbon economy. Carbon Bal. Manag. 14 (1), 14. doi:10.1186/s13021-019-0130-z
Keywords: energy cost, transition efficiency, COVID-19, CGE model, fujian
Citation: Lin C, Li Y, Cai Q, Shi P, Song M and Wu W (2021) Evaluation on the Cost of Energy Transition: A Case Study of Fujian, China. Front. Energy Res. 9:630847. doi: 10.3389/fenrg.2021.630847
Received: 10 December 2020; Accepted: 19 January 2021;
Published: 23 February 2021.
Edited by:
Qiang Ji, Chinese Academy of Sciences, ChinaReviewed by:
Ailun Wang, Southwestern University of Finance and Economics, ChinaCopyright © 2021 Lin, Li, Cai, Shi, Song and Wu. This is an open-access article distributed under the terms of the Creative Commons Attribution License (CC BY). The use, distribution or reproduction in other forums is permitted, provided the original author(s) and the copyright owner(s) are credited and that the original publication in this journal is cited, in accordance with accepted academic practice. No use, distribution or reproduction is permitted which does not comply with these terms.
*Correspondence: Malin Song, c29uZ21hcnRpbkAxNjMuY29t; Wei Wu, d2Vpd3VfeG11QDE2My5jb20=
Disclaimer: All claims expressed in this article are solely those of the authors and do not necessarily represent those of their affiliated organizations, or those of the publisher, the editors and the reviewers. Any product that may be evaluated in this article or claim that may be made by its manufacturer is not guaranteed or endorsed by the publisher.
Research integrity at Frontiers
Learn more about the work of our research integrity team to safeguard the quality of each article we publish.