 Sylvia Manjeri Aarakit
 Vincent Fred Ssennono
 Muyiwa S. Adaramola
- 1Department of Entrepreneurship, Faculty of Entrepreneurship and Business Administration, Makerere University Business School, Kampala, Uganda
- 2Faculty of Graduate Studies and Research, Makerere University Business School, Kampala, Uganda
- 3Faculty of Environmental Sciences and Natural Resource Management, Norwegian University of Life Sciences, Aas, Norway
With only 28% of the population having access to electricity, Uganda presents a huge market potential for alternative technologies to provide electricity such as solar PV systems. Using a simple statistical method (neighbourhood approach), this study estimates the market potential for solar PV in households based on a 2018 National Electrification Survey dataset collected by Uganda Bureau of Statistics (UBOS). Results show that approximately 5.3 million households lack access to electricity, thus the total market potential. Over 60% of households lack access to electricity due to supply-side gaps (also known as absence of coverage) while the rest of the households have coverage but lack access due to demand side limitations (also known as no uptake). On the contrary, our results suggest that supply-side gaps constitute the biggest proportion of electricity access deficit in Uganda’s households. Implying that these households may be willing and have the ability to pay but lack supply, thus these households constitute an immediate market potential for solar PV systems. To address the electricity access deficit, private solar companies should target unserved households with appropriate systems/products and innovative business models to suit their needs. Government on the other hand should subsidize households with affordability challenges or enhance their income.
Introduction
Electricity is crucial for human development. In Sub-Saharan Africa about 621 million people lack access to electricity and the number is anticipated to increase due to unprecedented population growth (IEA, 2019). In Uganda, approximately 28% of the population have access to while the over 70% of the population continue to rely on biomass or fossil powered technologies, such as kerosene wick lamps locally known as “tadooba,” used batteries, torches, and candles to meet household energy needs (Uganda Bureau of Statistics, 2018). Use of traditional biomass and associated technology causes health problems, climate change (World Health Organization, 2016) and threatens sustainable development (Terrapon-Pfaff et al., 2018; Lee et al., 2020).
Numerous attempts to increase the proportion of households with access to electricity have coincided with technological innovations leading to the emergence of off-grid solar PV as a viable alternative (Energy Africa-Uganda, 2018; Grimm et al., 2019). Uganda is among countries with high solar energy resource potential, on average, estimated to be approximately 5.2 kWh per square meter per day (Biira and Kilama, 2014). This high level of solar insolation, couple with average daily sunshine of about 8 h throughout the year, provides an excellent potential for solar energy use and development of solar energy conversion systems in the country (Biira and Kilama, 2014). In addition, government, since 2011 is increasingly investing in policy programs to attract investors into the off-grid solar market with major focus on increasing uptake of solar PV systems1 (UOMA, 2018). So far, the household sub-sector is possibly one of the biggest markets for solar PV systems in Uganda (World Bank, 2018). However, the market potential for solar PV in households remains relatively unclear for both investors and policy makers.
Available literature shows that the historical growth of solar PV market in Uganda is a result of low access to electricity mainly due to supply-side limitations (Mugagga and Chamdimba, 2019). At the same time, Blimpo et al. (2020) argue that the widening electricity access gap in most of SSA is attributable to demand side limitations. However, the few studies that have attempted to estimate the solar PV market potential are mainly non-empirical studies and they ignore the supply and demand side limitations (Lighting Africa, 2014; Energy Africa-Uganda, 2018). Non-empirical studies tend to serve the interests of individual companies or research bodies and their analysis is based on small samples often unsuitable for policy formulation. Therefore, this study provides an empirical estimation of solar PV market potential in households based on demand and supply side limitations of existing electricity infrastructure. The study is guided by three research objectives;
(1) To find out the proportion of households without access to electricity due to demand-side limitations
(2) To find out the proportion of households without access to electricity due to supply-side gaps
(3) To estimate the total market potential for solar PV systems in households.
The contribution of the paper is threefold. First, the paper posits that in Uganda, the electricity access deficit is more associated with supply side limitations contrary to existing literature, which indicated that demand side limitations contribute significantly to energy access deficit (Blimpo et al., 2020). Second, the study adopts neighbourhood approach to estimate the market potential for solar PV (Foster and Araujo, 2004; Wodon et al., 2009. This approach uses mathematical notations to assess demand and supply-side gaps limiting coverage or access rates of electricity and bases on the two gaps to estimate the underserved and unserved electricity market. The interest in electricity stems from the global Sustainable Development Goals (SDG 7.1 “to ensure access to affordable, reliable and modern energy services for all by 2030”) and Uganda’s National Vision 2040 (National Planning Authority-NPA, 2020). Third, the analysis is based on a recent nationally representative data set (National Electrification survey, 2018). The data captures electricity access deprivations (using five attributes in different Tiers) based on the global electricity access tracking framework also known as “Multi-Tier Framework” of World Bank (Bhatia and Angelou, 2015). The findings of the study will be useful for solar companies, policy makers and researchers. Solar companies can use the findings to make informed investment decisions and for market segmentation. Policy makers can use the findings not only in designing appropriate policies on electricity access but also to direct policy incentives such as tax subsidies to the right stakeholders.
The rest of the paper is arranged as follows; Section Literature presents Literature review, Section Methodology presents data and methodological approach, Section Results provides results; Section Discussion presents discussion of findings while Section Conclusion, Implications and Future Research consists of conclusion, implications, and areas for further studies.
Literature
Energy Sector and Structure in Uganda
The Government’s Policy Vision on energy is to increase the proportion of households with access to electricity from 11% in 2010 to 21% in 2015 (NDPI) to 30% in 2020 (NDP II) to 60% 2025 (NDP III) and to 80% in 2040 (National Planning Authority-NPA, 2020). However, so far electricity access targets for NDPI and NDPII have not been realised (Ministry of Finance,Planning and Economic Development -MOFPED, 2020). Some of the key challenges identified include high cost of electricity (i.e., currently 9 cents (USD) per unit for each household’s user), low availability, capacity limitation, unreliable supply, and inadequate Institutional and regulatory frameworks (National Planning Authority-NPA, 2020). To address the persistent energy access challenges, government is increasingly investing in strengthening the institutional policy and legal framework on one hand and promoting investment in alternative renewable technologies such as solar, wind, and bioenergy at a household level.
The legislative framework of the energy sector is comprised of the Electricity Act (1999) that provides the regulatory framework for the electricity sub-sector. The policy framework is comprised of the Energy Policy (2002; 2019) whose goal is “to meet the energy needs of Uganda’s population for social and economic development in an environmentally sustainable manner;” the Renewable Energy Policy (2007), which aims to increase the share of renewable energy in the national energy mix, and the Electricity Connection Policy (2018), which aims to increase access and provide cleaner energy for Ugandans. In addition, other regulatory institutions include; 1) Ministry of Energy & Mineral Development (MEMD) –the policy-making agency for the energy sector. 2) Rural Electrification Authority (REA)- mandated to increase access to electricity in rural and marginalised areas. 3) Electricity Regulatory Authority (ERA) that sets tariffs and issues electricity generation and transmission licenses. 4) Uganda National Bureau of Standards (UNBS) –enforces the use of standards to protect the public’s health and safety. 5) Uganda Energy Credit Capitalisation Company (UECCC) –facilitates investment in Uganda’s renewable energy sector, primarily through private sector participation (Energy Africa-Uganda, 2018).
The sector’s mandate is also governed by other sector policies, including Climate Change Policy (2015), which supports energy policy implementation through the promotion and development of new clean energy technologies to reduce Greenhouse Gas (GHG) emissions. The sector also ascribes to international and regional legal and policy frameworks for instance the UN SDGs, Sustainable Energy for All (SEforAll), East African Community laws and policies, among others (Ministry of Energy and Miniral Development, 2018). The off-grid electricity market in Uganda is governed by other frameworks such as; Rural Electrification Strategy Plan (RESP) 2013–2022 (2012) and (3) National Development Plan III (NDP-III) (2020). The mandate of the RESP is to increase the rural electrification rate to 22% by 2022 using both grid and off grid technologies.
Despite the presence of elaborate legal, institutional, and regulatory frameworks, the energy access gap keeps widening and policy makers fear that the country may not attain the global energy access goal (National Planning Authority-NPA, 2020). Currently, the government is emphasising the need to increase investment in alternative renewable technologies particularly solar PV systems. However, the current market potential for solar PV systems is unknown.
Market Opportunities for Solar Photovoltaic-Supply Side Factors
Opportunities within the solar PV sector are underlined by the government’s ambitious target to increase electricity supply to 80% by 2040. Overall, renewable energy resources (hydropower, geothermal, solar energy, and biomass) are expected to contribute 12,700 MW to the national electricity mix in 2040. Particularly, solar energy is planned to contribute 5000 MW out of the anticipated total cumulative capacity of 41,700 MW by 2040. Although the installed capacity of solar energy-based power is currently 1% (50.8 MW) of 5,000 MW, solar energy has a great potential to provide about 39.4% of the renewable-based power capacity by 2040 (Electricity Regulatory Authority-ERA, 2020). Indeed, the solar PV market growth potential in Uganda is promising (UOMA, 2018).
The main factors behind the growth in the solar PV market potential include a drop in global prices for solar PV systems, inadequate electricity infrastructures (transmission and distribution), low levels of grid access nationally and particularly in rural areas, increased investment in awareness campaigns from the government and donor agencies, emergency of new business models, and increased grid electricity outages (Blimpo et al., 2020; Goyal et al., 2019; Energy Africa-Uganda, 2018). In addition, the government of Uganda introduced tax subsidies particularly VAT and import duty exemptions for some solar systems and components making solar PV affordable for households (Uganda Solar Energy Association (USEA), 2019).
Additionally, numerous developmental institutions are actively supporting efforts to scale uptake of solar PV systems. These institutions include DFID, World Bank, GIZ, UNCDF, and USAID2, and they play different roles to achieve this goal. The DFID supports an initiative focusing on removing policy and regulatory barriers to solar PV market expansion, while World Bank’s Lighting Africa aims at catalysing the market by providing market intelligence on the demand for off-grid solar products and supports awareness campaigns. Furthermore, the UNCDF (CleanStart) supports poor households and micro-entrepreneurs to jump start their access to clean energy through microfinance, while the USAID’s Scaling off-grid Energy Enterprise Awards Program provides seed funding to solar companies that provide innovative solutions to scale up the use of SHS to unelectrified areas. Another USAID initiative, Power Africa Uganda Electricity Supply Accelerator (PAUESA) focuses on support to energy generation and access projects through grants, transaction advisory support, short term grants, and technical assistance.
Market Opportunities for Solar Photovoltaic-Demand Side Factors
With national electricity access of about 28% (Ministry of Energy and Mineral Development, 2019) compared to Sub-Saharan Africa’s average of 42%, Uganda is one of the countries with the lowest electricity consumption level, estimated at about 100 kWh per capita (IEA, 2018). The consumption mix is dominated by biomass in the form of firewood, charcoal, and crop residues estimated at about 88% followed by oil products accounting for 10% and electricity at 2% (Ministry of Energy and Mineral Development, 2019). This implies that approximately 27 million (about 72%) people lack access to the electricity network nationally while only 9% of the population in rural areas are electrified. Unfortunately, households without access to electricity rely on technologies such as kerosene lamps and battery powered torches to meet their lighting needs. These alternatives, apart from being more expensive are also unsafe and cause health problems (Grimm et al., 2019). A recent survey by Uganda Bureau of Statistics shows that the willingness to pay for electricity service is high among those unserved. However, some members expressed disappointment with grid electricity due to unreliability (Uganda Bureau of Statistics, 2018).
Solar PV uptake on the other hand is growing but the spatial distribution remains asymmetrical. The proportion of households with solar PV has increased tremendously, this may imply growth in demand for solar PVs. By 2018 (Figure 1), solar PV adoption in all regions increased to above 3% except for Kampala (Ministry of Energy and Miniral Development, 2018).
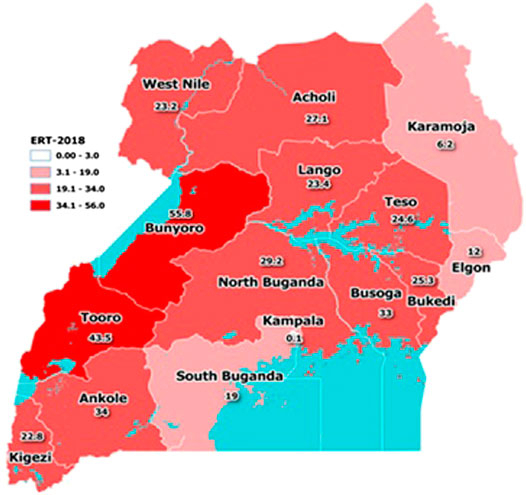
FIGURE 1. Spatial distribution of solar PV by sub-region in 2018 (Source: Authors’ calculation based on National Electrification Survey 2018).
Market Potential for Solar Photovoltaic System (Electricity Access Deficit)
To estimate the market potential, there is need to ascertain the demand-side gaps, supply-side gaps, or both (Blimpo et al., 2018). Electricity coverage and uptake rates vary significantly within Uganda, with a high concentration in urban and some peri-urban areas while low concentration is more pronounced in rural areas (Blimpo, et al., 2020). A study conducted in 150 communities in western Kenya finds that electricity uptake remained very low, even for relatively well-off households, averaging 6% for households (Lee et al., 2016). Similarly, an evaluation of a large electrification project in Tanzania shows uptake was less than one-third of what was initially projected (Chaplin et al., 2017).
The demand-side limitations/gaps constitute households who may not be able to afford to pay for electricity services despite living near an electricity distribution system line. Lack of affordability may be due to different reasons including high electricity tariffs or connection charges, illegal tenure that makes it difficult for the utility company to accept the household as a client, or poor quality of service (Uganda Bureau of Statistics, 2018). A cross country study in SSA revealed that 41% of the access deficit were associated with demand-side constraints (Blimpo, et al., 2020) such as low household income, housing quality, the reliability, and quality of electricity (Blimpo et al., 2018; Mensah, 2018). In some cases, many households are unable to pay monthly bills while others could not afford to pay for consumption beyond the subsidized level hence contributing to reliability challenges (Banerjee et al., 2008; Blimpo and Cosgrove-Davies, 2019). In addition, poor housing quality is among key demand side limitations. A good example is in South Africa, where an initiative was put in place to transfer 1.7 million residents from informal to a formalized housing settlement before electrification could take place (Niez, 2010). Furthermore, poor quality of voltage was identified in Tanzania as a constraint on the Island of Zanzibar (Jacome et al., 2019). Relatedly, many other studies reveal that, most households in SSA install low-capacity solar products, which by world bank standards are considered no access (Coville et al., 2019; Grimm, et al., 2016; Bensch, et al., 2018).
The situation in Uganda is not any different. Apart from limited access, even areas with grid electricity, households hardly get connected often due to prohibitive costs. With many households still below the poverty line this is not an affordable option. This could imply that, solar PV may present an alternative option for addressing electricity access problems in rural areas where there is no access at all, and urban areas where the grid is not reliable (Mugagga and Chamdimba, 2019). In addition, over 80% of households in Uganda using lanterns/lamps are considered to be in Tier 0, of which majority are rural households (Uganda Bureau of Statistics, 2018). This is because the lamps/lanterns dominantly used in households are incapable of providing light for at least four hours a day and one hour in the evening, or power basic appliances like charging mobile phone and radios. The World Bank uses a Multi-Tier Framework approach to group households by electricity access attributes3 that depict demand and supply side aspects to define tiers of access (Bhatia and Angelou, 2015). The different dimensions of access in the tiers further depict deprivations at each level of access, these are useful in identifying the underserved electricity market.
On the other hand, supply-side limitations constitute households living in areas that do not have access to electricity (also known as unserved households). It includes those who live in a neighbourhood with access but may live too far from the electricity distribution line, thereby making it unviable or unfeasible to have a chance to be connected to it (Wodon et al., 2009; Tsimpo and Wodon, 2014). Similarly, some households may be willing to pay for connection, but there may be a lack of capacity within the utility company to provide such connections, for example due to limited resources or infrastructures (Sievert and Steinbuks, 2020). In addition, the quality of electricity services is also labelled a supply side constraint in that, if a household experiences frequent and long-lasting blackouts, should we consider it as having access? For example, in Liberia, over 50% of connected households report that they never have electricity. Sierra Leone, Uganda, Mozambique, and Niger all report severe reliability problems with over 30% of electrified households reporting never having electricity (Blimpo and Cosgrove-Davies, 2019). Another issue is voltage availability. The electricity available to households might be sufficient to light up a low voltage light bulb but is not enough to power even a small appliance such as a fan. Further still, Dagnachew et al. (2020) show that the absence of overall plans and approaches and lack of clarity in policies provides a plausible explanation for low electricity access in SSA.
From the above literature, demand and supply constraints to electricity access are interlinked and both contribute to the electricity access deficit. In this study, we use the supply side and demand side gaps/limitations as inputs in estimating the unserved and underserved households which in turn is considered the market potential for alternative electricity sources. Available evidence shows that demand side limitations contribute significantly to energy access deficit (Blimpo, et al., 2020). However, our argument is that in Uganda, the electricity access deficit is more associated with supply side limitations.
Methodology
Data Sources
This study used data from the 2018 National Electrification Survey, collected from 5,491 households by the Uganda Bureau of Statistic following the multi-tier framework of Energy access (Ministry of Energy and Miniral Development, 2018). The survey provided information on 1) status of on-grid and off-grid households connections; 2) energy connectivity in schools, health centres and enterprises; 3) access, use, reliability and affordability of energy in households and institutions; 4) key barriers to access, connectivity and the productive use of energy by households and institutions; and 5) willingness to pay for clean energy.
A two-stage sampling design was used to draw the sample for the NES survey. At first stage, Enumeration Areas (EAs) were drawn with Probability Proportional to Size (PPS) and at the second stage, households were the ultimate sampling units drawn using simple Random Sampling (SRS). A total of 6,380 households were selected from 638 EAs using the 2014 Uganda Population and Housing Census and 5,491 households successfully responded, while 889 households never responded due to various reasons (Ministry of Energy and Miniral Development, 2018). All estimates are weighted to the total number of households in the country and the data is nationally representative by rural-urban and four statistical regions in Uganda.
Estimation Approach
The study adapts then neighbourhood approach developed by Foster and Araujo (2004) and later improved by Wodon et al, (2009). These authors proposed a statistical method for assessing electricity coverage deficits based on the pure demand-side problems, pure supply-side problems and the combination of demand and supply-side problems. They argue that, if a household lives in an area with access to electricity service but is not connected, this is taken as an affordability challenge (pure demand-side limitation). In areas without access, some households face combined problems (both demand and supply-side problems). Nevertheless, for those households who are more likely to use electricity but lack access even in their neighbourhood, authors take it as a purely supply-side constraint. This approach has been used by other scholars (Tsimpo and Wodon, 2014; Angel-Urdinola & Wodon, 2007; Komives, et al., 2005).
Model Specifications
We start by presenting a mathematical notation for assessing demand and supply-side gaps limiting coverage rate or access to electricity based on Foster and Araujo (2004) and Wodon et al. (2009) approach. The coverage rate is expressed as:
where C represents the coverage rate in households, which is the number of households using electricity divided by the total number of households (with appropriate survey-based household weights) (%); A represent available rate, which is defined as the number of households living in communities where service is available divided by the total number of households (%); and U denotes the uptake rate (%), which is the number of households actually connected to the electricity divided by the number of households living in communities where electricity is available. Therefore, the pure demand-side gap (PDSG) is expressed as:
Therefore, the share of the households without access (
Hence, the supply-side gap (SSG) is given as:
Thus, from Eqs 1–3, the sum of the pure demand-side gap, the supply-side gap, and the coverage rate is equal to 1, that is:
However, in areas that are not covered by electricity due to the supply gap above, it is also likely that even if supply was available, some households would not connect due to affordability issues. If the uptake rate in unserved households is similar to the uptake rate in areas where there is electricity now, the additional coverage that is obtained by providing access to these areas would be equal to the supply-side gap times the uptake rate where there is access. This is defined as the pure supply-side gap and it is expressed as:
The difference between the pure supply-side gap and the demand-side limitation can be deduced to represent a combined demand and supply-side gap, due to the fact that there is no access to the electricity, and even if there were access, some households would not be connected. This results in another gap, which is referred to as mixed demand and supply-side gap, and expressed as:
Using the survey data as described in Section Data Sources, with Eqs 1–7, the total market potential for solar PV in sub-regions of the Uganda and the whole country is estimated.
Results
Sub-regional Electricity, Availability, and Uptake Rates
Figure 2 shows the proportion of households per sub-region in terms of electricity coverage rate, availability rate and uptake rate. Overall, out of the total number of households surveyed, 66% had electricity available within their communities while 43% of these households are connected to the electricity representing 65% uptake rate. It can therefore be deduced that, 57% of households are currently unserved. The unserved households thus represent total market potential for alternative energy technologies such as a solar PV system as a source of electricity.
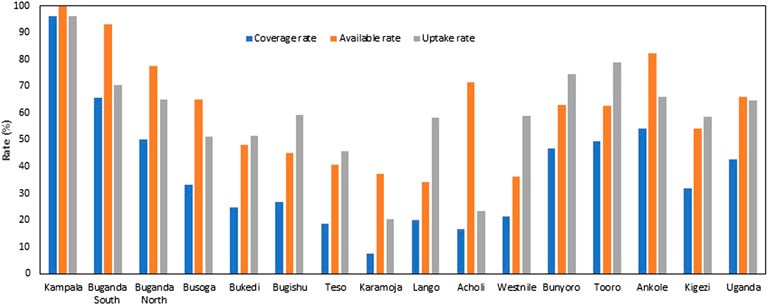
FIGURE 2. Electricity Coverage, availability, uptake, and Un-served households by sub region.
Results (as shown in Table 1) further reveal that the electricity availability rate is high in Kampala sub-region (100%), followed by Buganda South (93%), Ankole (82%), Buganda North (78%), and Acholi (71%), while Lango has the lowest availability rate of 34%. Electricity coverage rates are lower in Karamoja (8%), Acholi (17%) Teso (19%), Lango (20%), Westnile (21%), Bukedi (25%), and Bugisu (27%), but rates significantly increase in Kampala, Buganda South, Ankole, and Buganda North to over 50%. In addition, electricity uptake is low in three sub-regions of Karamoja (21%), Acholi (24%), and Teso (46%) but high in Kampala (96%) and Ankole (82%) sub-regions.
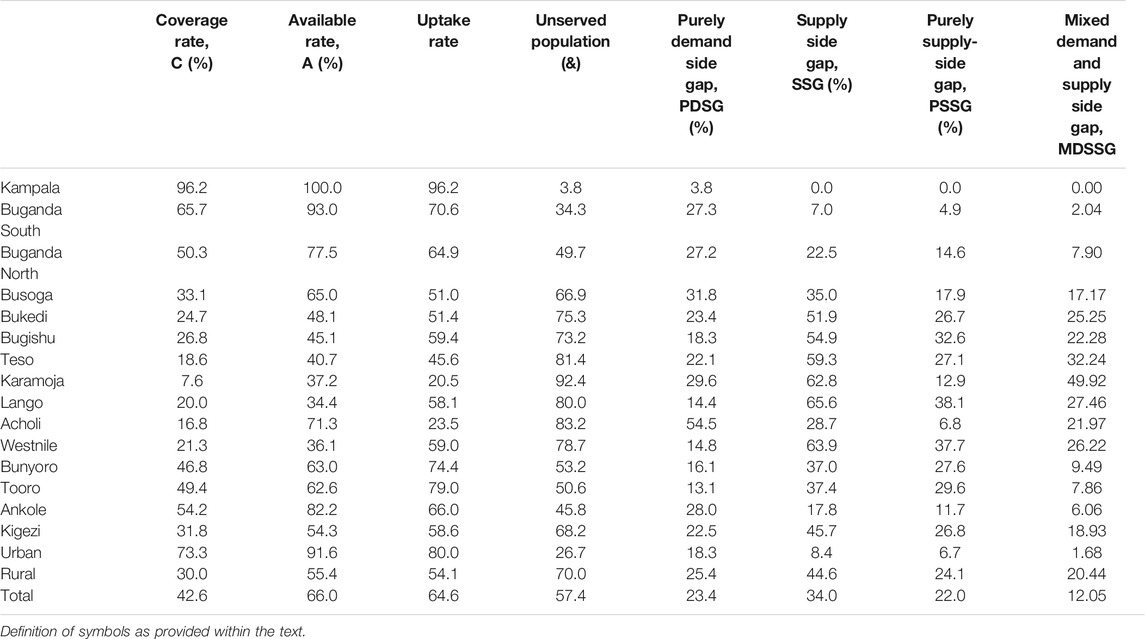
TABLE 1. Estimation of Electricity access without controls of demand and supply-side obstacles in Uganda (%).
The results suggest that the Central and partially Western regions compared to other regions have the highest rate of electricity coverage, availability, and uptake. This may be attributed to the level of socio-economic development (Uganda Bureau of Statistics, 2018), which varies across sub-regions. The Central region includes, for example, houses in Kampala, the capital city of Uganda, while Mbarara town in Western Uganda was given city status 5 years ago.
Figure 3 shows the total number of households (HHs) without access to electricity service due to demand side and supply side limitations (market potential for solar PV systems). Results show that the majority of households without electricity are in Busoga (601,500), Westnile (536,300), North Buganda (462,200), Lango (416,200), and South Buganda (402,400) sub-regions with the least households in Kampala (13,800). Notably, the Karamoja sub-region has the lowest electricity coverage rate and uptake in the country. The finding further shows that 41% of the households in Uganda electricity access deficits due to lack of demand only, 38% due to lack of supply only, and 21% due to a combination of demand and supply factors. Regionally, Kampala sub-region electricity access deficits are purely due to lack of demand, followed by Buganda (76%), Acholi (65%), and Ankole (61%). Notable differences are observed in subregions due to electricity access deficits due to supply factors only, with Tooro (58%) having the highest %age of households with electricity access deficits due to lack of supply factors only followed by Bunyoro (51%) and West Nile (47%) respectively. More than half of electricity access deficits in Karamoja are due to the mixture of demand and supply factor.
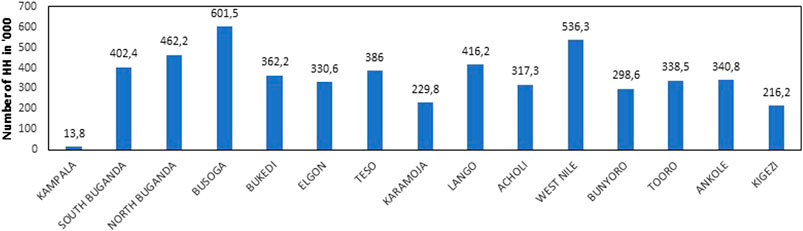
FIGURE 3. Number of households without access by sub-region (Solar market potential).
The plausible explanation is that electricity deficient sub-regions are affected by poor infrastructural development due to low economic development and activities, geographical terrain and poverty levels. For example, Bugisu and some parts of Kigezi are mountainous making difficult to extend the grid. Busoga sub-region on other hand has been experiencing rising poverty levels while Karamoja sub-region has consistently been reported as the poorest sub region in Uganda (Uganda Bureau of Statistics, 2018). Besides poverty, Karamoja particularly has few and sparsely distributed households and the nature of the houses (Manyatas) do not support grid electrification, this possibly explains why electricity access is very low (Burgess et al., 2019).
Solar Market Potential
Table 2 shows the unserved market (market potential) based on demand side and supply side gaps. We observe that lack of access to electricity is mainly due to supply-side limitations in the sub-regions of Busoga, Westnile, Lango, Bugisu, Bukedi Teso, Karamoja, Bunyaro, Tooro, and Kigezi, while in Kampala, South and North Buganda, Acholi, and Ankole sub-regions, it is propelled by purely demand-side limitations. This implies that some households without access to electricity due to supply-side gaps could have the capacity to pay for service but lack access due to the supply capacity constraints of utility companies or unreliability aspects, thus preferring an alternative. On the contrary, households without access propelled by demand-side limitations have access in the neighbourhood but they lack electricity due to affordability constraints, such as high connection charges, usage fees, or cultural priorities.
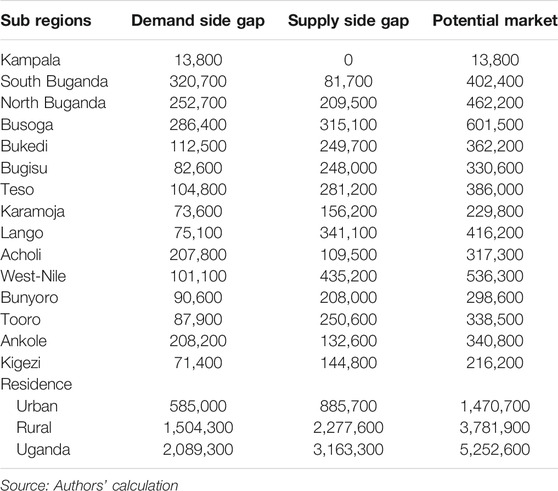
TABLE 2. Total market potential by residence and sub-region.
Overall, the total number of households without access to electricity is approximately 5.3 million. About 3.2 and 2.1 million households without access are attributable to supply-side and demand side limitations, respectively. Implying that, 2.1 million households have coverage but have lack access due to demand side constraints such as affordability and poor housing quality among others. On the other hand, 3.2 million households lack access to electricity as a result of supply side constraints such as lack of availability, reliability, and limited capacity or voltage, among others. Probably, the supply-side propelled market deficit constitutes an immediate market potential since some of the households may be willing to pay and have the ability to pay but simply lack access in the vicinity. The demand side propelled deficit is a potential market but may require supportive policies or arrangements to curb affordability challenges. For example, providing flexible pay options that matches their cashflows or distributing solar PV systems that are affordable to them. Furthermore, the majority of households without electricity live in rural areas, where out of 5.3 million households without access in Uganda, about three quarters reside (72%) in rural areas.
Discussion
This study sought to estimate the market potential for solar PV systems as an alternative source of electricity. To address the objective three specific questions were formulated; (i)What is the proportion of households without access to electricity due to demand-side limitations? 2) What is the proportion of households without access to electricity due to supply-side gaps? 3) What is the total electricity access deficit or the estimated market potential for alternative electricity sources such as solar PV systems?
Results suggest that approximately 2.1 million households lack access to electricity as a result of demand side limitations. The implication is that these households have electricity coverage in their vicinity or community but they are unable to access (or the uptake is low) due to household-based limitations such as inability to afford connection fees, monthly bills, and electrical appliances to use electricity. In Uganda, low uptake of electricity is due to high poverty levels (Uganda Bureau of Statistics, 2018). For instance, Busoga, North and South Buganda, Acholi, and Ankole among other sub-regions harbour majority of these households. In addition, some of the households are constrained by housing tenure (where the occupants are tenants and have no right to make alterations to needed for connectivity) and poor housing quality (where the type of the houses do not allow use of electricity from a safety and standards perspective). This finding resonates with existing evidence in literature. For example, Banerjee et al. (2008) report that, affordability of monthly bills was a major limitation to electricity access. Their findings show that, about 60% of the African population cannot afford to pay full cost recovery tariffs or extend consumption beyond the subsidized level. Similar results were reported by Blimpo and Cosgrove-Davies (2019) in cross country of African countries while Blimpo et al., (2018) and Mensah, (2018) found household income levels (affordability) and flows, housing quality, and quality of electricity as prime constraints. In South Africa for instance, an initiative was put in place to transfer 1.7 million residents of informal settlements with poor housing quality to live in formalized housing before electrification could take place (Niez, 2010).
Results further suggest that approximately 3.2 million households lack access to electricity as a result of supply-side limitations. The implication is that these households could be willing to use electricity but lack electricity coverage both in their houses and neighbourhood. The supply side constraints may include lack of availability, reliability, and capacity of the existing infrastructures or utility companies as well as electrical appliances to use the service. In Uganda, the biggest proportion of electricity supply comes from hydro power generation and this is distributed and transmitted centrally using a national grid. However, the national grid does not reach many areas particularly where the geographical terrain is mountainous (e.g. Bugisu & Kigezi), households are sparsely distributed (e.g., Karamoja, Lango, Westnile etc.) and demand is making grid extension unviable. This finding is in line with literature, for instance in Tanzania a study revealed low of voltage as a major deprivation for household and businesses on the Island of Zanzibar (Jacome et al., 2019). Similar limitations have been found in literature (Dasso and Fernandez, 2015). Relatedly, low-capacity electricity systems in most households in SSA were reported as constraints to access and which by world bank standards are considered no access (Coville et al., 2019; Grimm et al., 2016; Bensch et al., 2018; Burgess et al., 2019).
Further still, results reveal that approximately 5.3 million households lack access to electricity. This electricity access deficit is a result of both supply and demand-side limitations. Supply-side gaps account for 60.4% of the total electricity access deficit, implying that the existing market potential is driven by mainly supply-side deficiencies such as lack of availability, low capacity, unreliability, as well as high electricity tariffs compared to neighbouring Kenya. Lack of supply presents market potential for alternative technologies such as solar PV systems to fill. This finding is in line with previous studies for instance, Tsimpo and Wodon (2014) analysed residential electricity access in Uganda using Living Standards Measurement data (LSM) and found that supply side limitations were the main drivers of low electricity access in Uganda. similarly, Dagnachwa et al. (2020) undertook a study to identify the barriers for electricity access in SSA and found supply side constraints such as inadequate institutional and regulatory support to be key limitations. Relatedly, studies on growth in uptake of off-grid technologies reveal that lack of supply and unreliability of grid electricity service is among key reasons behind uptake of alternative sources (UOMA, 2018; Burgess et al., 2019; Mugagga and Chamdimba, 2019). However, our finding contradicts recent finding by Blimpo and Cosgrove-Davies, (2019) who attribute electricity access deficit to mainly demand-side limitations. The possible explanation could be differences in data sets and level of analysis. i.e., Blimpo and Cosgrove-Davies used an old data set from world development indicators (2012) supplemented by data sources from LSMS, DHS (2014/15) and the analysis is at a macro level which is susceptible to a problem of incomplete data.
Conclusion, Implications, and Future Research
Conclusion
This study sought to estimate the market potential for alternative electricity sources particularly solar PV using electricity demand and supply side gaps. Results show that approximately 5.3 million households lack access to electricity, implying that the total market potential for alternative electricity sources (such as solar PV) is 5.3 million households. About 60.4% of these households lack access as a result of supply-side gaps. This may possibly imply an immediate market potential because some households may be willing to pay electricity service but lack electricity coverage due to supply side limitation (e.g. lack of capacity, unreliability, grid extension may be unfeasible/unviable, inefficiencies of the utility company, low awareness, and poor geographical terrain). On the other hand, 39.6% have electricity coverage however uptake is low due to demand side limitations (e.g. affordability, use of low voltage systems, housing conditions, and housing tenure). Therefore, a combination of supply and demand side gaps constitute total electricity access deficit in households which is considered a market potential for alternative electricity sources such as solar PV systems.
Practical Implications
The results show that approximately 5.3 million households lack access to electricity mainly due to absence of electricity coverage (lack of availability), a supply-side limitation and partly due to due to low uptake (lack of affordability), a demand side limitation. To close the electricity access deficit, there is a need for disaggregated policy intervention. First, the 5.3 million households constitute a market potential for alternative electricity sources such as off-grid solar PV systems as well as min-grids. The unserved market or households (mainly due to unavailability) constitute an immediate market potential because demand is available but supply is limited hence solar companies should take advantage by addressing availability challenges. Particularly, solar firms should use commercially viable and effective business models to reach sparsely distributed households, set up service centres to geographically unreached regions like Karamoja, and introduce good storage devices for Bugisu and kigezi sub regions where the radiation is low.
For households with coverage but a lack of access due to affordability challenges, there is a need for the government to subsidise electricity costs to encourage uptake. On the other hand, the solar companies can use innovative business models to address affordability challenges.
Limitation and Future Research
The statistical approach we used is limited in capturing all electricity access gaps that influence the unserved market, this may lead to biases in the estimates of demand as opposed to supply-side problems. For example, some households may live in an area where there is access to the service, but may still be located too far from the electric line to be able to be connected (or perhaps the capacity of the electric line may be designed to support a specific and limited number of households). In addition, the study used cross-sectional data set which may be limited in capturing all electricity access deficits. Therefore, future studies should focus on robust econometric simulations to estimate the unserved market of electricity in households, eliciting willingness to pay for solar PV systems together with focus group discussions may provide deeper understanding of the market potential, and analysis using panel or time series data may provide very useful insights in assessing how the demand-side and supply-side gaps evolve and impact on the market potential.
Data Availability Statement
The raw data supporting the conclusions of this article will be made available by the authors, without undue reservation.
Author Contributions
SA and VS collected and analysed the data; SA drafted the manuscript; VS and MA reviewed and edited the manuscript; while MA conceived and supervised the work.
Conflict of Interest
The authors declare that the research was conducted in the absence of any commercial or financial relationships that could be construed as a potential conflict of interest.
Footnotes
1Standalone solar systems and solar mini-grids
2DFID—Department for International Development, GIZ- (German Corporation for International Cooperation (Deutsche Gesellschaft für Internationale Zusammenarbeit), UNCDF—UN capital Development Fund and USAID- United States Agency for International Development.
3Capacity-ability of the electricity system to provide a certain amount of electricity in order to operate different appliances. Availability-the amount of time during which electricity is available. Reliability-frequency of disruption and duration of disruption of unscheduled outages. Quality-the level and stability of voltage. Affordability-the ability of household to pay for the electricity that they need. Formality of connection-payment for the electricity service. Health and safety—any form of accident due to electricity.
References
Angel-Urdinola, D., and Wodon, Q. (2007). Do utility subsidies reach the poor? framework and evidence for Cape Verde, Sao Tome, and Rwanda. Econ. Bull. 9 (4), 1–7. Available at: http://www.accessecon.com/pubs/EB/2007/Volume9/EB-06I30004A.pdf.
Banerjee, S., Wodon, Q., Diallo, A., Pushak, T., Uddin, E., Tsimpo, C., et al. (2008). Access, affordability, and alternatives: Modern infrastructure services in Africa. Available at: https://mpra.ub.uni-muenchen.de/id/eprint/27740 (Accessed December 30, 2010).
Bensch, G., Grimm, M., Huppertz, M., Langbein, J., and Peters, J. (2018). Are promotion programs needed to establish off-grid solar energy markets? evidence from rural Burkina Faso. Renew. Sustain. Energ. Rev. 90, 1060–1068. doi:10.1016/j.rser.2017.11.003
Bhatia, M., and Angelou, N. (2015). Beyond connections: energy access redefined. World Bank. Available at: https://openknowledge.worldbank.org/handle/10986/24368 (Accessed June 12, 2015).
Biira, S., and Kilama, G. (2014). Analysis of solar radiation in Uganda (A case study of Kasese, Jinja and Soroti Districts). Int. J. Curr. Res. 6, 8110–8115. Available at: https://www.journalcra.com/article/analysis-solar-radiation-uganda-case-study-kasese-jinja-and-soroti-districts.
Blimpo, M. P., and Cosgrove-Davies, M. (2019). Electricity access in Sub-Saharan Africa: uptake, reliability, and complementary factors for economic impact. Washington, DC: The World Bank.
Blimpo, M. P., McRae, S. D., and Steinbuks, J. (2018). Why are connection charges so high? An analysis of the electricity sector in sub-Saharan Africa. World Bank Policy Research Working Paper. No. 8407.
Blimpo, M. P., Postepska, A., and Xu, Y. (2020). Why is household electricity uptake low in sub-Saharan Africa? World Develop. 133, 105002. doi:10.1016/j.worlddev.2020.105002
Burgess, R., Greenstone, M., Ryan, N., and Sudarshan, A. (2019). Demand for electricity in a poor economy. unpublished manuscript. Chicago, IL: University of Chicago Available at: https://epic.uchicago.edu/wp-content/uploads/2019/12/hps_manuscript.pdf (Accessed June 15, 2020).
Chaplin, D., Mamun, A., Protik, A., Schurrer, J., Vohra, D., Bos, K., and Cook, T. (2017). Grid electricity expansion in Tanzania by MCC: findings from a rigorous impact evaluation. Mill. Chall. Corp. Washington, DC: Mathematica Policy Research. doi:10.1007/978-3-319-48372-6
Coville, A., Orozco-Olvera, V., and Reichert, A. (2019). Paying attention to profitable investments: experimental evidence from renewable energy markets. World Bank 2019, 9009. doi:10.1596/1813-9450-9009
Dagnachew, A. G., Hof, A. F., Roelfsema, M. R., and van Vuuren, D. P. (2020). Actors and governance in the transition toward universal electricity access in Sub-Saharan Africa. Energy Policy 143, 111572. doi:10.1016/j.enpol.2020.111572
Dasso, R., and Fernandez, F. (2015). The effects of electrification on employment in rural Peru. IZA J. Labor. Dev. 4 (6), 1–16. doi:10.1186/s40175-015-0028-4
Electricity Regulatory Authority-ERA (2020). Installed capacity summary. Available at: https://www.era.or.ug/index.php/stats/generation-statistics/installed-capacity (Accessed June 6, 2020).
Energy Africa-Uganda (2018). Fiscal policy options for solar home systems, final report. Available at: https://www.gogla.org/resources/energy-africa-uganda-fiscal-policy-options-for-solar-home-systems-shs (Accessed June 7, 2020).
Foster, V., and Araujo, M. C. (2004). “Does infrastructure reform work for the poor? a case study from Guatemala,” in Policy research working paper 3185. Washington, DC: World Bank.
Goyal, R., Jacobson, A., and Schatz, (2019). Energy access and off-grid solar use in Uganda examining solar adoption and the role of flexible payment mechanisms as a driver for energy access. Kampala, Uganda: Sida, Schatz Energy Research Center and UNCDF.
Grimm, M., Lenz, L., Peters, J., and Sievert, M. (2019). USAEE Working Paper No. 19–411. Demand for off-grid solar electricity–Experimental evidence from Rwanda. Available at: https://papers.ssrn.com/sol3/papers.cfm?abstract_id=3399004 (Accessed July 20, 2020).
Grimm, M., Munyehirwe, A., Peters, J., and Sievert, M. (2016). A first step up the energy ladder? low- cost solar kits and household’s welfare in rural Rwanda. Washington, DC: The World Bank Available at: https://sun-connect-ea.org/wp-content/uploads/2019/02/clean_start_paper_20190214.pdf.
IEA (2018). World Energy Outlook 2018. Paris: IEA. Available at: https://www.iea.org/reports/world-energy-outlook-2018 (Accessed July 21, 2020).
IEA,, , IRENA, I., WB, U. N., et al. (2019). WHO. Tracking SDG 7: The Energy Progress Report 2019. s.l.:Washington: World Bank.
Jacome, V., Klugman, N., Wolfram, C., Grunfeld, B., Callaway, D., and Callaway, I. (2019). Power quality and modern energy for all. Proc. Natl. Acad. Sci. 116 (33), 16308–16313. doi:10.1073/pnas.1903610116
Komives, K., Foster, V., Halpern, J., and Wodon, Q. (2005). Water, electricity, and the poor: who benefits from utility subsidies?. Washington, DC: World Bank, Directions in Development.
Lee, K., Brewer, E., Christiano, C., Meyo, F., Miguel, E., Podolsky, M., et al. (2016). Electrification for “under grid” households in rural Kenya. Develop. Eng. 1, 26–35. doi:10.1016/j.deveng.2015.12.001
Lee, K., Miguel, E., and Wolfram, C. (2020). Does household electrification supercharge economic development? J. Econ. Perspect. 34, 122–144. doi:10.1257/jep.34.1.122
Lighting Africa (2014). Market Assessment of modern off-grid lighting systems in Uganda. Final Rep. Available at: https://www.lightingafrica.org/wp-content/uploads/2016/12/Uganda-2.pdf.
Ministry of Energy and Mineral Development (2019). Draft National Energy Policy-2019. Available at: https://www.energyandminerals.go.ug/policies/.
Mensah J. T. (2018). Jobs! Electricity shortages and unemployment in Africa. Electricity Shortages and Unemployment in Africa. World Bank Policy Research Working Paper, (8415). Available at: https://ssrn.com/abstract=3165807 (Accessed April 19, 2018).
Ministry of Energy and Miniral Development (2018). National electricity survey report. s.l. Kampala, Uganda: MEMD.
Ministry of Finance, Planning and Economic Development-MOFPED (2020). Background to the budget speech financial year 2020/21. Available at: https://budget.go.ug/sites/default/files/National%20Budget%20docs/National%20Budget%20Speech%20FY%202020-21.pdf (Accessed July 21, 2020).
Mugagga, R. G., and Chamdimba, H. B. N. (2019). A comprehensive review on status of solar PV growth in Uganda. Jenrr. 3 (4), 1–14. doi:10.9734/jenrr/2019/v3i430113
National Electrification Survey (2018). Available at: http://www.energyandminerals.go.ug/site/assets/files/1081/memd_national_electrification_survey_-_2018_printed_2020.pdf
National Planning Authority-NPA (2020). Third national development plan 2020/21—2024/25. Available at: https://www.fowode.org/publications/research/40-national-developmenplan-3/file.html (Accessed July 21, 2020).
Niez, A. (2010). Comparative study on rural El;ectrification policies in emerging economies. Paris, France: International Energy Agency Paper.
Sievert, M., and Steinbuks, J. (2020). Willingness to pay for electricity access in extreme poverty: evidence from Sub-Saharan Africa. World Develop. 128, 104859. doi:10.1016/j.worlddev.2019.104859
Terrapon-Pfaff, J., Gröne, M.-C., Dienst, C., and Ortiz, W. (2018). Productive use of energy - pathway to development? Reviewing the outcomes and impacts of small-scale energy projects in the global south. Renew. Sustain. Energ. Rev. 96, 198–209. doi:10.1016/j.rser.2018.07.016
Uganda Bureau of Statistics (2018). Uganda national household survey 2016-2017: report on the socioeconomic survey. Kampala, Uganda: UBOS Available at: https://www.ubos.org/wp-content/uploads/publications/03_20182016_UNHS_FINAL_REPORT.pdf (Accessed June 15, 2020).
Uganda Solar Energy Association (USEA) (2019). Handbook on solar taxation. Available at: https://www.useaug.org/sites/default/files/resources/5.%20Solar%20Taxation%20Handbook_0.pdf (Accessed July 21, 2020).
Wodon, Q., Banerjee, S., Diallo, A. B., and Foster, V. (2009). Is low coverage of modern infrastructure services in African cities due to lack of demand or lack of supply? policy research working paper, WPS 4881. World Bank. doi:10.1596/1813-9450-4881 Available at: http://documents1.worldbank.org/curated/en/171921468010246258/pdf/WPS4881.pdf (Accessed July 20, 2020).
World Bank (2018). “Electricity access and economic development: options for accelerating progress in sub-Saharan Africa.” Chapter 3 in Africa's Pulse, Spring 2018: Analysis of issues shaping Africa's economic future (April), Washington, DC: World Bank.
Keywords: electriciy access, household energy consumption, demand gap, suppy-gap, solar PV adoption
Citation: Aarakit SM, Ssennono VF and Adaramola MS (2021) Estimating Market Potential for Solar Photovoltaic Systems in Uganda. Front. Energy Res. 9:602468. doi: 10.3389/fenrg.2021.602468
Received: 03 September 2020; Accepted: 21 January 2021;
Published: 17 March 2021.
Edited by:
Chien-Chiang Lee, Nanchang University, ChinaReviewed by:
Ssennoga Twaha, University of Nottingham, United KingdomYaya Li, Jiangsu University, China
Copyright © 2021 Aarakit, Ssennono and Adaramola. This is an open-access article distributed under the terms of the Creative Commons Attribution License (CC BY). The use, distribution or reproduction in other forums is permitted, provided the original author(s) and the copyright owner(s) are credited and that the original publication in this journal is cited, in accordance with accepted academic practice. No use, distribution or reproduction is permitted which does not comply with these terms.
*Correspondence: Sylvia Manjeri Aarakit, c2FhcmFraXRAbXVicy5hYy51Zw==; Muyiwa S. Adaramola, bXV5aXdhLmFkYXJhbW9sYUBubWJ1Lm5v; Vincent Fred Ssennono, dmZzc2Vubm9ub0BnbWFpbC5jb20=