 Zhiyu Xi
 Na Jia
 Ezeddin Shirif
94% of researchers rate our articles as excellent or good
Learn more about the work of our research integrity team to safeguard the quality of each article we publish.
Find out more
ORIGINAL RESEARCH article
Front. Energy Res. , 18 March 2021
Sec. Advanced Clean Fuel Technologies
Volume 9 - 2021 | https://doi.org/10.3389/fenrg.2021.600676
This article is part of the Research Topic Low-Carbon Technologies for the Petroleum Industry View all 19 articles
Due to the diversity of alkali categories and reservoir conditions, the varied oil recovery driving mechanism of alkaline flooding is subjected to different types of emulsion generation. In this study, a modified bottle test method that assesses major emulsion type formation for preliminary prediction of alkaline flooding performance in oil recovery is introduced. The modified method considers the necessary energy input required for mixing immiscible bulk phases at low interfacial tension (IFT) regions to improve the representativity of emulsion formation in the bottle test to that of in porous media. To accurately evaluate the emulsion type and phase volume distribution from the bottle test, each emulsion phase after aging in the test bottle was sampled and its water content was measured through Karl Fischer titration. Afterward, material balance calculations other than pure volume observation were applied to quantify the emulsion volume and determine the major emulsion type formation. It is found that the majority of emulsion effluent type from the sandpack flooding test were in agreement with the bottle test forecast which proved the feasibility of the modified bottle test method. The statistically optimized experimental designs were implemented due to the simplicity of the new bottle test method and it considerably cut the time expense regarding the alkaline flooding performance prediction. The high versatility of the modified bottle test ensures that the alkali usage is not limited to the inorganic alkalis mentioned in this study; other type of alkaline solutions can also be used for further expanding the scope of its application.
The heavy oil recovery process in field mainly undergoes three stages. Initially, the primary production utilizes pressure depletion owing to formation rock expansion and solution gas drive to make oil produced spontaneously (Kokal and Abdulaziz, 2010). However, the primary recovery is not long-lasting in the heavy oil reservoir due to the rapid reservoir pressure depletion and high viscous nature of the heavy oil. Water flooding as a secondary recovery method is conducted afterward to maintain the reservoir pressure and mobilize the initially unmovable oil. Nonetheless, the low viscous water that displaces fluid results in an unfavorable mobility ratio. Severe viscous fingering contributes to early water breakthrough and high residual oil saturation (Sor) (Homsy, 1987; Bryan and Kantzas, 2007). In order to recover more oil, enhanced oil recovery (EOR) is implemented following water flooding. Most of the EOR processes focus on scaling down the mobility ratio to further diminish the Sor. These goals can be achieved by incorporating the solvent injection, thermal treatment, and chemical injection to efficiently recover an additional 10% original oil in place (OOIP) or more from the reservoir (Kokal and Abdulaziz, 2010).
As one of the chemical EOR processes, alkaline flooding has numerous merits which are mainly represented by its low cost (Ding et al., 2010) and high versatility. Different from in surfactant flooding, the alkaline solution reacts with the acidic groups of residual oil through neutralization reactions and generates in situ surfactants spontaneously (Rivas et al., 1997; Sun et al., 2008; Ashrafizadeh et al., 2012). Thus, the total acid number (TAN) of oil becomes an important index that implies the feasibility of alkaline flooding in a specific reservoir. Acevedo et al. (1992) have concluded that the majority of carboxylic acid groups in the heavy oil is made up of asphaltenes, phenols, or resins. In addition, the natural polarity of asphaltenes is capable of fortifying the emulsion stability (Dehghan et al., 2013). These advantages make the unconventional heavy oil recovery in Canada a good candidate for the implementation of alkaline flooding (Acevedo et al., 2001; Bryan and Kantzas, 2007; Ashrafizadeh et al., 2012).
In past decades, many chemical EOR studies, either experimental or numerical, have been performed considering the synergy features of alkaline, surfactant, and polymer; however, little research has focused only on the pure alkaline injection for heavy oil reservoirs. Although a series of sandpack and microfluidics flooding tests were conducted to examine the alkaline flooding performance and mechanisms (Dong et al., 2012), the screening methods which were used for determining the operating alkaline concentration, salinity, and temperature of heavy oil alkaline flooding are relatively rough. These preliminary screening methods mainly include bottle test and dynamic IFT measurement (Acevedo et al., 2001; Dehghan et al., 2013; Sun et al., 2017) while both tests have their limitations. The spinning drop IFT test is a convenient way to quantify the emulsification process because the IFT is directly proportional to the amount of surfactants adhering to the fluids’ contact. However, this method is not able to provide visualized evidence to predict the type of emulsion generation (Bryan and Kantzas, 2007). As Bryan and Kantzas (2007) studied, the evolution process of emulsion generation is controlled by conditions of shear according to fluid velocity. Former researchers usually conducted the bottle test through mingling the alkaline solution and oil at certain volume ratios by shaking the bottle manually (Nelson et al., 1984) or through a tube shaker (Aminzadeh et al., 2016). Some other researchers used a blender or agitator to accomplish the task (Ding et al., 2010; Wang et al., 2010). Nevertheless, when it comes to high viscous heavy oil, these mixing processes cannot effectively provide an agitation environment with shear as sufficient as that in the porous media to overcome the Gibbs’s free energy and additional energy expressed by Young-Laplace equation for emulsification (Isaacs and Chow, 1992). In addition, the quality of the final mixture is affected by operating conditions and oil properties. Among the series of heavy oil alkaline flooding performance studies, oils with viscosities lower than 3,000 cp were frequently studied (Ashrafizadeh et al., 2012; Dehghan et al., 2013; Aminzadeh et al., 2016), albeit the heavy oil viscosity in Canada can be as high as 10,000 cp (Bryan and Kantzas, 2007; Ashrafizadeh et al., 2012; Dong et al., 2012). For high viscous oil samples, bottle tests at temperature lower than 50°C are tougher to manage and the poor fluidity of high viscous heavy oil reduces the chance of mixing with aqueous phase. This phenomenon has been reported by Dong et al. (2012), who noted that the oil either sticks on the bottle wall or remains intact as a solely bulk phase through bottle shaking. Thus, W/O emulsion is hard to form. On the other hand, as a visualization method, the bottle test result is demonstrated by distribution of the emulsion phases based on density difference. A preceding phase distribution analysis was usually done through direct observation (Nelson et al., 1984; Bryan and Kantzas, 2007; Panthi and Mohanty, 2013; Aminzadeh et al., 2016; Baek et al., 2018). It is achieved by reading the volume scale marked on the container to determine the individual phase volume changes. However, a significant difference exists between the alkaline solution bottle test and the surfactant involved solution test owing to the neutralization reaction. The emulsification process in the alkaline solution case takes longer compared to the surfactant solution case, and multiple in situ surfactants may appear that induce different emulsion types. Therefore, oil-external and water-external emulsion emerge simultaneously in most alkaline water-heavy oil cases. Nevertheless, the IFT reduction mainly occurs on the surface of the dispersed droplets where the in situ surfactants are adhering to Ashrafizadeh et al. (2012) rather than the contact of bulk oil and water emulsions inside the bottle. It makes it difficult to accurately measure the phase volume because of the meniscus at the oil-external and water-external emulsions contact. Using a wide mouth bottle in test can mitigate the meniscus effect on volume measurement (Ding et al., 2010) when large volumes of oil and alkaline solution are required. Some researchers used fused-end ultra slim pipettes as the container, but their slender shape also aggravates the difficulty of mixing oil and water (Panthi and Mohanty, 2013; Baek et al., 2018). In general, previous bottle test methods are not handy for the system which involves high viscous heavy oil and alkaline solution. Conducting a conventional bottle test method disregarding its drawbacks may result in inaccurate prediction and misleading conclusions.
In this paper, a modified bottle test method is developed for preliminary alkaline flooding performance prediction on heavy oil recovery through meticulous emulsion phase distribution analysis. Different from the early studies, a high-shear homogenizer–which is capable of providing sufficient shear rate in promoting droplet breakup (Isaacs and Chow, 1992)–was used when mixing the oil and alkaline solution. During the homogenization step, the bulk heavy oil and alkaline solution are forced into the extremely narrow annulus between the rotating shaft and the inner wall of the probe under pressure. Then, the fluids exit through the hole on the shaft before the next mixing circle starts (Dhankhar, 2014). The surface area of viscous oil, which is hard to be stretched by hand shaking or stirring, can be easily extended through the homogenizer. It provides a better mixing quality of the two bulk phases and thus facilitates the neutralization reaction. In addition, each sample bottle is treated by homogenizer in a fixed time and rotation rate; hence, the uniformity of energy introduction can be assured. Furthermore, each emulsion phase at equilibrium of a sample bottle was sampled and its water content was measured by Karl Fischer titration to enhance the accurate emulsion volume measurement. A new material balance method using emulsion’s water volume fraction data will be introduced to show how the visually observed phase volume is fortified.
The paper was organized as follows: In section “Modified Bottle Test and Phase Distribution Study,” two commonly used inorganic alkalis (NaOH and Na2CO3) were selected to implement the modified bottle test through orthogonal experimental design to reduce the total experimental efforts and obtain the phase distribution pattern through varying control factors. In section “Sandpack Flooding Test,” the accuracy of emulsion type prediction by using the new bottle test method was verified through the sandpack flooding test. Then in section “Modified Bottle Test Trend Study,” the modified bottle test trend studies were conducted to further ensure the correctness of the phase distribution pattern derived and a persistent agreement was found with the previous orthogonal test results.
The bottle test was conducted using a specified alkaline water-oil volume ratio of 2:1 in 15 cm3 glass bottles. The alkaline solution and heavy oil were preheated to test the temperature separately in the oven, and 2 cm3 oil was transferred through a syringe to the bottle which contains 4 cm3 of the alkaline solution. The deviation of total injected oil volume was controlled to minimize the influence of alkaline water:oil ratio on the emulsification performance. It is worth noting that water:oil volume ratio has a big influence on the emulsion type generation. As studied, when water:oil ratio is lower than 1:9, phase inversion occurred and only water in oil emulsion will be formed (Sun et al., 2017). In this study, there is no intention in preparation of specific type of emulsion. So, water:oil ratio is set to be 2:1 considering the volume capacity of the test bottle in order to facilitate both water and oil dispersion into other phases. Then, the bottle was sent to the homogenizer to mix the oil and the solution at 6,000 round per minute (rpm) for 30 s. The PRO 250 homogenizer from PRO Scientific used in the experiment is shown in Figure 1A.
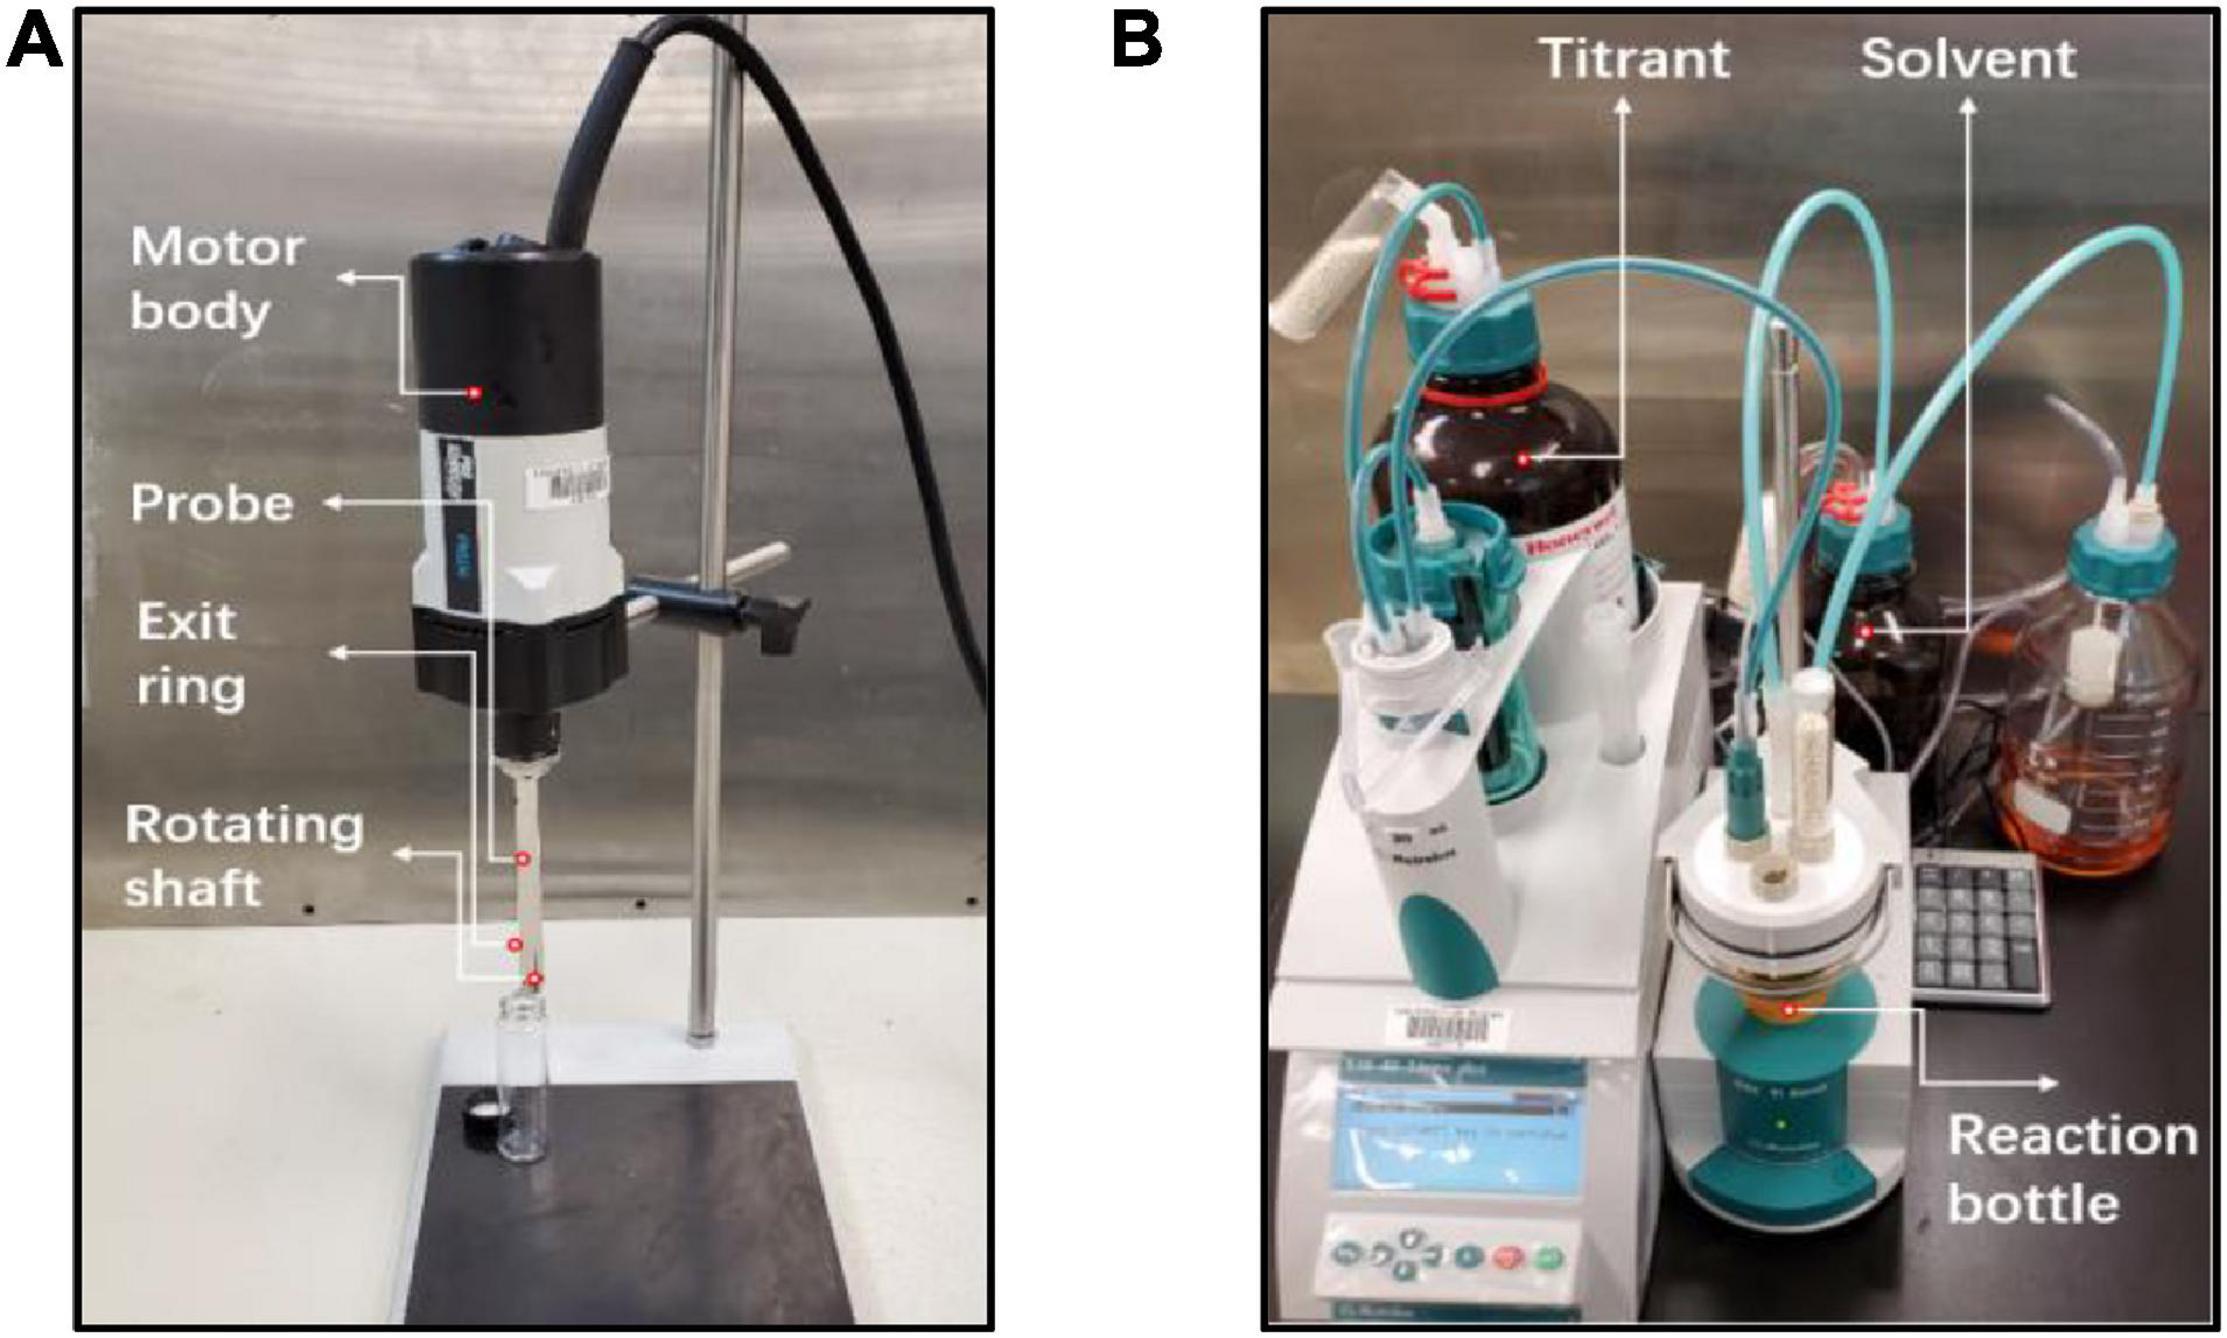
Figure 1. Bottle test instruments: (A) High-shear homogenizer (B) KF auto titrator.
Afterward, the bottle was settled in the oven at a pre-set temperature overnight to accomplish the emulsification and phase redistribution. The volume of each phase was measured after 24 h settlement by observing the phase-to-phase contact through calibrated scale. A long settling time is necessary because both oil- and water-based emulsions were generated with various stabilities. Aging the mixture can mitigate the unstable emulsion impact and favor the determination of the dominant emulsion type (Bryan and Kantzas, 2007; Xu et al., 2013).
Due to the external phase discrepancy of the multi-emulsion system, the meniscus phenomenon shown in the middle bottle of Figure 2 significantly affects the volume observation and emulsion sampling since the top phase is partially covered by the middle phase. Conventional methods of sampling emulsion phases from top to bottom with a syringe is also not applicable because the W/O emulsion phase has a high possibility to contaminate the needle and cause further interruption to the following emulsion layers. Thus, the bottle test emulsion sampling started from the O/W emulsion with less oil dispersion at the bottom. This procedure was achieved by flipping the bottle upside-down and leaving it to stand for another 6 h after volume measurement. An open top cap with thin rubber septa was equipped on each bottle for needle penetration (Figure 2). Sampling the complete bulk phase is unnecessary because a trace volume (≤10 μL) is required in Karl Fischer titration and the water content of each emulsion phase was assumed to be constant. Only the most stable emulsion in each phase was taken while any sample close to the boundary of different emulsion types were discarded. Afterward, the titration process was operated through Metrohm 870 KF Titrino plus automatic titrator, shown in Figure 1B.
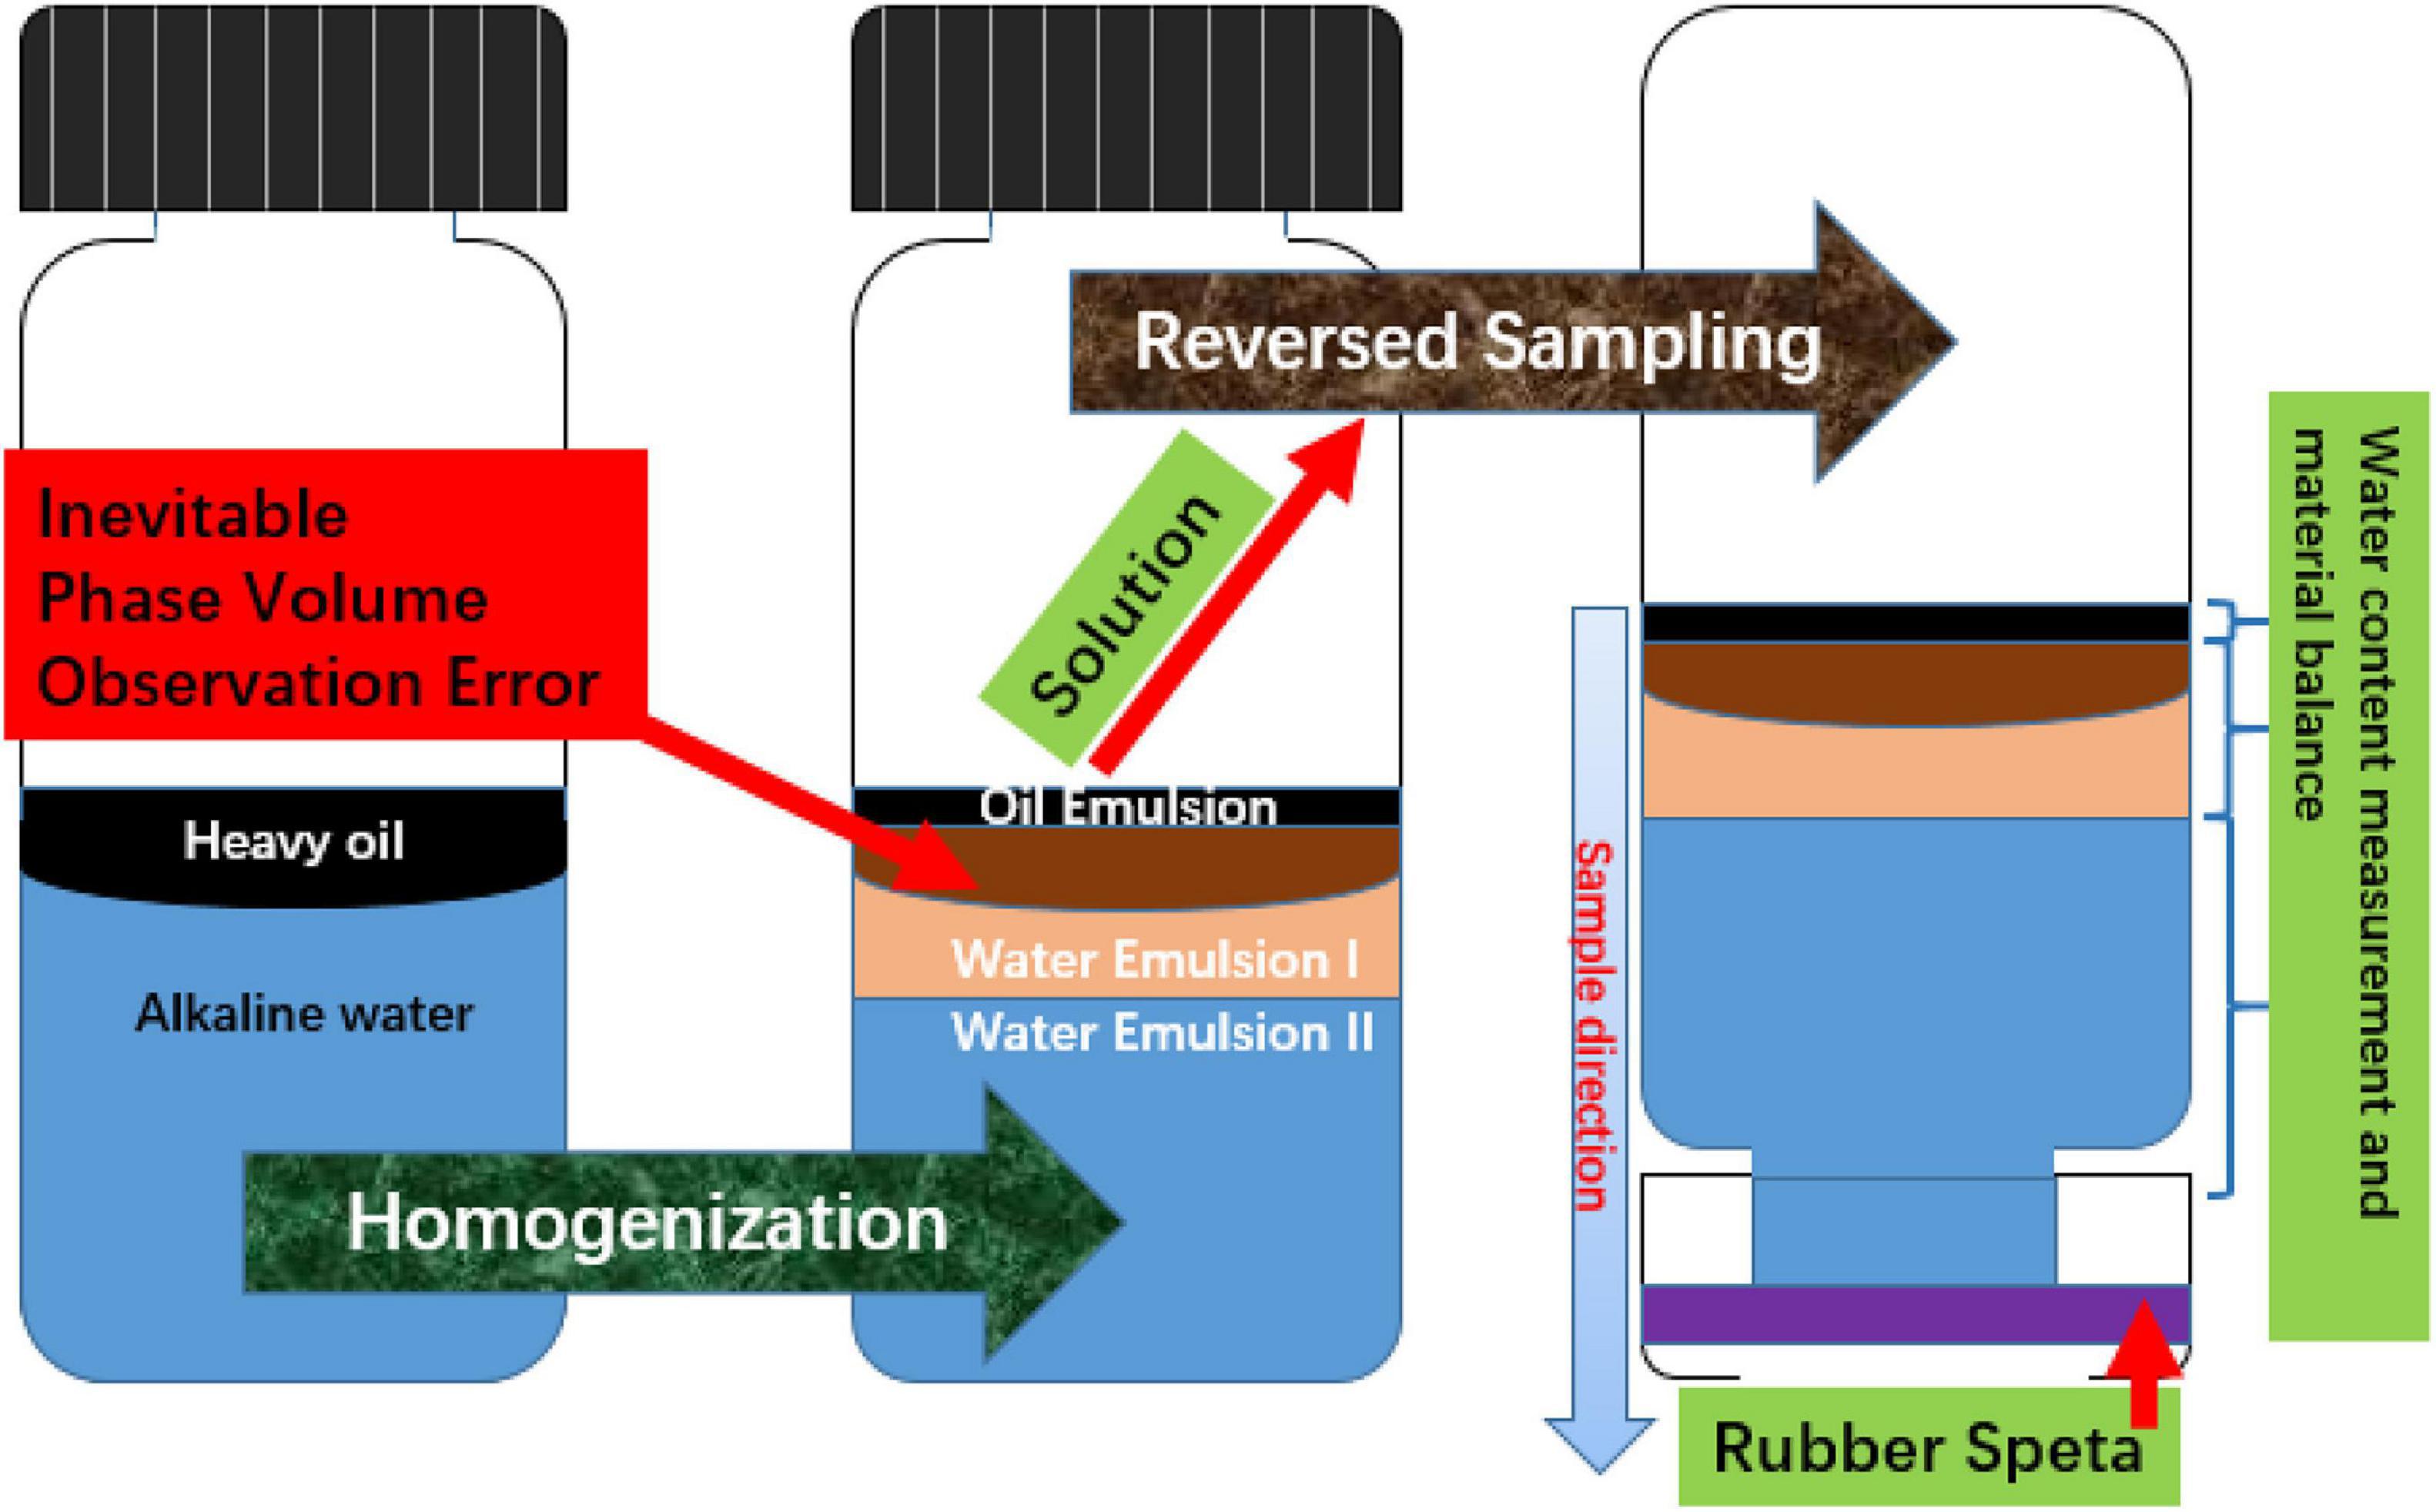
Figure 2. Bottle test phase volume observation problem and solution of reversed sampling with open top cap and rubber speta.
For the purpose of enhancing the phase volume determination, the material balance equation was used to correct the visualization error from the observed interface of W/O emulsion and middle O/W emulsion (Figure 2). For the three-emulsion phase (type A) system, the first step is direct volume balancing by subtracting the volumes of top and bottom phases at equilibrium from initial total volume to calculate the middle emulsion volume.
It can be explained by the following equations:
Here, mao is the bottle mass including oil and water and msa is the bottle mass with water only. ρoT stands for the oil density at test temperature. Voi and Vwi denote the initial introduced oil volume and water volume, respectively, while Vo and Vw are the measured oil volume and water volume. The calculated emulsion phase volume by volume balance is represented by Vmcalc1.
Then, the water content data of each sampled phase can be used to derive the emulsion density at equilibrium state by using the mixing rule for immiscible fluids (Chhabra and Richardson, 2008; Zhang et al., 2018), which is:
where ρavg denotes the density of emulsion phase after emulsification and 24 h aging. ρw is water density, W% is water weight fraction, and V% is water volume fraction.
As the original oil and alkaline solution volumes are known, the middle emulsion weight at equilibrium can also be derived by deducting the top and bottom emulsions’ mass from the total mass, mt. Therefore, the volume of middle emulsion can be calculated according to the middle emulsion density, ρavgm. The calculation can be conveyed by the following equations:
Here Vmcalc2 stands for the calculated emulsion phase volume by mass balance and ρavgw is the density of bottom O/W emulsion phase after emulsification and 24 h aging.
Theoretically, the two calculated middle emulsion volumes should be the same; however, the improper oil-external emulsion volume observation results in material balance (MBE) error:
Thus, W/O emulsion volume can be corrected by tuning Vo and less error indicates the Vo value is getting closer to the true volume.
If the middle emulsion generation is only of a trace amount or does not exist, the middle emulsion volume will be merged into the bottom water phase or ignored and the two-emulsion phase (type B) system will be considered. Therefore, the following simplified equation can be used to balance the bottom water volume through tuning the top W/O emulsion volume. In this case, material balance error is not considered.
wHere, ρavgw is the density of bottom O/W emulsion phase after emulsification and 24 h aging.
The above calculations always use gram as the mass unit and cm3 as volume unit unless otherwise specified.
On account of the involvement of in situ surfactants, the original glass bottle wettability will be adjusted to partial oil-wetting after agitation. Small volumes of W/O emulsion may remain on the bottle wall, thus it is not included in the phase volume observation. On the other hand, using material balance in calculating emulsion phase distribution by water content data surpasses the pure volume observation as it eliminates the inevitable experimental error from volume loss. The material balance calculation majorly focuses on the water content of emulsion phases and each phase distribution is balanced according to the known original oil and water volume introduction. The observed O/W and W/O emulsion volumes are only used as references to reduce the balance calculation trials, but they do not have significant influence on the final result of emulsion phase distribution. Figure 3 provides the workflow of the modified bottle test method to summarize the aforementioned procedures.
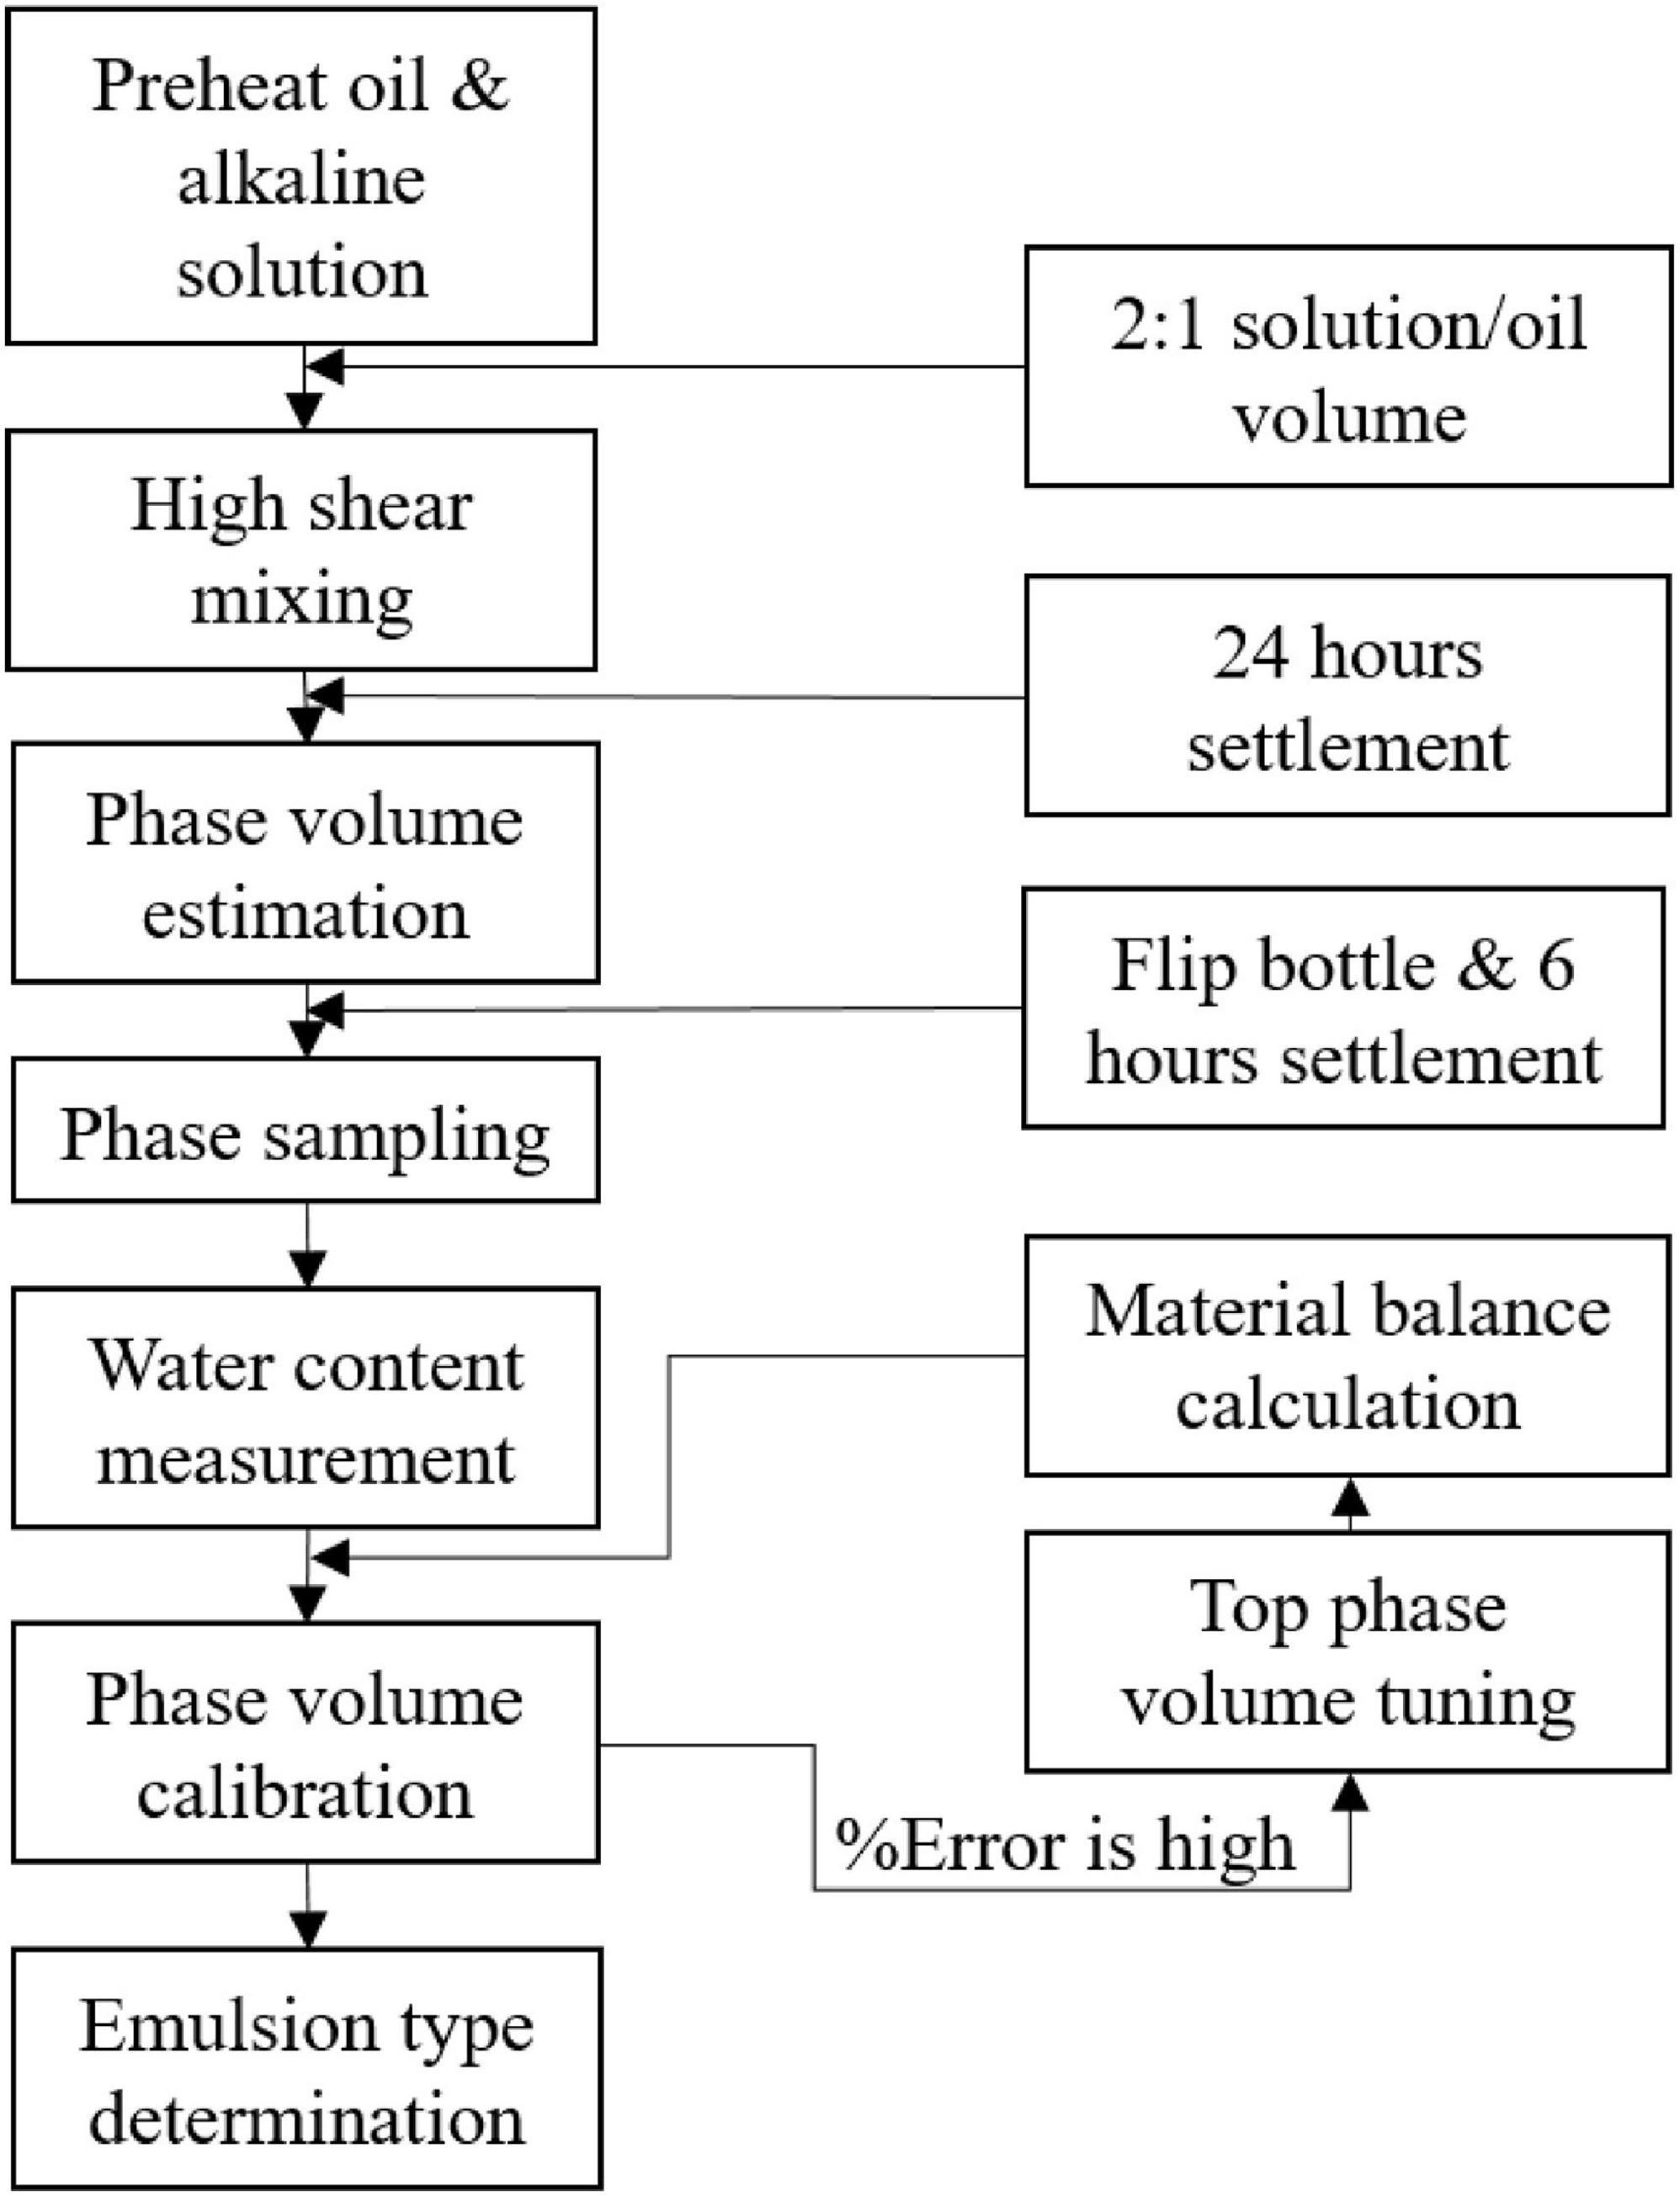
Figure 3. Workflow of modified bottle test.
Based on this methodology, a series of modified bottle tests for two inorganic alkalis (NaOH and Na2CO3) with heavy oil under various temperatures, salinities (NaCl), and alkaline concentrations were conducted. The TAN of the heavy oil sample is 2.1 mg KOH/g oil, and the heavy oil viscosity is 20,300 cp at 20°C. The heavy oil density at 20°C is measured to be 983.3 kg/m3 and its molecular weight is 512 g/mol.
Three main control factors, alkaline concentration, brine salinity, and temperature, were studied for each alkali whose alkaline concentration ranged from 0 to 0.5 mol/L, salinity was within the upper limit of 8,000 ppm, and reached a highest temperature of 70°C. The orthogonal experimental design was conducted to evaluate the importance of each factor to alkaline water performance in emulsification with heavy oil sample. 25 combinations of the three control factors at certain levels for NaOH and Na2CO3 were plugged in a refined L25(53) orthogonal table to conduct the bottle test (Fan and Chen, 1996).
During the emulsification process, oil and water tend to disperse into each other’s phase at low IFT due to the existence of in situ surfactants. So, the quantity of water and oil dispersion at equilibrium plays an important role in determining the emulsion stability as well as the emulsion type formation. Therefore, the total volume fraction of dispersed water and oil, Vd%, which can be used to represent the quantity of phase migration, was selected as the ranking index of the orthogonal bottle experiment to evaluate the emulsification performance of different alkaline solutions under various operating conditions. The dispersed water and oil phase volumes were calculated based on the water content data of the emulsions. It should be noted that five bottle tests running at 20°C failed in the agitation stage due to the heavy oil’s high viscous nature. However, the calculation of Vd% still took these five tests in consideration and the dispersed phase volume were assigned 0 cm3 to represent the temperature effect on bottle test emulsion preparation.
The calibrated orthogonal bottle test phase distribution results of the two alkalis are provided in Tables 1–4, where the experimental conditions, water and oil emulsions volume distribution at equilibrium, and the dispersed water and oil phase volume fraction are provided. As was mentioned, Type A and Type B systems co-existed among the 20 bottle tests of each alkali. They were provided, respectively, in separate tables and the material balance error was given for Type A bottle test cases.

Table 1. NaOH orthogonal test phase migration volume fraction of 3-phase distribution cases.
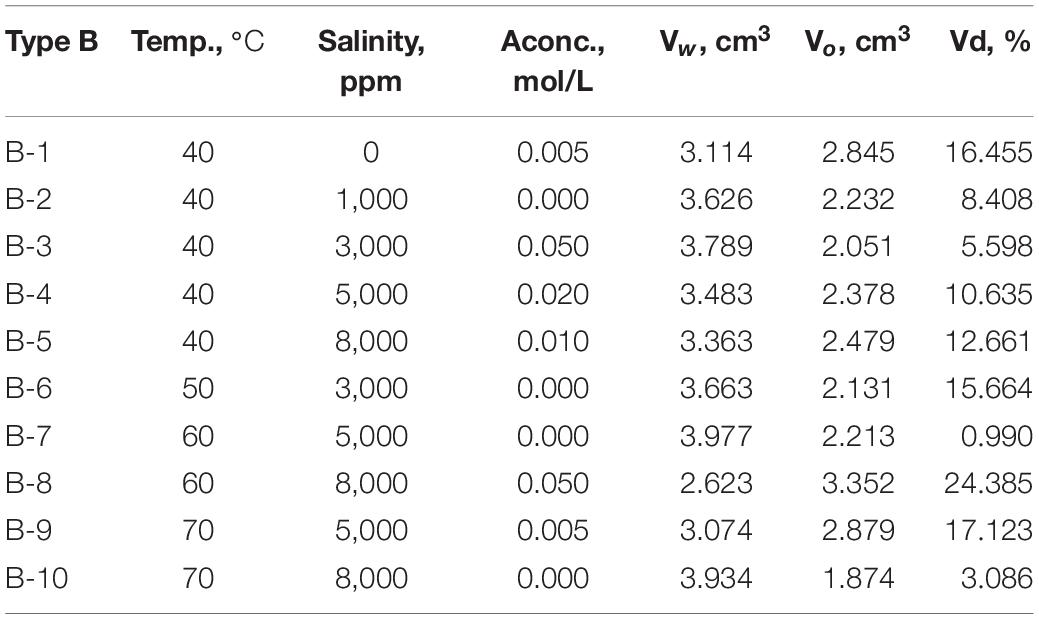
Table 2. NaOH orthogonal test phase migration volume fraction of 2-phase distribution cases.
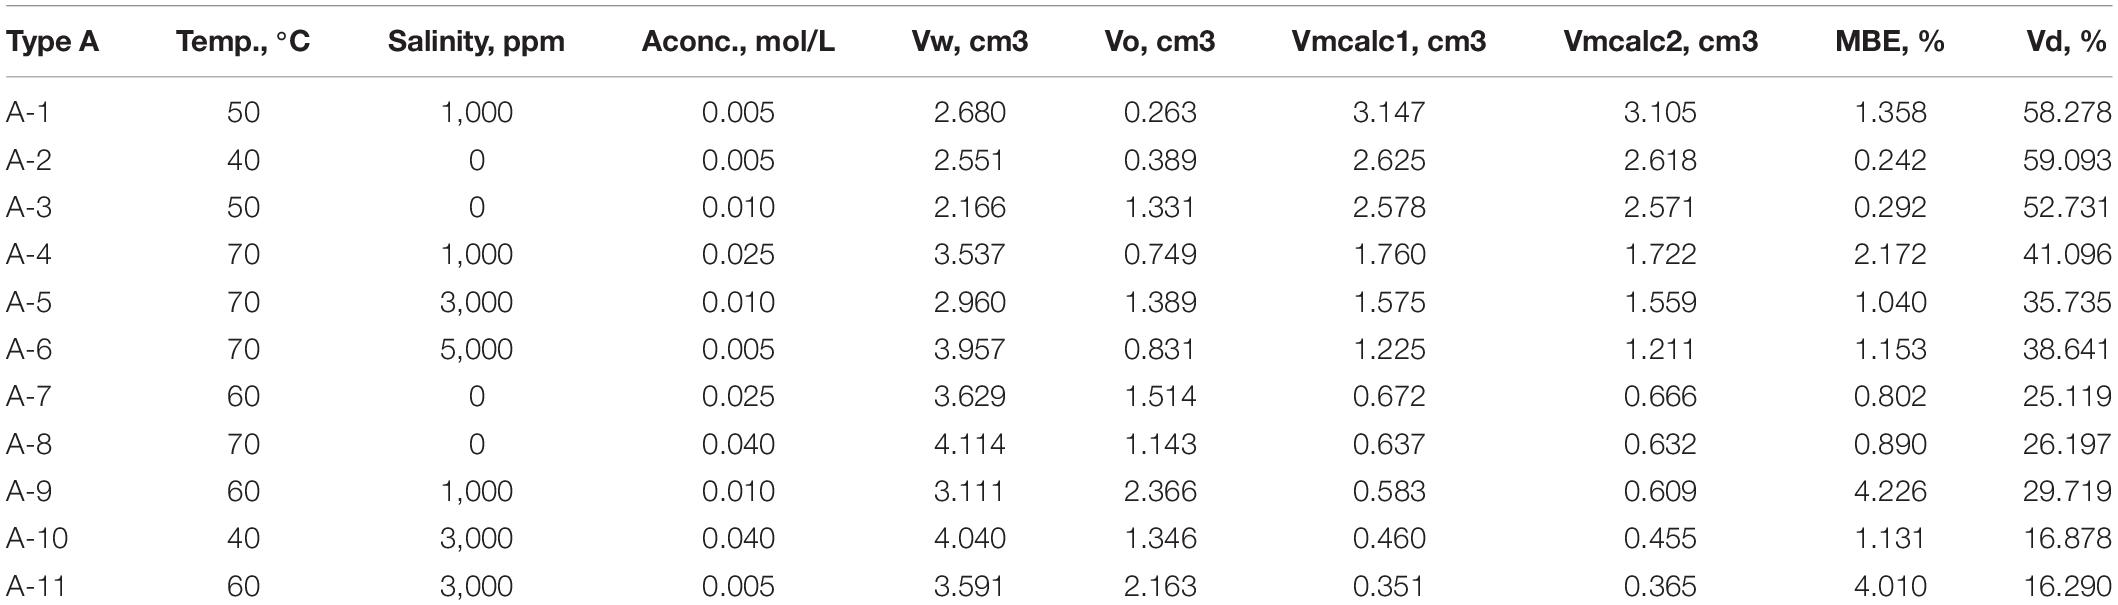
Table 3. Na2CO3 orthogonal test phase migration volume fraction of 3-phase distribution cases.
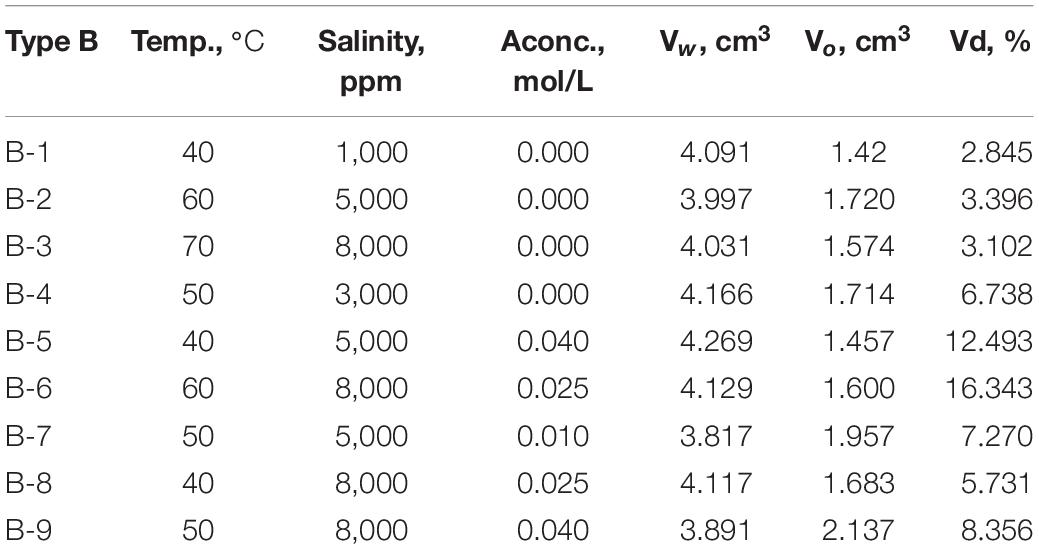
Table 4. Na2CO3 orthogonal test phase migration volume fraction of 2-phase distribution cases.
The orthogonal experiment data for both alkaline solutions were processed by Analysis of Variances (ANOVA) (Athreya and Venkatesh, 2012) using Vd% as index; the results are shown in Tables 5, 6. In the calculation, Kn of a factor represents the summation of indices among 25 bottle tests at nth level and kn is the corresponding average. The “range” of a factor is calculated by subtracting the lowest k-value from the highest k-value within five levels. The range magnitude of a factor indicates its influence on alkaline solution performance during emulsification. Therefore, some emulsification tendencies of each alkali referring to the control factors can be derived through orthogonal data processing.
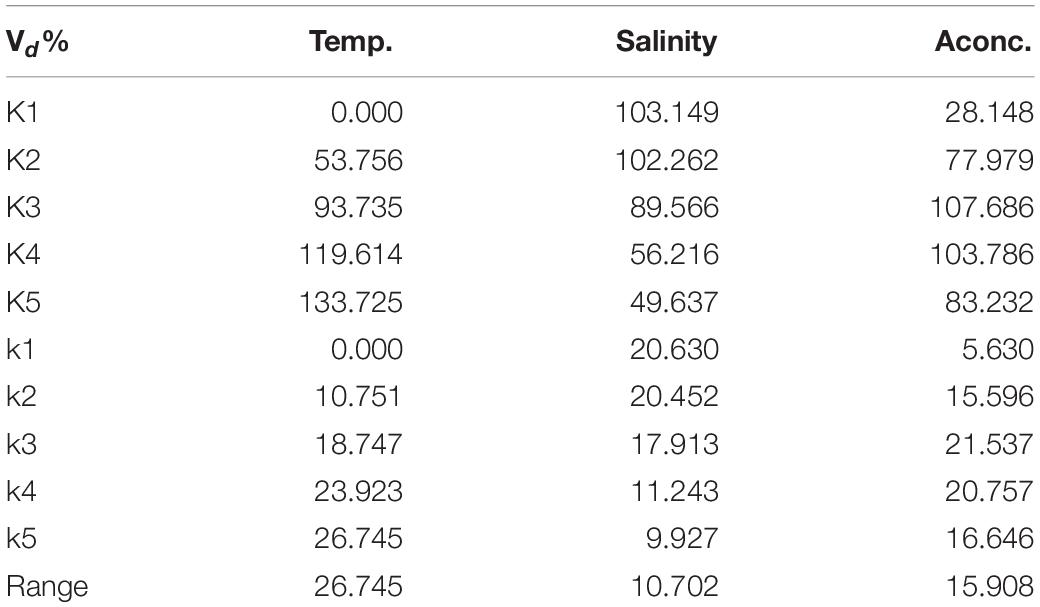
Table 5. NaOH Vd% orthogonal data processing.
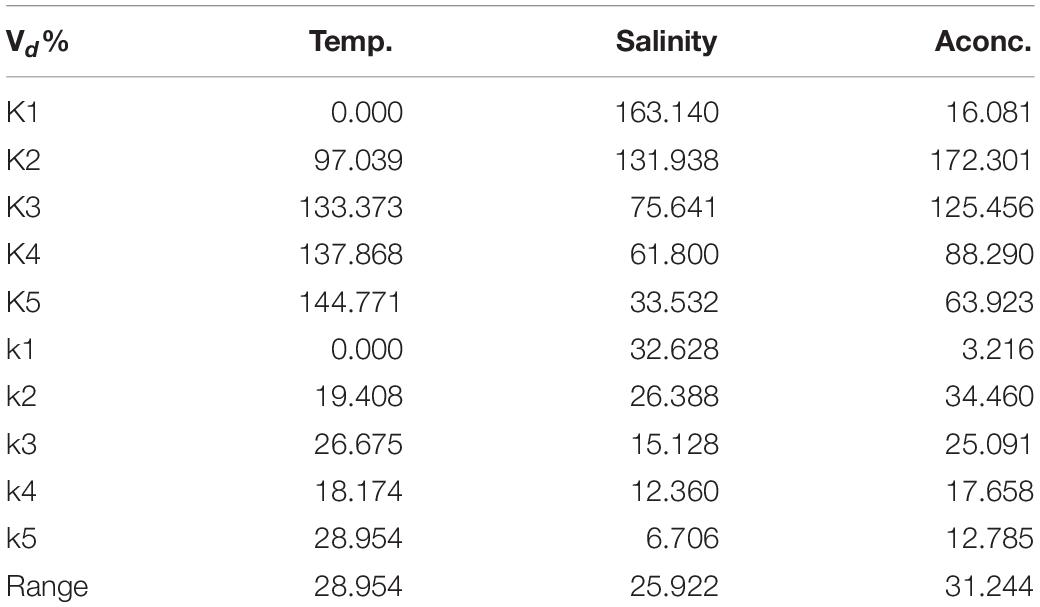
Table 6. Na2CO3 Vd% orthogonal data processing.
As Table 5 shows, the most important factor that affects the total phase dispersion for NaOH bottle test is temperature, with the range of 26.745%. The other two factor ranges are inferiorly lower than the temperature affected range. Thus, NaOH concentration has a medium influence on phase dispersion while the salinity has the least impact. On the other hand, as shown in Table 6, the Na2CO3 orthogonal bottle test has factor ranges with similar values, which indicated that temperature, salinity, and Na2CO3 concentration all play significant roles during the emulsification process. The Na2CO3 concentration is the most influencing factor, followed by temperature and salinity.
Besides, the change of kn for each factor follows a certain pattern that depicted the overall phase dispersion ability under various conditions. Figures 4, 5 plot the relationship of kn at each level of a factor for NaOH and Na2CO3 cases and some findings can be drawn.
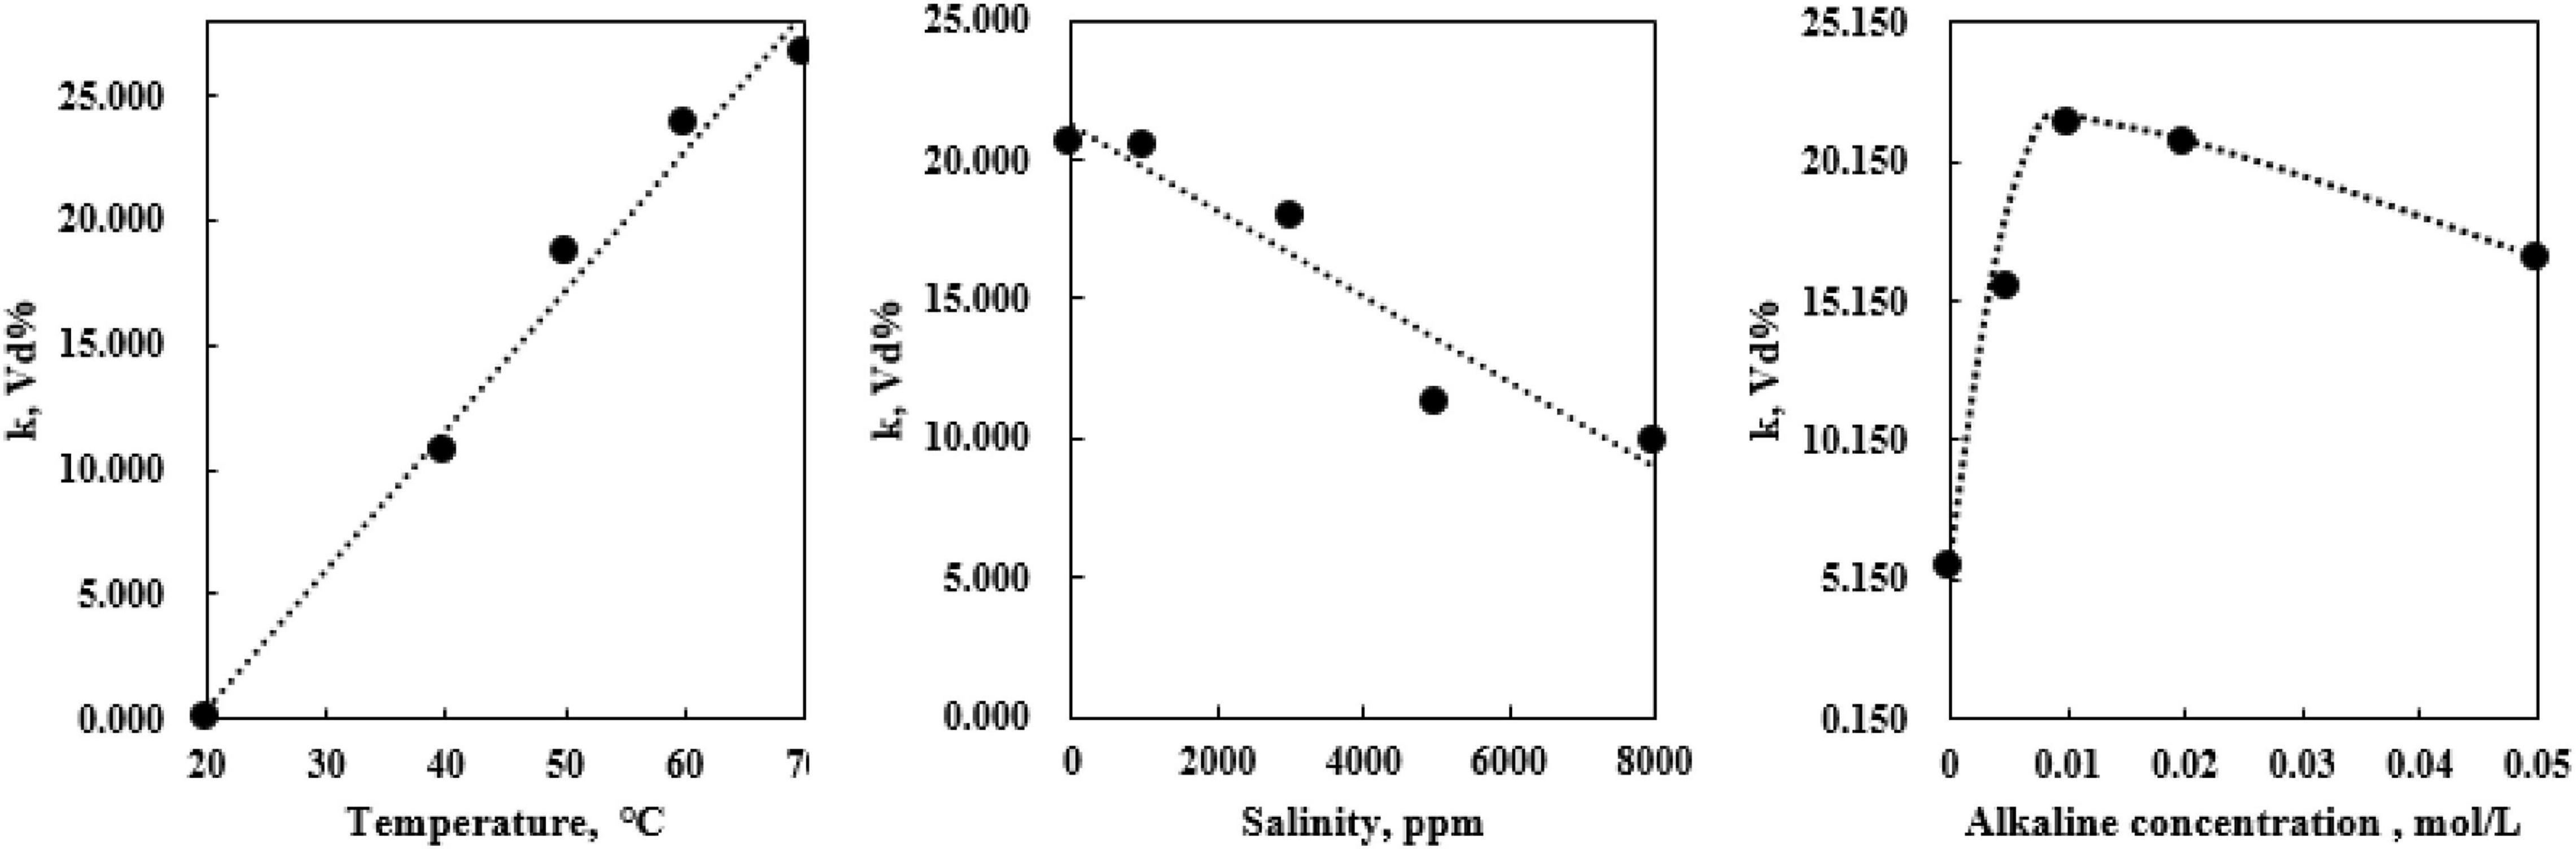
Figure 4. kn trend of changing control factors of NaOH orthogonal bottle test.
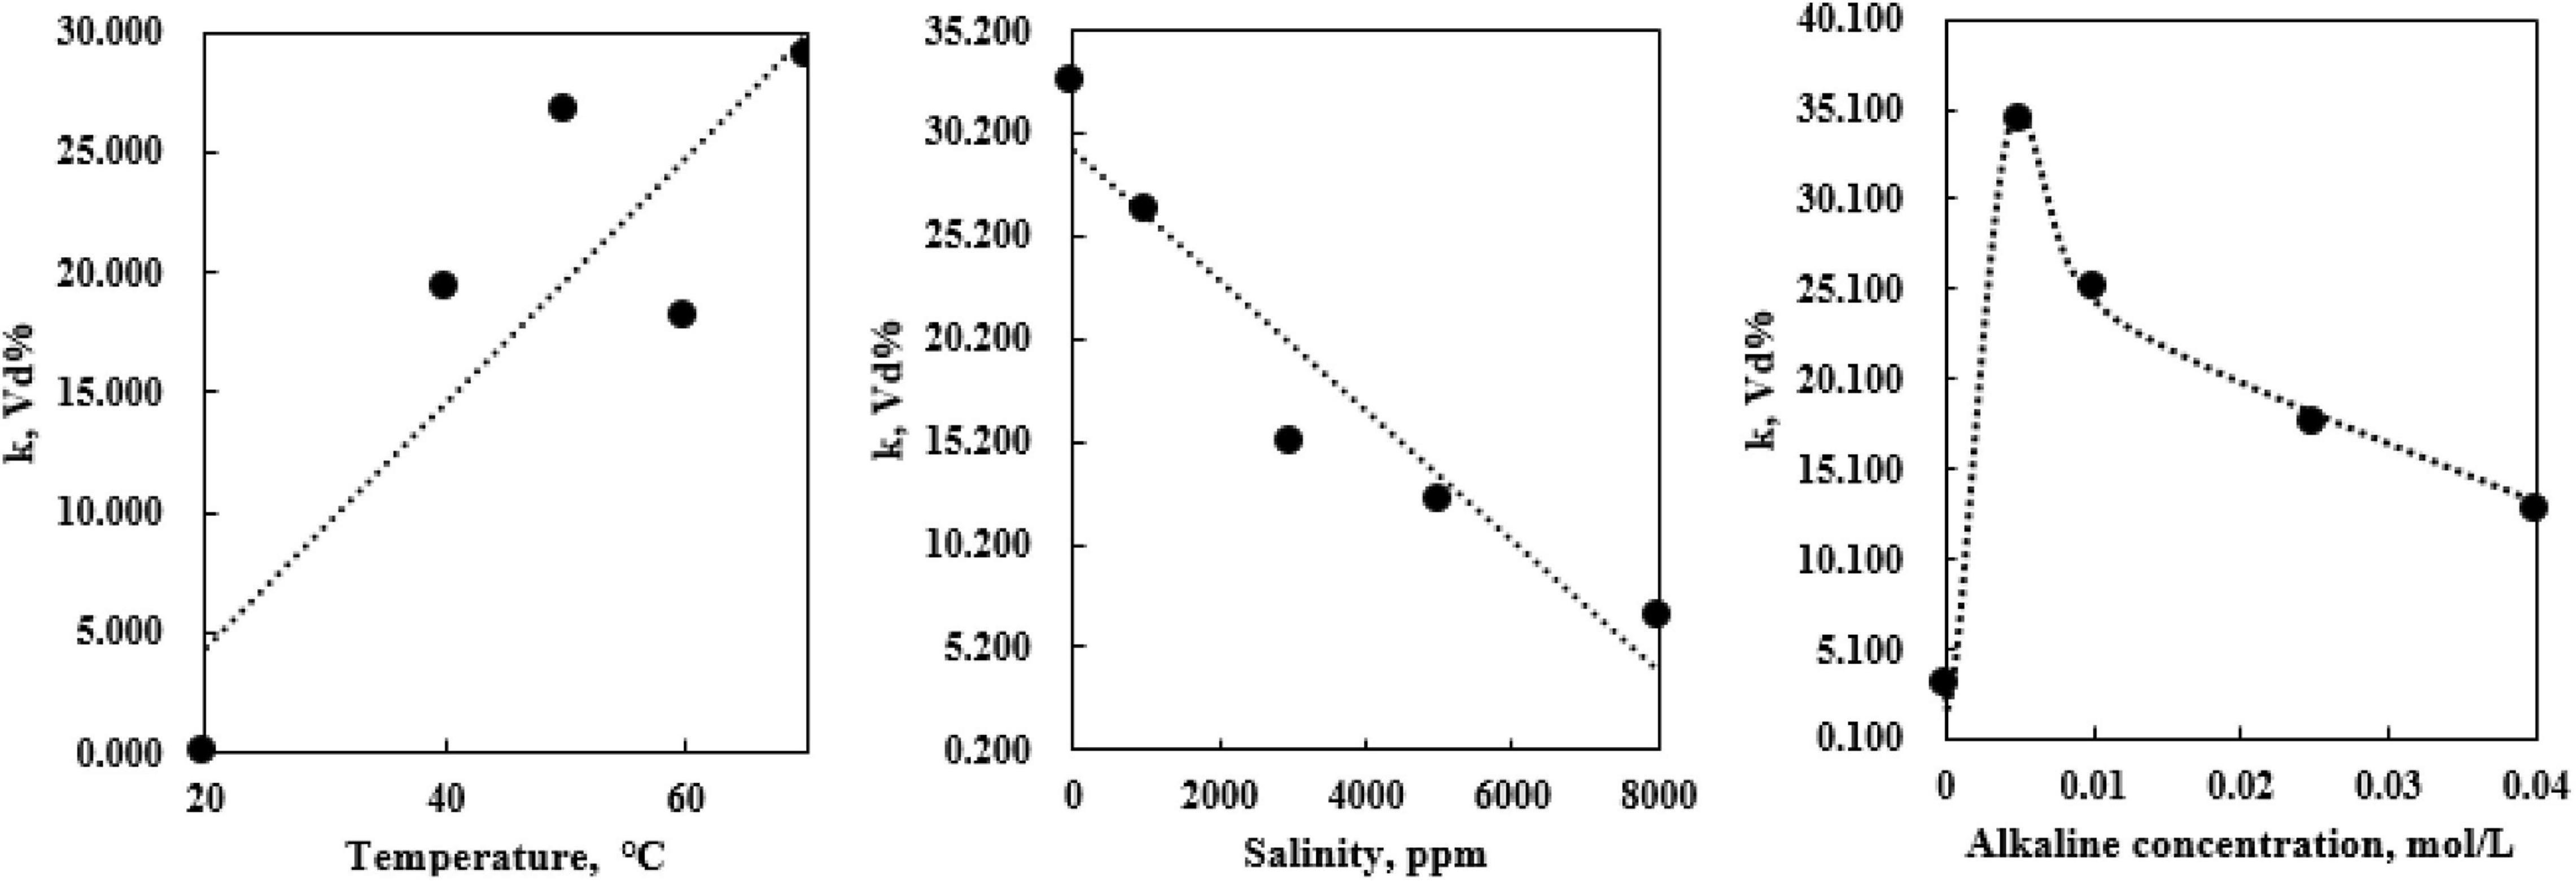
Figure 5. kn trend of changing control factors of Na2CO3 orthogonal bottle test.
In general, the temperature increase has a positive effect on phase dispersion; this is mainly due to the viscosity reduction of the heavy oil sample. At 70°C, the heavy oil viscosity is lower than 150 cp. This phenomenon increases the contact possibility of the oil and alkaline solution and further promotes the neutralization reaction to generate extra amounts of in situ surfactants. Thus, the difficulty in mixing oil and water phases can be considerably overcome. On the other hand, the salinity increment tends to hinder phase dispersion for both alkali cases. When it comes to the alkaline concentration effect, the optimum concentration can be clearly seen from both alkalis. The quantity of phase dispersion experiences a sudden boost with the involvement of alkalis while additional alkaline concentration restrains the phase dispersion. This variation tendency is especially featured in the Na2CO3 case, while additional NaOH concentration has a milder influence on the phase dispersion once the optimum concentration is reached. The results of kn analysis have shown the general effects of the control factors on emulsification; however, a detailed study regarding specific phase dispersion is required as dispersion exists in both water and oil phases. Therefore, the total volume of water and oil dispersion into each other phases of the 25 bottle test for each alkali case was calculated according to the phase volume distribution and measured water content data. It is found that 11.6 mL water went into the oil phase and 4.6 mL of oil dispersed into the water phase for the NaOH case. Nevertheless, the phase volume dispersion reversed for the Na2CO3 case with 3.2 mL water and 10.9 mL oil dispersion into the other phase. These data have clearly proposed the tendency of dominant emulsion type generation for different alkalis within the given control factor range. According to Figure 6, the water tends to disperse into oil phase for the NaOH system while oil is more likely to disperse into the water phase in the Na2CO3 system. Hence, the W/O emulsion is the major emulsion generated for NaOH bottle tests and O/W emulsion is dominant for the Na2CO3 case.
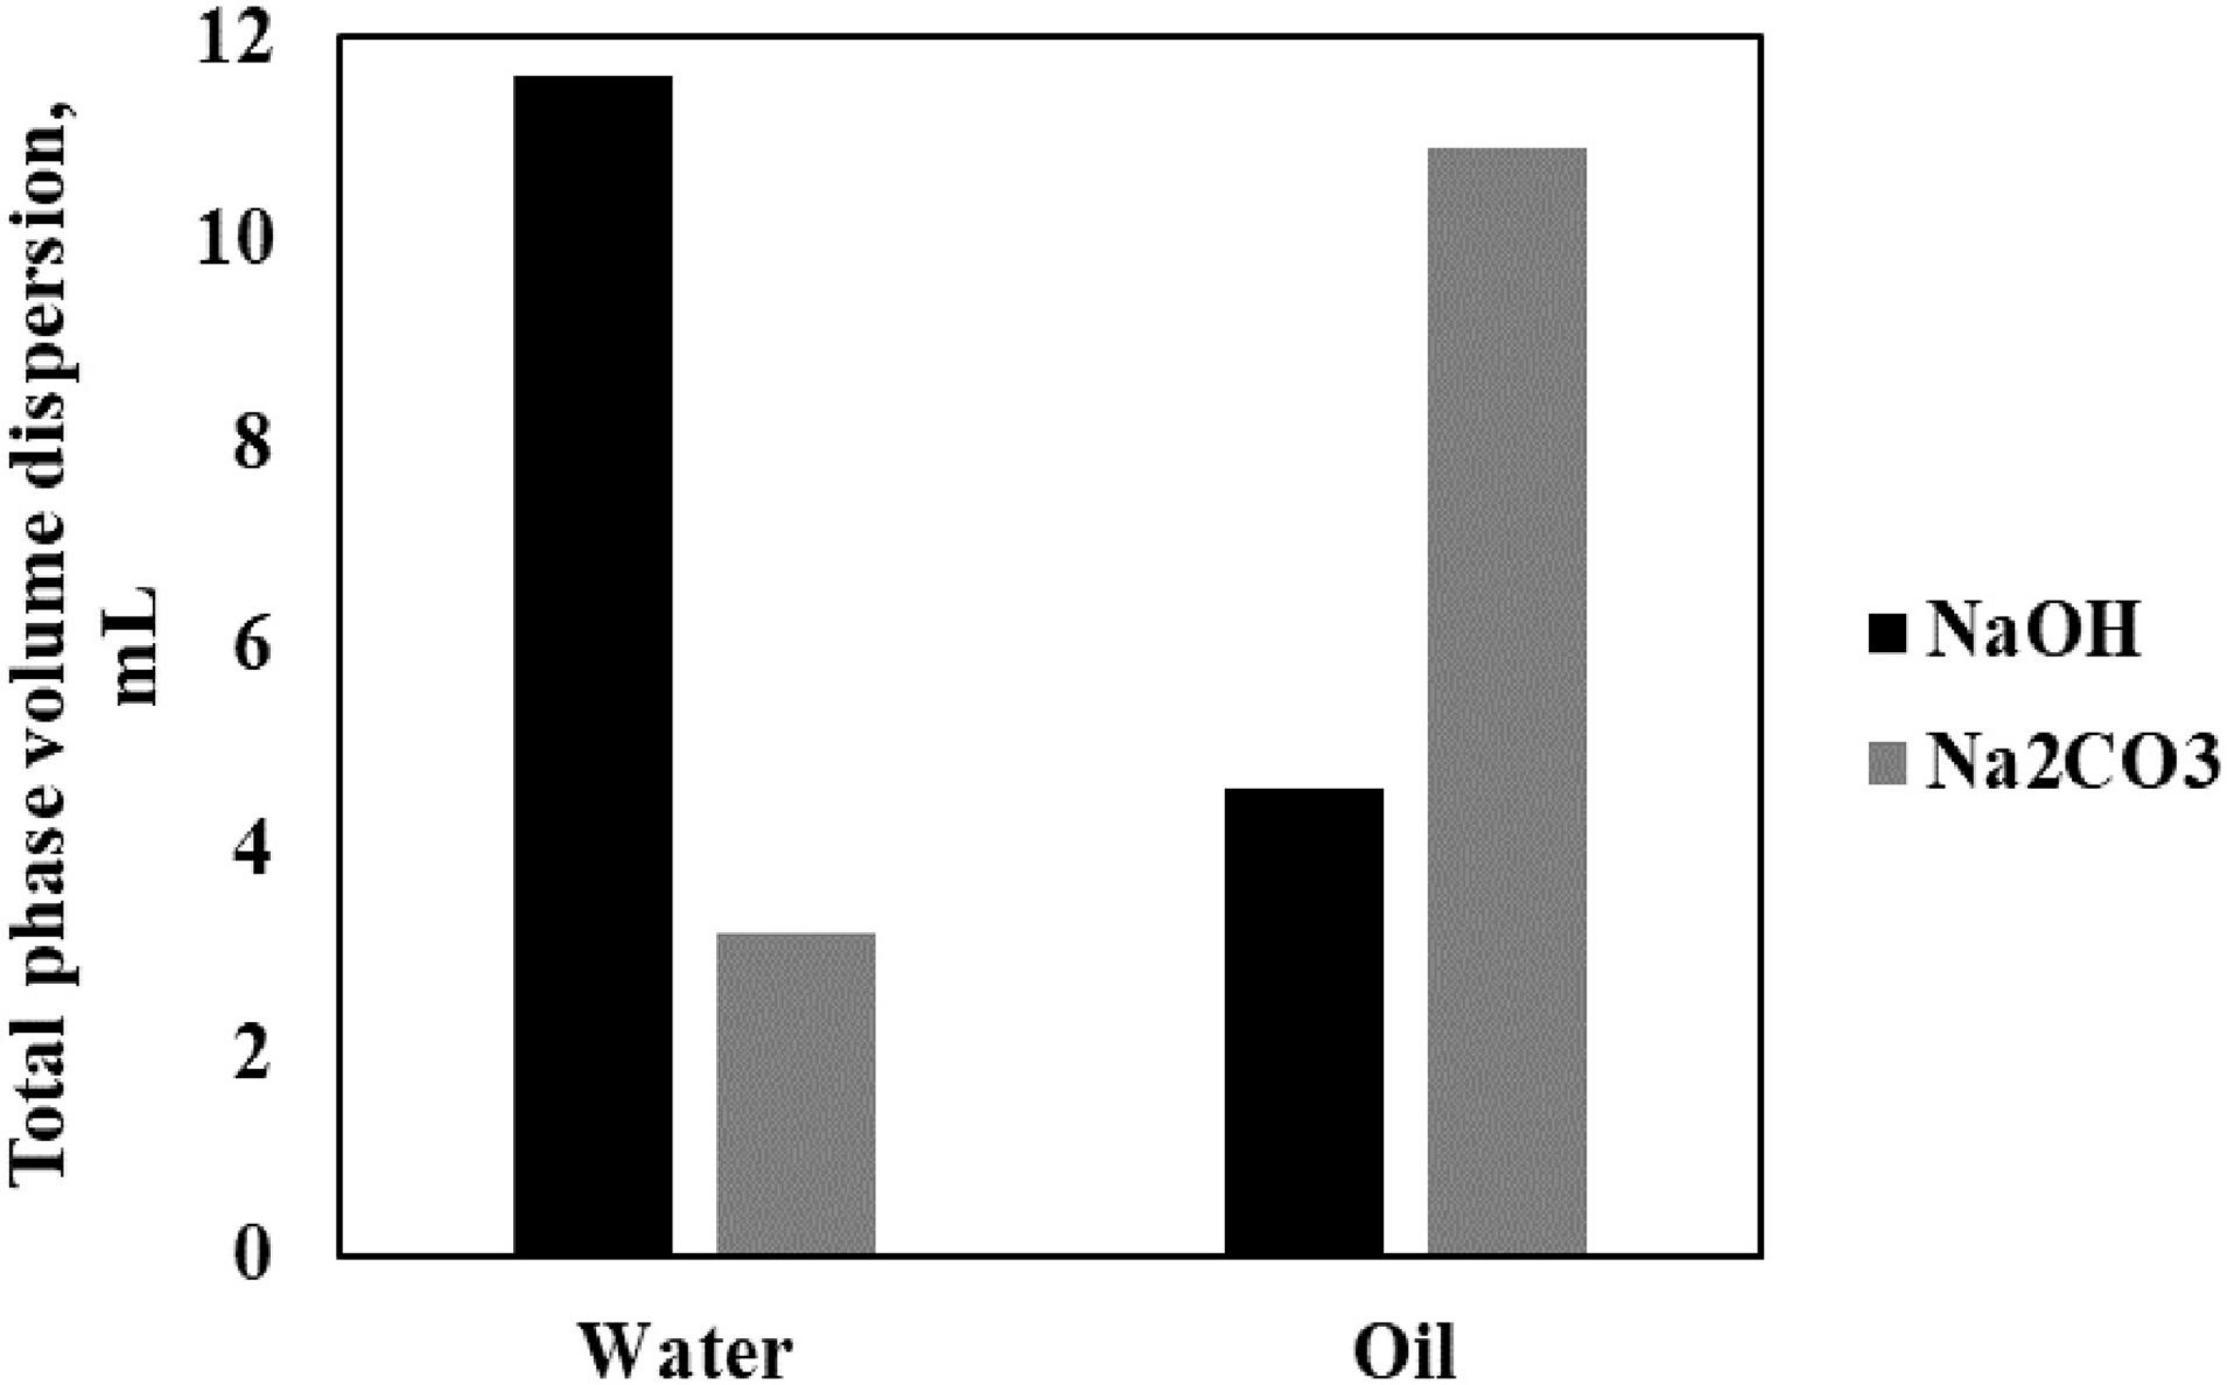
Figure 6. Total volume of water and oil distribution from orthogonal bottle test.
Tables 7, 8 collected and processed the oil and water absolute volume dispersion data from the NaOH and Na2CO3 orthogonal bottle test, respectively, according to the dominant emulsion formation for different alkalis.
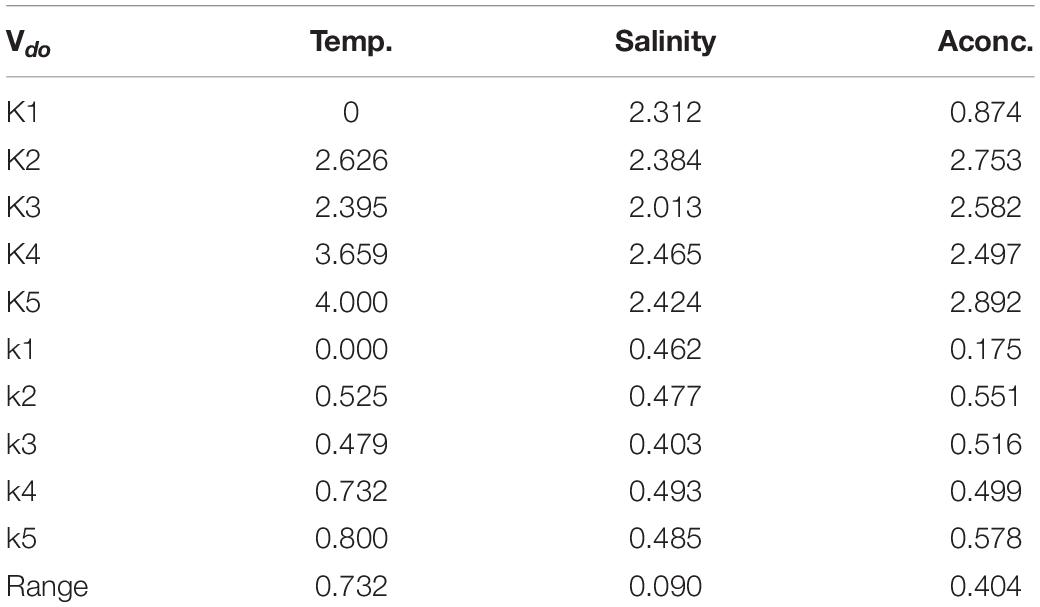
Table 7. NaOH Vdw orthogonal data processing.
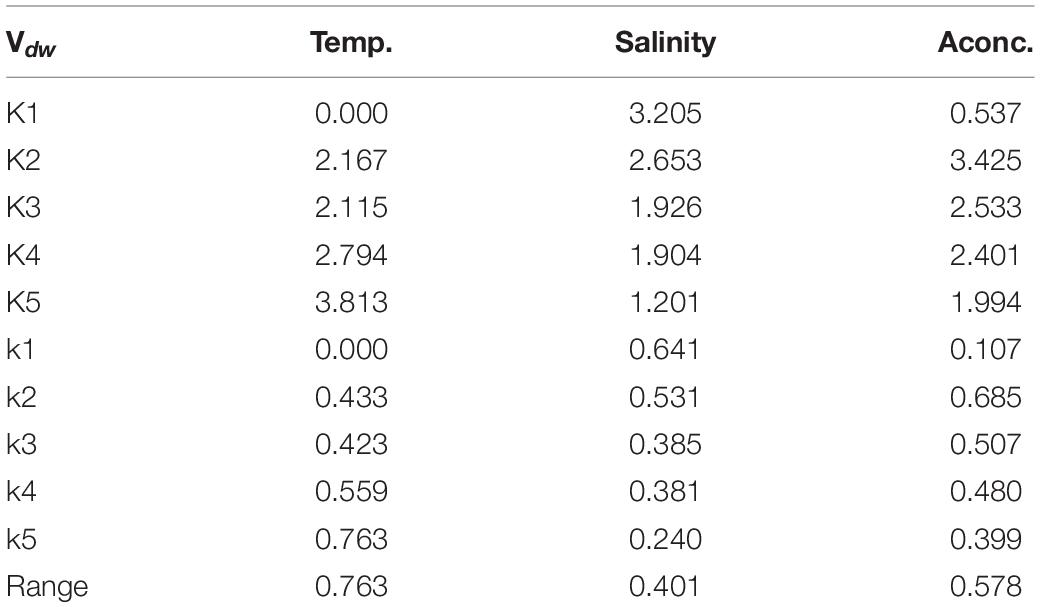
Table 8. Na2CO3 Vdo orthogonal data processing.
Correspondingly, kn analysis has been conducted to further study the control factor effects on dominant emulsion generation. It is shown in Figures 7, 8 that the temperature effect basically follows the same pattern determined from the total dispersed phase volume fraction trend study shown in Figures 4, 5.
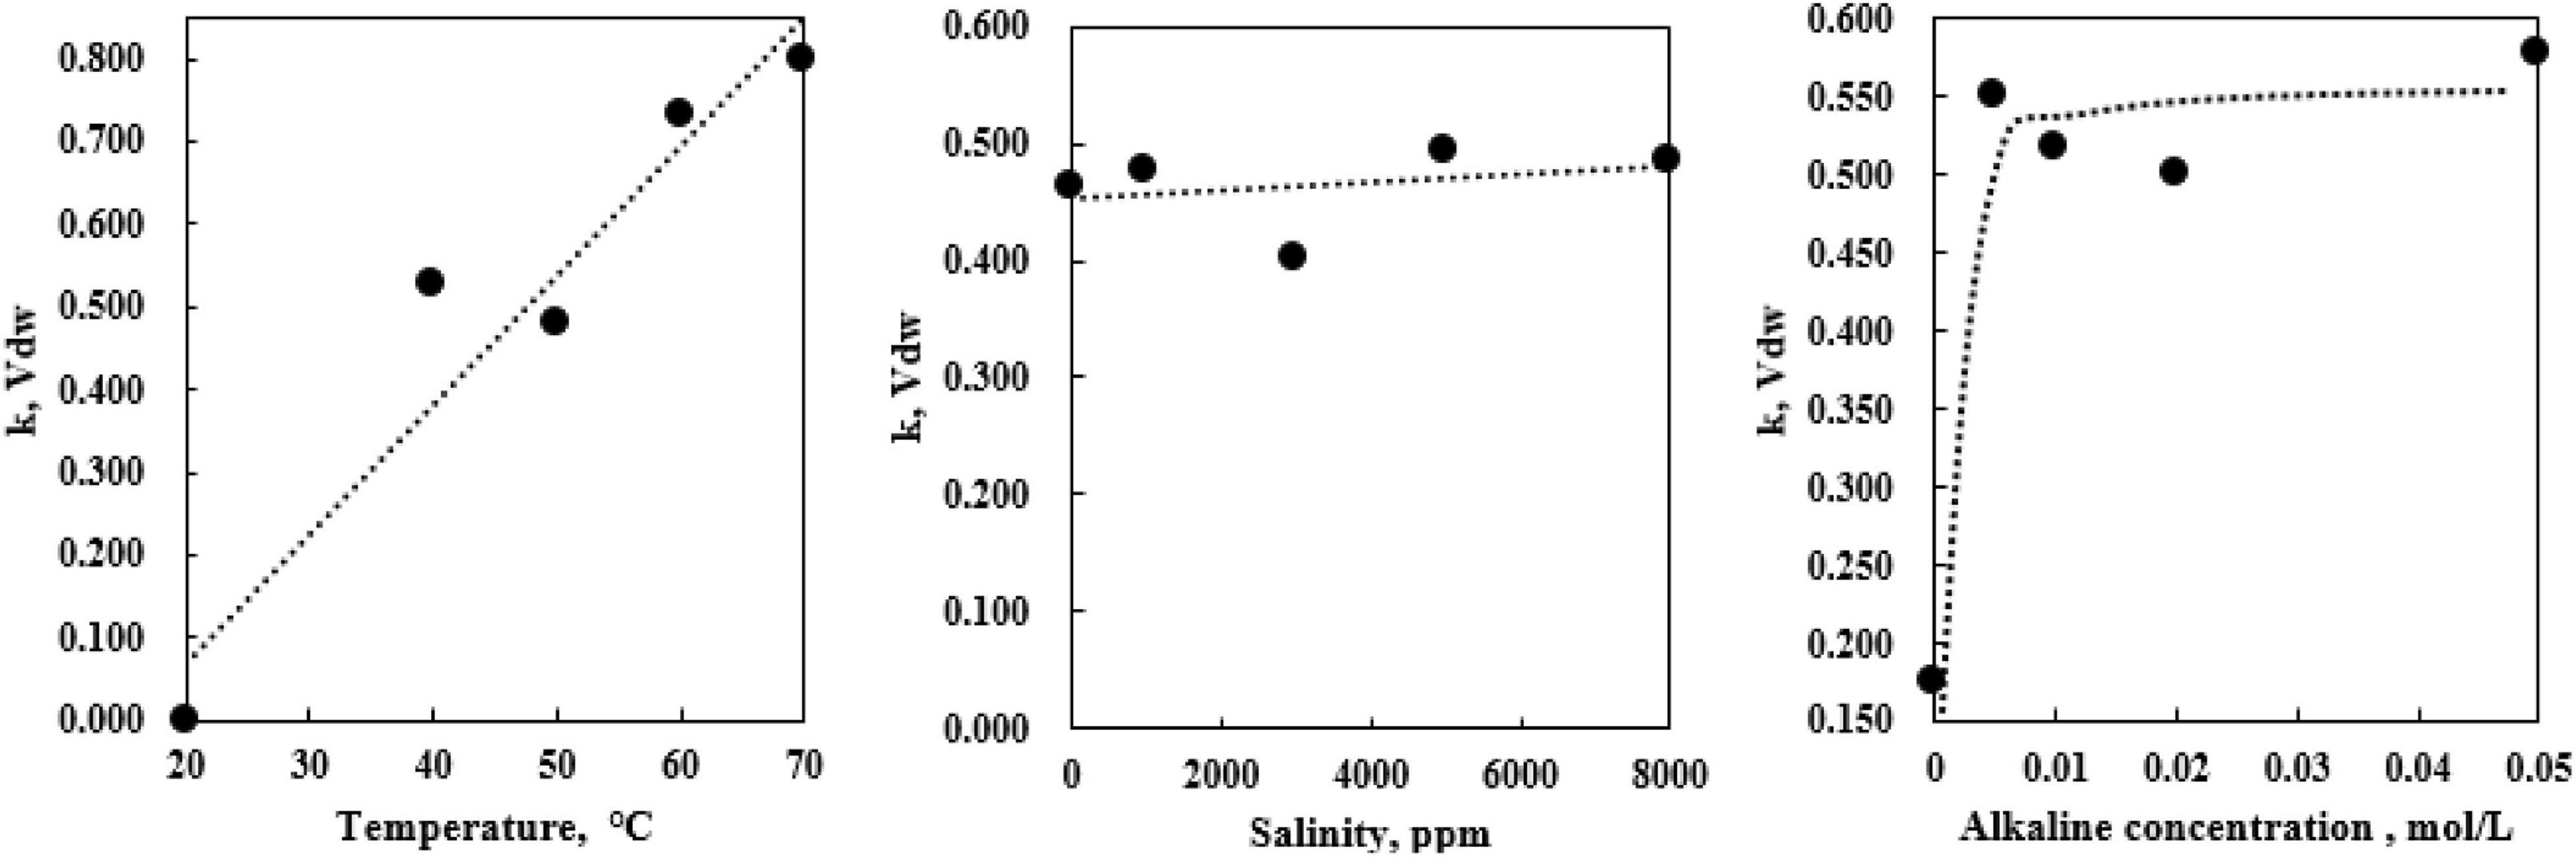
Figure 7. kn (Vdw) trend with changing control factors of NaOH orthogonal bottle test.
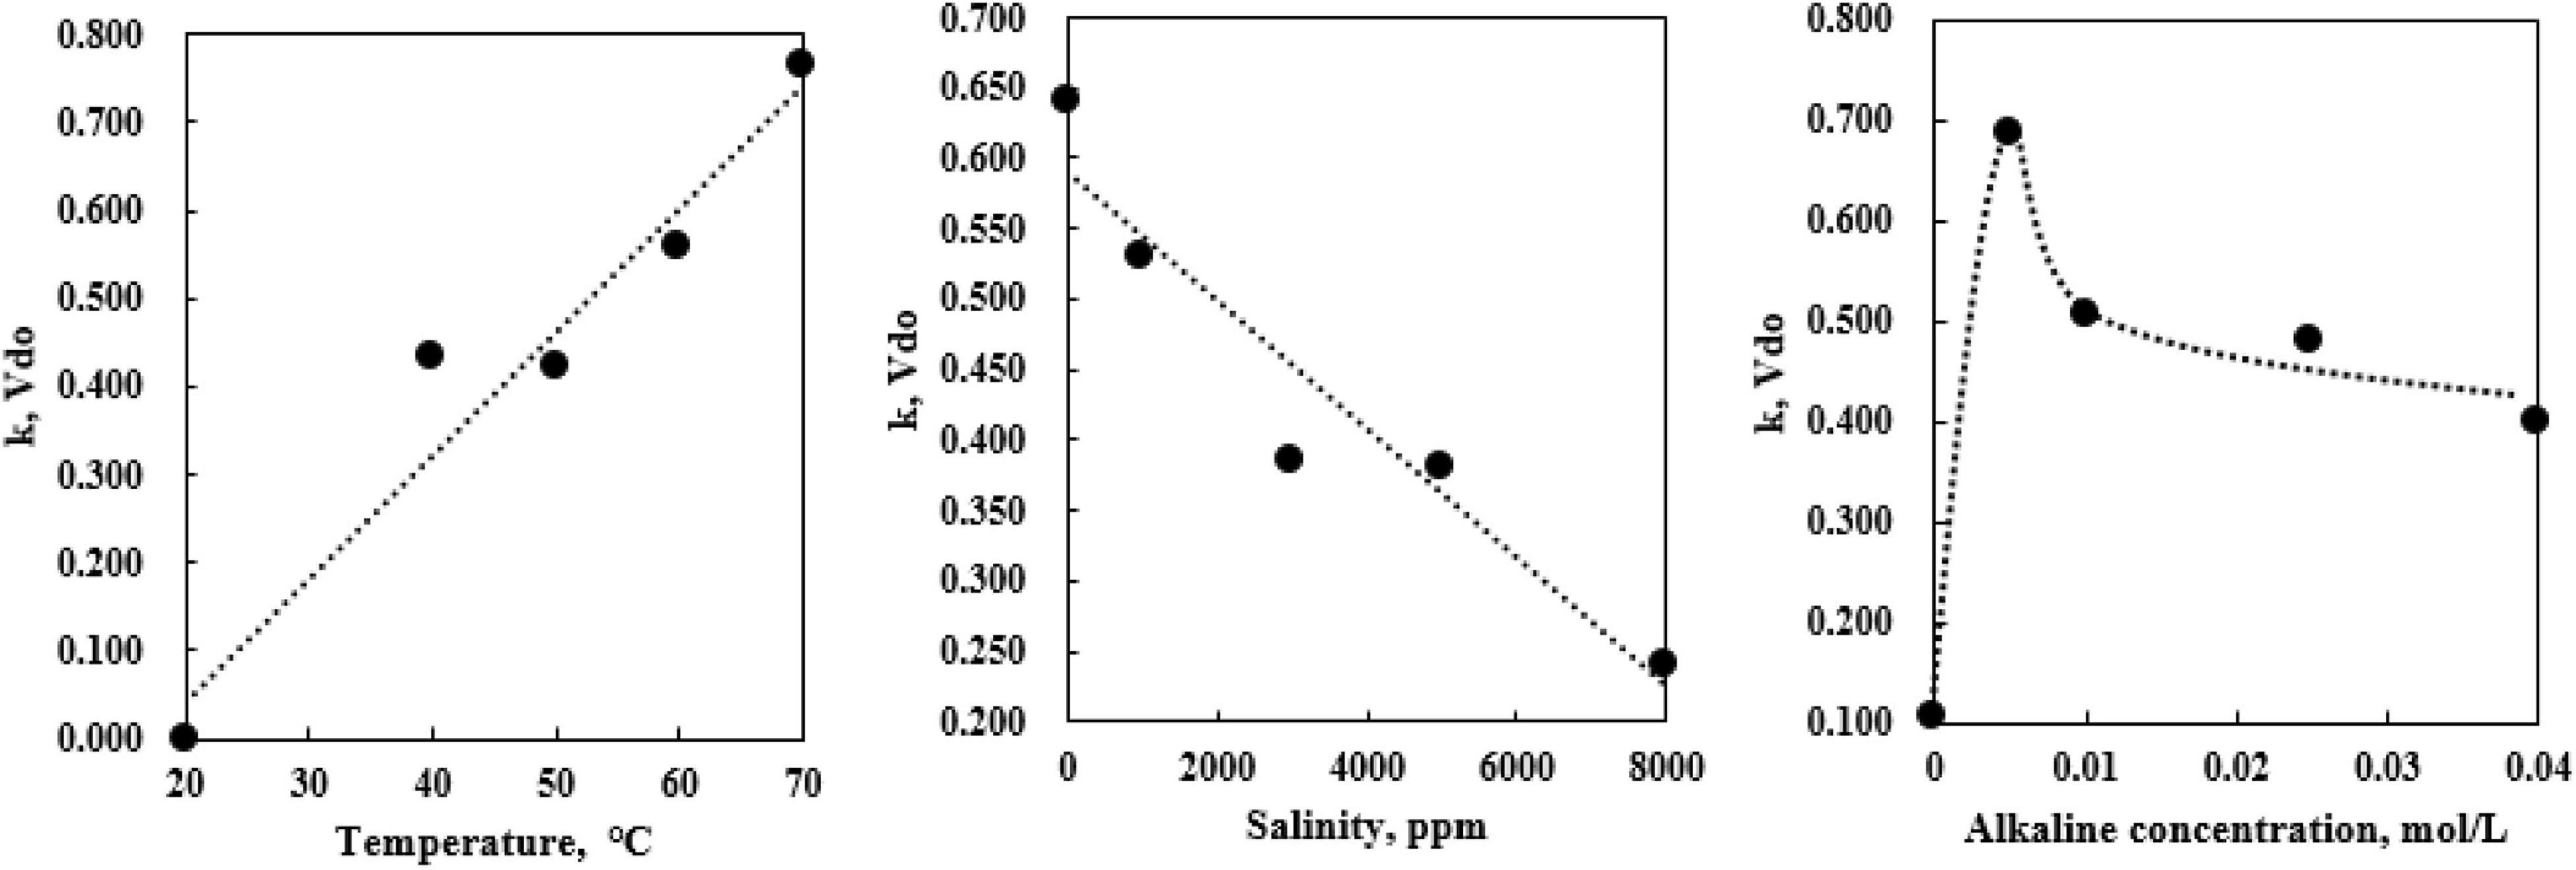
Figure 8. kn (Vdo) trend with changing control factors of Na2CO3 orthogonal bottle test.
Nonetheless, only the changes of salinity and alkaline concentration from the Na2CO3 case shown in Figure 8 keep the same trend as that of in Figure 5, while these two curves showed different patterns for the NaOH cases. It can be seen from Figure 7 that salinity change does not significantly influence the W/O emulsion generation. Similarly, additional NaOH concentration also has the least effect on water dispersion volume in oil phase as long as optimum NaOH concentration has been achieved.
Consequently, it can be concluded that the influences of salinity and alkaline concentration on the emulsification process were majorly embodied by the oil dispersion into the water phase. According to Cooke et al. (1974), surfactant tends to soar in elevation to upper phases when aqueous phase salinity grows. For alkali types like NaOH, which facilitates W/O emulsion formation at the first stage, the volume of oil dispersion in water phase is limited. Thus, salinity or alkaline concentration impact is low. For the Na2CO3 case in which O/W emulsion is dominant in the system, the effect from salinity and Na2CO3 concentration was obvious. Dispersed oil droplets gradually leave the water phase at higher salinity and alkaline concentrations. As Figure 9 illustrated, when salinity increases to over 3,000 ppm, emulsion type inversion occurred and water dispersion in oil phase was favored. Simultaneously, the increase of Na2CO3 concentration also facilitates the water dispersion into oil phase.
Figure 9. kn (Vdw) trend with changing control factors of Na2CO3 orthogonal bottle test.
Thus, W/O emulsion is likely to be generated when salinity or alkaline concentration increased for the Na2CO3 system. Therefore, it reveals that the difference between Figures 4, 7 of the NaOH cases is mainly because of the quantity change of O/W emulsion.
Based on the data analysis, the modified bottle test has provided satisfactory results in analyzing the phase distribution of the multi-emulsion system. According to the orthogonal bottle tests, changing alkali types, alkaline concentration, and salinity alters the major emulsion type generation which determines the alkaline flooding mechanisms to be achieved for facilitating the oil recovery. In theory, it will be of great convenience to predict the possible emulsion generation and oil recovery mechanisms during the alkaline flooding process through the modified bottle test.
Several sandpack alkaline flooding tests were conducted in order to validate the feasibility of the above hypothesis. The operating condition of the flooding test was majorly based on the modified bottle test design and was aimed at using the smallest number of tests to verify the most representative bottle test emulsion generation phenomenon considering the sandpack preparation time. The same heavy oil sample was used in the flooding test. Table 9 portrays the alkaline flooding strategy used in the sandpack experiments and the sandpack flooding schematic diagram is provided in Figure 10.
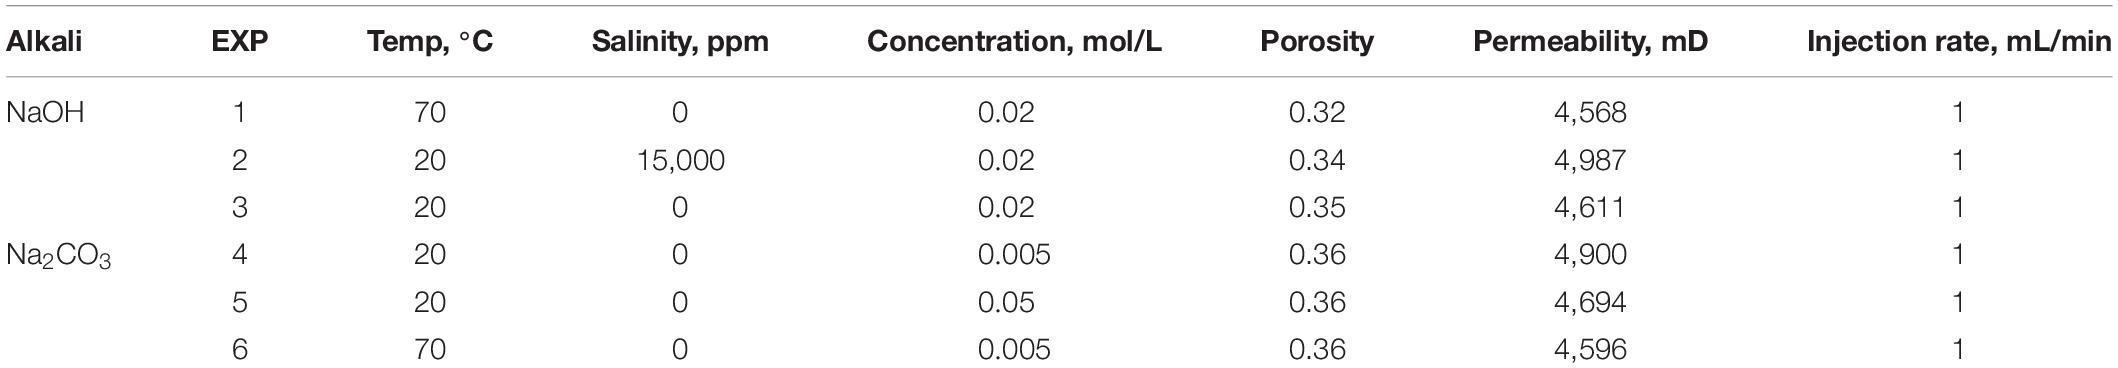
Table 9. Sandpack alkaline flooding test strategies.
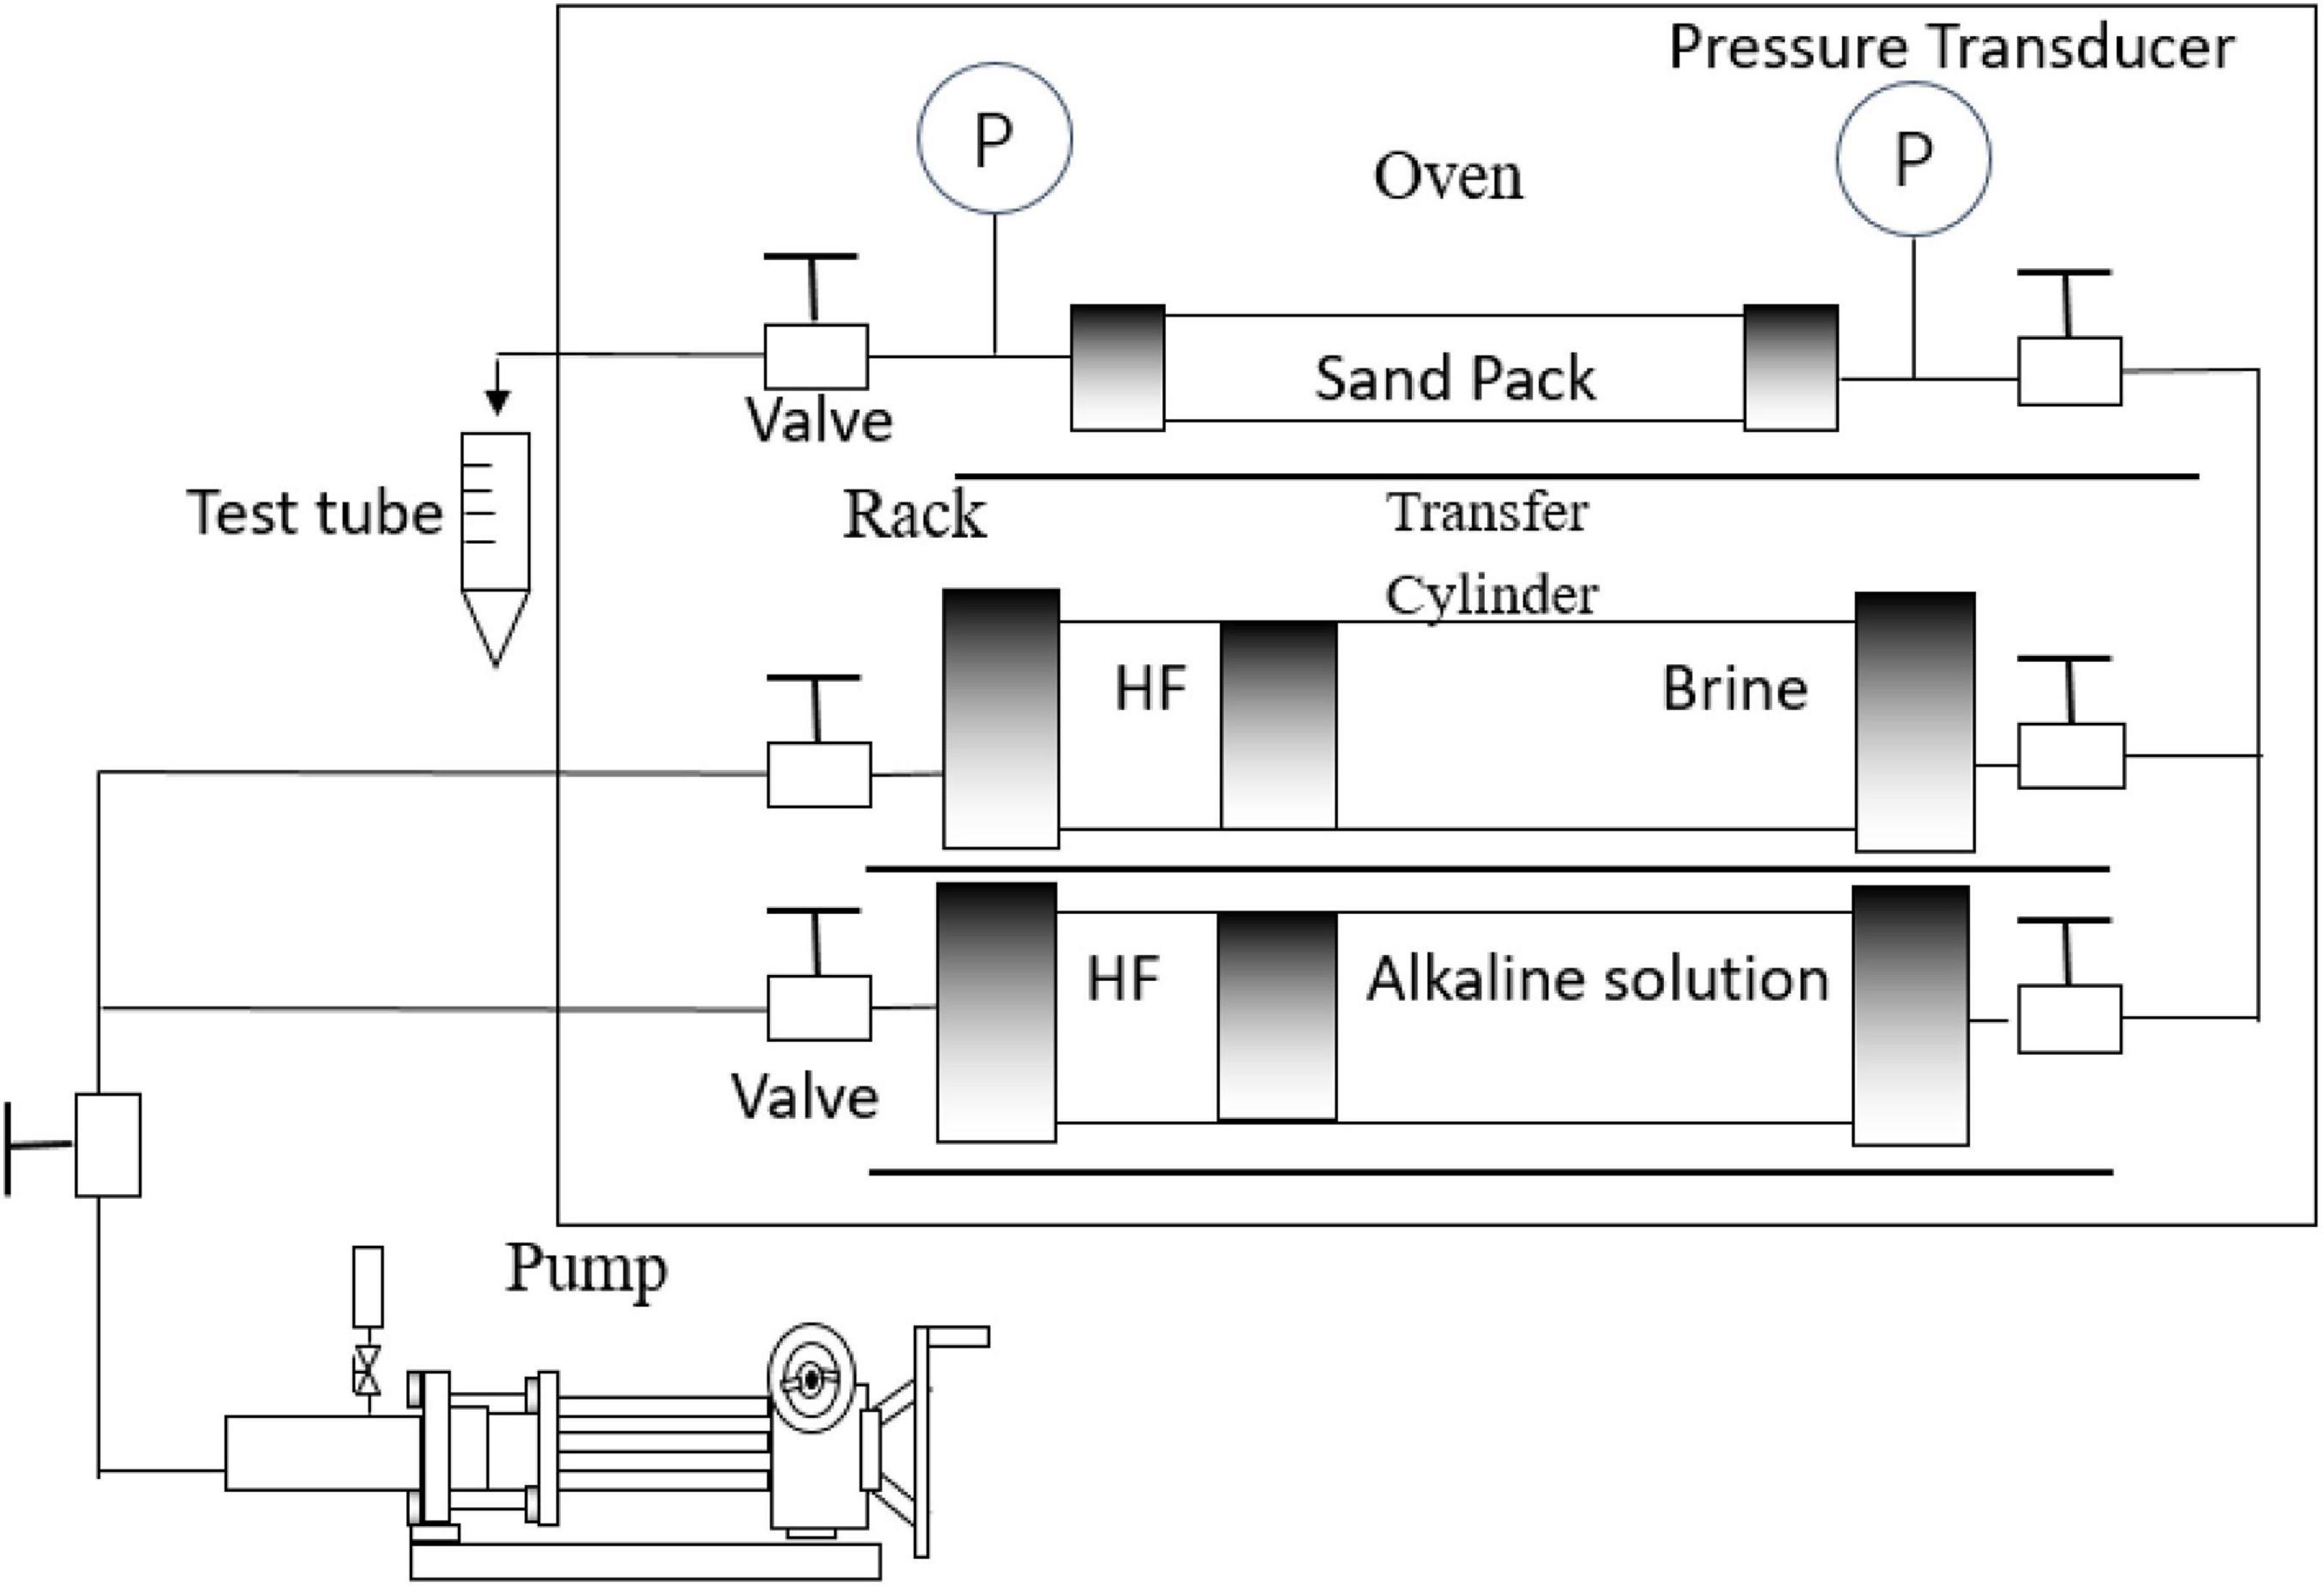
Figure 10. Schematic diagram of sandpack alkaline flooding test.
The 30 cm long and 4 cm diameter sandpack was vacuumed and weighted once fully packed by 80–120 mesh Ottawa sand. Then, deionized water/brine was sucked into the vertical oriented sandpack from the bottom and several PV of water/brine was injected to the sandpack afterward. The fully water-saturated sandpack was then weighed again to calculate the sandpack porosity. The absolute permeability of the sandpack was measured by injecting water/brine at different rates and monitoring the pressure drop at a steady state based on Darcy’s law. Then, the sandpack was placed vertically again and oil was injected at 0.1 mL/min from the top to displace water at the bottom. The total discharged water volume was measured to calculate the initial water saturation.
As seen from Table 9, the measured porosity and permeability of the sandpack maintained relatively good consistency among different tests; thus, the repeatability of the flooding test can be assured. The sandpack has irreducible water saturation after the drainage process at 6∼8% and the pore volume is approximately 150 cm3. The sandpack was flooded by water/brine at 1 cmł/min as the primary production stage until the effluent water cut was above 95%. Then, 0.7 pore volume (PV) of alkaline solution was injected followed by extended water/brine injection according to similar flooding test configurations by previous researchers (Castor et al., 1981; Pei et al., 2012). The flooding process stopped when water cut returned to 95% at the final water flooding stage.
Figure 11 portrays the six alkaline flooding test results for NaOH and Na2CO3, respectively, in terms of oil recovery and pressure drop.
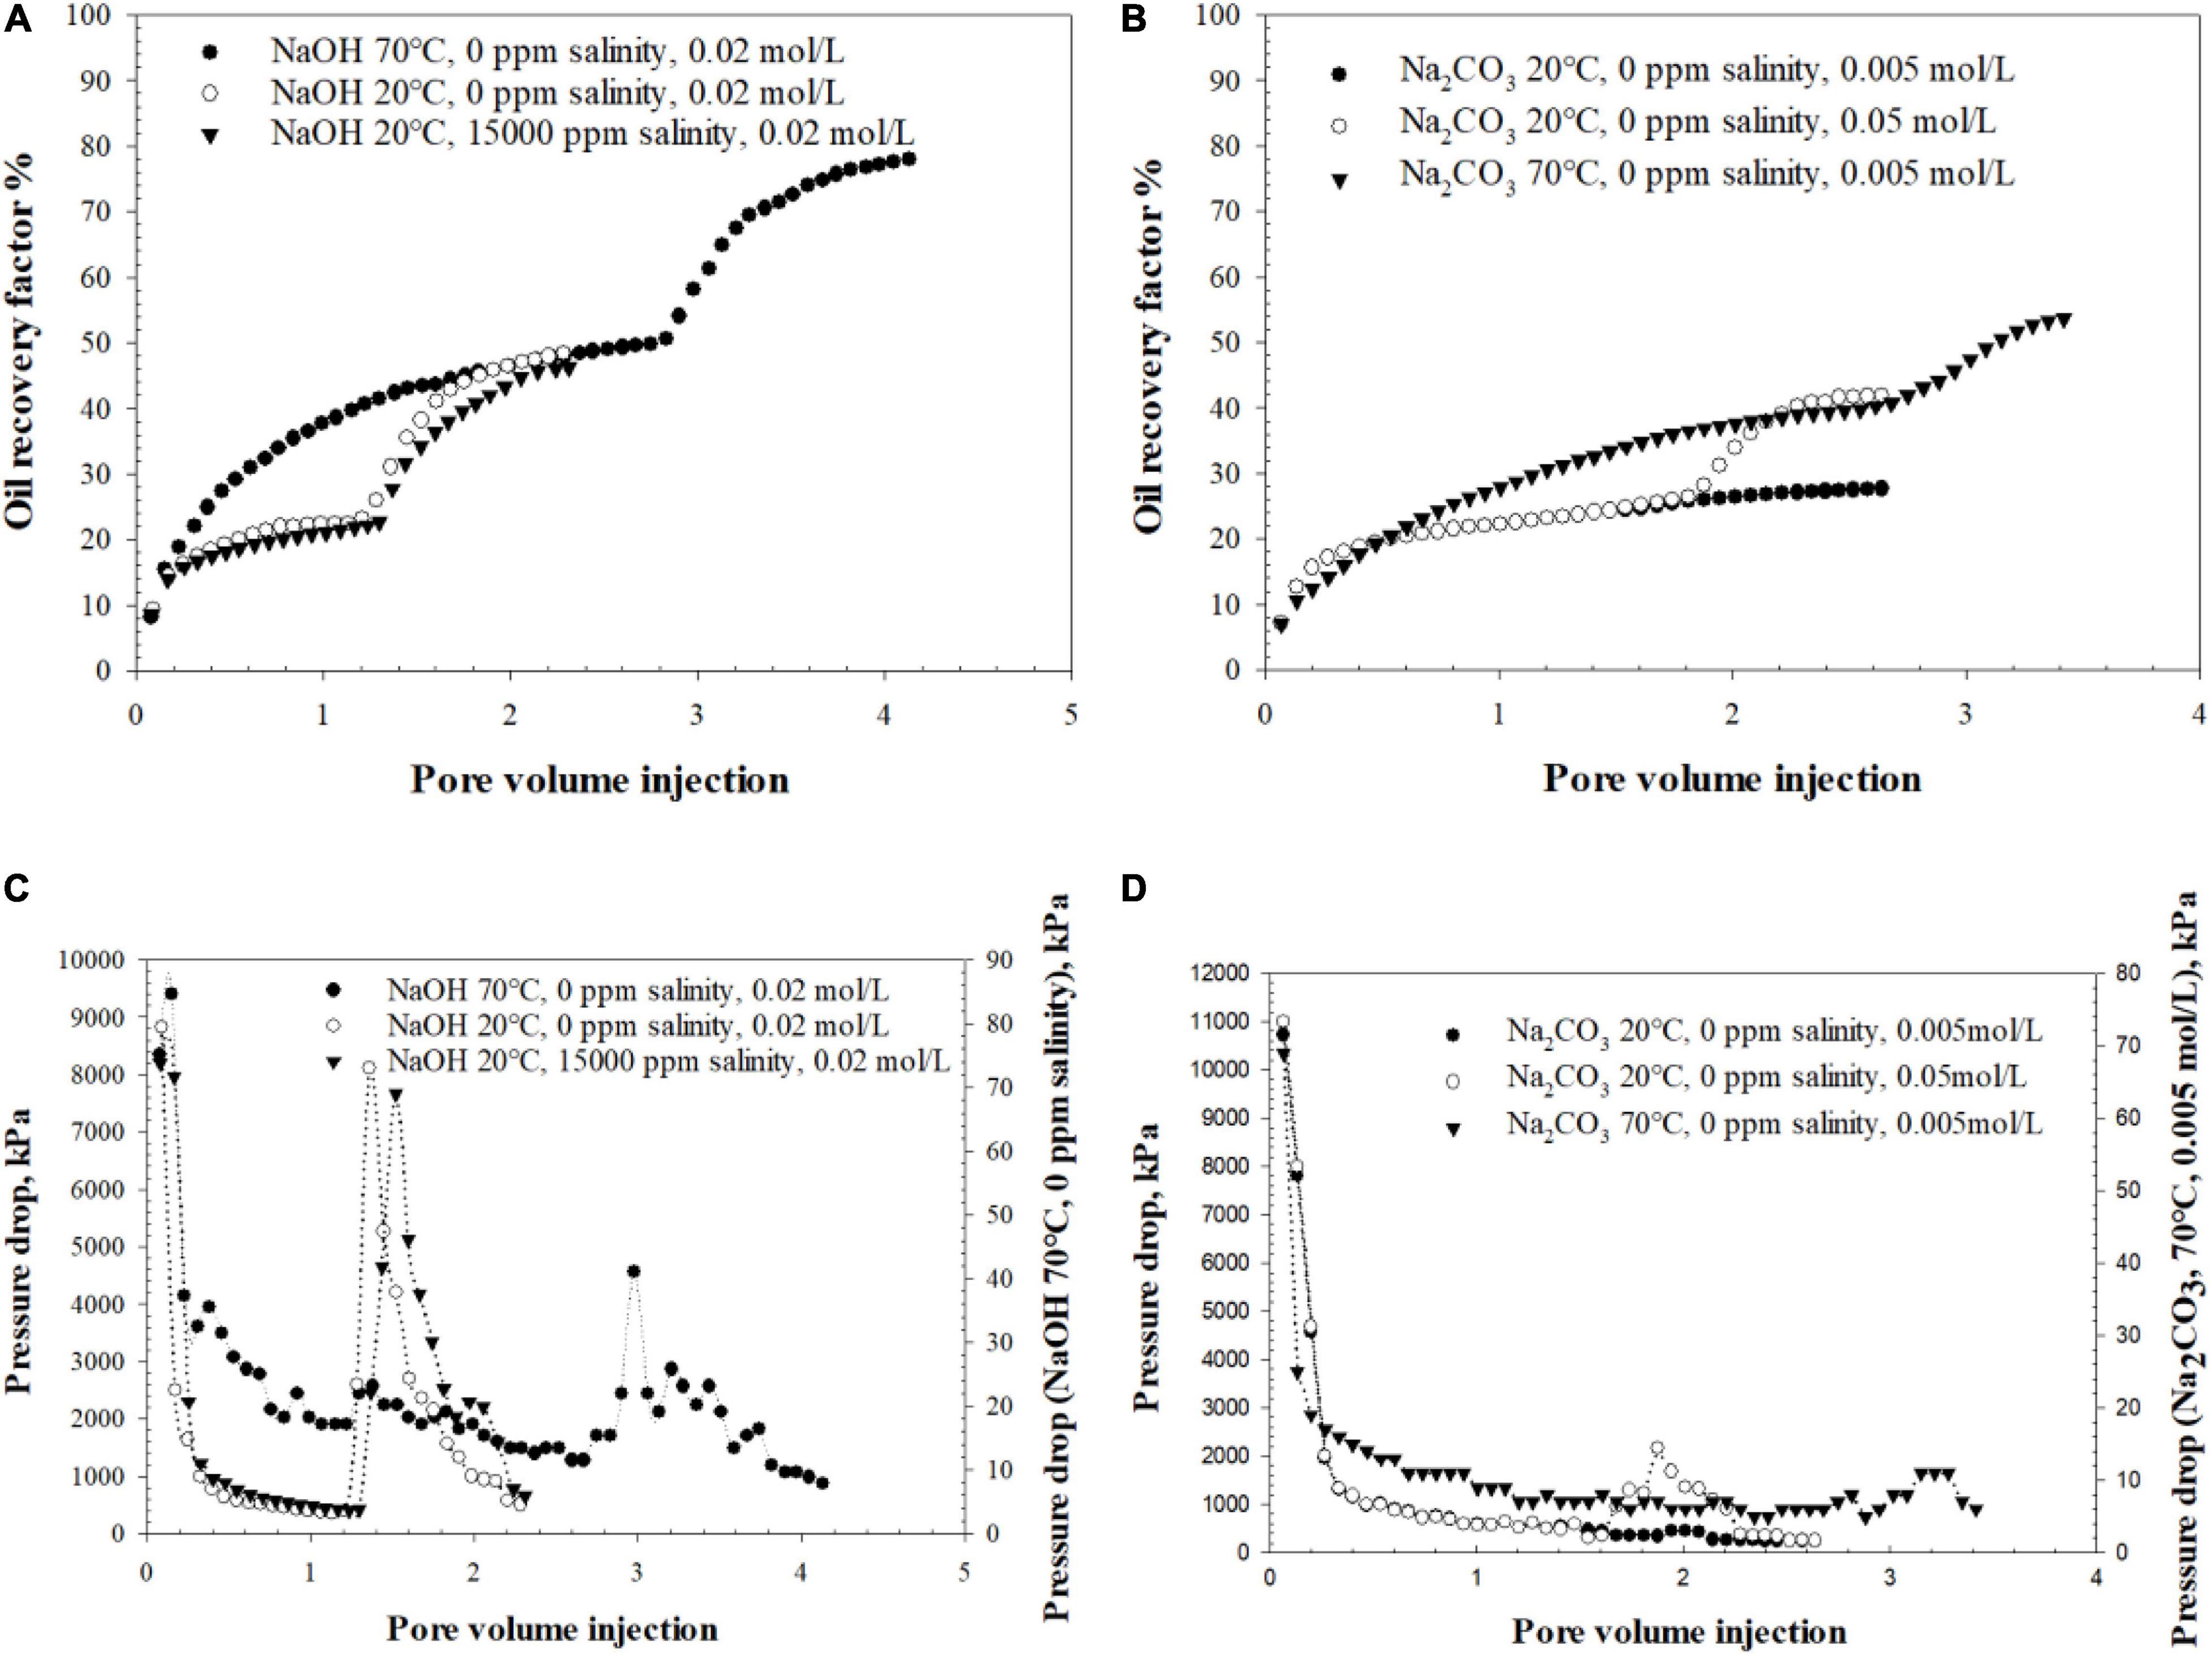
Figure 11. Sandpack flooding test data starting from: (A) NaOH flooding oil recovery factor; (B) Na2CO3 flooding oil recovery factor; (C) NaOH flooding pressure drop; (D) Na2CO3 floodin g pressure drop.
The abrupt hike of oil recovery after the alkali injection for all three NaOH cases is clear from Figure 11A. Either ambient temperature (20°C) or 70°C NaOH solution injection brought an extra 26∼30% of OOIP recovered after water flooding. Similar to the previous bottle test results, alkaline flooding using NaOH at 70°C produced large amounts of W/O emulsion with high viscosity. The effluent was also accompanied with noticeable oil dispersion in the water phase, as shown in Figure 12A, which can be confirmed with the turbidity change of produced water. NaOH flooding at ambient temperatures had only trace oil dispersion into the water phase as demonstrated by its crystal-clear water phase effluent in Figure 12B. After 0.23 PV of NaOH injection, the pressure at the injection end started to rebuild (Figure 11C) which indicates the formation of high viscous oil emulsion with possible wettability reversal inside of the porous media (Johnson, 1976). The oil emulsion broke through afterward when the produced oil color turned out to be brownish and different from the initial oil’s dark black color. The oil emulsion was sampled by time and Karl Fischer titration showed sample water content was approximately 30 wt%. The water portion will be subtracted from the emulsion to determine the actual recovered oil volume. It is found that the oil recovery performance of strong basic solution is not sensitive to temperature change in the testing range no matter how much OOIP was produced by previous water flooding stage. High temperatures may slightly increase the in situ surfactants solubility to water, although its overall influence is negligible given the current temperature range (Karnanda et al., 2012).
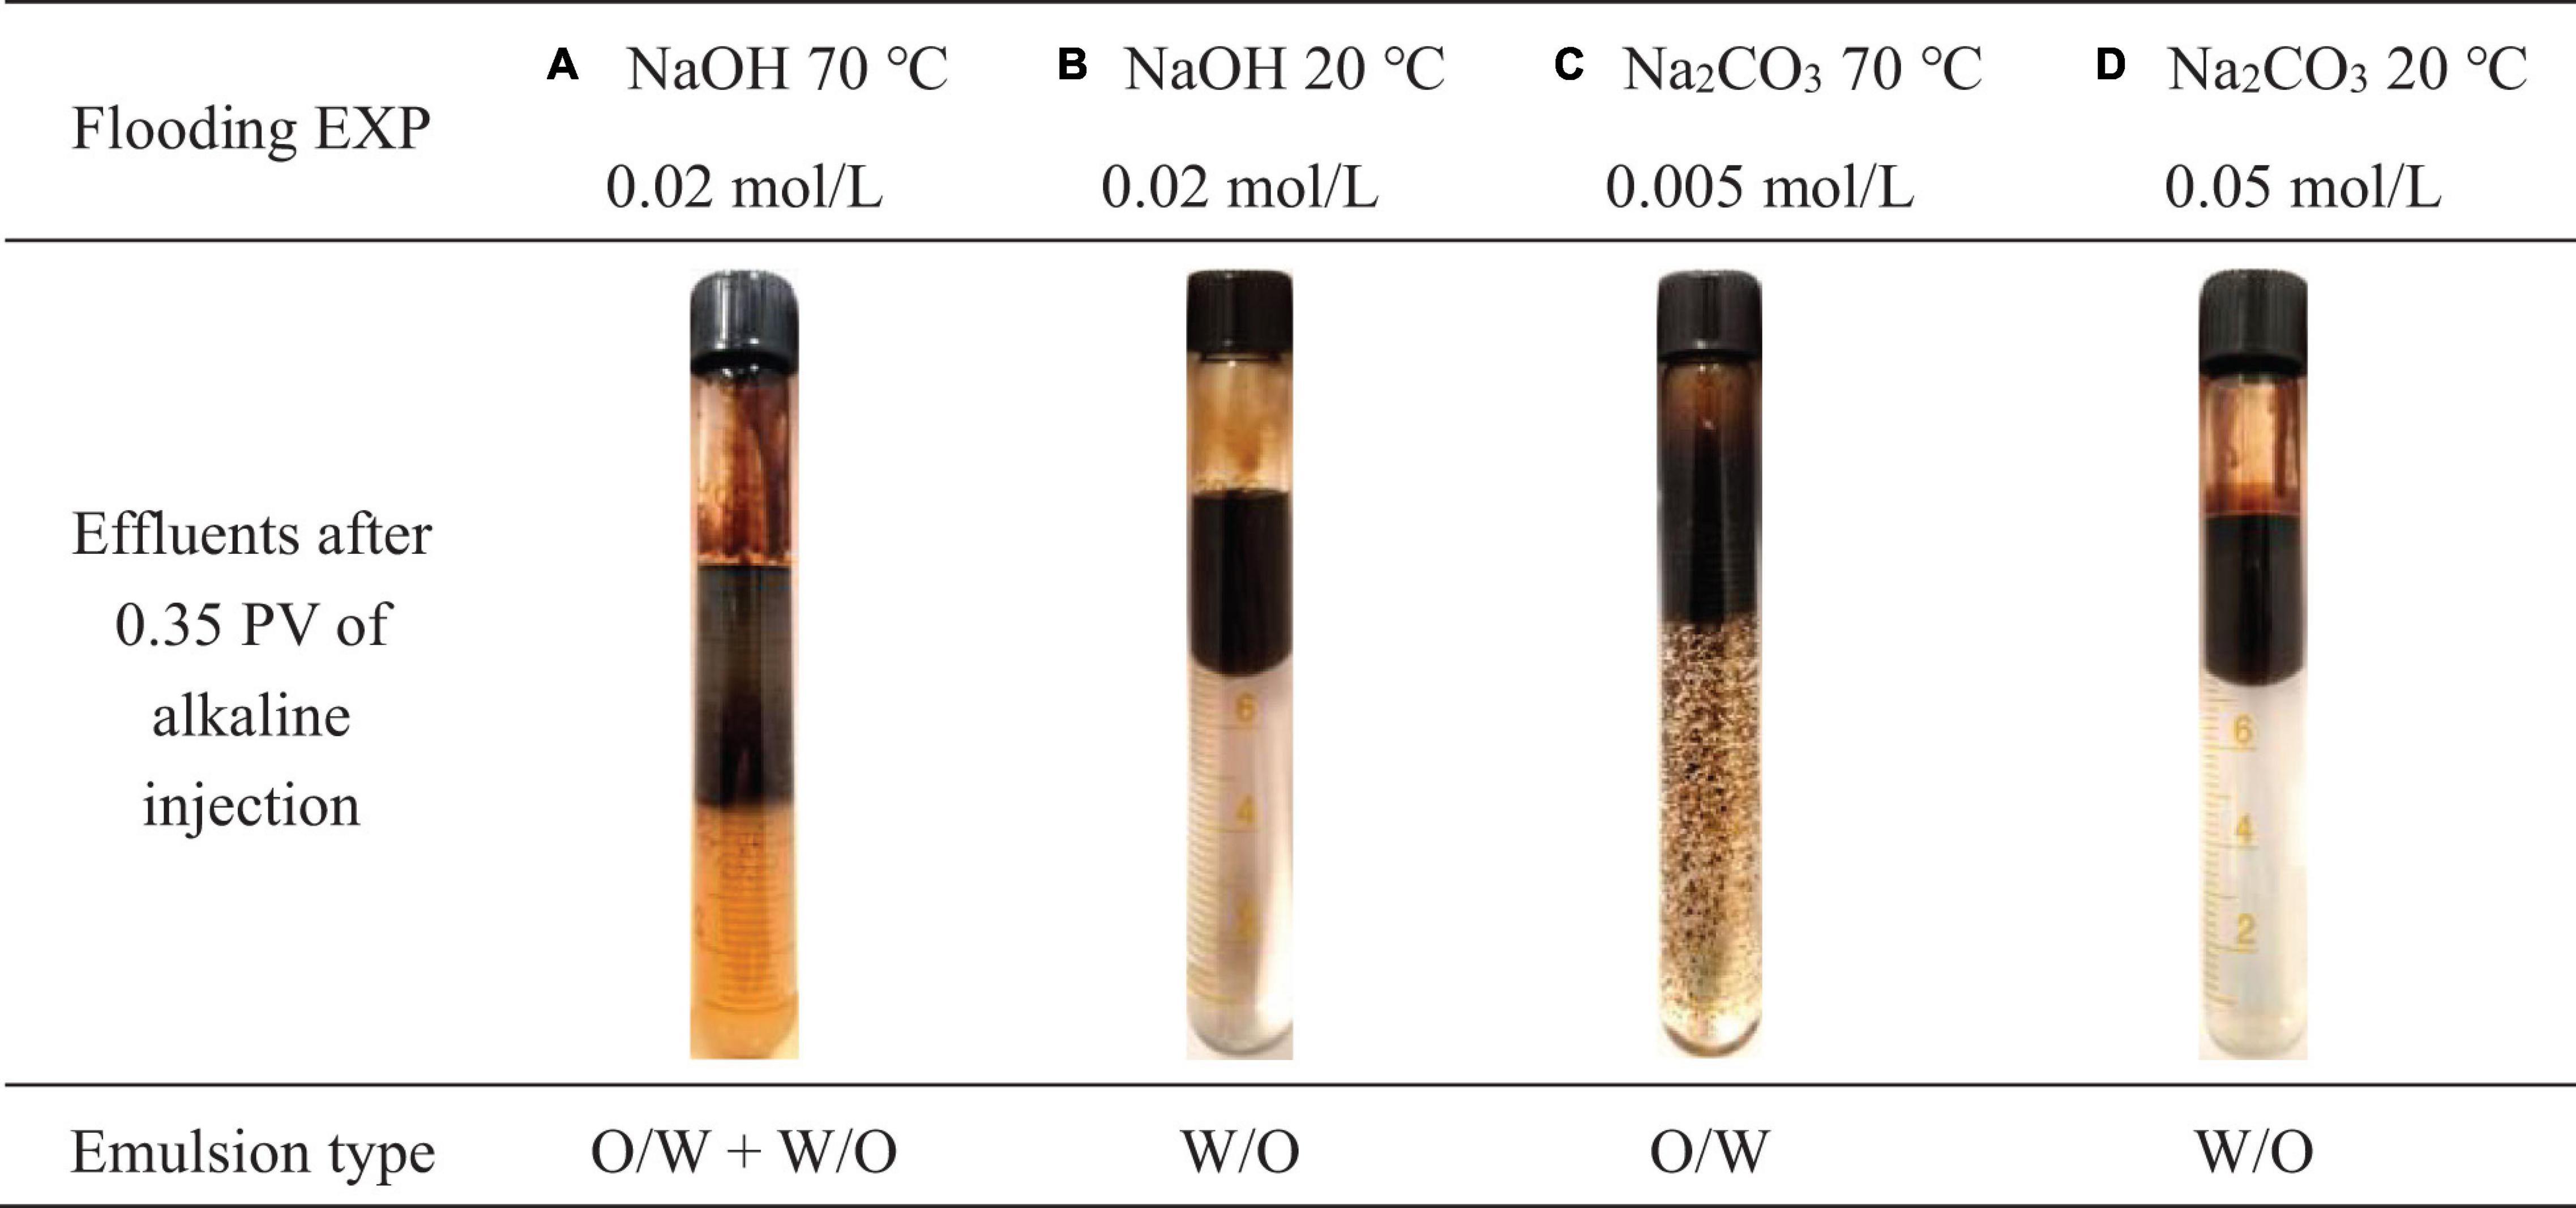
Figure 12. Emulsion (upper or lower emulsion) type of effluent from sandpack. (A) Effluent collected after 0.35 PV of 0.02 mol/L NaOH flooding at 70 °C. (B) Effluent collected after 0.35 PV of 0.02 mol/L NaOH flooding at 20 °C. (C) Effluent collected after 0.35 PV of 0.005 mol/L Na2CO3 flooding at 70 °C. (D) Effluent collected after 0.35 PV of 0.05 mol/L Na2CO3 flooding at 20 °C.
The NaOH cases with brine of 15,000 ppm NaCl salinity had only 2% of OOIP difference to the deionized water case, which can be attributed to normal experimental deviation. The pressure build-up for both cases with and without salinity occurred within the same injection interval and their emulsion effluents had similar water contents. It proves one of the conclusions from the bottle test that the emulsification performance of strong alkali is not salinity sensitive. By analyzing the three NaOH flooding cases, it is found that the formation of O/W emulsion does not critically affect oil recovery. The wettability reversal (water-wet to oil-wet) mechanism dominates oil recovery through NaOH flooding, which can be described by W/O emulsion generation as well as the pressure rebuild phenomenon. The viscosity of effluent W/O emulsion measured by a cone and plate viscometer was found to be over 200,000 cp, which is almost 10 times higher than the original heavy oil viscosity. Consequently, the W/O emulsion plays a similar role as polymer to control the mobility accompanying possible blockage of water droplets in high permeable channels to improve the sweep efficiency (Arhuoma et al., 2009).
Identical to the bottle test prediction, Na2CO3 flooding tests showed different phenomena from the NaOH flooding tests. 0.7 PV of 0.005 mol/L alkaline injection at 70°C produced an extra 13% of OOIP after water flooding. However, there was no apparent pressure rebuild during the Na2CO3 injection stage (Figure 11D) due to O/W emulsion generation, shown in Figure 12C. The produced oil during alkaline injection was sampled and its water content was lower than 7 wt%, thus the oil color is still black. There was a very slight pressure rebuild period during the final water flooding stage, which was also reported by Aminzadeh et al. (2016). It is believed to be induced by a small amount of trapped oil droplets in pore throats of the water dominant flow channel.
The temperature sensitivity test was also implemented to inject the same 0.005 mol/L Na2CO3 solution after water flooding at 20°C. However, the oil recovery did not show any increase. The first reason is due to the high oil viscosity at low temperatures, which significantly reduces the oil dispersion possibility. A second reason is increased temperature is required to provide additional energy to facilitate the alkali dissociation in aqueous phase. As is known, the dissociation of weak alkalis, like Na2CO3, normally undergoes multiple stages. The following chemical equations (Acevedo et al., 2001) were used to describe the generation of [OH–] group in two reversible reactions with postponement of [OH–] group generation.
High temperature conditions may favor the forward reaction to generate sufficient [OH–] group in the system and consequently reduces the IFT to a lower level (Reardon, 1976).
Additionally, 0.05 mol/L of Na2CO3 solution was injected after water flooding at an ambient temperature. Such a concentration is a bit off of the optimum Na2CO3 concentration determined from the bottle test, but it is still workable for a saponification reaction since Na2CO3 is an excellent buffer solution source. It can maintain the aqueous phase pH lower than 12 which is within the alkaline flooding working pH range (Rivas et al., 1997; Ashrafizadeh et al., 2012) that keeps asphaltenes and resins active with alkalis (Bryan and Kantzas, 2007). The flooding result fully matched with the previous bottle test result that W/O emulsion was generated at high Na2CO3 concentration, as shown in Figure 12D. In this case, no oil dispersion in the water phase was observed from the effluent and the produced oil phase had more than 20 wt% of water content. The pressure from the injection end also rose after Na2CO3 injection but it was not as high as that in the NaOH flooding case. According to Bryan and Kantzas (2007), Wang et al. (2010), and Dong et al. (2012) W/O emulsion viscosity increases with growing water content before converting to water-external emulsion. Since the water content of oil-external emulsion from a high Na2CO3 concentration case is lower than NaOH cases, its lessened viscosity resulted in less pressure rebuild peak and therefore recovered less oil. The emulsion type reversal in sandpack flooding with increasing Na2CO3 concentration is in good agreement with the Na2CO3 orthogonal bottle test study (Figure 9).
Generally, it can be concluded that a strong basic solution EOR like NaOH flooding showed better performance in oil recovery relying on wettability reversal and high viscous W/O emulsion formation (Ding et al., 2010). Such Type II emulsion has been proven to have the highest economic efficiency by Aminzadeh et al. (2016). Na2CO3 flooding on the other hand is more environmentally friendly due to its mild dissociation process. Appropriately low concentrations of Na2CO3 solution injection under ideal temperatures and salinities can produce oil through emulsification and entrainment mechanisms. The essential difference between the two major types of emulsion produced after NaOH and Na2CO3 solution injection can be manifested by microscopic observation, seen in Figures 13A,B.
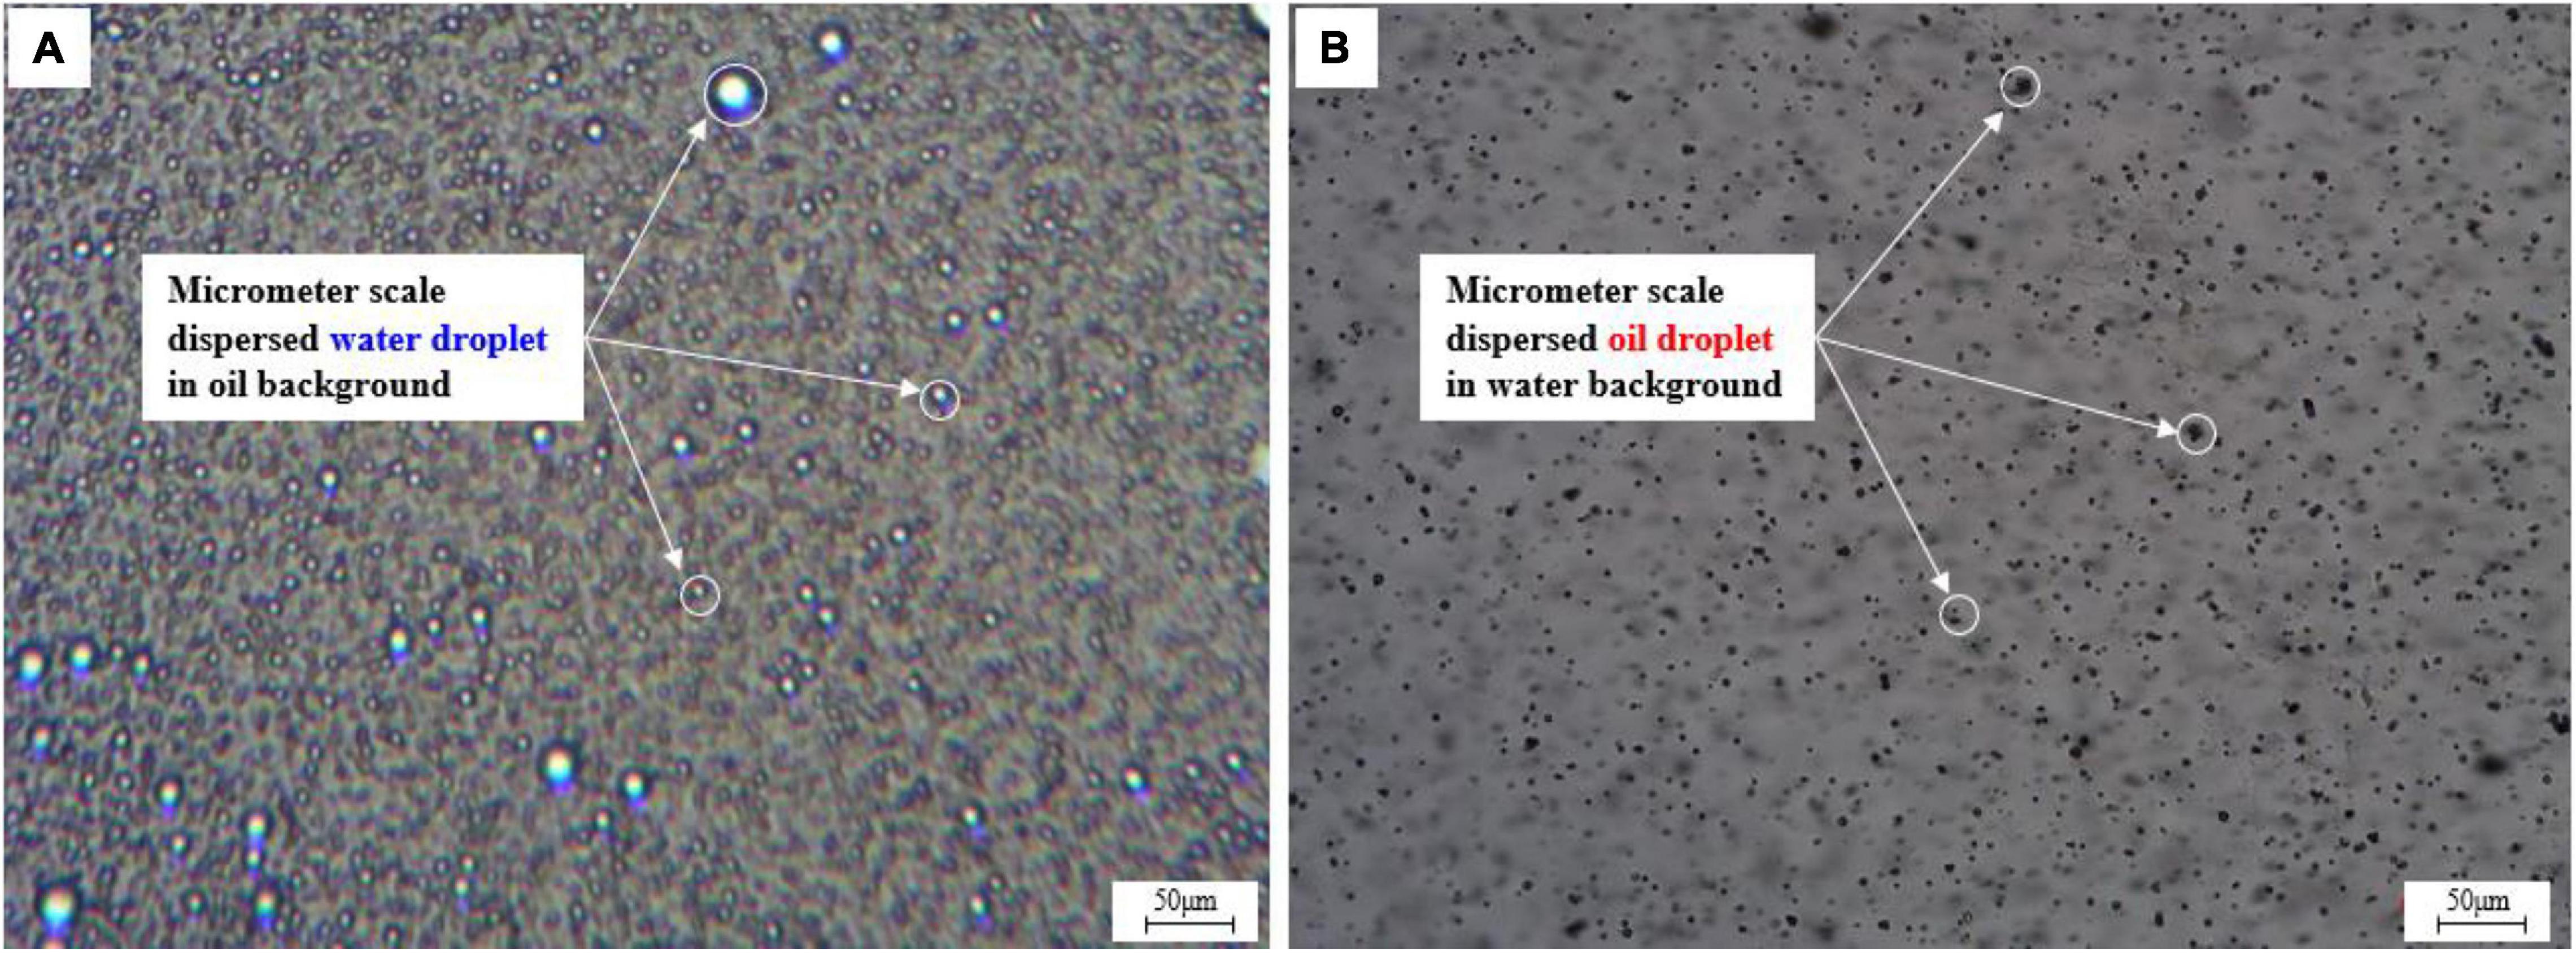
Figure 13. Sandpack flooding test effluents of (A) water in oil emulsion and (B) oil in water emulsion under microscopic view.
The particle size distribution analysis based on microscopic images (Figure 14) shows that the water droplets in W/O emulsion have a larger radius than oil droplets in water emulsion. Therefore, the water droplets in oil-external emulsion have a higher possibility to plug the high permeable zone and thus improves the sweep efficiency and contributes to the pressure buildup as well.
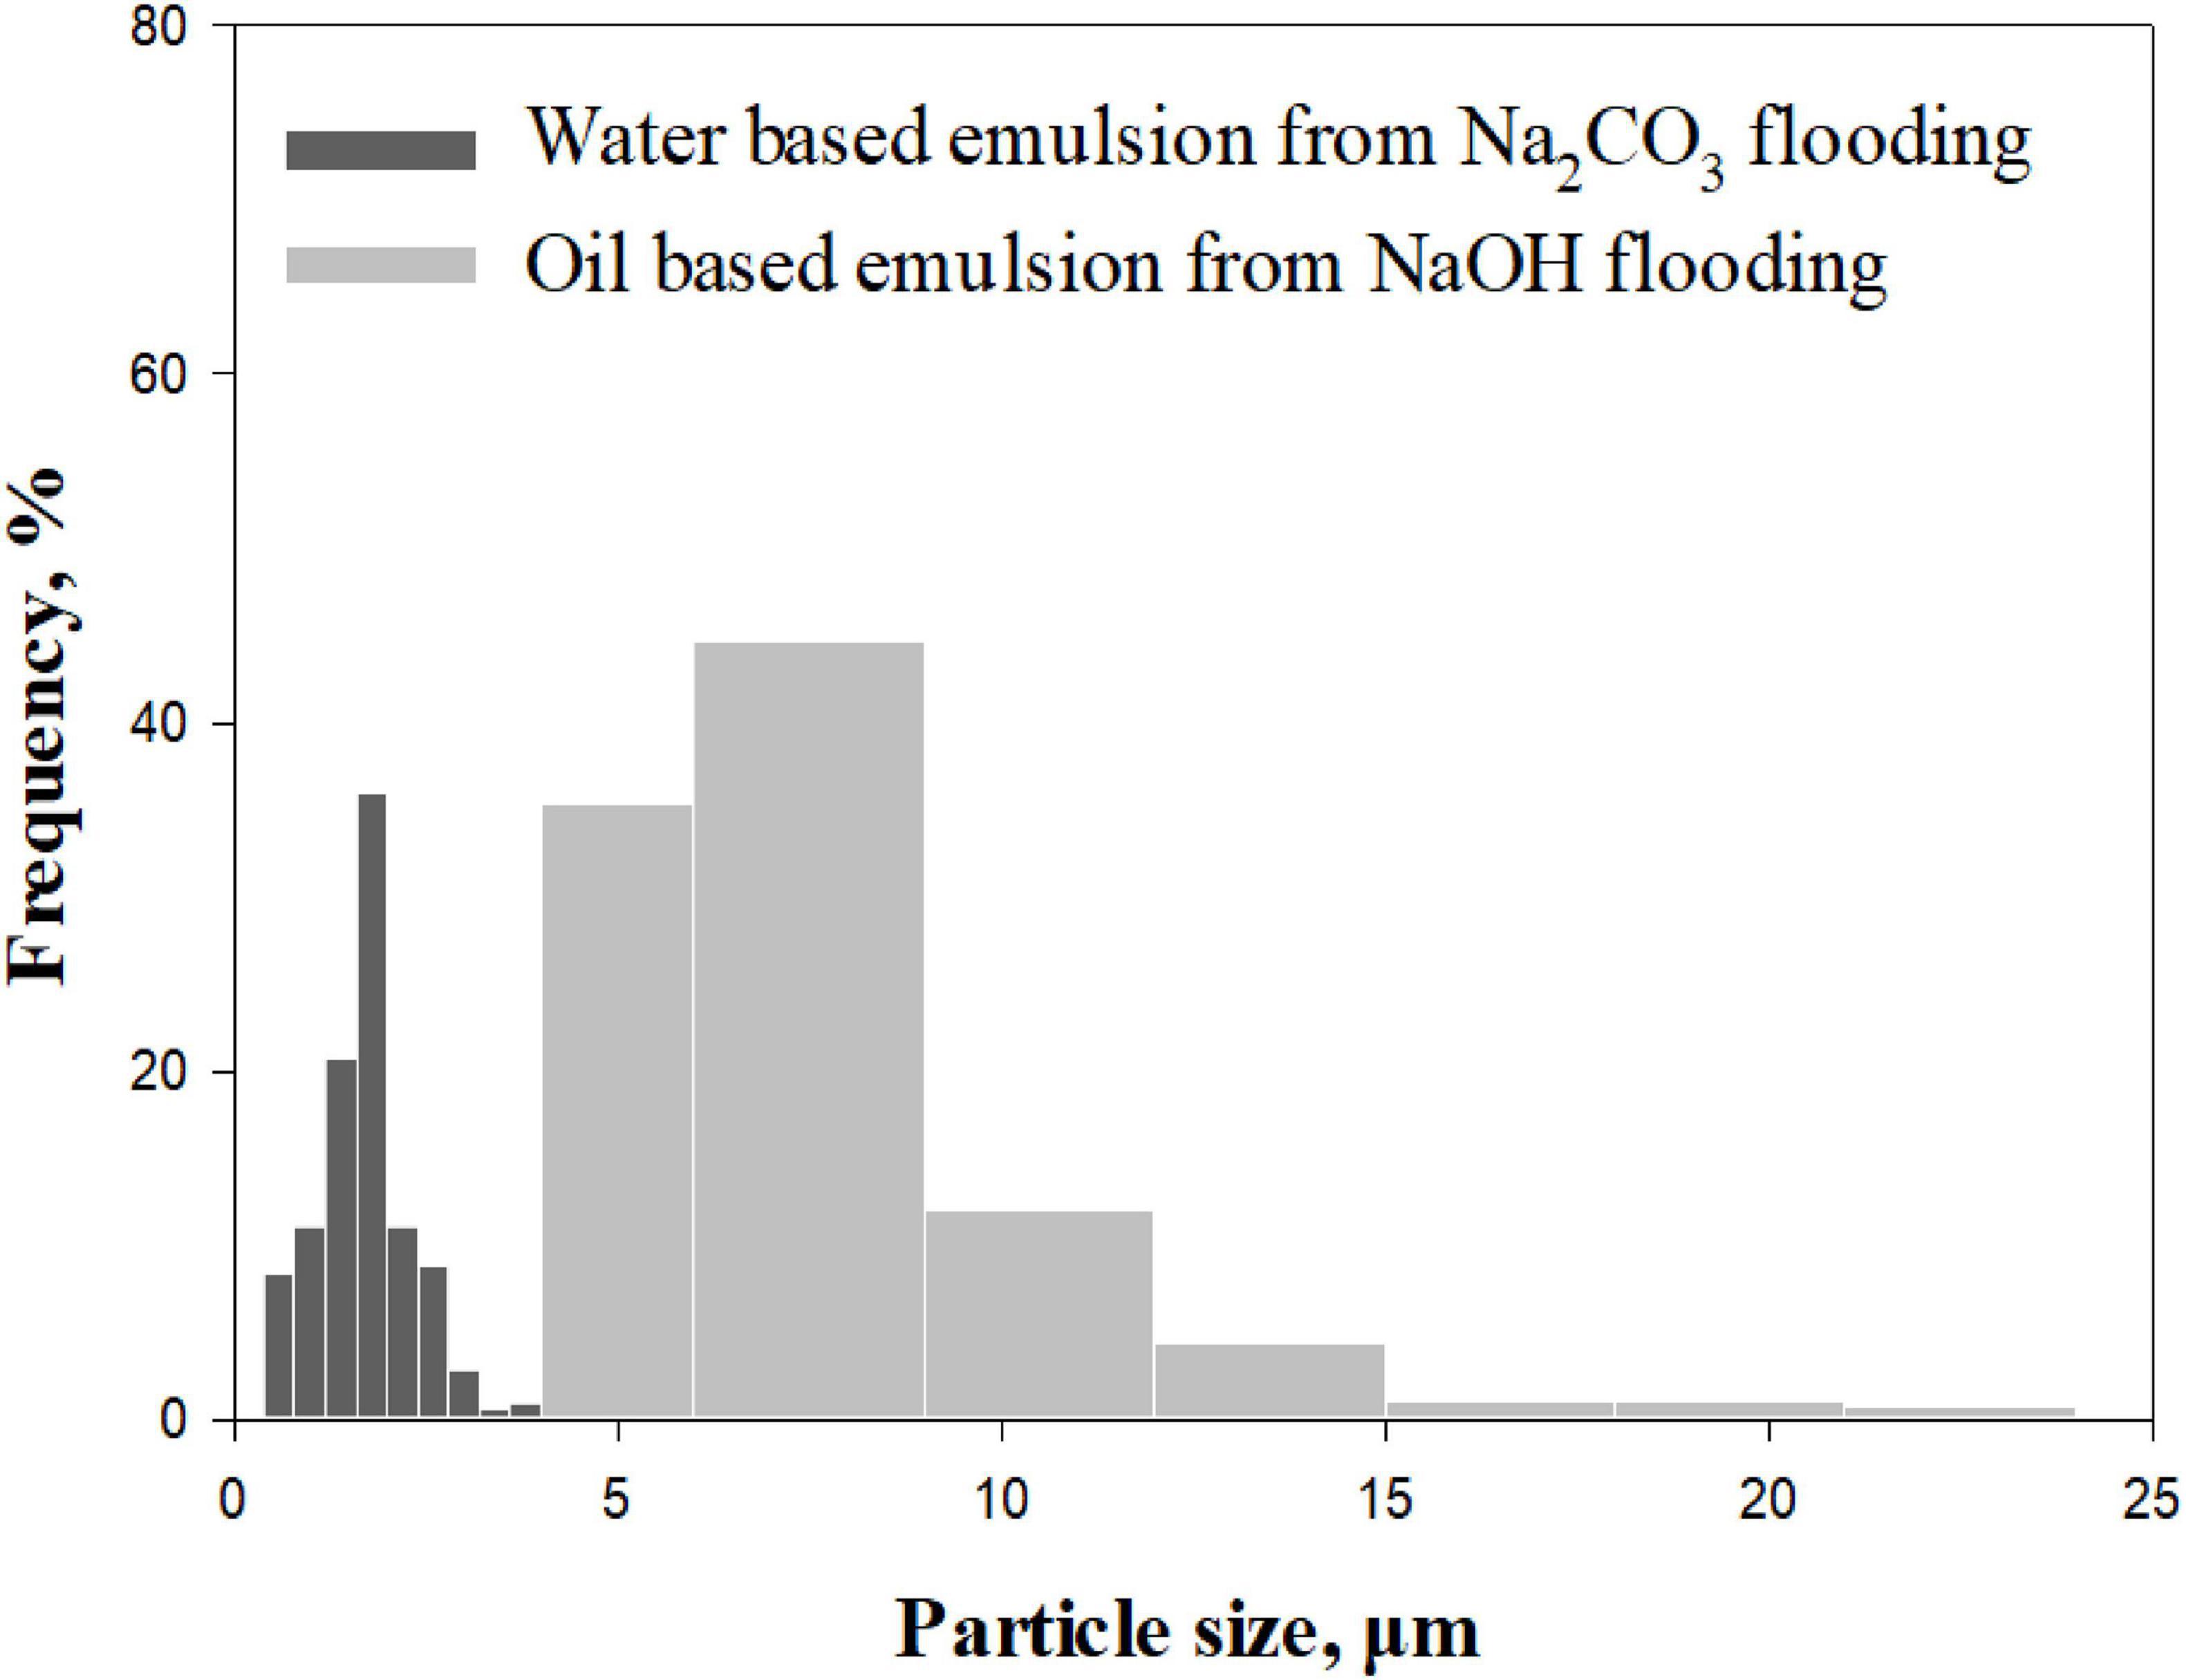
Figure 14. Emulsion particle size distribution analysis.
The overall analysis of sandpack flooding tests has provided excellent consistency in emulsion type formation with modified bottle test prediction. It is believed that if the alkali dissociation rate is fast enough to bring sufficient [OH–] group, the W/O emulsion tends to occur. Otherwise, if the alkali dissociation rate is slow, W/O emulsion still can be formed given the presence of plentiful salinity or alkaline concentration. The high concentration of weak alkali is able to compensate for its slow dissociation rate and thus achieve the similar emulsion type generation as strong alkalis. This phenomenon is also proven by the spinning drop IFT test at 70°C (Figure 15).
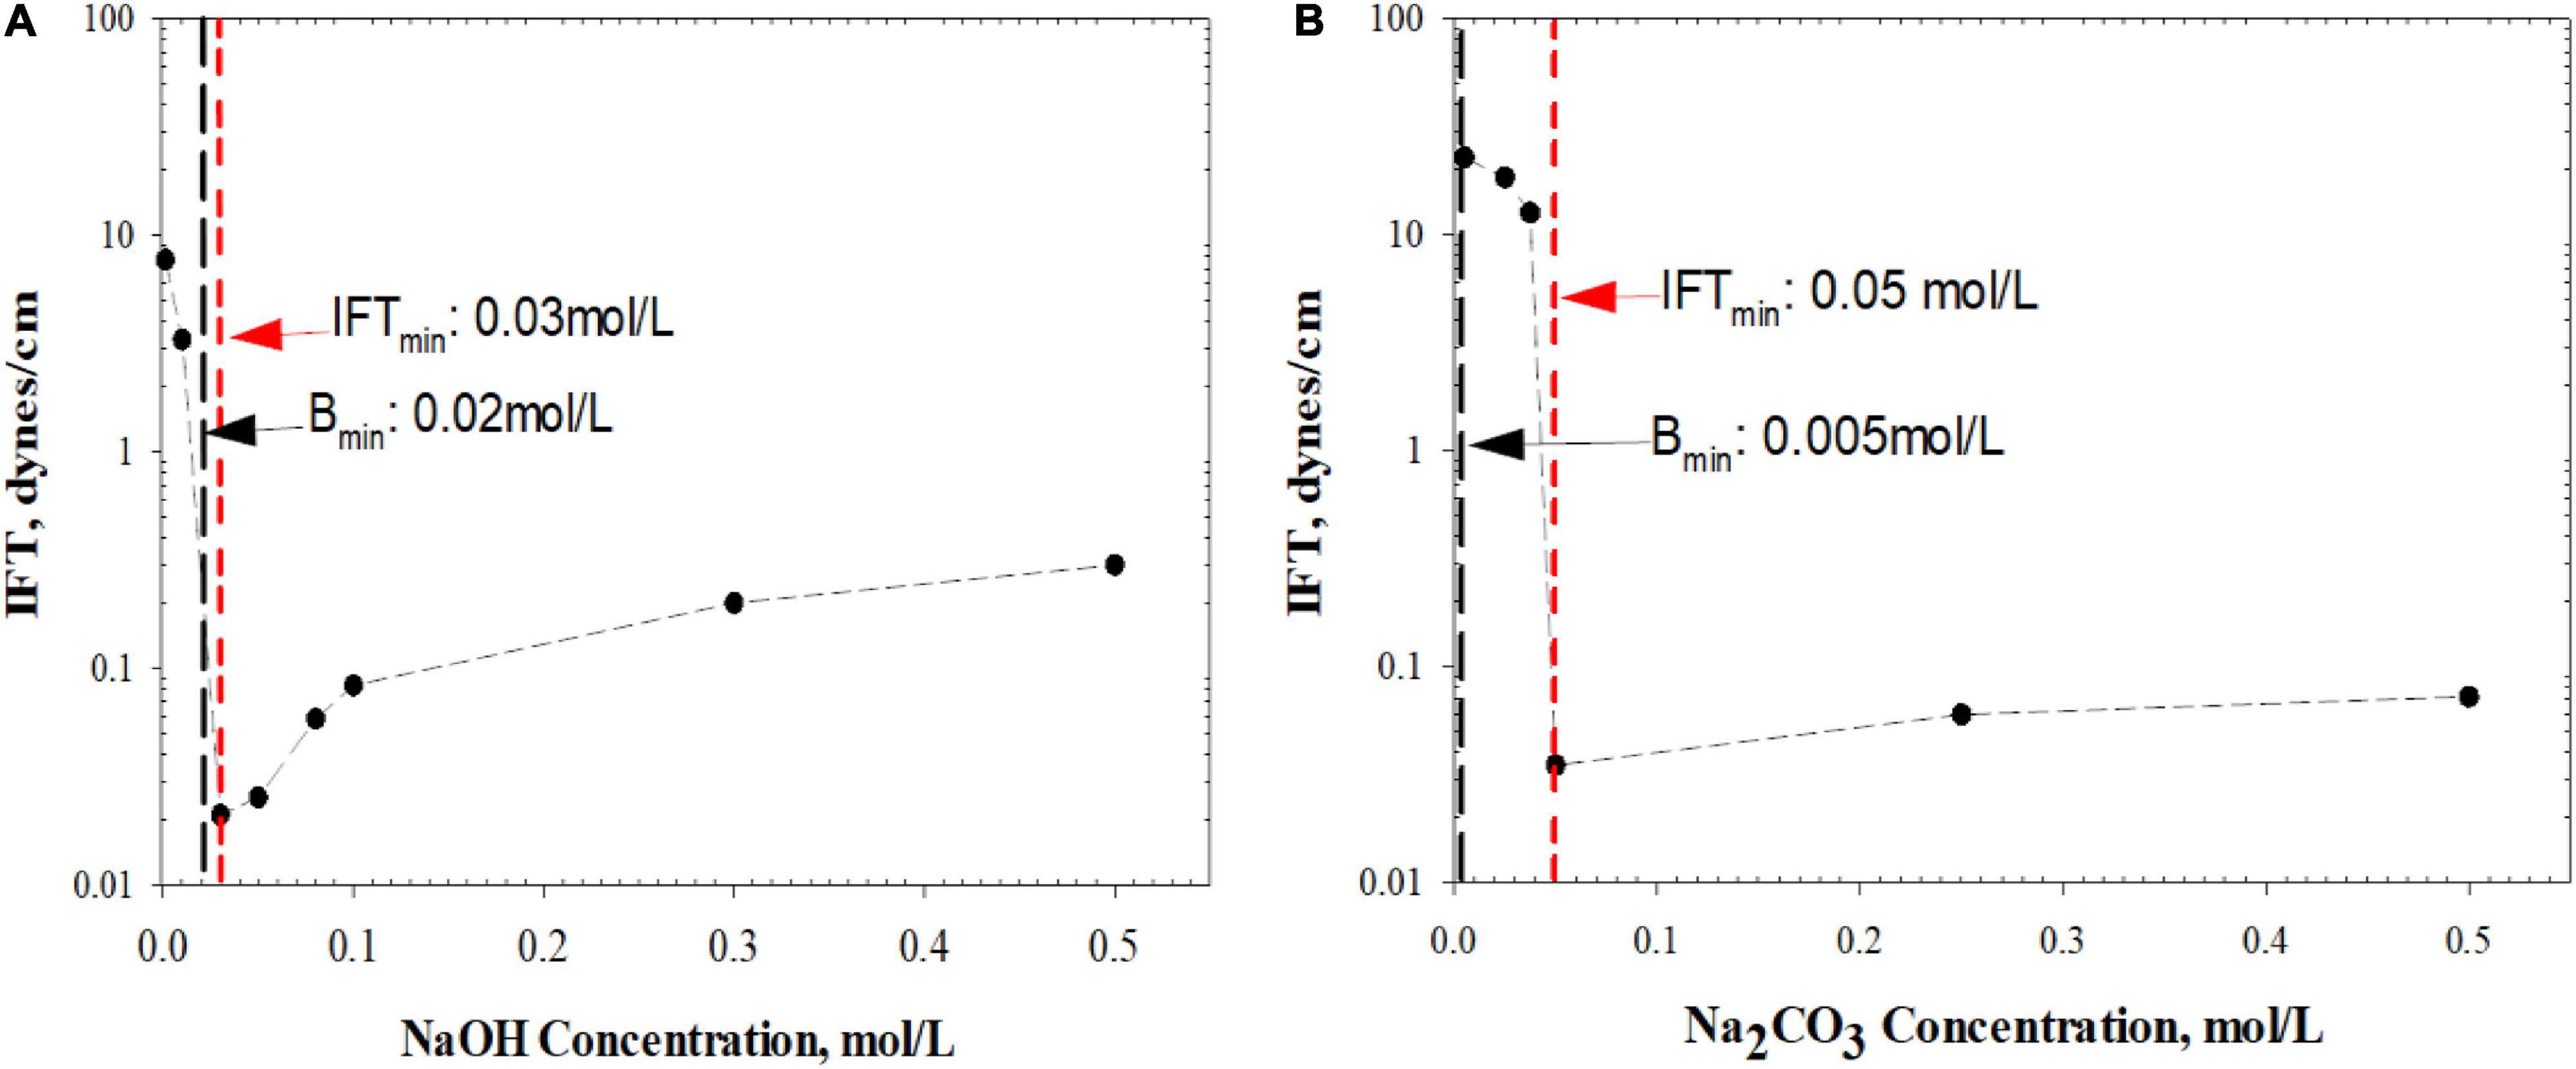
Figure 15. IFT change with increasing (A) NaOH concentration and (B) Na2CO3 concentration. Bmin: the optimum concentration of bottle test; IFTmin: the concentration induces minimum IFT.
In Figure 15A, the NaOH concentration required to reach the minimum IFT is very close to the optimum concentration obtained from modified bottle tests. On the contrary, there is a significant deviation of the two concentrations in Figure 15B for the Na2CO3 case. This is because weak alkali introduced surfactants are more hydrophilic (Sun et al., 2017) so most of them stay in the aqueous phase rather than adhering to the interface. Such a fact explains the incapability of the IFT spinning drop test to predict the optimum weak alkali concentration when O/W emulsion is dominant.
As the feasibility of conducting an orthogonal modified bottle test for accurate prediction of emulsion generation during the flooding test was approved, a trend study using a modified bottle test was conducted to further verify the phase dispersion trend under the changing control factors. 70°C operating temperature was selected in order to improve the mixing quality while salinity and alkaline concentration trend tests were applied to both NaOH and Na2CO3. For each alkaline solution, alkaline concentration trend study was conducted primarily and the salinity was kept at 0 ppm to thoroughly exclude the salinity effect. Afterward, a salinity trend test was performed on the optimum alkaline concentration determined from the previous step. Tables 10, 11 show the bottle test alkaline concentration trend study designs for NaOH and Na2CO3 solutions and the salinity trend bottle test designs are provided in Tables 12, 13. In Figure 16, the observed bottle test results are given to show the phase variation tendency with changing salinity and alkaline concentration.
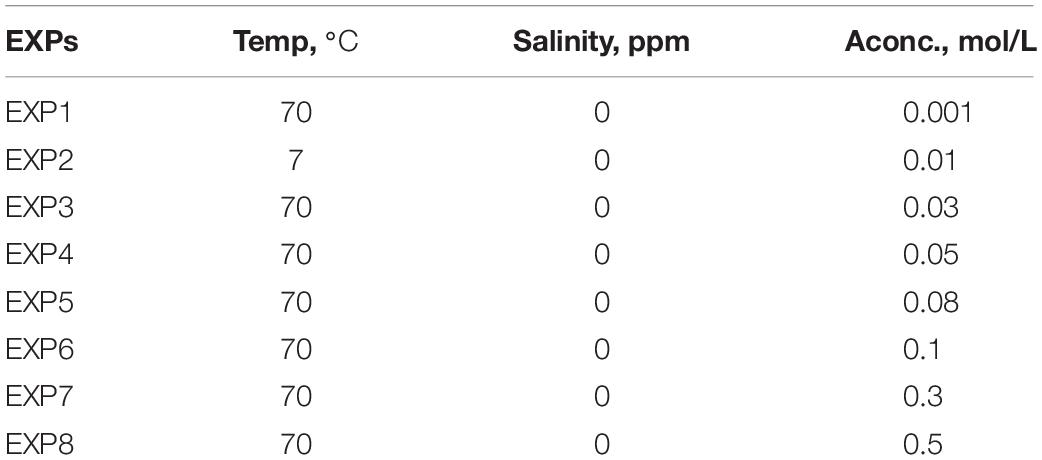
Table 10. NaOH concentration trend study experiment design.
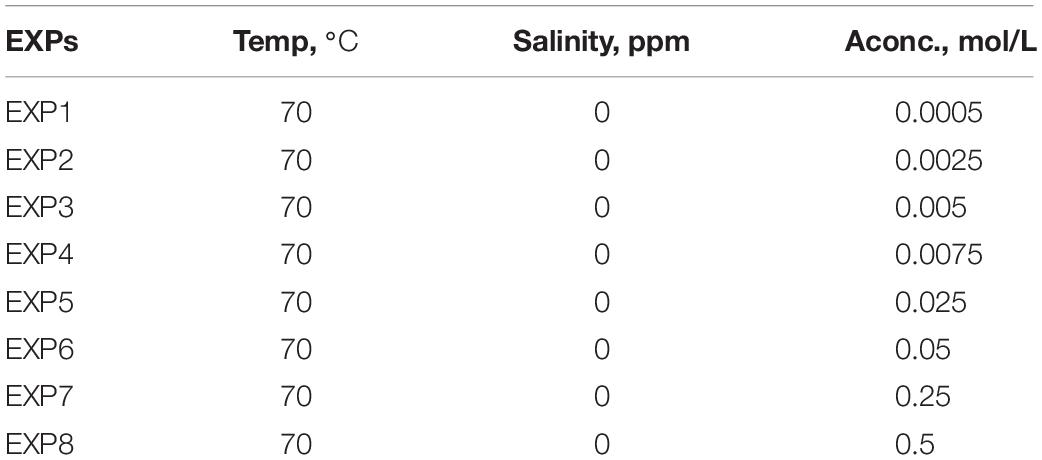
Table 11. Na2CO3 concentration trend study experiment design.
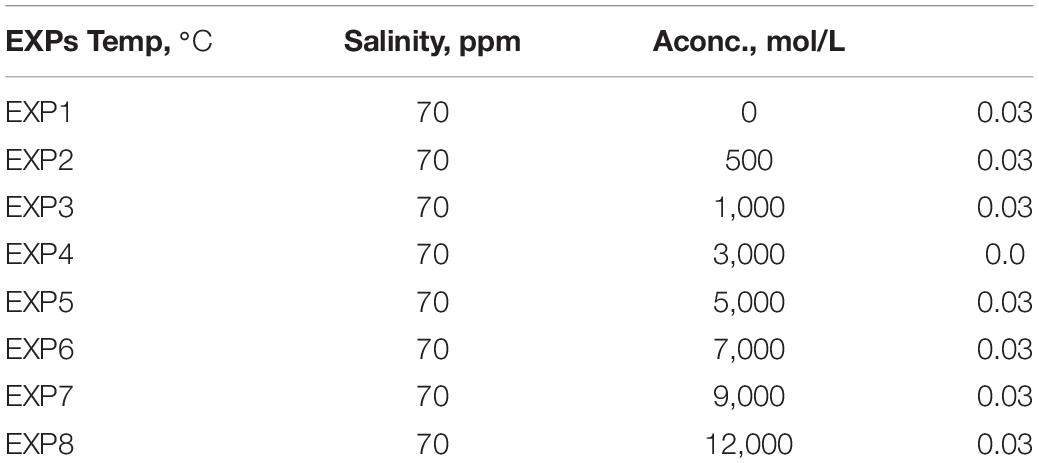
Table 12. NaOH salinity trend study experiment design.
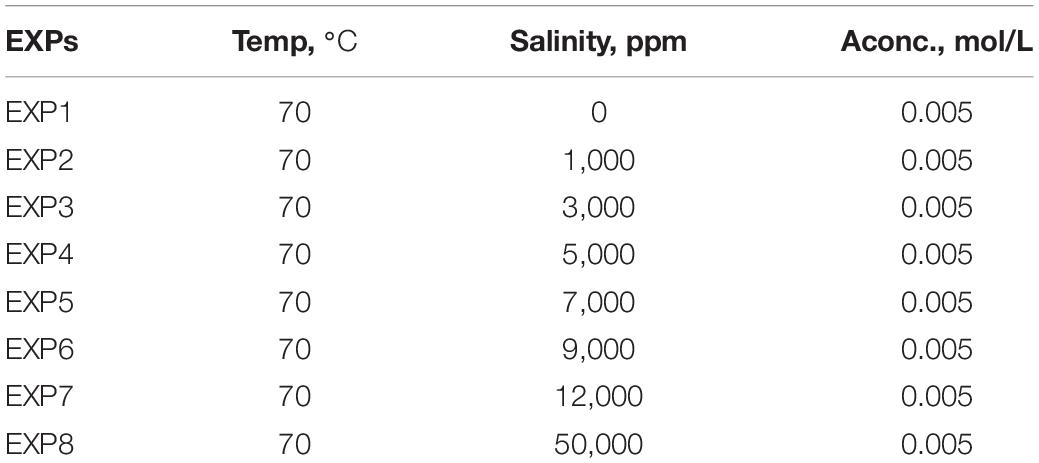
Table 13. Na2CO3 salinity trend study experiment design.
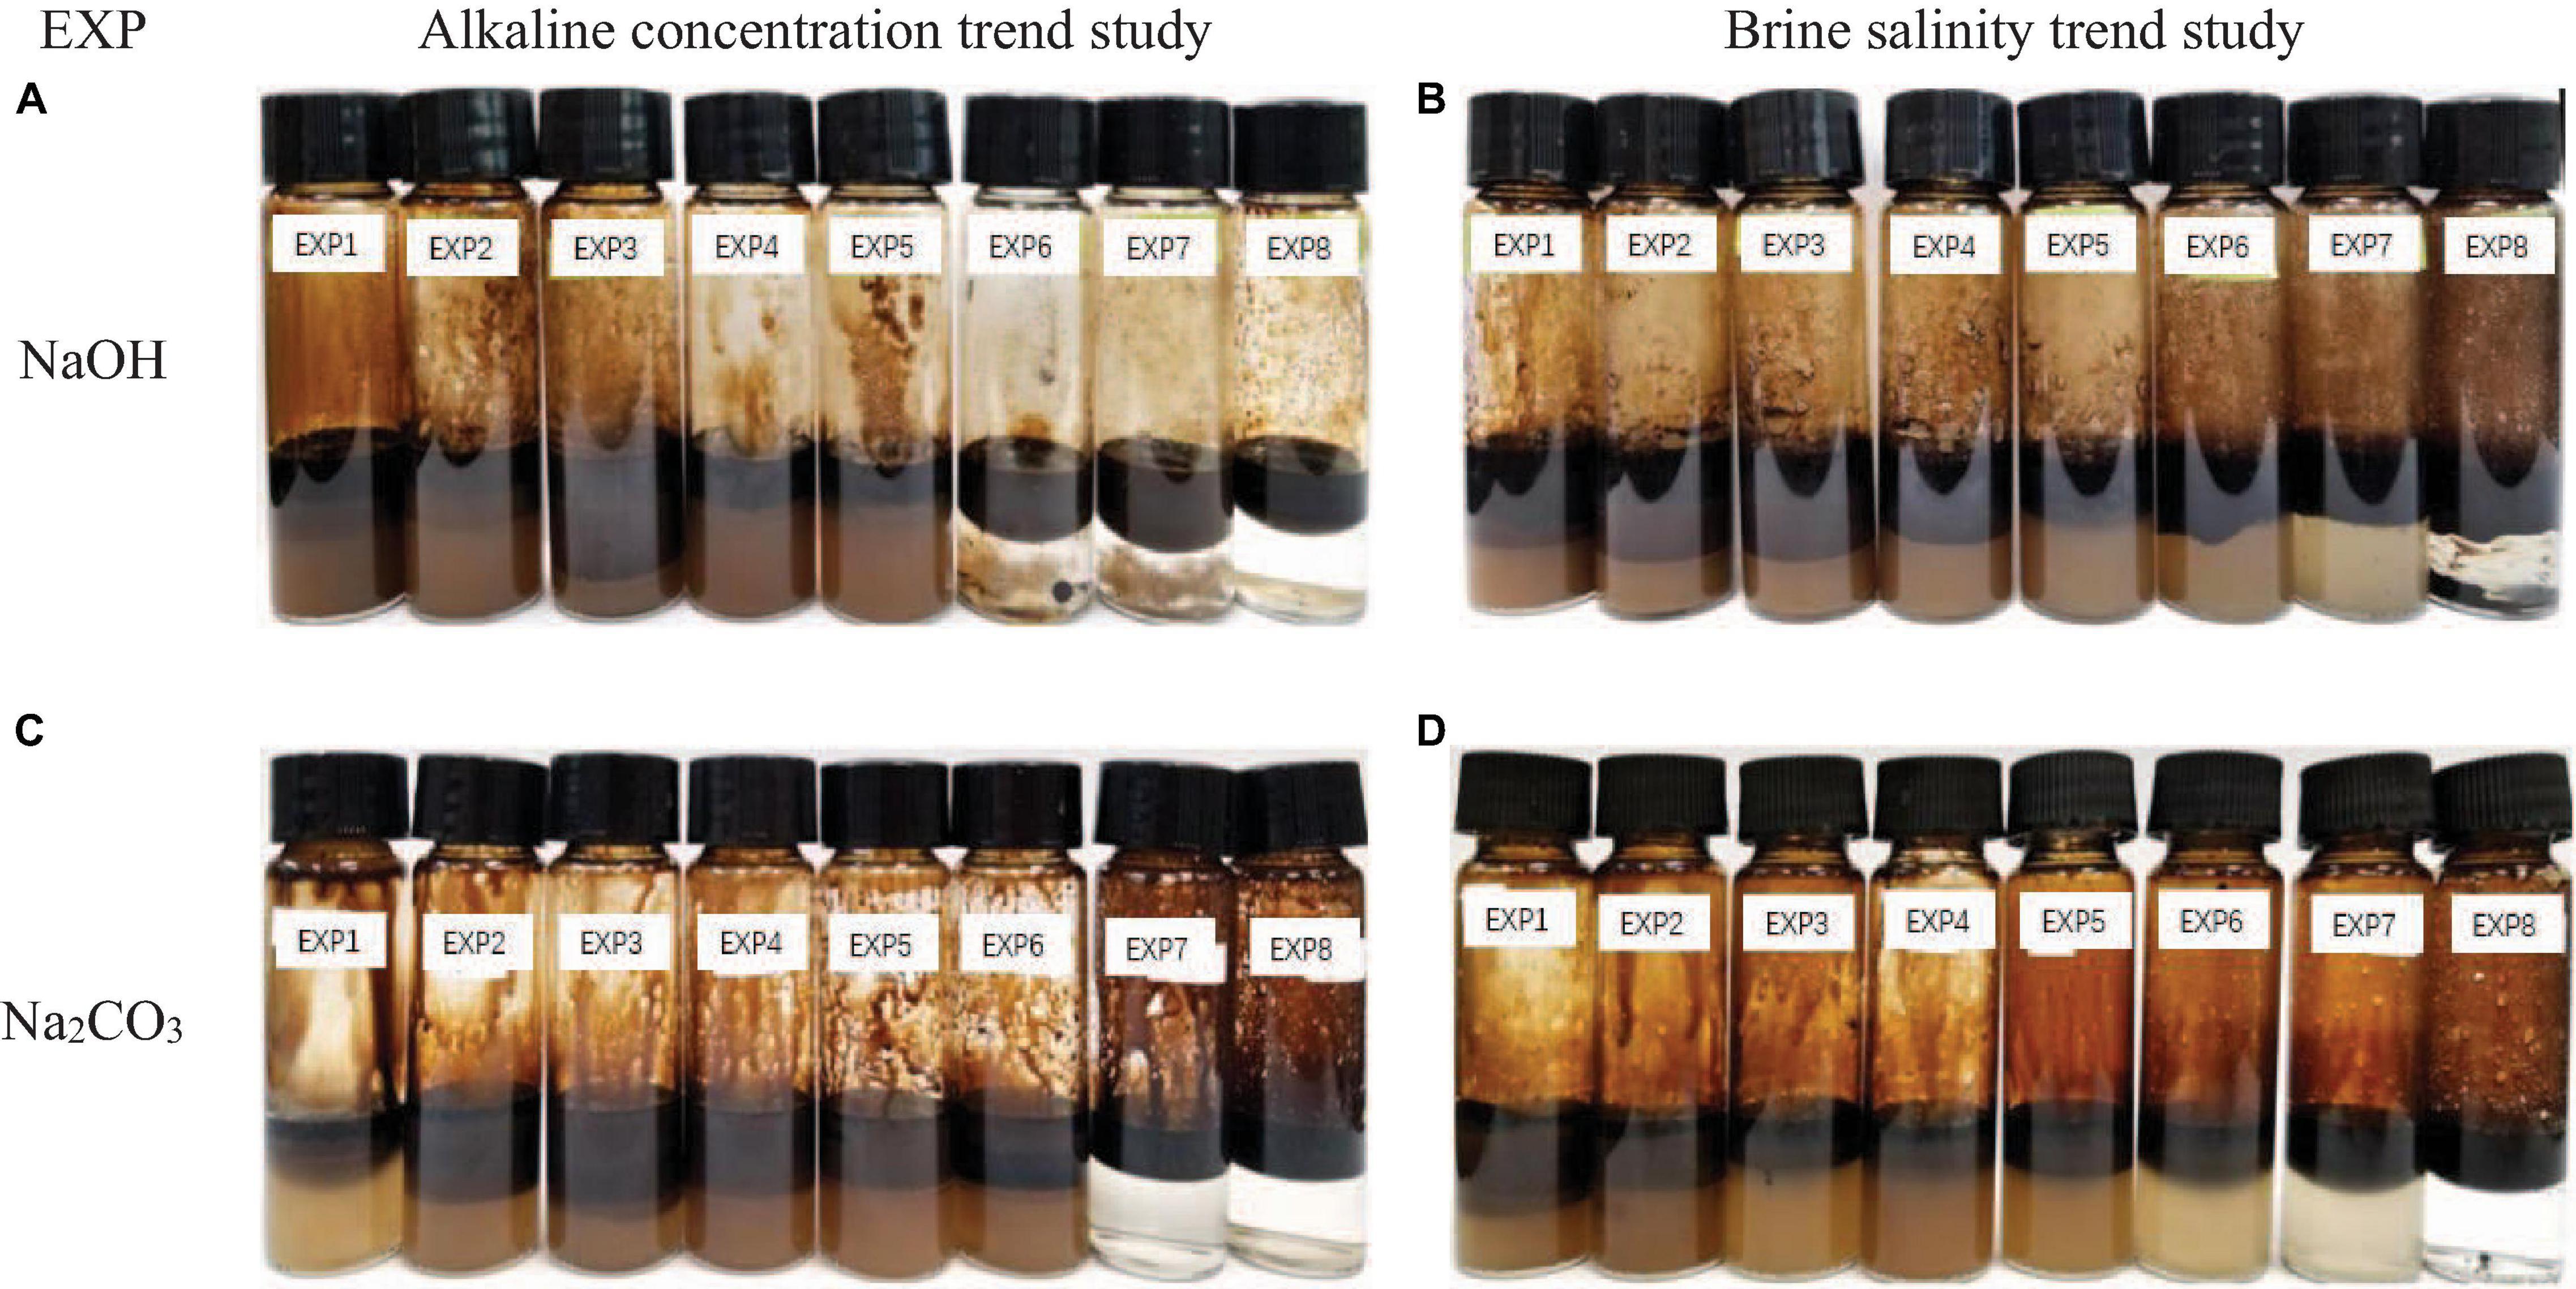
Figure 16. Bottle test trend study phases at equilibrium after 24 h. (A) NaOH concentration trend study. (B) NaOH salinity trend study. (C) Na2CO3 concentration trend study. (D) Na2CO3 salinity trend study.
Accordingly, phase volume calibration by water content data was conducted through material balance to correct the observation error. Each emulsion’s absolute volume was normalized into volume fraction in order to eliminate the natural volume difference between bottles. Therefore, the accurate emulsion type distribution can be derived in Figure 17. It can be seen that the imaged emulsion volume distribution in Figure 17 reveals a more detailed and accurate depiction of the specific emulsion type volume fraction than the visualization results shown in Figure 16, especially in W/O emulsion quantification.

Figure 17. Three phase distribution of bottle test trend study after calibration starting from: (A) NaOH concentration trend study; (B) NaOH salinity trend study; (C) Na2CO3 concentration trend study; (D) Na2CO3 salinity trend study.
Based on Figure 17, the emulsion type generation tendency under various control factors which was concluded from previous orthogonal bottle test has been proven to have a good agreement with the trend study results. For strong alkalis like NaOH, it is found W/O emulsion dominated the total emulsion generation from Figure 17A. It can also be seen that additional NaOH concentration slightly improves the water dispersion in the oil phase. In addition, the brine salinity mainly affects the oil dispersion in the water phase other than the W/O emulsion for the NaOH case as shown in Figure 17B. On the other hand, the O/W emulsion in Figure 17C was found to be the dominant emulsion type for low concentrations (< 0.005 mol/L) of Na2CO3 cases. When Na2CO3 concentration is higher than 0.005 mol/L, the oil phase dispersion was suppressed and the volume of W/O emulsion became larger. A similar trend was shown in Figure 17D as O/W emulsion quantity gradually decreased in the higher salinity system. The major emulsion type inversion was observed in Na2CO3 cases where O/W emulsion dominating system switched into W/O emulsion prevailing at high salinity and high alkaline concentration ranges. Such an emulsion type inversion was also proven through microscopic observation by Ge et al. (2012).
This research mainly focused on the feasibility study of the modified bottle test in emulsion preparation to predict major emulsion type generation during oil recovery by alkaline flooding. Through the novel sampling practice and water content measurement, the phase volume distribution of the bottle tests using different alkalis at various alkaline concentrations, salinities, and temperatures can be more accurately quantified than volume observation. The sandpack flooding tests conducted afterward verified the feasibility of the modified bottle test method as the effluent emulsion type was identical to the bottle test prediction. Considering the relationship between the driving mechanism of oil recovery by alkaline flooding and certain emulsion type generation, it will be practical to apply the modified bottle test to investigate the major emulsion type generation in order to predict the possible driving mechanisms that may occur during the alkaline flooding based on previous experience. Further study can focus on the correlation of shear energy to homogenizer rotation rate. By building the bridge between the bottle test and sandpack test, the accuracy of simulated emulsification process in the bottle test can be enhanced. Based on the current works, the following main conclusions can be drawn:
(1) Given that the huge difference between the micrometer-scale porous media and bulk oil and water phases, sufficient shear energy is vital in the preparation of representative emulsion in the bottle test.
(2) Due to the additional saponification process and complexity of in situ surfactants generation, the emulsification type and quality of different alkaline solutions are more unpredictable than artificial surfactants in regard to concentration and temperature change. By sampling individual phases from the bottle test and conducting water content measurement, a more detailed and accurate emulsion phase distribution in bottle test can be obtained that is more reliable than conventional volume observation.
(3) The modified bottle test method is able to determine the major emulsion type potentially to be produced in flooding test and thus the outcome can be used to predict the related driving mechanism of the alkaline flooding based on previous experience. This modified method is especially suitable for cases when high viscous heavy oil is involved.
(4) In respect of the driving mechanism study and prediction of alkaline flooding performance in oil recovery, the modified bottle test method is relatively more convenient and time-saving than the sandpack flooding test. Designed orthogonal experiments can be quickly conducted through bottle test and obtain emulsification tendency under various control factors.
(5) The modified bottle test provided acceptable results for both strong and weak alkalis to show its adaptability. Other alkali or salt types can also be tested following a similar methodology to expand the modified bottle test application.
The original contributions presented in the study are included in the article/supplementary material, further inquiries can be directed to the corresponding author/s.
ZX: methodology, investigation, formal analysis, data collection, processing, and writing original draft. NJ: conceptualization, validation, resources, writing–review and editing, supervision, funding acquisition, and project administration. ES: resources and validation. All authors contributed to the article and approved the submitted version.
The authors declare that the research was conducted in the absence of any commercial or financial relationships that could be construed as a potential conflict of interest.
We would like to thank the financial support for this project from Petroleum Technology Research Centre (PTRC) and Mitacs Accelerate Program. We also acknowledge the permission of CNRL and Husky to publish the experiment’s data and results. Mr. Tian Jian’s constructive suggestions in manuscript writing are highly appreciated as well.
Acevedo, S., Escobar, G., Gutiérrez, L., and Rivas, H. (1992). Isolation and characterization of natural surfactants from extra heavy crude oils, asphaltenes and maltenes. Interpretation of their interfacial tension-pH behaviour in terms of ion pair formation. Fuel 71, 619–623. doi: 10.1016/0016-2361(92)90163-i
Acevedo, S., Gutierrez, X., and Rivas, H. (2001). Bitumen-in-water emulsions stabilized with natural surfactants. J. Colloid Interface Sci. 242, 230–238. doi: 10.1006/jcis.2001.7728
Aminzadeh, B., Hoang, V., Inouye, A., Izgec, O., Walker, D., Chung, D., et al. (2016). “Improving recovery of a viscous oil using optimized emulsion viscosity,” in Proceedings of the SPE Improved Oil Recovery Conference, Tulsa, OK.
Arhuoma, M., Dong, M., Yang, D., and Idem, R. (2009). Determination of water-in-oil emulsion viscosity in porous media. Indust. Eng. Chem. Res. 48, 7092–7102. doi: 10.1021/ie801818n
Ashrafizadeh, S., Motaee, E., and Hoshyargar, V. (2012). Emulsification of heavy crude oil in water by natural surfactants. J. Pet. Sci. Eng. 86-87, 137–143. doi: 10.1016/j.petrol.2012.03.026
Athreya, S., and Venkatesh, Y. D. (2012). Application of taguchi method for optimization of process parameters in improving the surface roughness of lathe facing operation. Intl. Refereed J. Eng. Sci. 1, 13–19.
Baek, K. H., Argüelles-Vivas, F. J., Okuno, R., Sheng, K., Sharma, H., and Weerasooriya, U. P. (2018). “Organic alkali as a steam additive for improved sagd: experimental study of emulsion phase behavior and viscosity,” in Proceedings of the SPE Canada Heavy Oil Technical Conference, Calgary, ALB.
Bryan, J. L., and Kantzas, A. (2007). “Enhanced heavy-oil recovery by alkali-surfactant flooding,” in Proceedings of the SPE Annual Technical Conference and Exhibition, Anaheim, CA.
Castor, T. P., Somerton, W. H., and Kelly, J. F. (1981). “Recovery Mechanisms of Alkaline Flooding,” in Surface Phenomena in Enhanced Oil Recovery, ed. D. O. Shah (Boston, MA: Springer), 249–291. doi: 10.1007/978-1-4757-0337-5_14
Chhabra, R. P., and Richardson, J. F. (2008). “Chapter 8 - Liquid mixing,” in Non-Newtonian Flow and Applied Rheology Engineering Applications, 2nd Edn, Amsterdam: Butterworth-Heinemann/Elsevier.
Cooke, C., Williams, R., and Kolodzie, P. (1974). Oil recovery by alkaline waterflooding. J. Pet. Technol. 26, 1365–1374. doi: 10.2118/4739-pa
Dehghan, A. A., Masihi, M., and Ayatollahi, S. (2013). Evaluation of chemicals interaction with heavy crude oil through water/oil emulsion and interfacial tension study. Energy Fuels 27, 5852–5860. doi: 10.1021/ef401361t
Ding, B., Zhang, G., Ge, J., and Liu, X. (2010). Research on mechanisms of alkaline flooding for heavy oil. Energy Fuels 24, 6346–6352. doi: 10.1021/ef100849u
Dong, M., Liu, Q., and Li, A. (2012). Displacement mechanisms of enhanced heavy oil recovery by alkaline flooding in a micromodel. Particuology 10, 298–305. doi: 10.1016/j.partic.2011.09.008
Fan, D. Y., and Chen, Y. H. (1996). Probability Theory and Mathematical Statistics. China: Zhejiang University Press, 215.
Ge, J., Feng, A., Zhang, G., Jiang, P., Pei, H., Li, R., et al. (2012). Study of the factors influencing alkaline flooding in heavy-oil reservoirs. Energy Fuels 26, 2875–2882. doi: 10.1021/ef3000906
Isaacs, E. E., and Chow, R. S. (1992). “Practical aspects of emulsion stability,” in Emulsions Fundamentals and Applications in the Petroleum Industry, ed. L. L. Schramm (Washington, DC: American Chemical Society), 51–77. doi: 10.1021/ba-1992-0231.ch002
Johnson, C. (1976). Status of caustic and emulsion methods. J. Pet. Technol. 28, 85–92. doi: 10.2118/5561-pa
Karnanda, W., Benzagouta, M. S., AlQuraishi, A., and Amro, M. M. (2012). Effect of temperature, pressure, salinity, and surfactant concentration on IFT for surfactant flooding optimization. Arab. J. Geosci. 6, 3535–3544. doi: 10.1007/s12517-012-0605-7
Kokal, S., and Abdulaziz, A. (2010). “Enhanced oil recovery: challenges and opportunities,” in World Petroleum Council: Official Publication 2010 (Global Energy Solutions), 64–69.
Nelson, R., Lawson, J., Thigpen, D., and Stegemeier, G. (1984). “Cosurfactant-enhanced alkaline flooding,” in Proceedings of SPE Enhanced Oil Recovery Symposium, Tulsa, Ok.
Panthi, K., and Mohanty, K. K. (2013). Effect of alkaline preflush in an alkaline-surfactant-polymer flood. Energy Fuels 27, 764–771. doi: 10.1021/ef301847z
Pei, H., Zhang, G., Ge, J., Tang, M., and Zheng, Y. (2012). Comparative effectiveness of alkaline flooding and alkaline–surfactant flooding for improved heavy-oil recovery. Energy Fuels 26, 2911–2919. doi: 10.1021/ef300206u
Reardon, E. J. (1976). Dissociation constants for alkali earth and sodium borate ion pairs from 10 to 50∘C. Chem. Geol. 18, 309–325. doi: 10.1016/0009-2541(76)90013-9
Rivas, H., Gutierrez, X., Zirrit, J. L., Anto’n, R. E., and Salager, J. L. (1997). “Microemulsion and optimum formulation occurrence in PH dependent systems as found in alkaline enhanced oil recovery,” in Industrial Applications of Microemulsions, eds C. Solans and H. Kunieda (New York, NY: M. Dekker), 305–329.
Sun, J., Sun, L., Liu, W., Liu, X., Li, X., and Shen, Q. (2008). Alkaline consumption mechanisms by crude oil: a comparison of sodium carbonate and sodium hydroxide. Colloids Surf. A 315, 38–43. doi: 10.1016/j.colsurfa.2007.07.009
Sun, N., Jing, J., Jiang, H., An, Y., Wu, C., Zheng, S., et al. (2017). Effects of surfactants and alkalis on the stability of heavy-oil-in-water emulsions. SPE J. 22, 120–129. doi: 10.2118/181742-pa
Wang, J., Dong, M., and Arhuoma, M. (2010). Experimental and numerical study of improving heavy oil recovery by alkaline flooding in sandpacks. J. Can. Pet. Technol. 49, 51–57. doi: 10.2118/134248-pa
Xu, B., Kang, W., Wang, X., and Meng, L. (2013). Influence of water content and temperature on stability of W/O crude oil emulsion. Pet. Sci. Technol. 31, 1099–1108. doi: 10.1080/10916466.2010.551812
Keywords: heavy oil, alkaline flooding, emulsion characterization, in situ surfactant, sandpack flooding, bottle test
Citation: Xi Z, Jia N and Shirif E (2021) Emulsion Characterization of the Heavy Oil-Alkaline Water System in Alkaline Flooding Mechanism Investigation Using a Combination of Modified Bottle Test and Sandpack Flooding. Front. Energy Res. 9:600676. doi: 10.3389/fenrg.2021.600676
Received: 30 August 2020; Accepted: 26 February 2021;
Published: 18 March 2021.
Edited by:
Wei Yu, University of Texas at Austin, United StatesReviewed by:
Xiaohu Dong, China University of Petroleum, ChinaCopyright © 2021 Xi, Jia and Shirif. This is an open-access article distributed under the terms of the Creative Commons Attribution License (CC BY). The use, distribution or reproduction in other forums is permitted, provided the original author(s) and the copyright owner(s) are credited and that the original publication in this journal is cited, in accordance with accepted academic practice. No use, distribution or reproduction is permitted which does not comply with these terms.
*Correspondence: Na Jia, TmEuSmlhQHVyZWdpYW4uY2E=; amlhX25hNzZAaG90bWFpbC5jb20=
Disclaimer: All claims expressed in this article are solely those of the authors and do not necessarily represent those of their affiliated organizations, or those of the publisher, the editors and the reviewers. Any product that may be evaluated in this article or claim that may be made by its manufacturer is not guaranteed or endorsed by the publisher.
Research integrity at Frontiers
Learn more about the work of our research integrity team to safeguard the quality of each article we publish.