 Mohammed Sharaf Shaiban
 Di Li
Di Li Akram S. Hasanov3
94% of researchers rate our articles as excellent or good
Learn more about the work of our research integrity team to safeguard the quality of each article we publish.
Find out more
ORIGINAL RESEARCH article
Front. Energy Res. , 12 October 2021
Sec. Sustainable Energy Systems
Volume 9 - 2021 | https://doi.org/10.3389/fenrg.2021.595060
This article is part of the Research Topic Energy Economics and Energy Finance in Developing and Emerging Countries View all 9 articles
Oil price shocks harm real output and bank and industrial profit in most oil-importing countries, which has motivated us to investigate the impact of these shocks on the equity performance of banking industries. To fulfill the research objectives, we involve a sample of developed and emerging economies for comparison purposes. The objective of employing the Toda and Yamamoto (Journal of econometrics, 1995, 66 (1), 225–250) causality test is to explore the time-variant relationship between oil prices and banking indices to investigate how oil price shocks affect the performance of country-specific banking industries. In addition, an impulse response function and variance decomposition analysis are utilized to, respectively, examine the time-variant relationship between oil price shocks and macroeconomic factors and the performance of the banking sector. Results vary across different economies in our sample, but the magnitude of oil price impact is relatively significant in the US, the UK, Canada, Japan, Mexico, and Brazil. The findings indicate that oil price rises adversely affect equity bank indices in developed and emerging economics except for Mexico. Notably, our findings show that oil prices and interest rates jointly have significant power in explaining the banking equity variation and suggest that international bank portfolio investors should consider hedging oil price risk.
The business connection between the equity market, especially for the banking sector and oil industries, has placed commercial banks in a vulnerable position when facing oil price shocks. Wells Fargo, the third-largest bank in the US, has a total amount of $ 42 billion exposure to the oil and gas industry in 2016, including a $ 17.8 billion energy-loan book. In addition, a stress test conducted by Jefferies documents that major European large banks, such as Standard Chartered and HSBC, would take a hit at no less than 1.3 and 1 billion, respectively.1 In line with Jefferies, Bernstein Research has estimated that the combined losses of Barclays, RBS, HSBC, and Standard Chartered from falling oil prices could amount to $ 3.4 billion.2 Thus, the abovementioned reports explicitly suggest that there is a direct impact of oil price shocks on bank profitability through oil-related loan lending. On the other hand, oil prices impose an indirect influence on the economy. For major emerging oil-exporting countries, plumed oil price hinders fiscal spending, which, in turn, jeopardizes corporate and bank performance. In addition, high oil price motivates the expansion of productive capacity of oil-exporting countries with uprising public and private investment. For oil-importing countries, high oil price potentially enhances the consumer price index followed by potential interest rate adjustment, which transmits the impact on the banking industry. These economic phenomena drive our motivation to explore the time-variant relationship between macroeconomic fluctuation, oil price return, and the performance of the banking industry.
Nonetheless, the existing literature focuses on the transitional impact between macroeconomics, oil price fluctuation, and bank index returns. Moreover, a larger body of literature focuses on the linkage between oil prices and macroeconomic factors, which furnish evidence that mainly emphasizes the influence of oil price on macroeconomic changes (e.g., Hamilton, 1983; Burbidge and Harrison, 1984; Gisser and Goodwin, 1986; MA Hooker 1996; Ferderer, 1997; Ciner 2001; Mussa, 2000; Jones et al., 2004).3 Another strand of literature discusses the response of industrial equity return to oil price shocks and shows that the relationship between oil price changes and industrial returns varies across different industries (Huang et al., 1996; Boyer and Filion 2007; McSweeney and Worthington, 2008; Nandha and Faff, 2008). Generally, the findings of this batch of the literature suggest that industries associated with energy are positively sensitive to oil price changes.
Additionally, a considerable thread of literature mainly stresses the influence of macroeconomic uncertainty on bank operations. For example, Baum et al. (2009) and Quagliariello (2009) examine how macroeconomic shocks affect bank signals about expected returns. The main theoretical framework that backs their study argues that macroeconomic uncertainty is the obstacle for banks to foresee further investment opportunities. Additional studies, in a similar vein, reinforce that macroeconomic circumstances impose an impact on the performance of the banking industry (e.g., Salas and Saurina (2002); Qualiariello 2007; Pesola (2001); Bikker and Hu (2012); Laeven and Majnoni (2003); Valckx (2003); Gambera (2000) and Meyer and Yeager (2001); Carruth et al. (2000); Garcia and Calmes (2005).
Overall, the abovementioned literature suggests that the potential linkage between oil price shocks and the performance of the banking sector starts with the macroeconomic recession that generates a negative impact on the banking sector. To our best knowledge, the work of Hesse and Poghosyan (2016) represents the pioneering study that investigates the association between oil prices and bank profitability in major oil-exporting countries in the Middle East and North Africa. They conduct a panel analysis consisting of 145 banks in 11 oil-exporting countries from 1994 to 2008 and conclude that oil price shocks have an indirect effect on bank profitability when country-specific macroeconomic and institutional variables are added to the analysis. In addition, they specifically illustrate that the profitability of investment banks is more sensitive to oil price fluctuation because investment banks benefit the most from the boost in economic activities, such as fee income, the launch of new investment projects, and their ability to adjust their liquidity positions via wholesale funding market. This investigation is motivated by Hesse and Poghosyan (2016) who explored the dynamic relationship between oil price shocks and banking industry performance proxied by banking indices. Nevertheless, there are several puzzling points inspired by Hesse and Poghosyan (2016). First, Hesse and Poghosyan (2016) detect solely the contemporary oil–bank relationship. Still, is it possible that the oil–bank relationship can be time-variant? Second, as previously mentioned, the banking industry can jointly be affected by oil price fluctuation and macroeconomic variation. Therefore, which factor, oil prices or macroeconomic, can better explain the variation of banking equity indices?
To search for the answers of the above-mentioned questions, we utilize the Toda and Yamamoto causality test (TY approach, hereafter) to detect the dynamic association. In our study, we include WTI, Brent and Dubai oil price, macroeconomic factors consisting of industry production, interest rates, and CPI, and banking indices to analyze the time-variant relationship between oil price shocks and country-specific banking industry performance in the US, the UK, Canada, Japan, Mexico, Malaysia, and Brazil. In addition, the TY approach permits the generation of variance decomposition that report the explanatory power of oil price shocks to banking performance. Eventually, we compare the influence of oil price shocks with macroeconomic factors in terms of the relative explanatory power.
Our study contributes to the extant literature on energy economics from at least three perspectives. First, we employ an impulse response function that presents the time-variant response of banking indices to oil price shocks. Results vary in different countries. Interestingly, US banking performance is sensitive to oil price shocks. Additionally, a significant response of the Canadian banking index to oil price shocks is detected. Nevertheless, the time-variant relationship between bank indices and oil price fluctuation is insignificant in Mexico, Malaysia, and Brazil. Overall, to our best knowledge, our study is an attempt to venture into this unexplored area of the time-variant relationship between oil prices and bank performance using variance decomposition analysis. Second, this study investigates the dynamic relationship between banking sector performance to macroeconomic fluctuations. Moreover, interest rate changes, as a vita macroeconomic factor, are rarely modeled in bank activities and macroeconomic uncertainty literature. The magnitudes of the response of banking indices to specific macroeconomic factors vary across countries. It is noteworthy to mention that the banking sector is evidenced to be sensitive to interest rate fluctuations in this study.
Attentively, our findings illustrate that Dubai oil shocks have the strongest explanatory power in comparison to WTI and Brent oil prices in the US. Of all the macroeconomic factors, interest rate variation contributes to the highest percentage of the variance of banking performance except for the Brazilian banking sector. The plausible explanation of the contribution of interest rate to bank equity indices is that the liquidity mismatch problem can be worsened by the variation of interest rate risk due to the differential maturities of deposits and loans, which potentially enhances the risk of bank insolvency (Bai et al., 2018). Further findings have suggested that even if the relationship between oil price shocks and banking sector performance is statistically insignificant, oil price shocks capture a reasonably high percentage of banking indices variation in Mexico and Brazil. Hence, our results based on the time-series analysis suggest further exploration in this area, especially in Mexico and Brazil markets.
This study is structured as follows. Section two presents the literature review on oil prices, macroeconomic factors and bank operation’s response to oil price shocks. Section three discusses the methodology, data sample, and country selection. Section four illustrates the results of the unit root tests, impulse response function, and variance decomposition. Section five concludes this article.
Hamilton (1983) and Gisser and Goodwin (1986) indicate that oil price shocks have an adverse impact on the macroeconomy and might even be a cause of an economic recession. However, the empirical findings of MA (Hooker, 1996) document that the significance of oil’s impact on the economy seems to have dramatically decreased and challenged the theoretical assumptions proposed by Hamilton (1983). On the contrary, several studies empirically support the argument of Hamilton (1983). Ferderer (1997) conclude that oil price volatility, measured by the monthly standard deviation of daily oil prices, helps to forecast aggregate output movements in the U.S. Jones et al. (2004) report that oil price shocks appear to be a major contributor to post-oil-price sock recessions, and the magnitude of the effect that an oil price shock has on GDP is approximately −0.06 in terms of elasticity. In addition to Jones et al. (2004), Mussa (2000) indicate that an increase of $5 per barrel in the oil price is likely to reduce the level of global output by approximately 25 basis points over the first 4 years, which supports the detrimental impact of oil price on the global economy.
Huang et al. (1996) utilize the relationship between the daily U.S. stock returns and oil-futures returns and find evidence that oil-futures returns positively lead individual oil company and petroleum industry stock returns but do not have much influence on other industry indices or the aggregate S&P 500 index. Faff and Brailsford (1999) examine the sensitivity of the Australian industry equity returns to oil price changes and suggest that oil is an important factor in the industry-based return generating process in Australia and that the direction and magnitude of oil shock sensitivity are of an industry-specific nature. Boyer and Filion (2007) analyze the sensitivity of Canadian oil and gas companies to market-based factors, namely, market return, interest rates, the exchange rate, oil prices and natural gas prices, and fundamental factors, including fluctuations in proven reserves, the volume of production, debt level, operational cash flows, and drilling success. The authors find that market return, appreciation of crude oil, and natural gas prices are positively associated with Canadian oil and gas company stock returns, while interest rates, production volume, and depreciation of Canadian dollar against US dollar are negatively related to stock returns. Nandha and Faff (2008) analyze 35 DataStream global industry indices from 1983 to 2005 and indicate that oil price rises hurt equity returns for all sectors except mining and oil and gas industries. In addition, they detected little evidence of any asymmetry in the oil price sensitivities. McSweeney and Worthington (2008) also examine the impact of oil prices along with other macroeconomic variables on the Australian monthly stock returns. The authors find a negative effect of oil prices on equity returns of banking, retail, and transportation sectors but a positive effect on the energy sector. The authors find no impact on diversified financial, insurance, materials, media, and property trust sectors.
A more recent literature studies the relationship between oil price volatility and industry return fluctuation. Hammoudeh et al. (2004) employ univariate and multivariate GARCH to examine volatility persistence in the crude oil market and its effect on the equity return volatility of the S&P oil sector indices. Their findings document that oil volatility fluctuations have a volatility-echoing effect on the stocks of the companies engaged in oil exploration and production and domestic integrated oil companies while exerting a volatility-dampening effect on the stocks of the oil and gas refining and marketing companies and integrated multinational oil companies. Maghyereh et al. (2016) employ the concept of implied oil price volatility to study the oil–equity relationship and discover a bi-directional volatility spillover between oil prices and equity indices. Wang and Wang, (2019) mainly focus on the case of China and detect frequency dynamics of volatility spillovers between crude oil prices and Chinese equity markets. Their study, using generalized forecast error variance decomposition, reveals that the spillover during China’s 2015 financial crisis is negative and attributable to long-term components. In addition, their findings uncover the impact of structural breaks on the analytical results.
There is a large body of literature on how the macroeconomy affects the asset quality of banks. Sala and Saurina (2002) explored the quick transmission of macroeconomic influence to balance sheets in Spanish commercial banks. Financial intermediaries tend to enhance their lending with relatively lenient selection criteria during economic prosperity. Nevertheless, a high amount of bad loans has made banks suffer losses during the following economic downturns. In addition to Sala and Saurina (2002), Quagliariello (2007) depicts the remarkably increased loan loss provisions and bad debts during economic recessions. Pesola (2001) points out that the sharp fall of GDP growth beneath the forecast level and severe corporate and household indebtedness jointly contribute to the banking crisis in Nordic countries. Another strand of literature, such as Baum et al. (2009) and Quagliariello (2007), analyzes how banks react to macroeconomic uncertainty from the perspective of investment decisions. Baum et al. (2009) employ a portfolio model and suggest that when macroeconomic uncertainty, proxied by the conditional variance of a relevant macroeconomic variable, increases, the cross-bank dispersion of share of risky loans to total assets diminishes, as uncertainty hinders banks’ ability to foresee investment opportunities. Similarly, Quagliariello (2009) concludes that banks’ ability to accurately forecast future returns is hindered and herding behavior tends to emerge, as witnessed by the reduction of the cross-sectional variance of the share of loans held in a portfolio. Calmès and Théoret (2014) present similar findings and conclude that banks tend to behave more homogeneously in face of macroeconomic uncertainty specifically in the cross-sectional dispersion of loans-to-assets and the cross-sectional dispersion of the non-interest income. The authors also conclude that resilience of the banking system positions at its lowest during the financial crisis.
In this study, we employ a VAR-based causality test, namely, Toda and Yamamoto (1995) causality test, because it permits the production of dynamic influence from oil price shocks to banking indices fluctuations as well as variance decomposition to present the explanatory power of participated variables. It is worth noting that Granger causality tests are the most common approach to examine the time-series causal relationship between energy issues (i.e., energy price shocks, energy demand, and consumption) and economic activities, such as economic growth, stock market reaction (i.e., Lee, 2005; Lee and Chang 2008; Apergis and Payne 2009; Bruns and Gross, 2013; Doğrul and Soytas, 2010; Le and Chang, 2015; Nazlioglu and Soytas, 2011). Noticeably, the accuracy of the information on the order of integration and cointegration critically determines the results of Granger causality tests (Johansen 1988 and 1991). Nevertheless, unit root and cointegration tests tend to have low power, potentially leading to the pretesting bias (Toda and Yamamoto, 1995). Thus, Toda and Yamamoto (1995) have developed a new approach for causality test that avoids the problem associated with the common Granger causality test by ignoring the inevitable non-stationary property or cointegration between the series (Mavrotas and Kelly, 2001; Wolde-Rufael, 2005). To undertake the TY approach, the VAR-based model is presented as follows:
where
Before the commencement of causality testing among the involved data series, it is important to identify the order of integration referring to the augmented lag length in the VAR system. In our study, we follow Hasanov et al. (2016) to determine the augmented lag order (dmax) to be one.
The research objectives, as previously mentioned, request the oil price series and the data of macroeconomic indicators from January 1995 to March 2021, except for Malaysia.6 Oil price series are composed of WTI, Brent, and Dubai oil prices by following the prior literature and is collected from FRED Economic Data (Federal Reserve Bank of St. Louis). Macroeconomic factors contain interest rates, industrial production, and CPI. Interest rates are defined as the short-term discount rate series (EM. Diaz et al., 2016). In addition, short-interest rates are considered by other studies such as Cunado and Perez de Gracia (2014). Industry production has been used as a proxy to measure the magnitude of economic activities. The total industrial production index measures the real production output of manufacturing, mining, and electric and gas utilities industries (EM. Diaz et al., 2016). In addition to interest rates and industrial production, CPI is employed to measure the country-specific status of inflation. Macroeconomic data is obtained from International Financial Statistics (International Monetary Fund). Note that the series of macroeconomic indicators are in the monthly frequency, whereas the oil price series are presented daily. To guarantee the consistency of frequency for the analytical purpose, we convert the oil price series by calculating the average value of the daily oil prices and then transform the monthly oil price series into logarithm values, which is consistent with the prior studies, such as Ratti and Vespignani (2016).
The country selection of this study serves two dimensions: (1) oil-exporting developed countries vs oil-importing countries and (2) oil-exporting developed countries vs oil-exporting emerging countries. The first dimension is designed because oil price shocks impose different magnitudes of impact on the domestic equity markets as well as trade balances, which, in turn, has the differential spillover influence on the macroeconomy (Rafiq et al., 2016). Hence, we select Canada as the oil-exporting developed country, whereas the US, the UK, and Japan are oil-importing developed countries. As for the second dimension, oil price shocks might have a heterogeneous influence on the unemployment rate of developed and emerging countries, which, in turn, affects the economic growth as the driver of the banking equity (Doğrul and Soytas, 2010). According to the prior studies, Malaysia, Mexico, and Brazil are selected (Kuboniwa, 2014; Sharma and Gulati, 2015; Boubaker et al., 2016; de Oliveira et al., 2019). In addition, Table 1 presents energy intensity to GDP, crude oil consumption, production, and trade balance throughout 2007 to 2015. All the statistics are collected from the Global Energy Statistical Year Book 2016. Energy intensity to GDP refers to energy per unit divided by GDP per unit, suggesting the contribution of energy to GDP growth. In Panel A, Canada has the highest value of energy intensity to GDP, implying the high economic dependence on energy. It is noteworthy that the breakthrough of shale-oil technology causes a dramatic growth of oil production in the US and shrinkage of oil-importing, suggesting that the US is less dependent on overseas oil supply. In contrast, the United Kingdom has the lowest energy intensity to GDP. Panels B and C, respectively, depict crude oil consumption and production. The US is ranked the highest in the terms of both crude oil consumption and production. This may explain why most of the past literature tends to focus on the US for energy economic studies. In addition, Canada is commonly deemed as one of the important oil-dependent countries. Panels C and D illustrate the annual growth of oil production and oil-importing. Mexico is rarely included in the previous studies on energy economics. Nevertheless, Mexico has the third-largest crude oil production according to Panel C. Japan is an important oil-importing country as shown in Panel D. According to the statement of Le and Chang (2015), Malaysia is an energy-exporting country with 28.8% export dependence on oil and 86% export dependence on gas, which generates a substantial foreign exchange. As the third-largest energy intensity to GDP further explains the contribution of the energy sector to the domestic economy in Malaysia, however, the oil-exporting amount in Malaysia is obviously below Canada and Mexico.
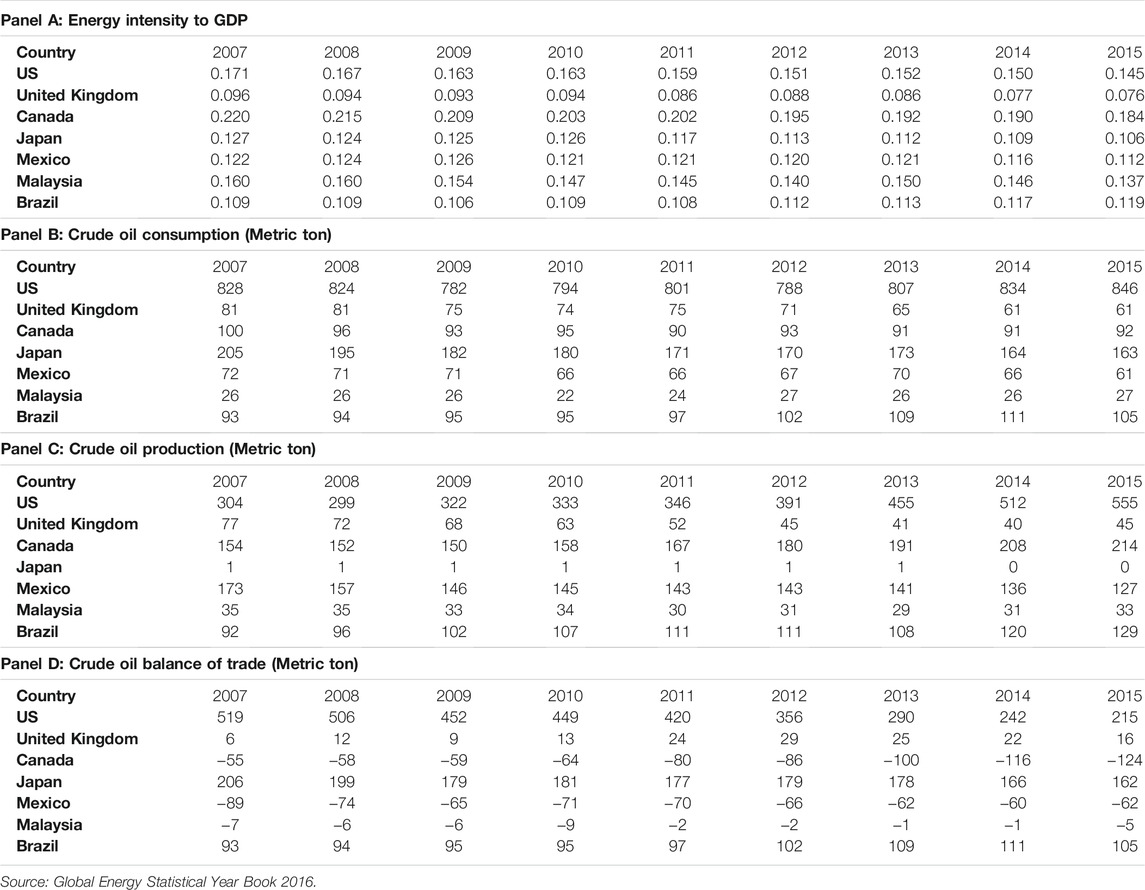
TABLE 1. Energy intensity and crude oil consumption, production, and trade balance at selected countries.
Table 2 depicts the summary statistics of all the variables across all the involved countries. All the variables are normally distributed according to Jarque–Bera tests. It is noteworthy that Mexico and Brazil have experienced a period when the interest rate is high in the early stage of the timespan between 1995 and 2021 (except for Malaysia). In addition to the descriptive statistics, the analytical process consists of a unit root test, causality test, impulse function analysis, and variance decomposition analysis.7
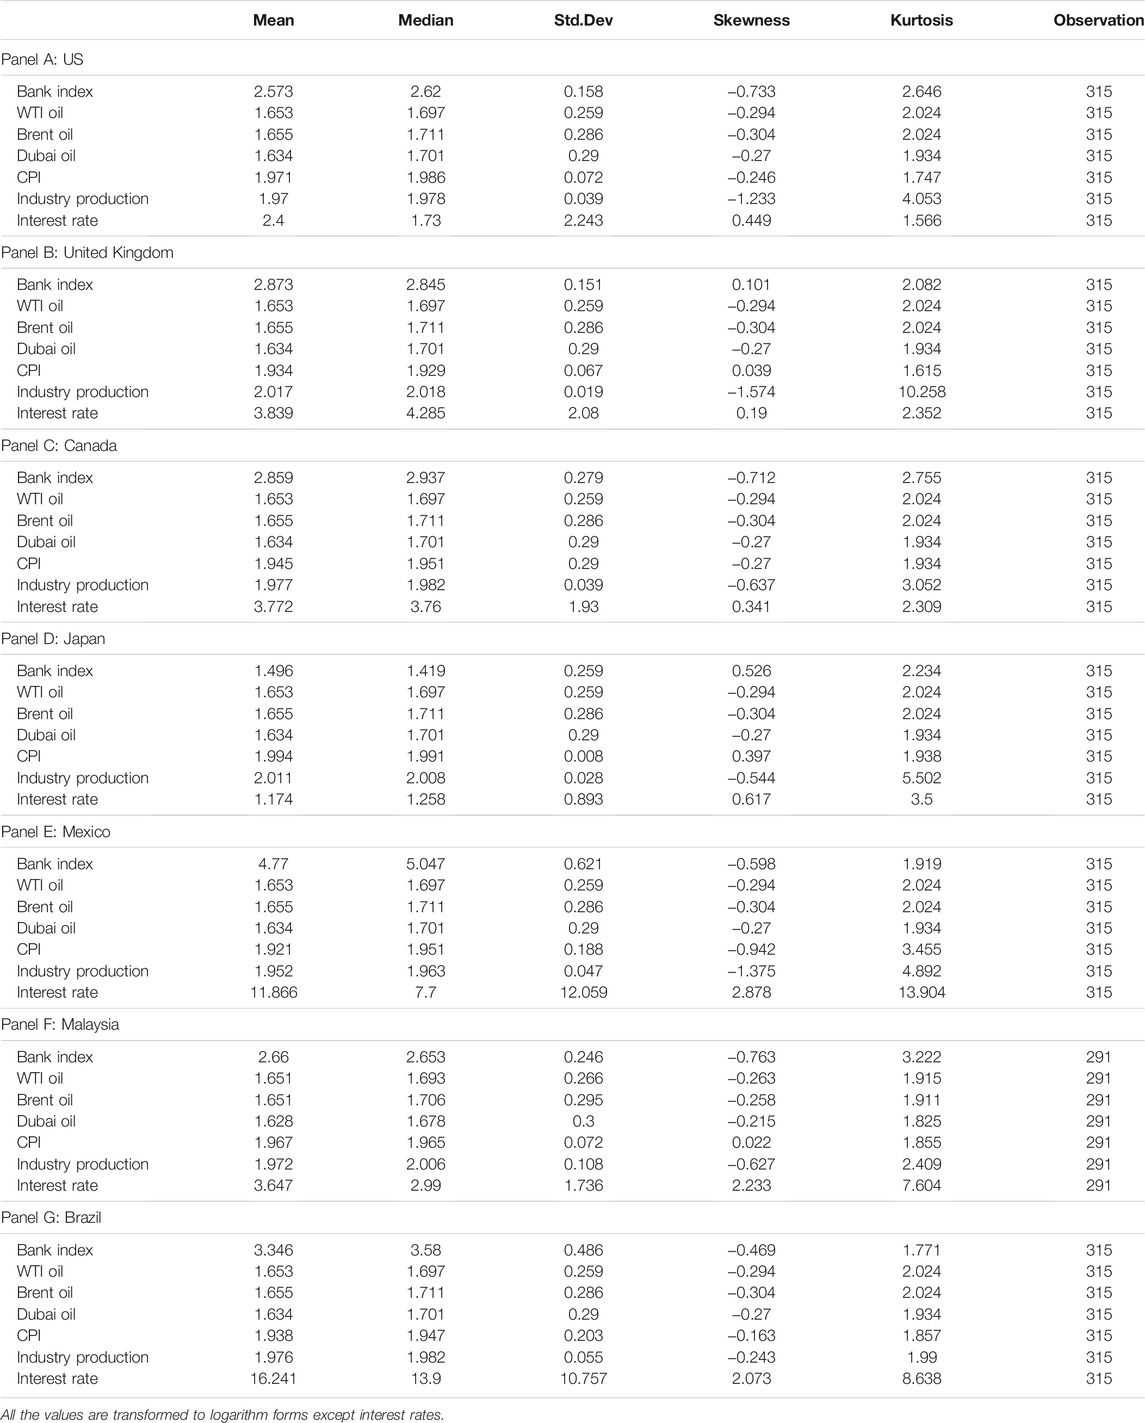
TABLE 2. Descriptive statistics.
We follow prior studies to utilize two major unit root tests, namely, the Augmented Dickey and Fuller (1981) (ADF) test and Phillips and Perron (1988) (PP) test. The null of ADF and PP suggests the stationary characteristic of specific variables. Table 3 illustrates the results of ADF and PP unit root tests. All the first difference variables are statistically stationary, except CPI of the United Kingdom.
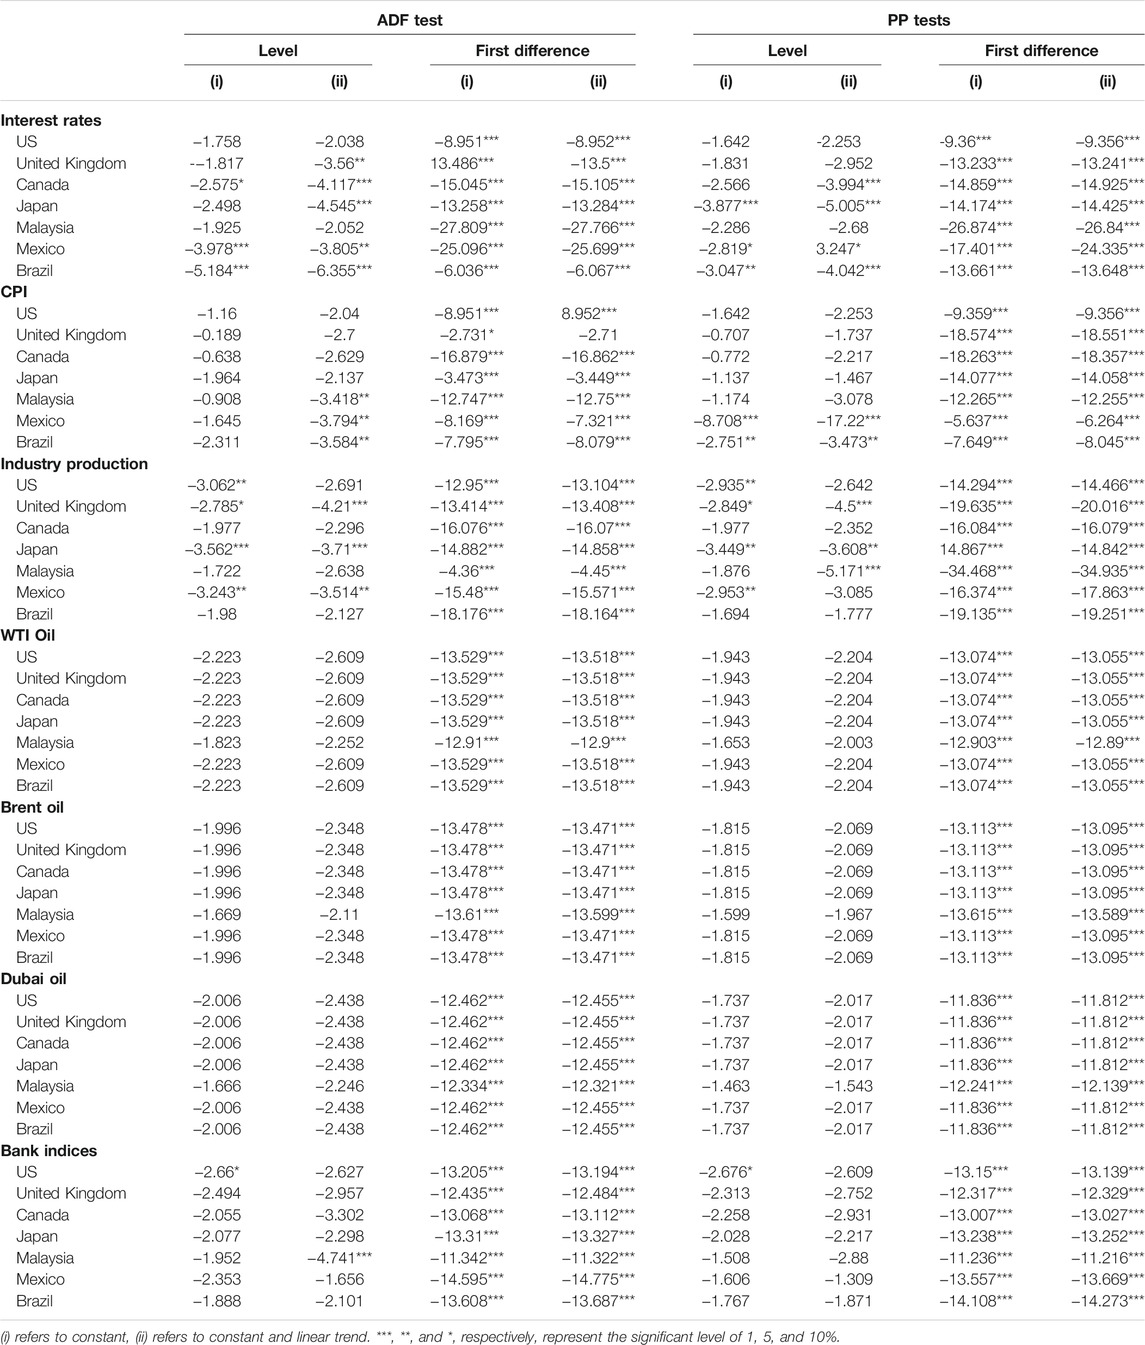
TABLE 3. Unit root test results.
Inspired by the study of Pal and Mitra (2017), the TY-based causality test allows us to explore the long-run causal relationship between oil price shocks, the performance of the banking sector, and macroeconomic variables. All the test results are presented in Table 4. Causal associations from oil price shocks are statistically verified in the US, Japan, and Mexico. It is hardly surprising that the high energy intensity, oil production in the US contributes to a significant causal effect. Japan is highly dependent on oil imports, which explains the causality between oil prices and the bank index. Besides oil price fluctuation, interest rates, as the important macroeconomic indicator, impose a significant influence on banking performance in the US, Japan, Malaysia, and Mexico. It is noteworthy that all the variables related to oil price shocks have a causal impact on banking sector performance in the US.
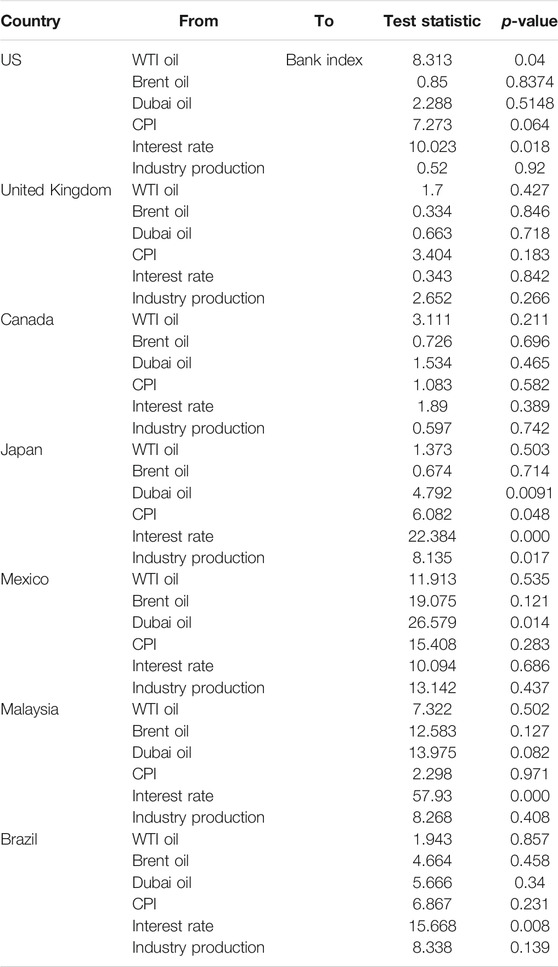
TABLE 4. Causality test.
Hasanov et al. (2016) explicitly state that the TY approach generates an impulse response function that permits us to observe the dynamic relationship to present deeper empirical insights.8 Empirically, the results illustrated by Figures 1–4, to some extent, reinforce the results based on TY analysis. Banking performance significantly reacts to oil price shocks in the United Kingdom, Canada, Japan, Mexico, and Brazil in the beginning of the period span. Noticeably, the positive reaction of banking indices in Malaysia to WTI oil price shocks comes across the entire period at an insignificant statistical level. Regarding the dynamic response of banking sector performance to macroeconomic variables, the banking industry in the US and the UK are exposed to a significant influence of all macroeconomic variables. Canadian banks are relatively vulnerable to industry production shocks. Japanese banks are significantly associated with the changes in interest rates. Industry production and interest rate fluctuation impose a significant impact on the Brazilian banking industry. Overall, our empirical findings support Quagliariello, M (2009) and Calmès and Théoret (2014) who argue that the banking operations are more sensitive to macroeconomic changes. In addition, we find out oil price shocks potentially influence banking sector performance in the United Kingdom, Canada, Japan, Mexico, and Brazil.
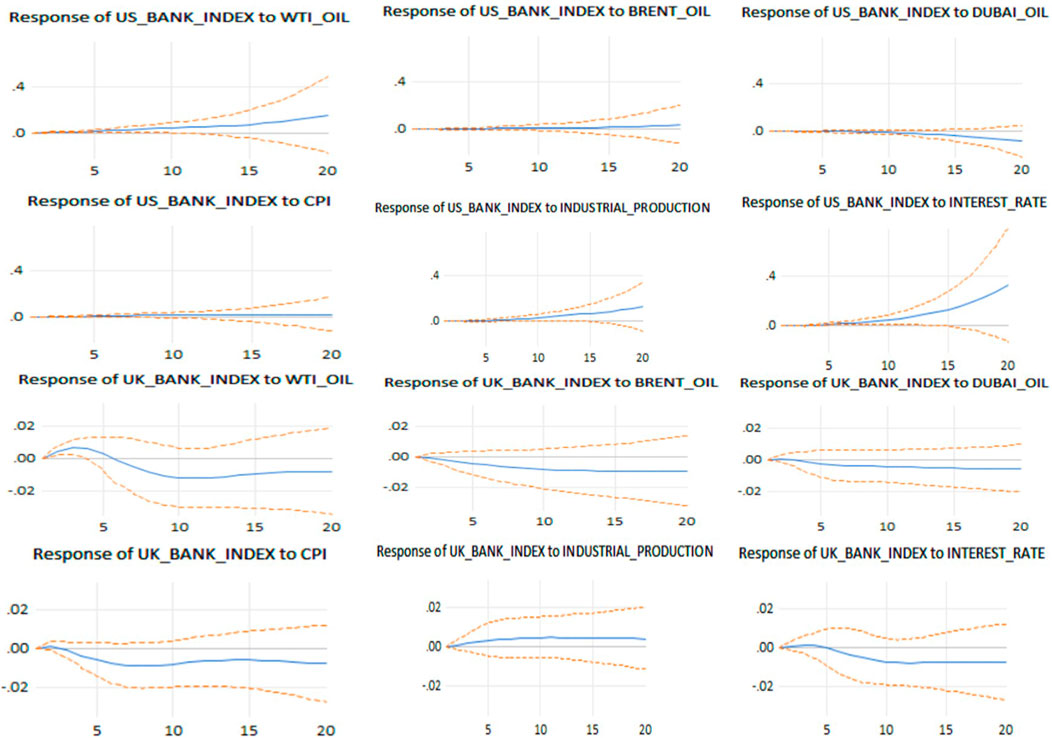
FIGURE 1. Impulse response function analysis: the US, the UK.
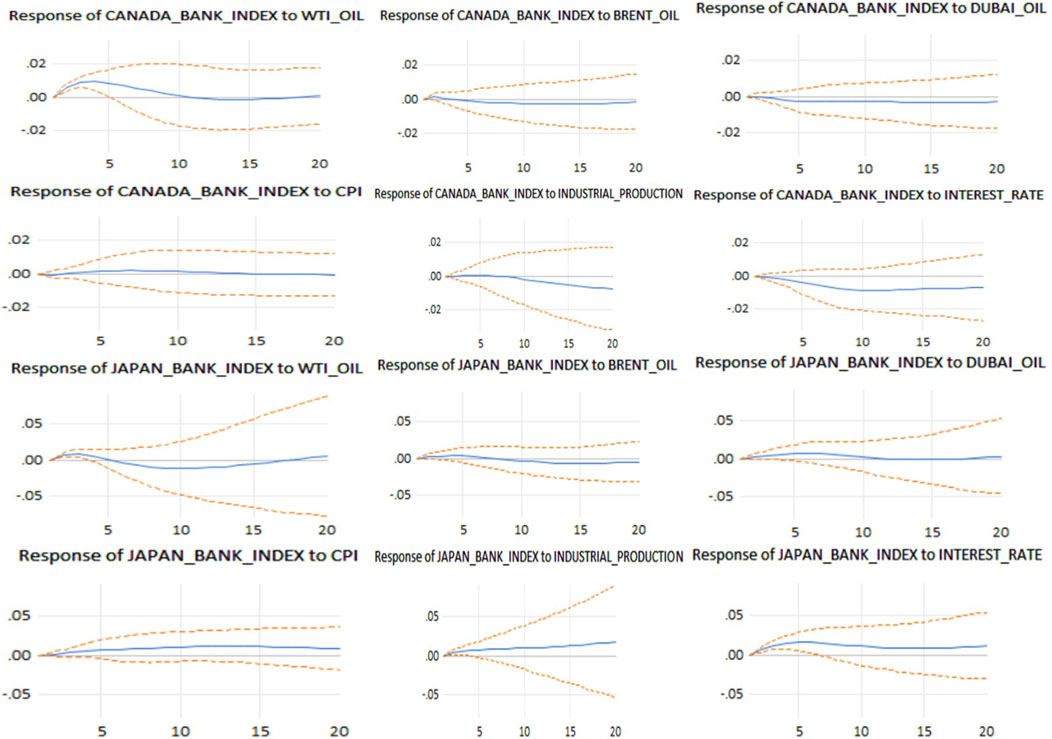
FIGURE 2. Impulse response function analysis: Canada, Japan.
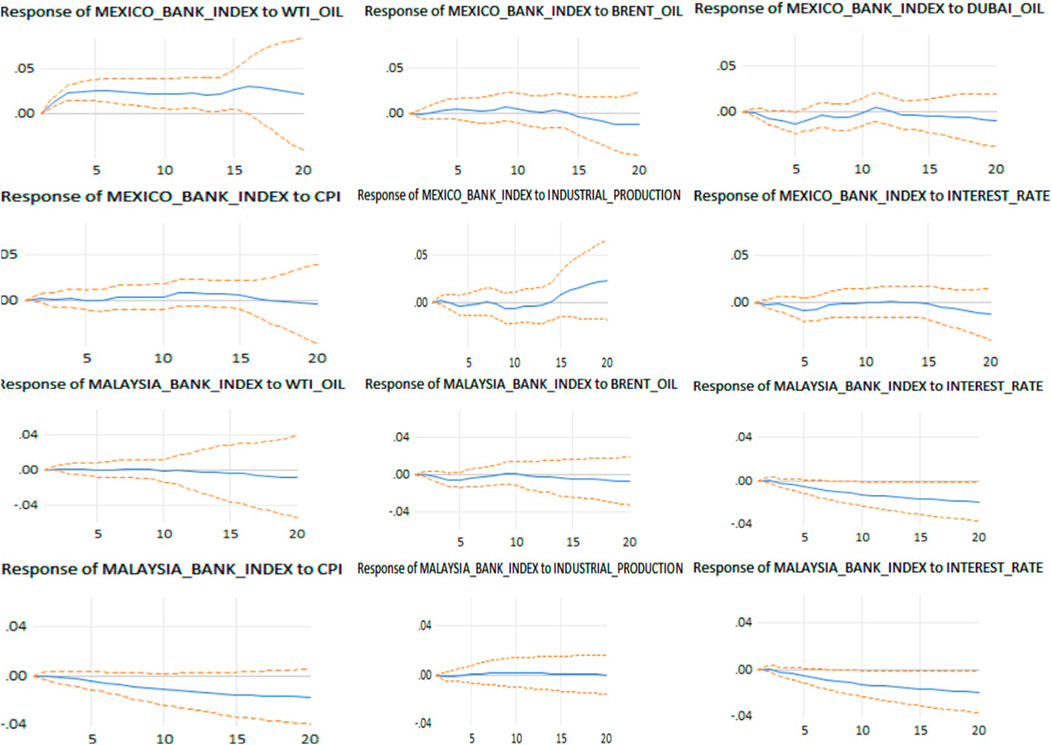
FIGURE 3. Impulse response function analysis: Mexico, Malaysia.

FIGURE 4. Impulse response function analysis: Brazil.
As presented by Brahmasrene et al. (2014), the TY approach also produces variance decomposition of all the involved variables. Variance decomposition, presented in Table 5, shows the comparison of explanatory power between oil price shocks and macroeconomic changes. It is noteworthy that the properties of findings related to variance decomposition analysis are slightly different from the results in previous sections. Observed from the findings of Panel A, WTI oil prices contribute to the largest proportion of the variations of the US bank index during the early stage of the period. Nevertheless, the power of interest rates in explaining the bank performance of the US exceeds the explanatory power of WTI oil prices in the late period. Similar findings are also shown in other countries including Canada and Brazil. Moreover, the variations of interest rates also substantially explain the country-level performance of the banking industry in the US, Canada, Malaysia, and Brazil. It is interesting to note that Dubai oil shocks reasonably contribute to the banking industry of Malaysia. The plausible explanation is that Dubai oil is the benchmark to price the oil products extracted in UAE and exported to Asia, which imposes an impact on pricing the oil products in Asia. It is interesting to note that Brent has less power in explaining the variation of the UK banking industry because the Brent price benchmark is extensively applied in Europe including the UK. Overall, in the cases of the US, UK, Canada, Malaysia, and Brazil, the oil prices, as well as interest rates, are jointly the most important factors that affect the country-level banking industry.
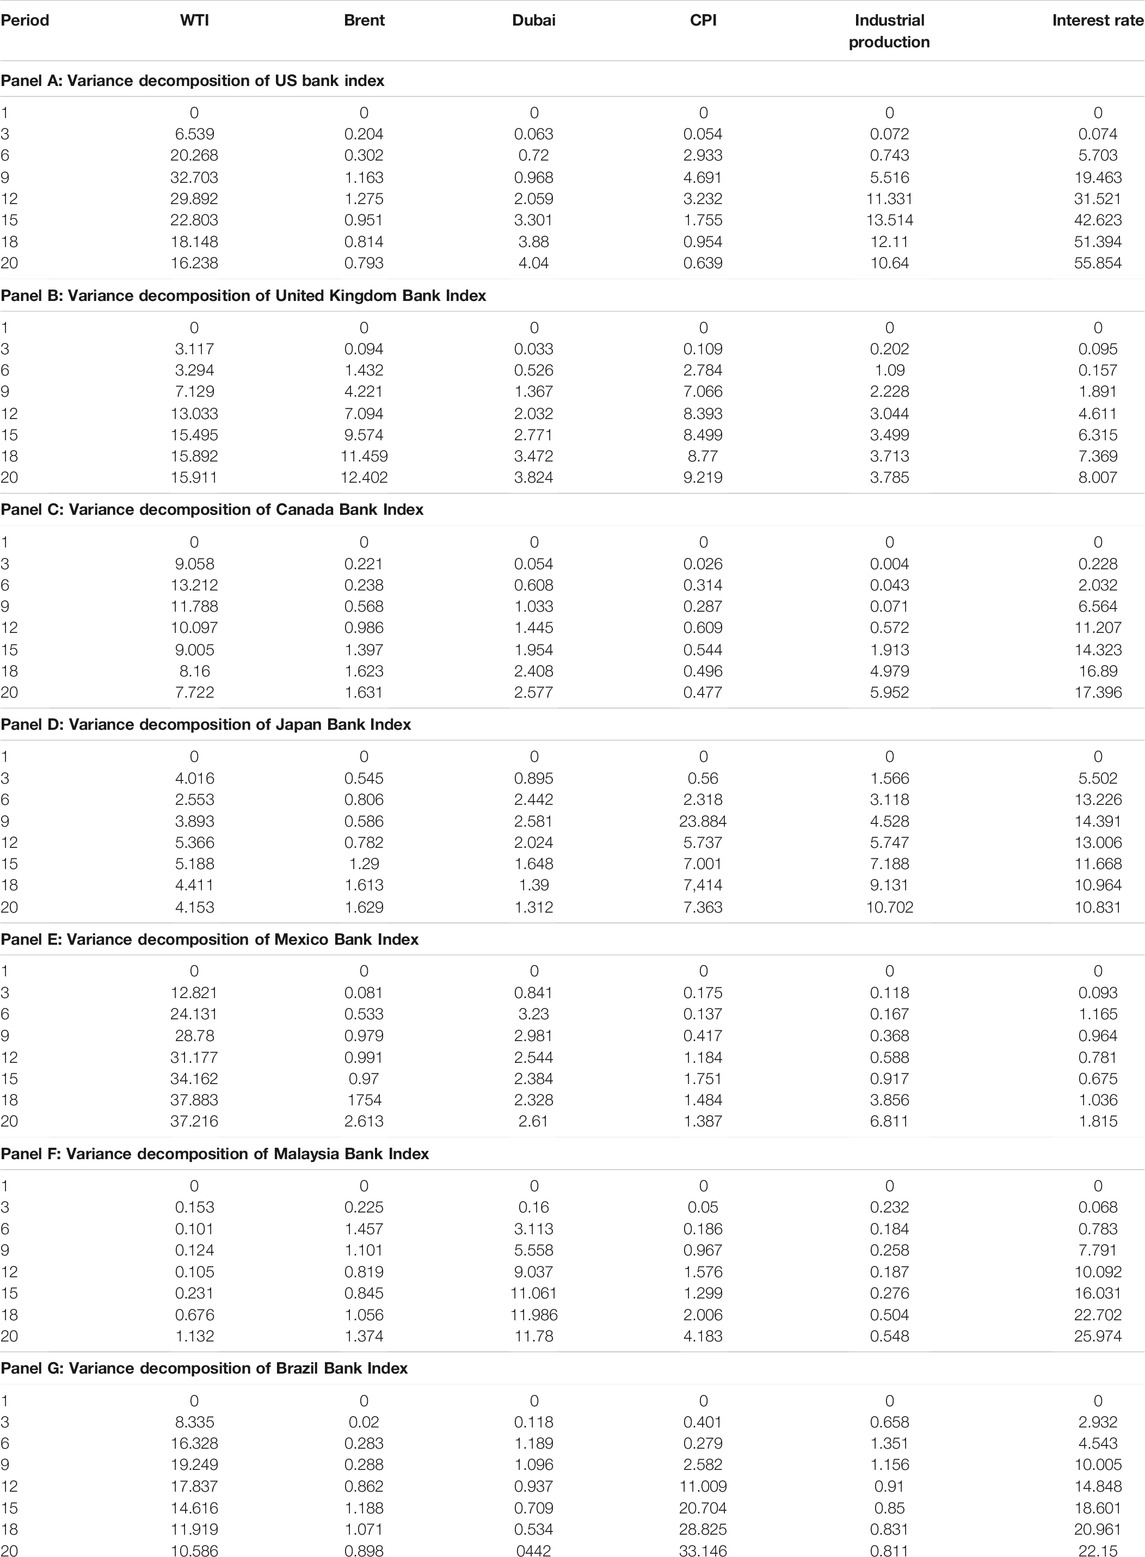
TABLE 5. Variance decomposition analysis.
In this study, we attempt to explore the dynamic relationship between oil price shocks, macroeconomic changes, and banking sector performance utilizing a dataset from February 1995 to March 2021 (except for Malaysia). Three oil price variables consisting of WTI, Brent, and Dubai oil are employed. To investigate the explanatory power of oil price on banking indices, macroeconomic factors including CPI, interest rates, and industrial production are utilized. This study adopts two recent procedures, namely, unit root tests including the Augmented Dickey and Fuller (1981) (ADF) test and Phillips and Perron (1988) (PP) test. This investigation also uses the Toda and Yamamoto (1995) causality that reports long-term causal relationships, a time-variant association based on impulse response function, and variance decomposition. Three important emerging oil-dependent and exporting countries are included in this study. In addition, the study cover group of developed countries for discussion and comparison purposes, namely, Canada, the US, and Japan.
Empirical findings based on the impulse response function suggest that oil price shocks impose a significant influence on the banking sector in both important oil-consumption and exporting countries such as the US, Canada, and Japan, which is confirmed by the results on the long-term causal relationship based on the TY approach. Such empirical findings suggest the magnitude of reliance on oil production, exporting, and consumption. These findings potentially make the banking industry sensitive to oil price shocks. On the other hand, our results document that banking indices fluctuation is sensitive to macroeconomic factors, such as interest rate in all countries except Mexico, which confirms early findings by Quagliariello, M (2009) and Calmès and Théoret (2014).
Our results show that variance decomposition analysis presents results that are somewhat different from the causality test as well as impulse response function. Our interpretation of these slight discrepancies is that oil price shocks capture a relatively high percentage of bank indices variation even if an insignificant association is empirically shown. Henceforth, our study reinforces the study of Hesse and Poghosyan (2016) who document that bank performance is affected by the indirect impact of oil price shocks. In other words, the influence is first transmitted from oil price to macroeconomic factors and then to banking industries. Ultimately, Hesse and Poghosyan (2016) report that investment banks are more vulnerable to oil price shocks because of their buoyant advising fees and trading. In reality, some large commercial banks, such as Citigroup, are exposed to oil-related asset trading. Henceforth, we gesture the likelihood that trading activities in big banks could enlarge their exposure to oil price shocks. Overall, our study suggests some implications for both investors and policymakers. We suggest that the investor may consider variation of the interest rates in modeling their investment strategies. Moreover, policy makers may consider the estimation of the impact of interest rate adjustments on the bank performance. Finally, we suggest further exploration and insights on how oil price shocks impact the banking industry in emerging markets under different techniques, data, and contexts.
The raw data supporting the conclusions of this article will be made available by the authors, without undue reservation.
MS and DL are the main authors of this project. AH helped in the analysis.
The authors declare that the research was conducted in the absence of any commercial or financial relationships that could be construed as a potential conflict of interest.
All claims expressed in this article are solely those of the authors and do not necessarily represent those of their affiliated organizations, or those of the publisher, the editors and the reviewers. Any product that may be evaluated in this article, or claim that may be made by its manufacturer, is not guaranteed or endorsed by the publisher.
The Supplementary Material for this article can be found online at https://www.frontiersin.org/articles/10.3389/fenrg.2021.595060/full#supplementary-material
1This report comes from Cary Springfield, “Oil Price and Bank Profitability”, International Banker (Aug. 4, 2016).
2The analysis is extracted from James Titcomb, “Oil collapse could trigger billions in bank losses”, The Telegraph (Jan. 24, 2015).
3Several studies emphasize on sectoral oil price effects. For example, Keane and Prasad (1996) examine oil effects on industry employment and wages. Davis and Haltwanger (2001) analyze the oil effects on sectoral job creation and destruction. Lee and Ni (2002) analyze the changes in industry demand and supply levels due to shocks in the price of oil.
4There are extensive literatures on the interaction between oil price and stock market performance. This section mainly selects the studies on how oil prices influence the industrial equity returns
5Autocorrelation LM tests need to be statistically insignificant before the finalization of optimal lag orders. In our studies, all the selected lag orders sufficiently satisfied with autocorrelation requirements
6It is worth noting that the sample period ends at March 2019 due to the data limits
7We employ the Johansen and Juselius (1990) cointegration test to detect the cointegrating relationship between country-specific variables. However, only the variables in Mexico are cointegrated at one vector
8Generalized impulse function is used in this study and it produces similar results
Apergis, N., and Payne, J. E. (2009). Energy Consumption and Economic Growth in Central America: Evidence from a Panel Cointegration and Error Correction Model. Energ. Econ. 31 (2), 211–216. doi:10.1016/j.eneco.2008.09.002
Bai, J., Krishnamurthy, A., and Weymuller, C.-H. (2018). Measuring Liquidity Mismatch in the Banking Sector. J. Finance 73 (1), 51–93. doi:10.1111/jofi.12591
Baum, C. F., Caglayan, M., and Ozkan, N. (2009). The Second Moments Matter: The Impact of Macroeconomic Uncertainty on the Allocation of Loanable Funds. Econ. Lett. 102 (2), 87–89. doi:10.1016/j.econlet.2008.11.019
Bikker, J. A., and Hu, H. (2012). Cyclical Patterns in Profits, Provisioning and Lending of banks and Procyclicality of the New Basel Capital Requirements. PSL Q. Rev. 55 (221).
Boubaker, S., Jouini, J., and Lahiani, A. (2016). Financial Contagion between the US and Selected Developed and Emerging Countries: The Case of the Subprime Crisis. Q. Rev. Econ. Finance 61, 14–28. doi:10.1016/j.qref.2015.11.001
Boyer, M. M., and Filion, D. (2007). Common and Fundamental Factors in Stock Returns of Canadian Oil and Gas Companies. Energ. Econ. 29 (3), 428–453. doi:10.1016/j.eneco.2005.12.003
Brahmasrene, T., Huang, J.-C., and Sissoko, Y. (2014). Crude Oil Prices and Exchange Rates: Causality, Variance Decomposition and Impulse Response. Energ. Econ. 44, 407–412. doi:10.1016/j.eneco.2014.05.011
Bruns, S. B., and Gross, C. (2013). What if Energy Time Series Are Not Independent? Implications for Energy-GDP Causality Analysis. Energ. Econ. 40, 753–759. doi:10.1016/j.eneco.2013.08.020
Burbidge, J., and Harrison, A. (1984). Testing for the Effects of Oil-price Rises Using Vector Autoregressions. Int. Econ. Rev. 25, 459–484. doi:10.2307/2526209
Calmès, C., and Théoret, R. (2014). Bank Systemic Risk and Macroeconomic Shocks: Canadian and U.S. Evidence. J. Banking Finance 40, 388–402. doi:10.1016/j.jbankfin.2013.11.039
Carruth, A., Dickerson, A., and Henley, A. (2000). What Do We Know about Investment under Uncertainty? J. Econ. Surv. 14 (2), 119–154. doi:10.1111/1467-6419.00107
Ciner, C. (2001). Energy Shocks and Financial Markets: Nonlinear Linkages. Stud. Nonlinear Dyn. Econom. 5 (3). doi:10.2202/1558-3708.1079
Cunado, J., and Perez de Gracia, F. (2014). Oil price Shocks and Stock Market Returns: Evidence for Some European Countries. Energ. Econ. 42, 365–377. doi:10.1016/j.eneco.2013.10.017
Davis, S. J., and Haltiwanger, J. (2001). Sectoral Job Creation and Destruction Responses to Oil price Changes. J. monetary Econ. 48 (3), 465–512. doi:10.1016/s0304-3932(01)00086-1
de Oliveira, E. M., Cyrino Oliveira, F. L., Klötzle, M. C., and Pinto, A. C. F. (2019). Dynamic Associations between GDP and Crude Oil Prices in Brazil: Structural Shifts and Nonlinear Causality. Emerging Markets Finance and Trade 57 (10), 2767–2791. doi:10.1080/1540496x.2019.1658072
Diaz, E. M., Molero, J. C., and Perez de Gracia, F. (2016). Oil price Volatility and Stock Returns in the G7 Economies. Energ. Econ. 54, 417–430. doi:10.1016/j.eneco.2016.01.002
Dickey, D. A., and Fuller, W. A. (1981). Likelihood Ratio Statistics for Autoregressive Time Series with a Unit Root. Econometrica 49, 1057–1072. doi:10.2307/1912517
Doğrul, H. G., and Soytas, U. (2010). Relationship between Oil Prices, Interest Rate, and Unemployment: Evidence from an Emerging Market. Energ. Econ. 32 (6), 1523–1528. doi:10.1016/j.eneco.2010.09.005
Faff, R. W., and Brailsford, T. J. (1999). Oil Price Risk and the Australian Stock Market. J. Energ. Finance Dev. 4 (1), 69–87. doi:10.1016/s1085-7443(99)00005-8
Ferderer, J. P. (1997). Oil price Volatility and the Macroeconomy. J. macroeconomics 18 (1), 1–26. doi:10.1016/s0164-0704(96)80001-2
Gambera, M. (2000). Simple Forecasts of Bank Loan Quality in the Business Cycle. Chicago, IL: Federal Reserve Bank of Chicago.
Garcia, A., and Calmes, C. (2005). Banks Lending and Macroeconomic Uncertainty: The Case of Canada. Bank of Canada–Working Paper.28, éditeur non identifié, Canada.
Gisser, M., and Goodwin, T. H. (1986). Crude Oil and the Macroeconomy: Tests of Some Popular Notions: Note. J. Money, Credit Banking 18 (1), 95–103. doi:10.2307/1992323
Hamilton, J. D. (1983). Oil and the Macroeconomy since World War II. J. Polit. Economy 91, 228–248. doi:10.1086/261140
Hammoudeh, S., Dibooglu, S., and Aleisa, E. (2004). Relationships Among U.S. Oil Prices and Oil Industry Equity Indices. Int. Rev. Econ. Finance 13 (4), 427–453. doi:10.1016/s1059-0560(03)00011-x
Hasanov, A. S., Do, H. X., and Shaiban, M. S. (2016). Fossil Fuel price Uncertainty and Feedstock Edible Oil Prices: Evidence from MGARCH-M and VIRF Analysis. Energ. Econ. 57, 16–27. doi:10.1016/j.eneco.2016.04.015
Hesse, H., and Poghosyan, T. (2016). “Oil Prices and Bank Profitability: Evidence from Major Oil-Exporting Countries in the Middle East and North Africa,” in Financial Deepening and Post-Crisis Development in Emerging Markets (Palgrave Macmillan US), 247–270. doi:10.1057/978-1-137-52246-7_12
Hooker, M. A. (1996). What Happened to the Oil price-macroeconomy Relationship? J. Monetary Econ. 38 (2), 195–213. doi:10.1016/s0304-3932(96)01281-0
Huang, R. D., Masulis, R. W., and Stoll, H. R. (1996). Energy Shocks and Financial Markets. J. Fut. Mark. 16 (1), 1–27. doi:10.1002/(sici)1096-9934(199602)16:1<1:aid-fut1>3.0.co;2-q
Johansen, S. (1988). Statistical Analysis of Cointegration Vectors. J. Econ. Dyn. Control 12 (2-3), 231–254. doi:10.1016/0165-1889(88)90041-3
Johansen, S., and Juselius, K. (1990). Maximum Likelihood Estimation and Inference on Cointegration—With Applications to the Demand for Money. Oxford Bull. Econ. Stat. 52 (2), 169–210. doi:10.1111/j.1468-0084.1990.mp52002003.x
Jones, D. W., Leiby, P. N., and Paik, I. K. (2004). Oil price Shocks and the Macroeconomy: what Has Been Learned since 1996. Energ. J., 1–32. doi:10.5547/issn0195-6574-ej-vol25-no2-1
Keane, M. P., and Prasad, E. S. (1996). The Employment and Wage Effects of Oil price Changes: a Sectoral Analysis. Rev. Econ. Stat. 78, 389–400. doi:10.2307/2109786
Kuboniwa, M. (2014). A Comparative Analysis of the Impact of Oil Prices on Oil-Rich Emerging Economies in the Pacific Rim. J. Comp. Econ. 42 (2), 328–339. doi:10.1016/j.jce.2014.03.007
Laeven, L., and Majnoni, G. (2003). Loan Loss Provisioning and Economic Slowdowns: Too Much, Too Late? J. financial intermediation 12 (2), 178–197. doi:10.1016/s1042-9573(03)00016-0
Le, T.-H., and Chang, Y. (2015). Effects of Oil price Shocks on the Stock Market Performance: Do Nature of Shocks and Economies Matter? Energ. Econ. 51, 261–274. doi:10.1016/j.eneco.2015.06.019
Lee, C.-C., and Chang, C.-P. (2008). Energy Consumption and Economic Growth in Asian Economies: a More Comprehensive Analysis Using Panel Data. Resource Energ. Econ. 30 (1), 50–65. doi:10.1016/j.reseneeco.2007.03.003
Lee, C.-C. (2005). Energy Consumption and GDP in Developing Countries: a Cointegrated Panel Analysis. Energ. Econ. 27 (3), 415–427. doi:10.1016/j.eneco.2005.03.003
Lee, K., and Ni, S. (2002). On the Dynamic Effects of Oil price Shocks: a Study Using Industry Level Data. J. Monetary Econ. 49 (4), 823–852. doi:10.1016/s0304-3932(02)00114-9
Maghyereh, A. I., Awartani, B., and Bouri, E. (2016). The Directional Volatility Connectedness between Crude Oil and Equity Markets: New Evidence from Implied Volatility Indexes. Energ. Econ. 57, 78–93. doi:10.1016/j.eneco.2016.04.010
Mavrotas, G., and Kelly, R. (2001). Old Wine in New Bottles: Testing Causality between Savings and Growth. Manchester Sch. 69 (s1), 97–105. doi:10.1111/1467-9957.69.s1.6
McSweeney, E. J., and Worthington, A. C. (2008). A Comparative Analysis of Oil as a Risk Factor in Australian Industry Stock Returns, 1980‐2006. Stud. Econ. Finance 25 (2), 131–145. doi:10.1108/10867370810879447
Meyer, A. P., and Yeager, T. J. (2001). Are Small Rural banks Vulnerable to Local Economic Downturns? Review 83 (Mar), 25–38. doi:10.20955/r.83.25-38
Mussa, M. (2000). The Impact of Higher Oil Prices on the Global Economy. International Monetory Fund 2000. Available at: http://www.imf.org/external/pubs/ft/oil/2000/December 8.
Nandha, M., and Faff, R. (2008). Does Oil Move Equity Prices? A Global View. Energ. Econ. 30 (3), 986–997. doi:10.1016/j.eneco.2007.09.003
Nazlioglu, S., and Soytas, U. (2011). World Oil Prices and Agricultural Commodity Prices: Evidence from an Emerging Market. Energ. Econ. 33 (3), 488–496. doi:10.1016/j.eneco.2010.11.012
Pal, D., and Mitra, S. K. (2017). Time-frequency Contained Co-movement of Crude Oil and World Food Prices: A Wavelet-Based Analysis. Energ. Econ. 62, 230–239. doi:10.1016/j.eneco.2016.12.020
Phillips, P. C. B., and Perron, P. (1988). Testing for a Unit Root in Time Series Regression. Biometrika 75, 335–346. doi:10.1093/biomet/75.2.335
Quagliariello, M. (2007). Banks' Riskiness over the Business Cycle: a Panel Analysis on Italian Intermediaries. Appl. Financial Econ. 17 (2), 119–138. doi:10.1080/09603100500486501
Quagliariello, M. (2009). Macroeconomic Uncertainty and banks' Lending Decisions: the Case of Italy. Appl. Econ. 41 (3), 323–336. doi:10.1080/00036840601007286
Rafiq, S., Sgro, P., and Apergis, N. (2016). Asymmetric Oil Shocks and External Balances of Major Oil Exporting and Importing Countries. Energ. Econ. 56, 42–50. doi:10.1016/j.eneco.2016.02.019
Ratti, R. A., and Vespignani, J. L. (2016). Oil Prices and Global Factor Macroeconomic Variables. Energ. Econ. 59, 198–212. doi:10.1016/j.eneco.2016.06.002
Salas, V., and Saurina, J. (2002). Credit Risk in Two Institutional Settings: Spanish Commercial and Saving banks. J. Financial Serv. Res. 22, 203–224. doi:10.1023/a:1019781109676
Sharma, P., and Gulati, A. (2015). Approaches to Food Security in Brazil, China, India, Malaysia, Mexico, and Nigeria: Lessons for Developing Countries. No. id: 6427).
Toda, H. Y., and Yamamoto, T. (1995). Statistical Inference in Vector Autoregressions with Possibly Integrated Processes. J. Econom. 66 (1), 225–250. doi:10.1016/0304-4076(94)01616-8
Wang, X., and Wang, Y. (2019). Volatility Spillovers between Crude Oil and Chinese Sectoral Equity Markets: Evidence from a Frequency Dynamics Perspective. Energ. Econ. 80, 995–1009. doi:10.1016/j.eneco.2019.02.019
Keywords: bank indices, oil price shocks, toda-yamamoto causality test, impulse response function, variance decomposition bank indices, variance decomposition JEL classification: Q43, E02, G21
Citation: Shaiban MS, Li D and Hasanov AS (2021) Energy and Bank Equity Interactions. Front. Energy Res. 9:595060. doi: 10.3389/fenrg.2021.595060
Received: 15 August 2020; Accepted: 07 September 2021;
Published: 12 October 2021.
Edited by:
Hooi Hooi Lean, Universiti Sains Malaysia (USM), MalaysiaCopyright © 2021 Shaiban, Li and Hasanov. This is an open-access article distributed under the terms of the Creative Commons Attribution License (CC BY). The use, distribution or reproduction in other forums is permitted, provided the original author(s) and the copyright owner(s) are credited and that the original publication in this journal is cited, in accordance with accepted academic practice. No use, distribution or reproduction is permitted which does not comply with these terms.
*Correspondence: Mohammed Sharaf Shaiban, bW9oYW1tZWQuc2hhaWJhbkBtb25hc2guZWR1
Disclaimer: All claims expressed in this article are solely those of the authors and do not necessarily represent those of their affiliated organizations, or those of the publisher, the editors and the reviewers. Any product that may be evaluated in this article or claim that may be made by its manufacturer is not guaranteed or endorsed by the publisher.
Research integrity at Frontiers
Learn more about the work of our research integrity team to safeguard the quality of each article we publish.