 Ayush Sinha
 Manasi Mohandas2
 Pankaj Pandey
 O. P. Vyas
- 1Indian Institute of Information Technology, Allahabad, Prayagraj, India
- 2Indian Institute of Information Technology, Allahabad, Allahabad, India
- 3Norwegian University of Science and Technology, Gjøvik, Norway
Cyber-Physical Systems (CPS) is the amalgamation of highly sophisticated sensors with physical spaces. These close conjunctions of sensors with communication infrastructure intrinsically linking to society’s Critical Infrastructures (C.I.) are being witnessed more often in the context of Smart Grid (SG). As a backbone of C.I., Smart Grid demonstrates ability to precisely monitor large scale energy systems and designed in order to achieve complex local and global objectives. Being capable of performing such sophisticated operation it also bears the vulnerability of being exposed for cyber-physical co-ordinated attack that may lead to catastrophic effect. Many researchers have analyze the different stages of cyber-physical co-ordinated attacks like attack detection, prevention, impact analysis and recovery plans but there exist a research gap to address all the issues under single framework. Through this paper, we propose a novel Cyber Physical Defense Framework (CPDF) based on National Institute of Standards and Technology (NIST) guidelines to address the cyber attack on SG. Our work addresses the pre and post attack scenario, attack vector formulation through hierarchical PetriNet modeling and recovery mechanism. We have performed experiment for Distributed Denial of Service (DDoS) and False Data Injection attack (FDI) to validate our framework effectiveness and established the efficacy of proposed model. In the end, we have presented a case study of FDI attack detection using machine learning technique on IEEE 9-bus and 14-bus system.
Introduction
Smart cities can be defined as cities that incorporate information and communication technology in order to provide benefits such as efficiency, reduced cost, convenience and higher quality of life. For the successful functioning of a smart city the energy infrastructure must also integrate information and communication technology appropriately. This energy infrastructure network, referred to as a smart grid, is drawing attention for its safe and smooth functioning. The conventional centralized electric grid architecture that dominated in the 20th century can no longer keep up with the technological advancements being made in the present world. The centralized conventional architecture leads to high costs as users are unaware of the sudden fluctuations in cost due to increased demand during peak hours, and wastage of energy when the demand is low as the centralized source may be generating electricity in excess. Traditional centralized energy resources cannot incorporate Distributed Energy Resources (DERs) into their framework, which could have provided some level of reliability and energy efficiency. A smart grid on the other hand communicates relevant information across the grid and makes use of resources like DERs, thereby increasing awareness and resulting in a more transparent, energy efficient, cost effective and reliable system [4]. A smart grid is highly susceptible to both cyber and physical attacks. Cyber-attacks involve attacks on the communication network such as DDoS attack, malware and more. Physical attacks aim at disabling the hardware of the smart grid, such as breaking the smart meter, or cutting communication lines. In a smart grid we can use intelligent methods to detect possible attacks. Physical tampering can be detected through the use of sensors that give updates on the status of the physical infrastructure.
Literature Survey
This section covers the exiting architecture or framework proposed by researchers for the effective management and risk mitigation for the smart grid infrastructure. However through the literature review, we could see that every framework tried to address a few challenges of the different important constituents of the smart grid infrastructure framework. The Smart Grid Architecture Model CEN-CENELEC-ETSI (2012), which is shown in Figure 1, was developed under the European Commission’s Standardization Mandate M/490 and is a widely used reference framework. This framework is a three dimensional reference architecture that can be used as a basis for the design of a modern smart grid system. This framework consists of Interoperability Layers, Domains and Zones. There are five Interoperability layers which covers the smart grid that consists of five domains which represent the various parts of the electrical energy conversion and transmission chain, and six zones which represent hierarchical levels of power system management. The different Layers, Domains and Zones are mentioned in Figure 1. This architecture provides a basic outline of a smart grid which provides the possibilities for other concepts and ideas to be superimposed over it.
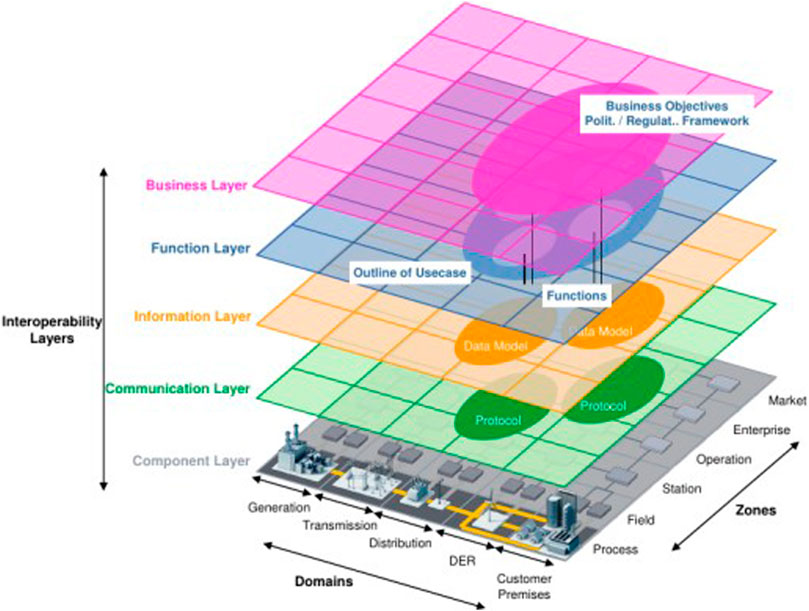
FIGURE 1. SGAM architecture CEN-CENELEC-ETSI (2012).
To explore the possibility of Big Data analytics Zhang et al. (2018) in the domain of smart grid, researchers gave SGAM-based explanation of Smart Grids. This is the extension of SGAM model to effectively handle the large amount of data generated through smart grid infrastructure. The Rise of AGILE Demand Response Babar et al. (2016) emphasizes the need to move beyond conventional grid and market dynamics. This involves applying the concept of Demand Response to the existing ICT infrastructure, i.e., by shifting the loads during peak (high demand) hours. The term agile refers to the ability to adapt and respond to changes in a prompt and cost-effective manner. In Analyzing an agile solution for intelligent distribution grid development: A smart grid architecture method Babar and Nguyen (2018), the agile DR concept has been applied to the SGAM reference architecture. In this approach agents are present at each interoperability layer to perform the required tasks. These agents help achieve the three goals of agility-improved responsiveness, product adaptability and customer enabling. An Open Source Modeling Framework for Interdependent Energy-Transportation Communication Infrastructure in Smart and Connected Communities Lu et al. (2019) describes a multi-layer, multi-block, multi-agent approach for an Energy-Transportation-Communication infrastructure in a smart city. The multi-layer represents three layers-the community layer where each community is divided into a set of functional blocks, the block layer where each block has three system agents for communication, transportation and energy respectively, and a system agent layer which consists of sub-agents to perform the tasks of a particular agent.
The above mentioned research works address various aspects of the smart grid architecture. It is necessary to incorporate several such aspects together in order to design an ideal smart grid reference architecture that can be used for the construction of smart cities.
Cyber Security Requirement for Smart City—Model Framework (Ministry of Housing and Urban Affairs) f is a framework developed by the Government of India which identifies the various security requirements that should be considered when implementing smart city architectures. This framework contains information about the exchange of data in the smart grid. IEC 61850 IEC (2003) is a global standard for communication of intelligent devices at electrical substations. It provides several requirements and protocols that facilitate the communication in a smart grid. In Cyber-Physical Security of a Smart Grid Infrastructure Mo et al. (2011), the main security requirements of general information security, namely confidentiality, integrity and availability (the CIA triad) He and Yan (2016), were used to identify specific security requirements for a smart grid. Due to large scale complex network, it is still challenging for researchers to mimic all attack category. As Distributed Denial of Service (DDoS) is considered as a major one, Ma et al. Ma et al. (2013) handle the modeling of this attack as a Markov game between attackers and service provider and tries to investigate the optimal strategies for both. It also identifies various attacks and entry points and the resulting consequences on the grid and provides certain countermeasures to combat the same. Authors presented a Tri-level optimal hardening plan for a resilient distribution system considering reconfiguration and DG islanding Lin and Bie (2018) as a Defender-Attacker-Defender approach to increase the resilience of the smart grid by reconfiguration. It works by first hardening the lines so as to minimize the DG islanding, then applying the worst case attack on the system, and finally re configuring the network to again minimize DG islanding. Communication Architecture for Smart Grid Applications Emmanuel et al. (2018) identifies that a general smart grid infrastructure generally contains three tiers of networks- WAN, NAN and HAN, and also specifies certain infrastructures for both wired and wireless communication in this network. A Multi-Level Communication Architecture of Smart Grid Based on Congestion Aware Wireless Mesh Network Zhang et al. (2011) identifies several control and processing devices associated with each of the above mentioned tiers. This includes the Smart Meter Data Controller (SMDC), Central Access Controller (CAC) and the EDS (Energy Distribution System).
The NIST Guidelines for Smart Grid NIST (2010) defines the cyber security requirements of a smart grid as confidentiality, integrity and availability. It also provides details as to what each of these requirements entail. In Petri Net Modeling of Cyber-Physical Attacks on Smart Grid Chen et al. (2011) the need to account for coordinated attacks in a smart grid is emphasized and a hierarchical Petri net (Scholarpedia, 2008) is suggested as a suitable modeling method for the same. It consists of one high level PetriNet that consists of most of the critical places (states of the system) and several low level Petri nets that contain details of the attack vectors. An aggregation method has also been suggested. However, this research work does not include any details of major attack vectors such as DDoS and FDI. It also does not provide an efficient data storage method. Toward modeling the impact of cyber-attacks on a smart grid, Kundur et al. (2011) provides a graph based impact analysis method. This involves modeling the energy infrastructure of the smart grid using a directed graph and then performing attacks on the same to identify the expected impact in the grid. This work gives an example of how to model a sensor tampering attack using such a directed graph system. A Cyber Physical Modeling and Assessment Framework for Power Grid Infrastructures Davis et al. (2015) provides the architecture for a CPMA framework which makes use of a threat model (attack tree), cyber topology and power topology to synthesize a Markov Decision Process analysis model for attacker infiltration in the network.
Machine learning in cyber security: A review Handa et al. (2019) describes several machine learning techniques that can be used for intrusion detection. In the case of SCADA systems one of the suggested methods of intrusion detection is by using a combination of k-means clustering and OC-SVM to identify anomalies in the system. This method is described to have good performance, low overhead and high accuracy. Another work in Anwar and Mahmood (2014) has analyzed how the storage security of Smart grid data storage can be compromised through malicious codes and unauthorized access. Zahid et al. (2019) propose a risk mitigation framework for Cyber physical systems with major focus on data integrity, authentication, nonrepudiation and confidentiality. Some of the methods of Intrusion Detection in a smart grid are Anomaly based and Signature based Ullah and Mahmoud (2017). In Association for Computing Machinery, a security framework is proposed based on Public Key Infrastructure (PKI) and asymmetric key encryption algorithms like RSA and El Gamal.
Through this literature review, we could see that researchers have analyze the different stages of cyber-physical coordinated attacks like attack detection, prevention, risk and impact analysis and recovery plans for the smart grid but there exist a research gap to address all the issues under a single framework.
Objectives and Challenges
The aim of this work is design a Cyber-Physical Defense Framework with a focus on communication layer and Distribution segment of smart grid infrastructure and to design a Cyber-Physical Defense Framework for the same. This framework is being proposed to model the cyber-physical coordinated attacks, perform impact and attack propagation analysis and map the security state of the system with mitigation and resilience plans that may involve self-organization of the system architecture so as to reduce the attack impact in the grid. This architecture would support renewable distributed energy resources (DERs) and migration from the existing traditional grid architecture. It must also integrate the multiple micro grids in the network and focus on how an aggregator can coordinate these multiple grids. This smart grid reference architecture would satisfy the following 3S conditions-
• Self Protect: This refers to protection of the smart grid from various attacks.
• Self Heal: This refers to ability of the smart grid to recover from an attack
• Self Optimize: This refers to the capability of the smart grid to increase efficiency and reduce wastage
Through this work, we focus on self-protection and a bit toward self-healing functionalities of the smart grid infra-structure. The Self-Optimization vertical is reserve as a future scope of this work.
Materials and Methods
Smart Grid Architecture Based on SGAM Framework
The legacy grid architecture makes use of non-renewable sources for the purpose of energy generation (CEN-CENELEC-ETSI, 2012). It also deals only with concentrated or centralized elements and structures and can only handle flexible generation and flexible loads. This smart grid architecture aims to encompass distributed elements such as Distributed Generators in order to progress from these conventional models. There is also a push toward more sustainable renewable sources of energy such as solar power and wind power. The model also deals with intermittent generation and inflexible loads such as hospitals. The proposed framework for achieving the various requirements will be based on certain aspects of the SGAM architecture. The focus will be on the Communication, Informational and Functional layers. The structure of these layers will be analyzed in the Domains of DER and Distribution, and the Process, Field and Station Zones. The functions that will be performed within the DER and Distribution domains have to first be identified. Based on this the information requirements necessary for this functionality can be determined and the relevant communication protocols can be allotted.
Component Layer
The component layer consists of the various components of the smart grid architecture. The Power Generation Unit (PGU) of the smart grid will consist of the power sources (renewable and non-renewable) and Intelligent Electronic Device (IED) units. In this reference architecture emphasis is placed on the need to move toward sustainable forms of energy generation through renewable resources such as wind and solar power. The Energy Control and Distribution Center is used to obtain consumption data from the various neighborhood of the smart grid and analyze the information before communicating with the PGU so as to generate the ideal amount of power as per demand. Each neighborhood will have its own control center for collection and processing data from individual homes. The individual homes will have a smart meter for collection of power consumption of data and a service interface that provides real time pricing details.
Functional Layer
The functional layer describes all the functions that have to be performed in the architecture. It should support the migration of existing legacy architecture to the new proposed reference architecture for smart grid. It should also contain functions that enable optimization, such as load forecasting for demand response, and should describe adequate methods for security and recovery purposes. For intelligently identifying the required energy that should be generated and distributed in an agile manner, with respect to the demand response of the grid, some type of machine learning algorithm can be used.
Information Layer
The informational layer deals with the data that has to be exchanged between the various components in order for the various functions at the functional layer to be performed. An example could be information related to the demand at a particular location that has to be sent so that the response can be adjusted accordingly. At this layer the data models for information transmission have to be determined. The data exchanged must be encrypted and authenticated to prevent misuse. In the proposed architecture this layer will be mapped to the Cyber Security Requirement for Smart City Model Framework, which is a framework concerning security requirements of data transfer in a smart city.
Communication Layer
The communication layer deals with the protocols used for transfer of data. Figure 2 shows the different networks required in the smart grid. Each of these layers will have corresponding agents to perform the necessary tasks and these layers will work together to ensure the proper working of the entire smart grid.
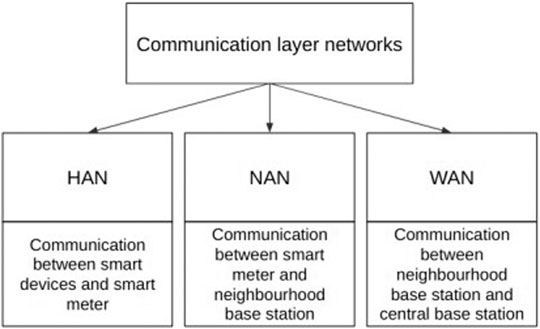
FIGURE 2. Different communication networks in the smart grid.
The domains dealt with are Distributed Energy Resources (DER) and Distribution. Here Distribution refers to the infrastructure that deals with distribution of electricity to the customer premises and DER refers to the small scale energy resources that are directly connected to the public grid. These energy re-sources are usually renewable forms of energy such as solar and wind. The zones present in the SGAM architecture describe functional partitions. The process zone involves all the functions related to the physical, chemical and spatial transformation of energy. The field zone involves the protection, control and monitoring of the energy system. The station zone involves features such as station automation and data concentration.
Smart Grid Communication Layer Framework
As we have covered the proposed structure to cover the 3S milestone of the CPDF. This section covers the HAN, NAN, and WAN component of the communication layer and the present state of the art about their inter communication.
In Figure 2, the overall communication framework is shown which is further explained in Figure 3, we can see the various components present in the WAN network. The NAN control center communicates information about each neighborhood to the Energy Control and Distribution Center, which in turn aggregates this data and communicates it to the Power Generation Unit. Using this data the power generation can be varied as per demand. The WAN network involves two-way communication across large distances (10–100 km). Communication can be through wired or wireless channels. For wired communication, fiber optics are a suitable option as they are more secure than other forms of communication and are not affected by electromagnetic interference. Installation of fiber optic lines is however an expensive task and hence we can instead make use of either Power Line Communication (PLC), which transfers data using the already existing power lines, or through some wireless means such as WiMAX Emmanuel et al. (2018), Zaballos et al. (2011), Zhang et al. (2011). The Data Aggregation Unit (DAU) of the Energy Control and Distribution Center aggregates data from the various neighborhood control centers. This data is then analyzed by the SCADA controller and the required information is passed on to the IEDs of the Power Generation Unit. In Figure 3, we can also see the structure of the NAN network, which involves communication between the NAN control center, the HAN, and the DERs. We can also see the internal HAN structure, which involves communication between the smart meter and the smart devices and interfaces present in the user’s home. The NAN network can make use of the same communication technology options that can be used in the WAN. In the HAN, communication between smart devices and the smart meter can be achieved through wireless communication methods in order to ensure mobility of the smart devices. ZigBee is a low cost, low power protocol that can be used. ZigBee is based on the IEEE 802.15.4 standard Zafar et al. (2015). It also uses Advanced Encryption Standard (AES) to ensure security. Authors in Garg et al. (2020) proposed a key agreement protocol based on mutual authentication. This protocol works for the communication between Smart Meter (SM) and the NAN gateway in bidirectional manner. Authors established that this is light weight, less energy consuming and successful in preventing most of the common attack like FDI, Replay and DoS. In another work, authors Aghapour et al. (2020) proposes a more secure protocol for broadcast authentication on the basis of hash function (one way). This protocol is shown of being capable to block some common attack scenario and also computationally and storage wise less expensive.
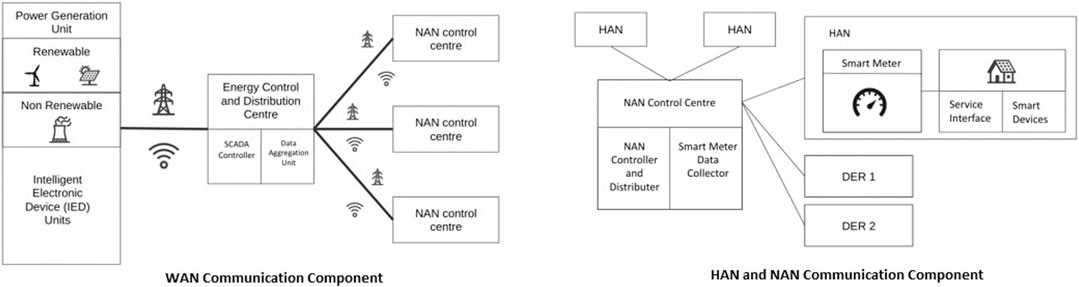
FIGURE 3. WAN, HAN and NAN layout.
Proposed Methodology
This section would cover our proposed cyber physical defense framework (CPDF) and the modeling of cyber physical co-ordinated attack as well as the impact analysis of the post attack scenario adhering to the NIST guidelines Barrett (2018).
Cyber Physical Defense Framework (CPDF)
The list shows the components of the Cyber Security Defense Framework. The Petri net attack modeling consists of the previously mentioned hierarchical Petri nets consisting of identifiable and commonly occurring attacks in the smart grid.
1. State Estimator (Detection)
2. Protection Mechanism
3. Petri-Net Attack modeling
4. Cyber Physical Topology
5. MDP for System Control Properties
6. Response and Recovery Mechanism
The Cyber Physical Topology of the system can be constructed in a graphical form Kundur et al. (2011) so that simulations and attack impacts can be analyzed. The attack vectors can be obtained from the Petri-net and can be followed for impact analysis. A sample of such a cyber-physical topology is shown in Figure 4, where the rectangular nodes represent the cyber components such as Control Center (CC) and Smart Meter (SM), the circles represents the physical power components such as Generator (G) and Distributor (D), and the dashed rounded rectangle indicates the attacker.
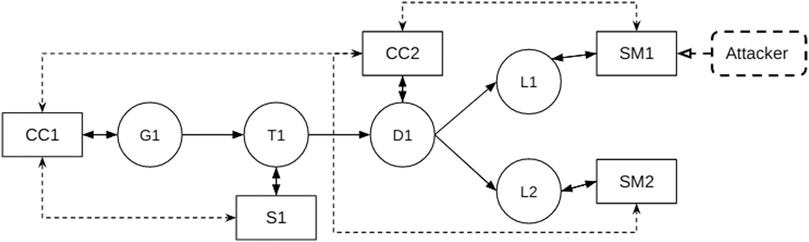
FIGURE 4. Sample cyber-physical topology.
The system designer can make use of the Cyber-Physical Topology to estimate the amount of damage that an attacker can cause if they have control over a particular system. In Figure 5 we can see the flow chart containing the steps involved in the construction of the CPDF for the complete control propagation of the attacker and how the system will respond and recover itself once the attack happen.
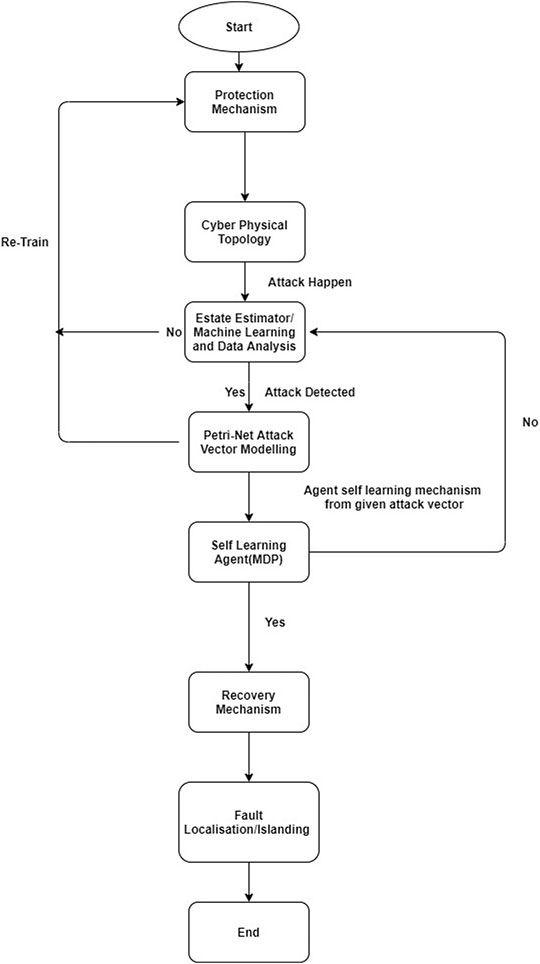
FIGURE 5. Flow chart for cyber physical defense framework.
Attack Detection and Mapping
In Figure 6 we can see the flow chart for attack detection and mapping. Here the state estimator, which consists of IDS and malware detectors will identify if an attack is taking place or if some node is compromised. The IDS can initially consist of anomaly based intrusion detection systems and when a confirmed attack has occurred, signature based schemes can also be incorporated for common attacks.
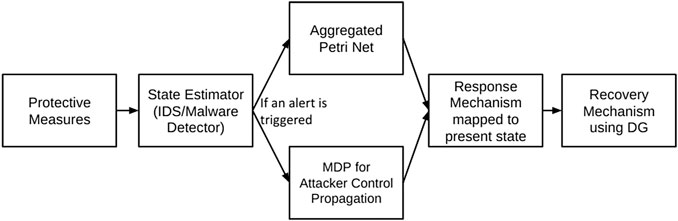
FIGURE 6. Flow chart for attack detection and mapping.
If an attack is taking place then the Petri-net is used to identify the next steps the attacker will take and other concurrent attacks that may be possible. If a compromised node has been detected then the MDP is used to identify the most vulnerable systems that the attacker may choose to attack. Based on the Petri-net place and MDP state a mapping to the Protection, Response and Recovery mechanisms is present in order to mitigate the attack.
Evaluation of CPDF Against DDoS and FDI Attack Detection and Mitigation
This section represents the evaluation of or proposed framework for the two attack categories as DDoS and FDI. Both of the attack categories have been analyzed through each phases of the NIST framework NIST (2010) i.e., identify, protect, detect, response and recover (Table 1). For the sake of simplicity, we have implemented DDoS using Botnet and spoofed IP and FDI using variation in power consumption values either too low or too high. To show the effectiveness of framework, we have also taken case study on IEEE 9-bus and 14-bus system. On both the simulations, we performed FDI attack by altering the voltage and phase angle values and detect attack using machine learning algorithm.
DDoS Detection and Mitigation
DoS and DDoS are the attack category that significantly attract researchers attention due to it’s service impacting behavior. Some researcher like Vijayanand et al., investigate this attack by analyzing the traffic generated from Smart Meter (SM) Vijayanand et al. (2019). However the current research trend is shifted more toward machine learning based detection techniques for example, Prasad et al., proposed multi-SVM Prasad et al. (2019) and Musleh et al., presented data driven approach Musleh et al. (2019). Inspired from these work, we are focusing on OC-SVM as an techniques that is a variant of SVM for the detection of this attack.
Identify
A DDoS attack is an attack where the attacker makes use of multiple sources to render the host network unavailable, thereby disrupting service for regular users. Over 65% of DDoS attacks are volumetric attacks which are performed by overloading the target with unnecessary requests Cao et al. (2018). The PetriNet modeling of this attack is represented by Figure 7. In a smart grid the availability of information and power is critical for proper functioning. Outdated information can adversely affect the demand and can even lead to legal implications Mo et al. (2011). If the information flow is completely blocked then the power generation station will not have access to the power needs, thus resulting in either blackouts or excessive power generation. This model will deal with only volumetric DDoS attacks. Two of the many ways in which this can be implemented are using Botnets and Spoofed IP addresses.
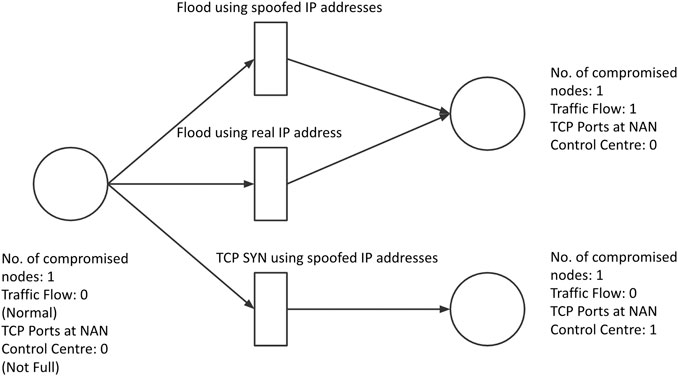
FIGURE 7. DoS Attack Vector using Petri Net.
Protect
We can make use of some of the previously mentioned protective methods to ensure protection.
1. Restricting Size of Data:
To prevent attackers using reflection attacks or botnets from requesting or sending unreasonably large amounts of data, such as historic power consumption data from smart meters, restrictions on the size of data requests and responses can be imposed in the smart grid communication network.
2. Load Balancing of Servers:
In the event of a DDoS attack load balancing can be used to reduce the impact on both the NAN center server and the WAN center server. Specht and Lee (2003).
3. Channel hopping on wireless network:
This is a security measure to prevent jamming from occurring on any particular wireless frequency channel. By channel hopping the connectivity in the network can be maintained and regular communication can take place.
4. Security measures to ensure that an attacker cannot gain control of a smart meter, NAN Center or WAN Center:
This includes the previously mentioned encryption, authentication, integrity and key exchange methods.
5. Ingress Filtering:
Ingress filters are used to ensure that the packets are actually originating from the network that they claim to be coming from.
6. Firewalls:
Firewalls can be used to filter the packet flow of the network and prevent unauthorized access from outside.
Detect
To detect a DDoS attack in a network we can make use of anomaly based machine learning techniques. This means that the training data used can be of normal network traffic data and the classification model is built on this. If any input does not conform to this model it is considered an anomaly. We use One Class Support Vector Machine (OC-SVM) for this purpose (PLOS; Gawande, 2018; Handa et al., 2019).
A Support Vector Machine (SVM) is a classification tool that constructs multidimensional hyperplanes to classify labeled data. Let the training data be the set {X, Y}. Here X is the data used for training and Y is the label denoting the class that the particular entry belongs to. In certain cases it may be possible to linearly separate the data into two classes, however in more complex cases it is necessary to transform this data to a higher dimension in order to separate it. This can be performed by using the kernel trick technique Φ: x → φ(x). The separating hyperplane can thus be represented as wTφ(x) + b = 0.
OC-SVM is a variation of SVM which is used to detect anomalies. The training data consists of only one class of data, and the model is created based on this. Any input that does not fit this model is considered an anomaly. To determine the separating hyperplane we need to solve the following quadratic programming problem:
On solving this the separating hyperplane will be obtained and anomalies can be identified using the same.
In the smart grid if we take the NAN into account, packets will either be sent from the control center to any of the smart meters, or from any smart meter to the control center. The pattern based on the number of packets and the size of each packet in both of these flows may vary a lot. Hence it is recommended that two SVM models are generated, one for all network flow to the control center and one for all network flow to the smart meters.
For the training of the OC-SVM we will need training data from the smart grid over several periods of time. Let the collection time period be tp and the total number of such periods required be Np. This means that each entry in the training data table is a compilation of certain features of the network traffic in time tp. Np is the number of entries in the training data table.
Response
Once a possible attack has been detected using the earlier mentioned OC-SVM method, measures must be taken to stop the attack. This involves identifying the packets of malicious origin and blocking the senders of the same. We are taking into account attacks using both spoofed IP addresses as well as botnets.
The firewall parsing rules will prevent certain IP addresses from accessing the servers which could reduce the impact of spoofed IP address attacks. We can also make use of ingress filtering Mahajan and Sachdeva (2013) to ensure that packets are actually coming from the network that they claim to be coming from.
If the DDoS attack is being caused by botnets present in the smart grid network then we can again make use of an anomaly detection algorithm like OC-SVM to detect which IP addresses are sending unusually high data. The difference between this and the previously mentioned detection method is that here we consider each individual sender’s flow data separately and determine whether it is an anomaly or not. Once the anomalies have been detected these IP addresses can be temporarily blocked to try and restore the functioning of the grid.
This method however will not work in largely distributed attacks as individual source IP addresses will not send an unusually high number of packets. Hence, we need to modify the network architecture in order to establish communication throughout the smart grid. This can be done by incorporating a self organizing architecture Cameron et al. (2019) into the smart grid. This involves identifying substitute aggregation units or NAN control centers for the smart meters in advance, having dormant NAN control centers that can be used in the event of a DDoS attack, and upgrading some smart meters to aggregation units that can communicate with the central control center.
Recover
While attack mitigation is in place it is necessary to maintain power generation and distribution as well as price estimation. Since during a DDoS attack the power generation unit will not be able to obtain usage information it will have to base the power generation rates on the average power generation at that particular time over the past week. This provides a rough estimate of how much power should be generated. And since the electricity price cannot be transmitted through the network to the customers, we make use of the fact that initially when joining the smart grid the customer would have registered their details with the smart grid.
These details would include the customers mobile number. Hence the pricing information can be calculated using the average of the previous week and this information can be sent to the customer through an SMS. This method is a temporary bypass to the regular functioning of the smart grid and is only implemented when communication is not possible due to a DDoS attack.
However, if this is also not possible due to congestion in the distribution systems or due to some concurrent physical attack that cuts some power flow lines then we can make use of Distributed Generators for maintaining the power flow. This requires minimizing the islanding in the grid and this can be determined in advance by making use of some method similar to the Tri-level optimal hardening plan Lin and Bie (2018). This is a generalized recovery method that can be used in the event of any attack as it provides temporary independence to different parts of the grid so that they can self-recover even when the grid is not functioning properly.
FDI Detection and Mitigation
FDI attack is generated in SG system by means of altering the values relate to voltage, phase angle or power corresponding to one or more buses. Researchers tried different way of creation and later on detection techniques for the FDI attack. Nawaz et al. generated a Logical Regression based FDI attack for the state estimation mechanism of the SG. The model is implemented using IEEE 5-bus system Haque et al. (2020). Another work given by Ahmadian et al. generate false data using a Generative adversarial Network in Ahmadian et al. (2018). In this work, Generator Network (GN) is responsible for creating the data analogous to real situation (attacker) and Discriminator Network (DN) is used to check the generated data is fake or not.
Identify
FDI attacks involve the injection of false data through the use of a compromised sensor in order to manipulate the functioning of the smart grid. Such false data could cause either surges or reductions in power output, each of which poses a problem to the entire system. The compromised node could be a smart device, a smart meter, a NAN control center or any other component of the smart grid that either collects or processes data. The easiest target would be components in the HAN, with components in the WAN being the hardest for an attacker to take control of. The PetriNet modeling of this attack can be as Figure 8. As an example we can consider two possible methods of manipulation of the data, the first would be when the attackers send a much smaller sensor value than the actual value, and the other would be where the attackers send a much higher value than the actual sensor value.
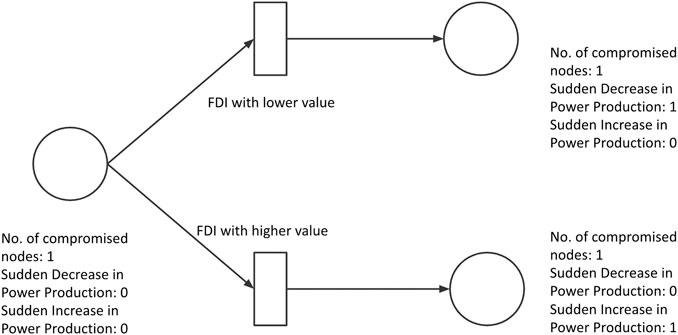
FIGURE 8. FDI attack aector using Petri Net.
Protect
In order to protect the smart grid system from a potential FDI attack it is necessary to improve the protective measures on individual components of the system. This involves making use of the previously mentioned protective measures, such as ensuring that sensitive data is encrypted using a cryptographically secure method, and utilizing secure key exchange methods in order to enable decryption of this data. Physical security measures to prevent tampering of the components should also be ensured.
In addition to this, best practice measures such as frequently changing passwords on smart devices and smart meters, and keeping anti-virus softwares updated on all these devices should be followed by all the consumers. These protective measures should already be in place as a first line of defense in the event of a cyber attack. The detection, response and recovery measures can be utilized in the event that the attacker is able to bypass the protective measures.
Detect
For the detection of an FDI attack we need to identify anomalous surges or reductions in power consumption requests. Since the average power consumption may vary based on factors such as location (urban/rural) and type (Residential/Commercial), we cannot use just one anomaly detection model for all consumers. Hence we need to first classify consumers into groups based on their average consumption. We can make use of k-means clustering to classify consumers on the basis of their consumption pattern Damström and Gerlitz (2016). This iterative algorithm is used to classify the data into k distinct subgroups in an unsupervized manner. The aim of this algorithm is to minimize the pairwise squared deviation of points in a cluster, i.e., the objective function is the following (K-Means Clustering, 2021):
Here, k is the number of clusters, ki is the number of points in cluster i, µi is the mean of points in cluster i and xj is the jth point in cluster i. Once we cluster the consumers, we can again make use of anomaly detection techniques such as OC-SVM to identify potential attacks. In the overall smart grid network this anomaly detection approach can be applied on individual NAN control centers instead of the WAN control centers in order to provide a more distributed detection measure Xue et al. (2019).
Response
The ideal response to an FDI attack is to identify the node where the falsified data is originating from. Once the attack is detected using anomaly detection algorithms we can narrow down on the source of the attack, be it an individual smart meter, or a control center. In the case of individual smart meters, an e-notice could initially be sent to the corresponding consumer raising an alarm and requiring them to confirm this usage using their smart meter password. In the complex situation like coordinated cyber physical attack, Tian et al., proposed countermeasures in SG based on Multilevel Programming Tian et al. (2019).
Recover
Once it has been identified that a certain NAN Control Center or Smart Meter has been compromised then it is essential to estimate the consumption levels and accordingly generate power. The previous modeling of consumption levels can be utilized for this estimation Xue et al. (2019). Meanwhile appropriate resets of security features must be done in order to revoke the access that the attacker has to a component in the network. This includes resetting any keys that are used for the secure transportation of information.
Experiments and Results
The implementation of the aggregation algorithm for Petri nets, DDoS IDS using OC-SVM and FDI IDS using k-means and OC-SVM have been performed to highlight the benefits of the Framework.
Hierarchical Petri Net
Figure 9 shows two low level Petrinets, one high level Petri net and the aggregated Petri-net. The numbering on the 2 low level Petri-nets, the high level Petri-nets and the aggregated Petri-net do not necessarily match. This is due to the fact that different domain experts may make use of different numbering mechanisms. To represent the state of a place in the Petri-network make use of individual characters.
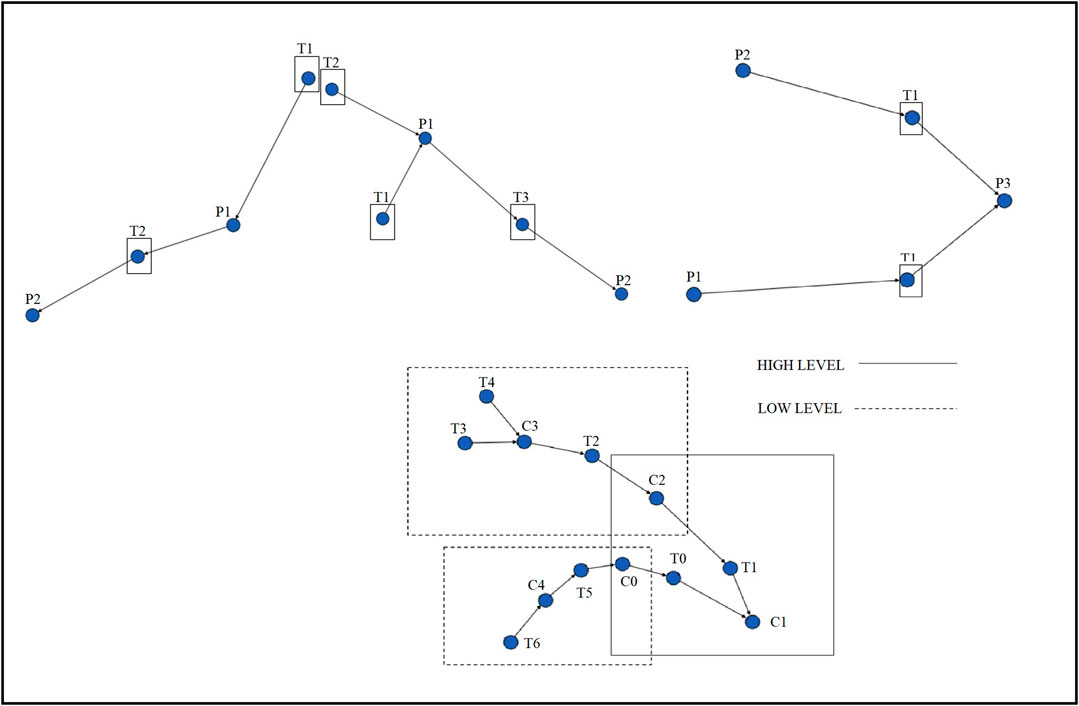
FIGURE 9. Low, high and aggregated petri nets.
So we can represent (Power = On)∧(CryptographicKeys = Secure) as ’00’, (Power = On)∧(CryptographicKeys = Insecure) as ’01’ and so on. This is so that the amount of storage required is minimum and the places of different Petri-nets can easily be mapped with each other. This method of storing the states as a stream of characters is a modification to the original work by T. Chen et al.
Chen et al. (2011), which involved storing the variable values in an array. Thus the aggregation method presented in this work is more optimal in terms of storage.
DDoS Detection Using OC-SVM
In Figure 10 we can see the resulting hyperplane obtained after using the training data, which consists of no. of packets per minute on the X-axis and average size of packet in that minute on the Y-axis. The data was obtained by taking into account the average message size in a smart grid Andreadou et al. (2018) and regular network traffic (Kaggle IP Network Traffic Flows Labeled with 75 Apps). The data was trained using the OC-SVM algorithm in the Python sklearn library. The kernel used was Radial Basis Function (RBF) which is given by Eq. 3.
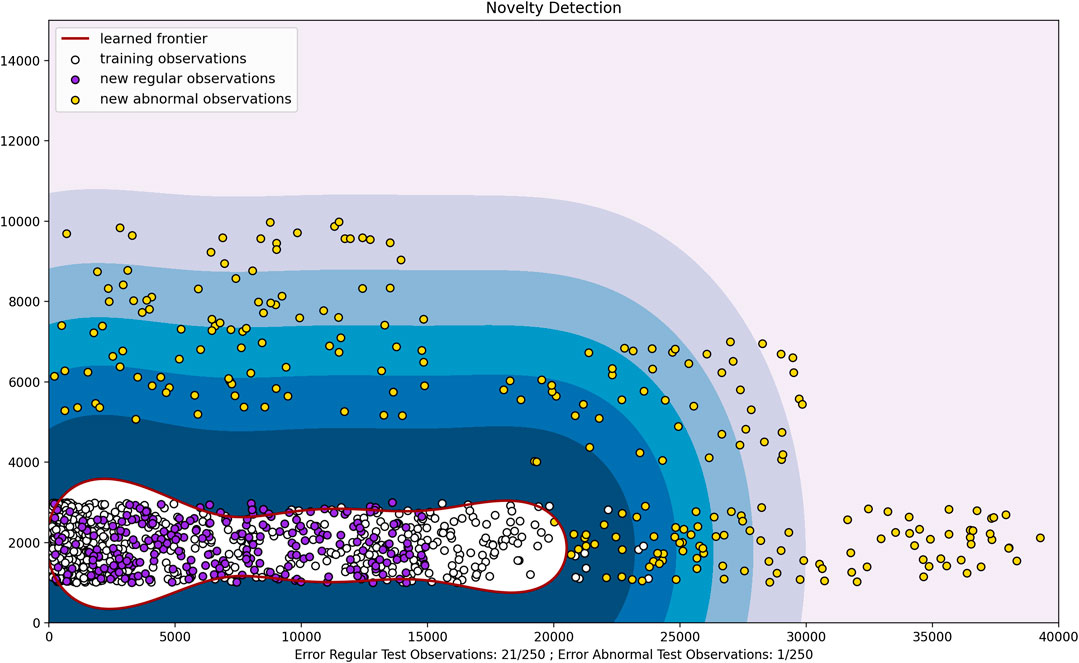
FIGURE 10. Output plot for OC-SVM.
The RBF kernel is the default kernel used in the python sklearn library. The γ value was set to “scale” for training and testing, which is the default value of γ. γ determines how far the influence of a single training example reaches, i.e., if it is a low value it reaches quite far RBF (Scikit-Learn). The nu value passed to the OC-SVM is 0.05. This provides a bound on the percentage of outliers that are not taken into account. This means that very large values of nu can lead to overfitting of data.
FDI Detection Using K-Means and OC-SVM
FDI detection using k-means and OC-SVM has also been implemented as part of the state estimator in the Cyber Physical Defense Framework.
Here we take the hourly power consumption (Kaggle) of various households into account and check to see if any anomalous consumption is present. Since different households (or industries) may on average use drastically different amounts of power we should first apply the k-means algorithm to the training data in order to cluster users with similar consumption patterns together. This is depicted in Figure 11. The x-axis and y-axis show the energy consumption of the user and the time (in 24 h format). Once we have clustered these users we can create an OC-SVM for each cluster and identify anomalies in the same way we identified them in the above mentioned DDoS detection method. The γ value used for training and testing purposes is 0.000001. The nu value passed to the OC-SVM is 0.1.
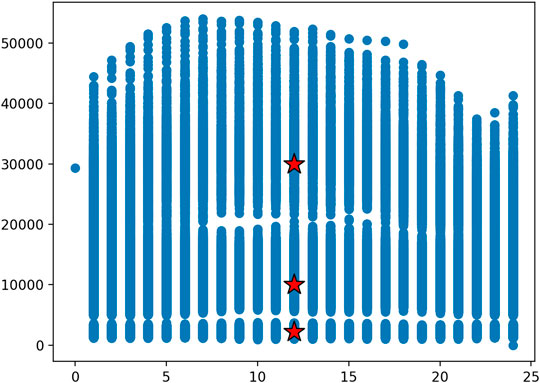
FIGURE 11. K-means clustering on sample data.
As we can see in Figure 12 and Figure 13, the resulting hyperplane encapsulates the normal test data with a 96.7 and 93.1% accuracy respectively. The abnormal power rates have also been identified correctly with 96.9 and 99.7% accuracy. Here the anomalous data is generally power consumption rates that are higher than the normal rates, and the normal rates included in the hyperplane are fairly low. Hence this is comparable to residential areas where consumption is generally low, but an attacker may inject fake high consumption data in order to disrupt the system.
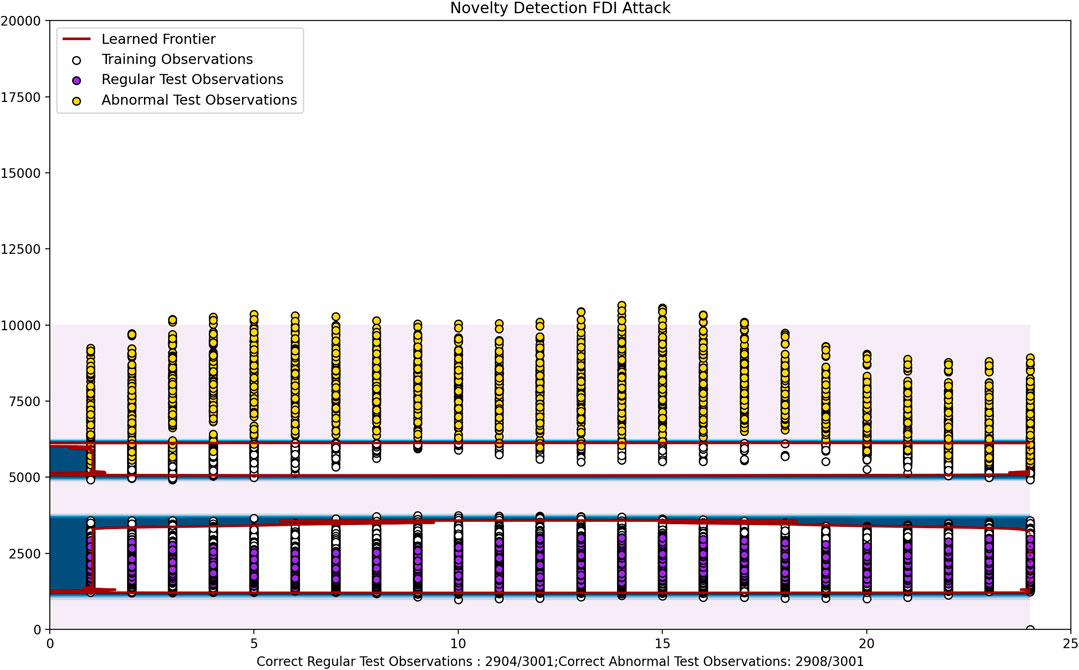
FIGURE 12. OC-SVM on first cluster.
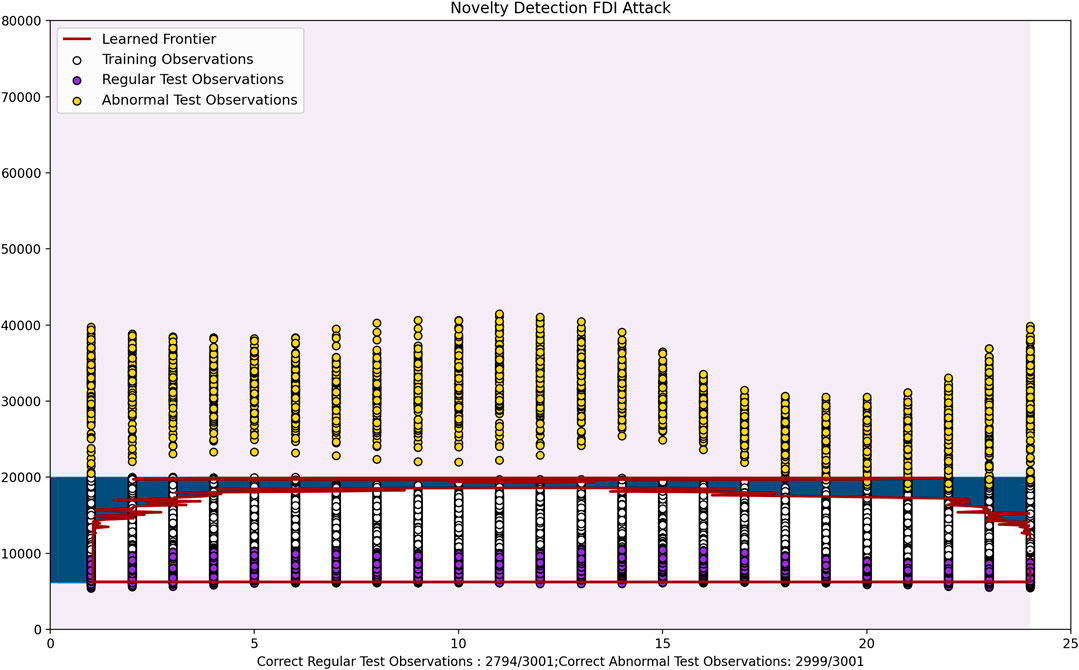
FIGURE 13. OC-SVM on second cluster.
In Figure 14 the training and regular test power consumption values are relatively high. Hence this is comparable to industries that have huge power consumption rates. Here the regular test observations have been correctly predicted with a 93.8% accuracy and the abnormal test cases have been predicted with a 95.2% accuracy. Here the attacker may inject false data claiming that the required power is much lower than the actual power consumption level. Here, hourly data has been taken into account due to the fact that this affects consumption levels by a lot. For example in certain industries the power consumption levels may drop significantly at night, while remaining high during the day.
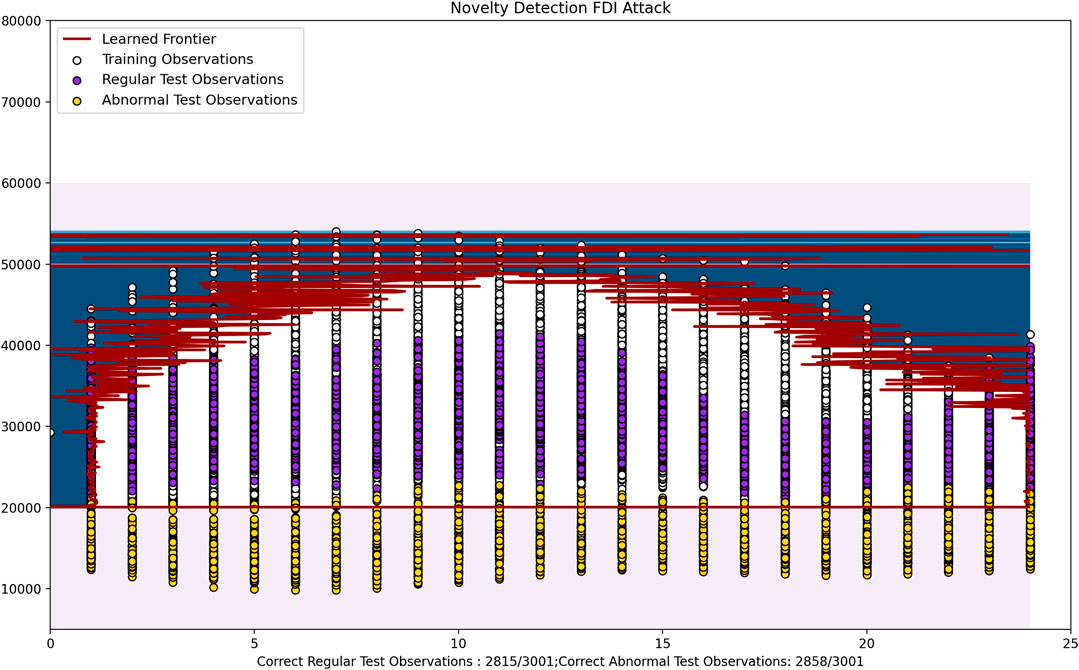
FIGURE 14. OC-SVM on third cluster.
Case Study for FDI Attack on IEEE 9-Bus and 14-Bus
FDI attack can pe performed on different domains of SG, e.g., advanced metering infrastructure, distribution systems, transmission systems, etc., Liu and Li (2017). In the present case study, we performed FDI attack on the voltage and phase angle values in the IEEE-9, 14 bus system as in Figure 15. The attack model has pre assumption that a malicious activity is performed to change physical data, e.g., currents, voltages and phase angles, as an information flow by the SCADA and therefore inject FDI attack. In order to do so, it is assumed that adversary has prior knowledge of the partial topology so the either attacker hacked the control databases or may be a trusted insider. Attack scenario also assumes that while performing the attack simulation throughout, the same two buses are targeted, implies the situation as a targeted attack in contrast to a random attack. The FDI attack may also be performed through compromising the communication channels to decipher and alter the network packets but this is out of scope of the present case study. We have taken IEEE 14-bus standard simulation with 11 loads and five generators (UWEE) as a use case to test the proposed framework. The simulation is performed using MATPOWER Zimmerman et al. (2010) toolbox. The faulty data (measurement vector) is generated at 10 s intervals. We have performed the attack on for example, at Bus 5 (on line 5->4 and 7->5) and records the measured magnitudes and phase angles of the voltage phasor v5 and the current phasors i75 and i54. For each measurement vector, 28 electrical measurements such as the magnitudes related to voltage and current are recorded. This simulation generates around 12,000 groups of measurement vectors, which contains about 3,300 of those contingency values. The result in term of FPR and FNR metric can be seen as represented in Table 2.
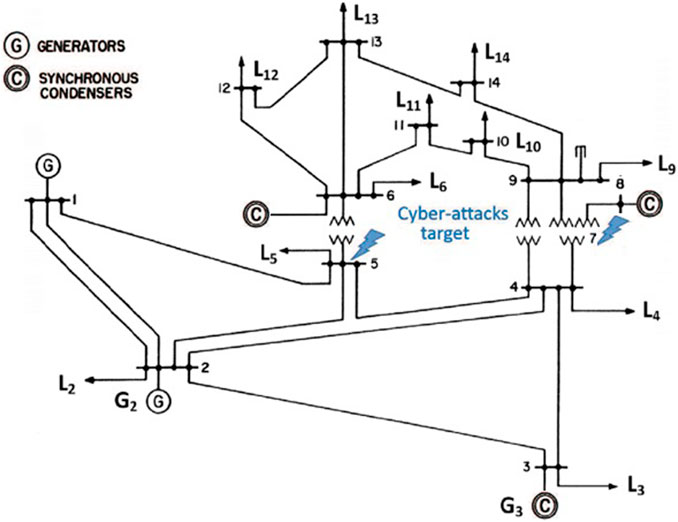
FIGURE 15. FDI attack on Bus 5,7 on IEEE 14-bus.
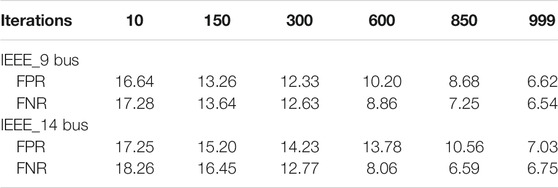
TABLE 2. Performance of One Class Support Vector machines on Data-set (IEEE 9-bus and 14-bus).
Discussion and Future Directions
The framework and architecture given in this work provides a standardized method of designing a smart grid. However since the broader details had to be taken into account some of the smaller scale optimizations could not be analyzed. Hence to take this research work to the next level it would be ideal to optimize these aspects and identify more suitable measures at an individual attack level rather than at a broad attack prevention/detection level.
This work provides an analysis of the individual cyber security framework steps. In the future, in order to expand the understanding of how the different aspects work together in a practical manner, all the components can be tested together using a simulated smart grid environment. In continuation to this, to focus more on the self heal property of SG, we will try to work and explore the efficient use of reinforcement learning methods. Through this technique, we will train an agent to detect the attacks as soon as they start (not later, not earlier) to avoid significant damage to the grid. For this to happen, we have four possible scenarios that are the consequences of our agents’ actions.
1. The agent stops the simulation before the attack begins
2. The agent stops the simulation after the attack begins
3. The agent does not stop the simulation after the attack begins
4. The agent does not stop the simulation before the attack begins
In the above 4 consequences, 2 and 4 are the intended actions and 1 and 3 are the unintended ones.
Conclusion
In this work, a basic architecture has been identified for the smart grid infrastructure, which takes into account some of the most optimal existing architectures such as SGAM CEN-CENELEC-ETSI (2012) and 3M Lu et al. (2019), and determines how these can be incorporated to provide a better smart grid architecture that takes into account a wider variety of needs. With a heavy focus on certain layers or levels of these architectures, this work presents a more detailed look at the communication and security methods that can be used to provide a safer, secure and more efficient architecture. By combining various architectures we obtained the best aspects of each of them.
The Cyber Security Defense Framework that has been designed in this work is a one of a kind framework that identifies the different mechanisms that have to be in place in order to take into account all steps of the NIST NIST (2010) Framework, namely-Identify, Protect, Detect, Response and Recover. The CSDF provides broad modeling methods that can be used to safeguard against potential cyber attacks. It makes use of features such as Petri Nets and Cyber-Physical Topology to provide a mapping of the system state to the required defense mechanisms. These methods used have been selected by analyzing research works specific to each of these NIST steps and identifying the best approach at each step. Thus a combination of these individual best approaches will provide an appropriate and optimal overall framework. This framework can then be personalized based on the specifics of the smart grid infrastructure it is aiming to protect. The working of this framework has been highlighted through two attacks-DDoS and FDI.
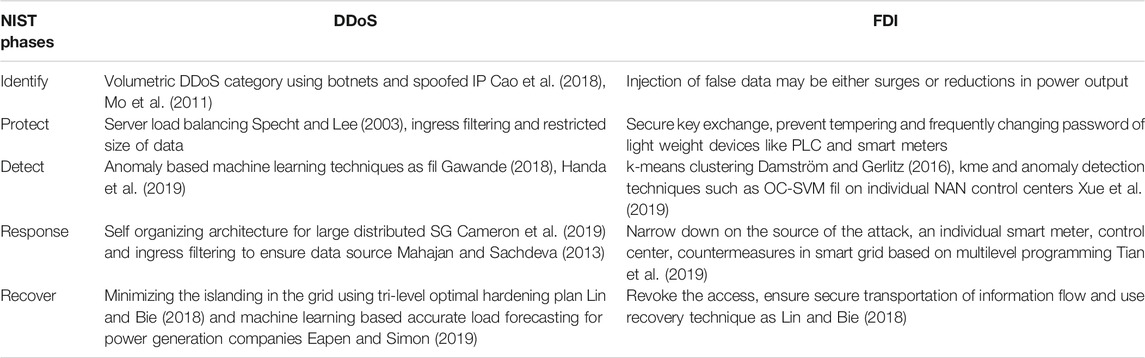
TABLE 1. NIST phases for DDoS and FDI attack category.
Data Availability Statement
The raw data supporting the conclusions of this article will be made available by the authors, without undue reservation.
Author Contributions
Conceptualization and Investigation: AS. Software and validation: MM. Supervision and Writing-review and editing: PP and OV.
Funding
Funder–Research Council of Norway Grant No.: 280617, CPSEC.
Conflict of Interest
The authors declare that the research was conducted in the absence of any commercial or financial relationships that could be construed as a potential conflict of interest.
Acknowledgments
We acknowledge Department of Science and Technology (DST), India for CPSEC project under Smart Environments theme of Indo-Norwegian Call.
Abbreviations
CAC, Central Access Controller; CC, Control Center; C.I., Critical Infrastructures; CPDF, Cyber Physical Defense Framework; CPS, Cyber-Physical Systems; D, Distributor; DAU, Data Aggregation Unit; DDoS, Distributed Denial of Service; DER, Distributed Energy Resources; FDI, False Data Injection; G, Generator; ICT, Information and Communication Technology; IED, Intelligent Electronic Device; NIST, National Institute of Standards and Technology; OC-SVM, One Class Support Vector Machine; PGU, Power Generation Unit; PLC, Power Line Communication; SGAM, Smart Grid Architecture Model; SM, Smart Meter; SMDC, Smart Meter Data Controller
References
Aghapour, S., Kaveh, M., Martín, D., and Mosavi, M. R. (2020). An ultra-lightweight and provably secure broadcast authentication protocol for smart grid communications. IEEE Access 8, 125477–125487. doi:10.1109/ACCESS.2020.3007623
Ahmadian, S., Malki, H., and Han, Z. (2018). “Cyber attacks on smart energy grids using generative Adverserial networks,” in 2018 IEEE Global Conference on Signal and Information Processing (GlobalSIP), Anaheim, CA, 26-29 Nov, 2018, 942–946.
Andreadou, N., Kotsakis, E., and Masera, M. (2018). Smart meter traffic in a real LV distribution network. Energies 11, 1156. doi:10.3390/en11051156
Anwar, A., and Mahmood, A. N. (2014). Cyber security of smart grid infrastructure. preprint: arXiv:1401.3936.
Babar, M., and Nguyen, P. (2018). “Analyzing an agile solution for intelligent distribution grid development: a smart grid architecture method,” in 2018 IEEE Innovative Smart Grid Technologies-Asia (ISGT Asia), Singapore, 22-25 May, 2018 (IEEE), 605–610.
Babar, M., Nyugen, P. H., Cuk, V., Kamphuis, I. G. R., Bongaerts, M., and Hanzelka, Z. (2016). The rise of AGILE demand response: enabler and foundation for change. Renew. Sustain. Energy Rev. 56, 686–693. doi:10.1016/j.rser.2015.11.084
Barrett, M. P. (2018). Framework for improving critical infrastructure cybersecurity. Gaithersburg, MD: National Institute of Standards and Technology.
Cameron, C., Patsios, C., Taylor, P. C., and Pourmirza, Z. (2019). Using self-organizing architectures to mitigate the impacts of denial-of-service attacks on voltage control schemes. IEEE Trans. Smart Grid 10, 3010–3019. doi:10.1109/tsg.2018.2817046
Cao, Y., Gao, Y., Tan, R., Han, Q., and Liu, Z. (2018). Understanding internet DDoS mitigation from academic and industrial perspectives. IEEE Access 6, 66641–66648. doi:10.1109/access.2018.2877710
CCC, . Support vector machines and one-class support vector machines. Available at: https://journals.plos.org/ plosone/article/file?type=supplementary&id=info:doi/10.1371/journal.pone.0166868.s002 (Accessed 09 11, 2020).
Chen, T. M., Sanchez-Aarnoutse, J. C., and Buford, J. (2011). Petri net modeling of cyber-physical attacks on smart grid. IEEE Trans. Smart Grid 2, 741–749. doi:10.1109/tsg.2011.2160000
Damström, J., and Gerlitz, C. (2016). Classification of power consumption patterns for Swedish households using k-means. Available at: https://en.wikipedia.org/wiki/K-means_clustering (Accessed 09 12, 2020). k-means clustering–Wikipedia
Davis, K. R., Davis, C. M., Zonouz, S. A., Bobba, R. B., Berthier, R., Garcia, L., et al. (2015). A cyber-physical modeling and assessment framework for power grid infrastructures. IEEE Trans. Smart Grid 6, 2464–2475. doi:10.1109/tsg.2015.2424155
Eapen, R. R., and Simon, S. P. (2019). Performance analysis of combined similar day and day ahead short term electrical load forecasting using sequential hybrid neural networks. IETE J. Res. 65, 216–226. doi:10.1080/03772063.2017.1417749
Emmanuel, M., Seah, W. K., and Rayudu, R. (2018). “Communication architecture for smart grid Applications,” in 2018 IEEE Symposium on Computers and Communications (ISCC) (IEEE), 00746–00751.
Garg, S., Kaur, K., Kaddoum, G., Rodrigues, J. J. P. C., and Guizani, M. (2020). Secure and lightweight Authentication scheme for smart metering infrastructure in smart grid. IEEE Trans. Ind. Inf. 16, 3548–3557. doi:10.1109/TII.2019.2944880
Gawande, A. R. (2018). DDoS detection and mitigation using machine learning. PhD thesis. Newark (NJ): Rutgers University-Camden Graduate School.
Guide books. Cryptography and network security. Available at: https://dl.acm.org/doi/book/10.5555/1209579 (Accessed 09 12, 2020).
Handa, A., Sharma, A., and Shukla, S. K. (2019). Machine learning in cybersecurity: a review. WIREs Data Mining Knowl Discov. 9, e1306. doi:10.1002/widm.1306
Haque, N. I., Shahriar, M. H., Dastgir, M. G., Debnath, A., Parvez, I., Sarwat, A., et al. (2020). Machine learning in generation, detection, and mitigation of Cyberattacks in smart grid: a Survey. preprint: arXiv:2010.00661.
He, H., and Yan, J. (2016). Cyber‐physical attacks and defences in the smart grid: a survey. IET cyber-phys. syst. 1, 13–27. doi:10.1049/iet-cps.2016.0019
Kaggle Hourly energy consumption | Kaggle. Available at: https://www.kaggle.com/robikscube/hourly-energyconsumption (Accessed September 12, 2020).
Kaggle IP network traffic flows labeled with 75 Apps | Kaggle. Available at: https://www.kaggle.com/jsrojas/ip-networktraffic-flows-labeled-with-87-apps (Accessed September 12, 2020).
K-Means Clustering (2021) En.Wikipedia.Org. Available at: https://en.wikipedia.org/wiki/K-means_clustering.
Kundur, D., Feng, X., Mashayekh, S., Liu, S., Zourntos, T., and Purry, K. L. B. (2011). Towards modelling the impact of cyber attacks on a smart grid. Int. J. Netw. Secur. 6, 2–13. doi:10.1504/ijsn.2011.039629
Lin, Y., and Bie, Z. (2018). Tri-level optimal hardening plan for a resilient distribution system considering reconfiguration and DG islanding. Appl. Energy 210, 1266–1279. doi:10.1016/j.apenergy.2017.06.059
Liu, X., and Li, Z. (2017). False data attack models, impact analyses and defense strategies in the electricity grid. Electr. J. 30, 35–42. doi:10.1016/j.tej.2017.04.001
Lu, X., Hinkelman, K., Fu, Y., Wang, J., Zuo, W., Zhang, Q., et al. (2019). An open source modeling framework for interdependent energy-transportation-communication infrastructure in smart and connected communities. IEEE Access 7, 55458–55476. doi:10.1109/access.2019.2913630
Ma, C. Y. T., Yau, D. K. Y., and Rao, N. S. V. (2013). Scalable solutions of Markov games for smart-grid infrastructure protection. IEEE Trans. Smart Grid 4, 47–55. doi:10.1109/tsg.2012.2223243
Mahajan, D., and Sachdeva, M. (2013). DDoS attack prevention and mitigation techniques - a review. Int. J. Comput. Appl. 67, 21–24. doi:10.5120/11504-7221
Mo, Y., Kim, T. H. J., Brancik, K., Dickinson, D., Lee, H., Perrig, A., et al. (2011). Cyber–physical security of a smart grid infrastructure. Proc. IEEE 100, 195–209. doi:10.1109/JPROC.2011.2161428
Musleh, A. S., Chen, G., and Dong, Z. Y. (2019). A survey on the detection algorithms for false data injection attacks in smart grids. IEEE Transactions on Smart Grid 11, 2218–2234. doi:10.1109/TSG.2019.2949998
NIST (2010). U. Guidelines for smart grid cyber security: volume 1-smart grid cyber security Strategy, architecture, and high-level requirements. Gaithersburg, MD: US NIST.
Prasad, G., Huo, Y., Lampe, L., and Leung, V. C. (2019). “Machine learning based physical-layer intrusion detection and location for the smart grid,” in 2019 IEEE International Conference on Communications, Control, and Computing Technologies for Smart Grids (SmartGridComm), Beijing, China, 21-23 Oct, 2019 (IEEE), 1–6.
Scholarpedia (2008). Petri net. Available at: http://www.scholarpedia.org/article/Petri_net (Accessed September 12, 2020).
Scikit-Learn RBF SVM parameters — scikit-learn 0.23.2 documentation. Available at: https://scikit-learn.org/stable/auto_ examples/svm/plot_rbf_parameters.html (Accessed September 12, 2020).
Specht, S., and Lee, R. (2003). Taxonomies of distributed denial of service networks, attacks, tools and countermeasures. CEL2003-03. Princeton, NJ: Princeton University.
Tian, M., Cui, M., Dong, Z., Wang, X., Yin, S., and Zhao, L. (2019). Multilevel programming-based coordinated cyber physical attacks and countermeasures in smart grid. IEEE Access 7, 9836–9847. doi:10.1109/ACCESS.2018.2890604
Ullah, I., and Mahmoud, Q. H. (2017). “An intrusion detection framework for the smart grid,” in 2017 IEEE 30th Canadian Conference on Electrical and Computer Engineering (CCECE), Windsor, ON, 30 April-3 May, 2017 (IEEE), 1–5.
UWEE Power systems test case archive–UWEE. Available at: http://labs.ece.uw.edu/pstca/ (Accessed December 15, 2020).
Vijayanand, R., Devaraj, D., and Kannapiran, B. (2019). “A novel deep learning based intrusion detection system for smart meter communication network,” in 2019 IEEE International Conference on Intelligent Techniques in Control, Optimization and Signal Processing (INCOS) (IEEE), 1–3.
Xue, D., Jing, X., and Liu, H. (2019). Detection of false data injection attacks in smart grid utilizing ELM-based OCON framework. IEEE Access 7, 31762–31773. doi:10.1109/access.2019.2902910
Zhang, Y., Sun, W., Wang, L., Wang, H., Green, R. C., and Alam, M. (2011). “A multi-level communication architecture of smart grid based on congestion aware wireless mesh network,” in 2011 North American Power Symposium, Boston, MA, 4-6 Aug, 2011, 1–6.
Zaballos, A., Vallejo, A., and Selga, J. (2011). Heterogeneous communication architecture for the smart grid. IEEE network 25, 30–37. doi:10.1109/mnet.2011.6033033
Zafar, R., Naeem, U., Ali, W., and Mahmood, A. (2015). “Applications of ZigBee in smart grid environment: a review,” in Proceedings of the 2nd International Conference on Engineering & Emerging Technologies (ICEET) (Lahore, PK: Superior University).
Zahid, M., Inayat, I., Mashkoor, A., and Mehmood, Z. (2019). “Security risk mitigation of cyber physical systems: a case study of a flight simulator,” in International Conference on Database and Expert Systems Applications (Berlin, Germany: Springer), 129–138.
Zhang, Y., Huang, T., and Bompard, E. F. (2018). Big data analytics in smart grids: a review. Energy Informatics 1, 8. doi:10.1186/s42162-018-0007-5
Keywords: cyber-physical security, smart grid architecture model, NIST–National Institute of Standards and Technology, attack vector formulation, risk assesment, DDoS atacks, FDI attack
Citation: Sinha A, Mohandas M, Pandey P and Vyas OP (2021) Cyber Physical Defense Framework for Distributed Smart Grid Applications. Front. Energy Res. 8:621650. doi: 10.3389/fenrg.2020.621650
Received: 05 November 2020; Accepted: 23 December 2020;
Published: 15 February 2021.
Edited by:
Sudhakar Babu Thanikanti, Universiti Tenaga Nasional, MalaysiaReviewed by:
Nageswara Rao, Oak Ridge National Laboratory (DOE), United StatesAmeen Sarhan, Universiti Tenaga Nasional, Malaysia
Pradeep Kumar Khatua, Universiti Tenaga Nasional, Malaysia
Copyright © 2021 Sinha, Mohandas, Pandey and Vyas. This is an open-access article distributed under the terms of the Creative Commons Attribution License (CC BY). The use, distribution or reproduction in other forums is permitted, provided the original author(s) and the copyright owner(s) are credited and that the original publication in this journal is cited, in accordance with accepted academic practice. No use, distribution or reproduction is permitted which does not comply with these terms.
*Correspondence: Ayush Sinha, cHJvLmF5dXNoQGlpaXRhLmFjLmlu