- 1Graduate School of Business, Universiti Sains Malaysia, Penang, Malaysia
- 2Institute of Energy Policy and Research, Universiti Tenaga Nasional, Malaysia
- 3School of Economics, Finance and Banking, Universiti Utara Malaysia, Kedah, Malaysia
This study investigates the dynamic relationships between carbon emission, urbanization, energy consumption, and economic growth in a panel of 42 Asian countries for the period 2000–2014 using dynamic common correlated effects panel data modeling. This study employs second generation cross-sectional Pesaran (J. Appl. Econom., 2007, 22(2), 265-312) panel unit root, Westerlund panel cointegration tests (Econom. Stat., 2007, 69(6), 709-748), and Pesaran’s (Econometrica, 2006, 74(4), 967-1012) common correlated effects mean group estimation technique. These approaches allow for cross-sectional dependence, and are robust to the presence of common factors, serial correlation, and slope heterogeneity. The Common Correlated Effect Mean Group test reveals a high average coefficient of 0.602 between carbon emission and energy consumption while low coefficients of 0.114 and 0.184 for the pairs of carbon emission-urbanization and carbon emission-GDP, respectively for the panel as a whole, suggesting a cointegration between carbon emission, urbanization, energy consumption, and economic growth. The results indicate that there is relatively high carbon emission especially for highly populated and geopolitical risk Asian countries in the short run. Findings reveal long run relationships between the variables, which is attributed to the on-going carbon taxation and energy prices. Our results are robust to PMG-ARDL estimator. Overall, these findings cast important implications on renewable energy policy and urban planning insights for the policymakers.
Introduction
As the debate surrounds anthropogenic carbon emissions and climate change typifies sustainable development dilemma, the global climate effort put forward by the Paris Agreement advocates urgent attention towards carbon mitigation and adaptation strategies. While economic development is crucial for the emerging markets, it is noteworthy to assess the nexus between energy consumption, urbanization, and carbon emission, especially from the Asian countries’ perspective. Carbon emissions have been highly and widely researched in energy, finance, and economics literature. Carbon emissions have been linked to economic growth (Gao and Zhang, 2014; Arvin et al., 2015; Bekun et al., 2019; Mahembe and Odhiambo, 2019; Adedoyin et al., 2020), financial development (Al-Mulali et al., 2015; Shahbaz et al., 2020), urbanization (Muhammad et al., 2020), trade openness (Farhani et al., 2013; Essandoh et al., 2020), energy consumption (Bekun et al., 2019; Yang et al., 2020), environmental pressures (Gingrich et al., 2011; Al-Mulali and Ozturk, 2015), and renewable energy (O’Ryan et al., 2020).
Countries with high carbon emissions that are described to be highly technologically inclined and are among high-income countries, can reduce carbon emissions while developing regions and low-income countries with increasing volume and speed of emission do not have the sound financial system to curtail carbon emissions (Chen and Lee, 2020; Dong et al., 2020). The incessant and long-run crises rocking some countries, contribute to the rate of carbon emissions (Oreskes and Conway, 2008; Gingrich et al., 2011; Zou et al., 2016). Thus, the relationship between carbon emissions and other economic variables is constrained by per-capital income, economic development, technology advancement, geographical, and regional features (Al-Mulali and Ozturk, 2015; Li et al., 2020; Tirkaso and Gren, 2020). Continental and regional issues are important to devise regional energy programs and improve strategies on rapid urbanization growth especially in Asia, where the continent receives the largest tourist arrivals with an increasing level of industrialization (Farzaneh, 2019; International Energy Agency, 2019). Such energy strategies including secure, affordable, and sustainable energy, reduction in the importation of fossil fuels, and energy efficiency are formulated and implemented to improve social welfare and quality of life for its citizens. The energy-environment spectrum for regional energy efficiency in Asia is important for policymakers, researchers, and respective governments to understand which strategy would foster the reduction in environmental impacts of carbon emissions on economic activities, perhaps with the goals of low carbon emissions, and urbanization sustainability.
Our knowledge on energy consumption, urbanization, and economic growth and their effects on carbon emission in Asia is sorely lacking in terms of their interaction outcomes and possible policy implications both in the number of related studies and regional context (Maddock, 1995; Ng et al., 2016). Asian countries provide a unique phenomenon in which to better understand the long-run cointegration and causality between energy consumption, urbanization, carbon emission, and economic growth because of the increasing economic development and investment in green and renewable energy (Kannan et al., 2007; Balamurugan et al., 2012; Ali et al., 2017). Therefore, regional and geographical differences may call for heterogeneous investigation into the energy-environment-growth phenomenon. Heterogeneous investigation into the relationship between carbon emissions, energy consumption, urbanization, and economic growth may be important for the formulation and implementation of dynamic carbon emission reduction policies across countries, suggesting that dynamic panel estimation modeling techniques may be appropriate in this context.
Reliable and econometrically robust quantitative techniques are valid to analyze the heterogeneous individual effects and regional interconnectedness of energy-environment-growth nexus. Past findings on the relationship between carbon emissions, energy consumption, urbanization, and economic growth have been mixed. One major limitation is the used of first-generation panel unit roots and cointegration tests that assume that error terms are not correlated, therefore they fail to address the issue of cross-sectional dependence across countries. First-generation panel cointegration tests suffer from size distortions and fail to account for cross-sectional dependence, which often result in biased conclusions as to whether a long-run relationship exists between the variables (Bai and Kao, 2006). Andrews (2005) posit that common shocks (i.e. geopolitical risk and currency crisis) across countries may induce cross-sectional dependence among individual countries in the panel, in which the impacts vary across the cross-section units or countries. The increasing level of interconnectedness, financial integration, trade, and capital mobility accounts for cross section dependence across countries (Munir et al., 2020). In the presence of cross-sectional dependence and slope heterogeneity in the series, the use of fixed effect, random effect, DOLS, and FMOLS estimators may give biased and inconsistent results (Murthy and Ketenci, 2020). Thus, it requires the application of second-generation panel unit root (i.e. cross-sectional panel unit root), cointegration, and dynamic common correlated effects panel modeling.
We contextualize our study in the Asian countries, longitudinally assessing the relationship between energy consumption, carbon emission, urbanization, and economic growth which presents an interesting setting whereby Asian countries face increasing economic development and investment in green and renewable energy. As such, the unique factors of geopolitical risk, war, economic growth, population, and economic growth programmes among the Asian countries may account for new evidence that differs from prior studies. Past studies find significant differences in the relationships between energy consumption, urbanization, carbon emissions, and economic growth in the MENA context (Al-Mulali et al., 2013; Farhani et al., 2013; Al-Mulali and Ozturk, 2015) compared to regions such as Sub-Saharan Africa (Gao and Zhang, 2014; Salahuddin et al., 2019), North America and G-20 countries (Arvin et al., 2015; Usman et al., 2020), Europe (Al-Mulali et al., 2015; Kasman and Duman, 2015), and BRICS (Wang et al., 2016; Adedoyin et al., 2020). Regional context matters as a failure to address the regional interconnectedness that influences institutional and stakeholders’ policies on urbanization, energy consumption, and carbon emissions may result in poor and ineffective energy solutions.
Accordingly, this study seeks to provide answers to the questions: Do long-run relationships exist between urbanization, energy consumption, carbon emissions, and economic growth in Asian countries? and to what extent do these variables interact in individual Asian countries?
Data from World Bank development indicators were employed. Findings reveal that a high average coefficient of 0.602 between carbon emission and energy consumption while low coefficients of 0.114 and 0.184 for the pairs of carbon emission-urbanization and carbon emission-GDP, respectively for the panel as a whole, suggesting a cointegration between carbon emission, urbanization, energy consumption, and economic growth. Our findings also reveal that there are considerable differences in the long-run relationships between urbanization, energy consumption, and carbon emissions across individual Asian countries. We link these relationship differences to the rise in rural-urban migration, concentration of industrial, commercial, and corporate industries and sectors in urban cities, population growth, and presence of geopolitical risks. These results depart from past studies on the relationships between urbanization, energy consumption, carbon emissions, and economic growth to income groups and distribution such as in the MENA context.
This study contributes to energy literature, first, by employing second generation cross-sectional Pesaran (2007), Westerlund (2007), and Pesaran’s (2006) common correlated effects mean group estimation technique. These techniques are important to model the long-run relationships between variables and across panel observations that account for cross-sectional dependence which are robust to serial correlation and slope heterogeneity. Second, we compare our results with first generation estimation techniques i.e. DOLS and FMOLS to establish the differences between the first- and second-generation estimators. The positive and negative coefficients between carbon emission and GDP may suggest the phase or stage of EKC hypothesis across Asian countries, evidence shows that UAE, Bangladesh, China, India, Malaysia, Philippines and Singapore have negative carbon emissions-GDP coefficients, suggesting that these countries benefit from increased economic growth following carbon emissions reduction policies.
The remainder of the study is structured as follows. Section data methodology describes the model specification and panel data estimators. Section empirical results shows the estimation outputs of the panel data estimators. Discussion on findings and implications with conclusion are provided in Section discussions and conclusion.
Data Methodology
Model Specification
This paper investigates the relationship between energy consumption, urbanization, carbon emissions and economic growth. This study utilizes the panel co-integration and dynamic common correlated effects mean group (CCEMG) techniques to achieve this objective. The panel data for this study consists of a sample period 2000–2014 of cross-country observations for 42 countries in Asia. The sample period is due to the availability of data. The data on the variables of this study are sourced from the World Development Indicators (WDI). The model controls for economic growth to avoid omitted variable bias (OVB) and to find evidence of an initial stage of the EKC hypothesis in the Asian context. The empirical model is as follows:
Urbanization (URBAN) is expressed in terms of population. Carbon emissions (CO2EMS) are expressed in millions of metric tons. Energy consumption (ENERGYCON) is the kg of oil equivalent, measured in per $1,000 GDP (constant 2005 PPP). Economic growth (GDP) is expressed in real gross domestic product. Equations (1) to (3) were further written in their VECM and matrix structure as suggested in Pradhan and Arvin (2015) and Mahembe and Odhiambo (2019).
where
Panel Unit Roots
The first step in a panel cointegration test is to first examine the stationarity of the series. Several studies have used panel unit root to test for the stationarity of data series (Zhu et al., 2012; Al-Mmulali et al., 2013). The unit root examines the order of integration in the panel series. This study adopts four different first generation panel unit root tests, namely Levin et al. (2002) and Im et al. (2003), ADF-Fisher, and PP-Fisher. While LLC and IPS assume homogeneous unit root, ADF and PP-Fisher assume heterogeneous unit root (Baltagi, 2013). The IPS is advantageous because it caters for individual observation (i.e. country) heterogeneity (Mahembe and Odhiambo, 2019), however, we conduct three other tests as robustness unit root tests. The goal is to focus on unit root processes as a cointegrated process. We expect to see a stationary series at its first difference, d = 1 i.e. I(1) process to enable us to perform the Pedroni cointegration test. For example, the principle of ADF-fisher is presented as follows:
where
Choi (2001) shows that:
where
Panel Cross-Sectional Dependency (CSD) Tests and Determination of Optimal Lags
One of the estimation procedures in panel granger causality tests is to test for cross-sectional dependency. A shock in an observation (i.e. a country) may affect other observations in a sample due to the level of interconnectedness through culture and increased globalization (Muye and Muye, 2017; Mahembe and Odhiambo, 2019). There is considerable evidence that a shock to a country would affect other countries in Asia. For instance, the Asian currency crises of 1997–1998 (Ito and Hashimoto, 2005; Azad, 2009; Chang et al., 2009), the transnational transmission of the global financial crisis (Liu and Arunkumar, 2019), and the ASEAN-Indochina and Rohingya crises (MacLean, 2019; Weatherbee, 2019).
Although the Breusch-Pagan (1980) test for the panel cross-sectional dependency is valid for a panel with small N and large T (Pesaran, 2004), this study uses four different tests to confirm the consistency of CSD results; Breusch-Pagan LM, Pesaran scaled LM, Bias- corrected scaled LM, and Pesaran CD. The null hypothesis of CSD is that CSD does not exist in residuals and the test statistics are standard normal i.e. asymptotically distributed (Tekin, 2012). Optimal lag length is important in panel granger causality estimations (Tekin, 2012). This study uses the Schwarz information criterion (SIC) (Schwarz, 1978) method of lag length selection. This is because SIC performs better than other lag length selection methods in the VECM framework (Wang and Liu, 2006). The SIC method is better than the Akaike information criterion (AIC) (Akaike, 1974) because the latter gives higher lag lengths.
Panel Cointegration
The significance of the panel cointegration can be seen in its use when examining the long-run and short-run causality among variables in economics and finance studies due to its estimation power. A lack of cointegration would suggest that a panel VAR should be estimated for casualty since it indicates that a long-run relation does not exist (Granger, 1988). Several panel cointegration tests are used to test for long-run relationships such as Kao (1999) test and Pedroni (1999), Pedroni (2004) panel cointegration tests. The Kao test assumes a common-integrating vector while the Pedroni test caters for heterogeneity because it combines the residual-based Lagrange multiplier (LM) tests, ADF, and PP principles (Mahembe and Odhiambo, 2019). Thus, this study utilizes the Pedroni cointegration test. This study uses the Pedroni cointegration test to examine the bi-directional long-run relationship between energy consumption, urbanization, carbon emission, and economic growth. Meanwhile, if the bi-directional relationship between the four variables is cointegrated, then the Granger causality test using the vector error correction model (VECM) would be performed. The goal of the granger causality-VECM is to investigate the bi-directional causal relationships (both short and long run) between energy consumption, urbanization, carbon emission, and economic growth. One of the benefits of the Pedroni cointegration is that it allows for heterogeneous intercepts and trend coefficients across sections. For robustness, the study also performs the Kao cointegration test. The regression pattern of Pedroni cointegration is presented as follows:
where
The two alternative hypotheses of Pedroni cointegration are:
Panel Causality and Panel Dynamic Estimation Tests
This study conducts a panel data causality after establishing a panel cointegration. Evidence has shown that the panel cointegration is a preconditioning test for dynamic panel causality test (Engle and Granger, 1987; Granger, 1988; Stock and Watson, 1993). The presence of panel cointegration infers the estimation of a panel VECM granger causality, otherwise, no cointegration will lead to the estimation of a panel VAR causality. While a panel VECM Granger causality test will estimate both the long-run and short-run coefficients, a panel VAR causality test estimates only the short-run coefficients. This is because the panel VAR equation does not include the error correction component that addresses the long-run causality. A panel VECM can be estimated using the Granger causality test. The long run, short run, and error correction terms for the panel and individual countries can also be inferred from the pooled mean group estimation.
This study estimates the first-generation panel dynamic Fully modified OLS (FMOLS) and dynamic OLS (DOLS) should the models be cointegrated. DOLS models are used to establish either negative or positive long-run relationships between variables in the cointegration system. DOLS models required the use of lags and leads that results in a cointegration equation error term (Pedroni, 2001). The cointegration equation error term should be orthogonal to the entire history of the stochastics regressor innovations (Al-Mulali et al., 2013). By adding the lags and leads of the different regressors, it will eliminate the long run correlations between the residuals. The limitation of the DOLS is that it does not produce efficient estimates like the Fully Modified Ordinary Least Square (FMOLS) (Phillips and Hansen, 1990). Phillips and Hansen (1990) initiated the FMOLS to deal with the problems of asymptotic bias and nuisance parameter dependency associated with cointegrating vector estimates in the conventional single equation case but it is not robust to endogeneity bias and serial correlation in dynamic panels. Pedroni (2001) developed the heterogeneous FMOLS estimator to adjust for endogeneity bias and serial correlation. FMOLS is appropriate and suitable for panel heterogeneous cointegration.
Empirical Results
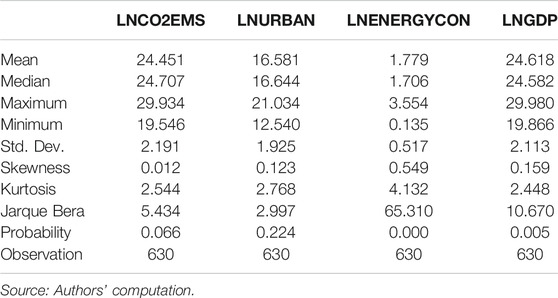
Table 1 shows the descriptive statistics of the variables under review. It is to ascertain the basic measure of central tendency and dispersion of the variables for the period 2000–2014. As shown in Table 1, the minimum value of carbon dioxide is 19,546 kt, with a maximum value of 29,934 kt over the period 2000–2014. Real gross domestic product has a minimum value of $19,866 and a maximum value of $29,980. The variables are positively skewed. Energy consumption and GDP are not normally distributed as the null hypothesis of normality is rejected. Carbon emissions and urbanization are normally distributed, supporting the summary statistic reported on carbon dioxide by Bekun et al. (2019). The total sample size for the panel is 630 observations.
Table 2 shows the correlation matrix analysis to examine the association between carbon emissions, urbanization, energy consumption and economic growth. Carbon emission has a positive association with economic growth, as expected. Urbanization also has positive association with economic growth. However, the correlation coefficient for CO2EMS-GDP is higher than the correlation coefficient for Urban-GDP. This supports the EKC hypothesis that at the first phase of the theory, countries benefit from increased real income through environmental degradation. Energy consumption has negative association on economic growth. The results also show that for every kt of carbon dioxide emitted, urbanization contributes to about 79.5% while energy consumption contributes about 5.5%. Since correlation matrix analysis cannot explain long-run relationships between the variables, Table 3 presents the panel unit root tests as the first step to cointegration analysis.
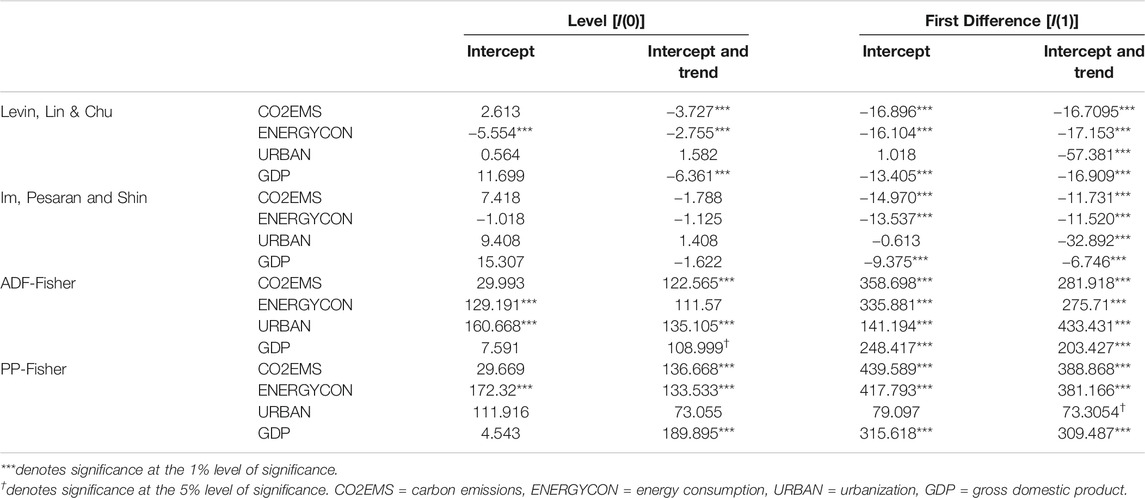
Table 3 shows the results of the first-generation panel unit root tests. The series is required to be stationary at their first difference in the phases of panel Granger causality estimation. The absence of non-stationarity in the series may infer a spurious regression as suggested by Gujarati and Porter (2009) and Baltagi (2013). Four different panel unit root tests were tested, and results presented with the null hypothesis that there is no stationarity in the variable (i.e. the variable contains a unit root). Table 3 includes t-statistics at intercept and intercept and trend. This study considers the presence of stationarity at the 1% level of significance.
Estimating the first-generation panel unit root tests, the results demonstrate that CO2EMS is not significant at intercept for LLC, IPS, ADF, and PP at levels. At levels, ENERGYCON also depicts significance for all the four panel unit roots except IPS. URBAN is not significant at levels for LLC, IPS, and PP both at intercept and with intercept and trend. GDP is also insignificant at the level but significant at the 1% level and consistent at its first difference. However, at the first differences of the variables, there is considerable acceptance for the series being stationary at their first differences across the four panel unit-roots. As compared to their levels using IPS where all the variables are insignificantly mixed both at intercept and with intercept and trend, the results reveal that the variables are all significant at their first difference. IPS unit root test seems to have better results than other panel unit root tests. This is because IPS caters to individual observation (i.e. country) heterogeneity (Im et al., 2003). Thus, the results depict that the four panel variables are stationary at their first difference i.e. I(1).
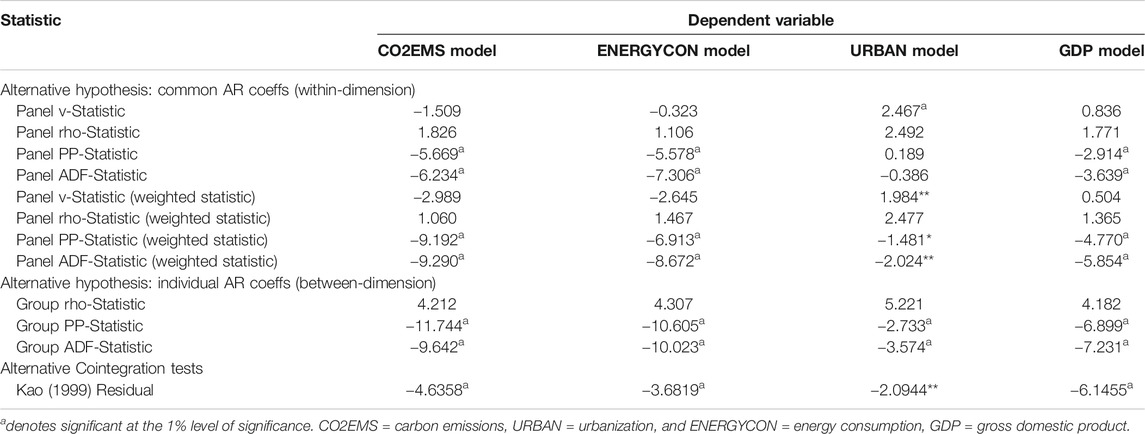
The Pedroni (2004) cointegration test was adopted, with the null hypothesis that there is no cointegration. The results of the panel cointegration test are shown in Table 4. This is to confirm whether a long-run equilibrium relationship exists between the variables. In each cointegrating regression, one variable is the dependent variable while the other variables are the independent and vice versa.
The results for the first generation Pedroni cointegration test show that six out of the eleven Pedroni statistics reject the null hypothesis of a no cointegration for the four models (CO2EMS, ENERGYCON, URBAN, and GDP). The results for the Pedroni cointegration test were also robust to the Kao (1999) cointegration test. Therefore, there is evidence of a long-run equilibrium between the four variables.
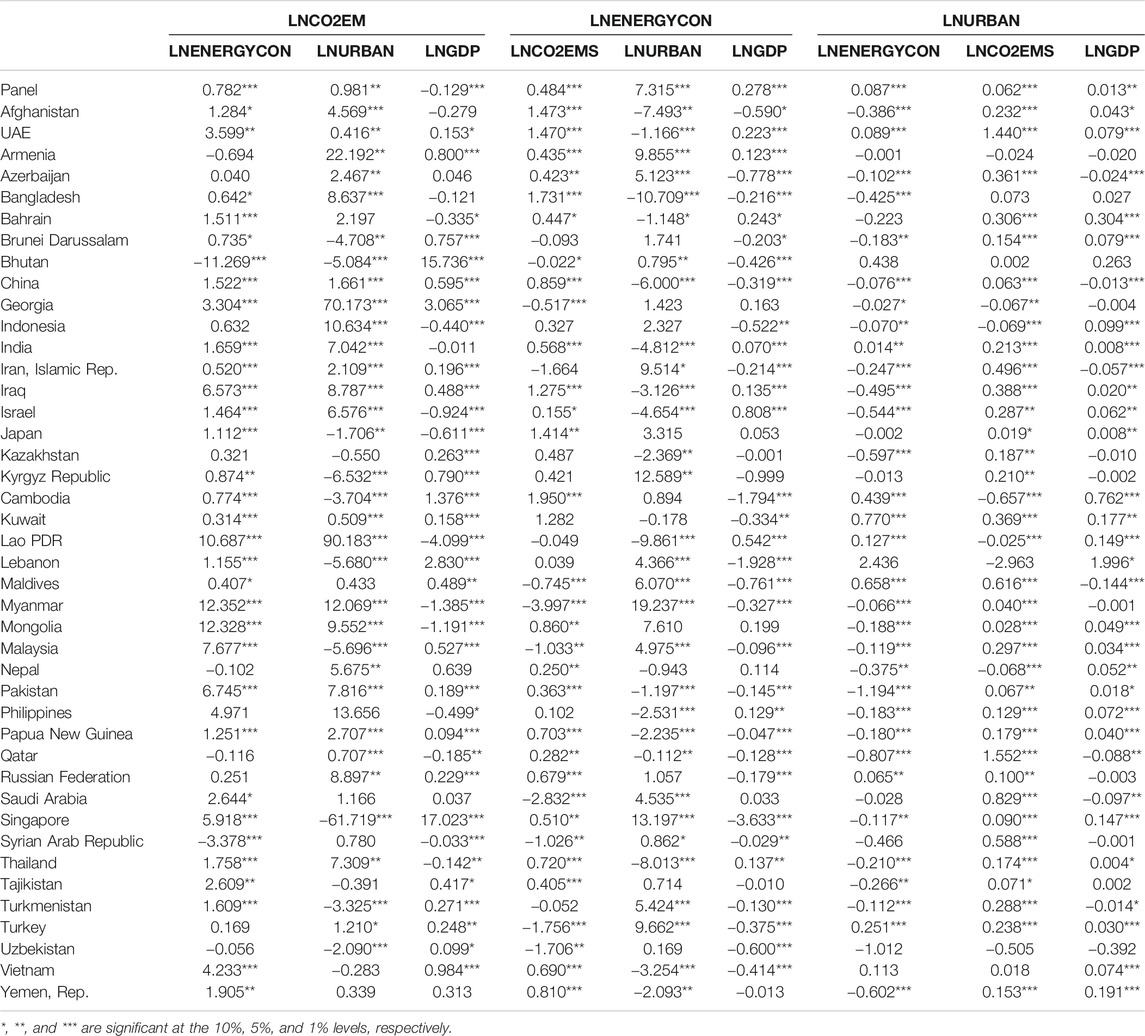
Table 5 shows the results for dynamic OLS (DOLS) test. The significance of the relationships between urbanization, energy consumption, carbon emission, and economic growth varies across countries based on different reasons. This may be due to the level of development in the countries, the level of investments in renewable and non-renewable energies. It can be based on the country’s law on urbanization, population, and energy consumption bills. There is a long-run relationship between energy consumption, urbanization, and carbon emissions. There is considerable evidence of a positive long-run relationship between energy consumption and carbon emissions in Afghanistan, Kuwait, Myanmar, Mongolia, Thailand, Tajikistan, and the Yemen Republic. This may be due to the long-term geopolitical risk, war, and other incessant regional crises in these countries. Evidence has it that incessant war contributes to carbon emission (Oreskes and Conway, 2008; Gingrich et al., 2011; Zou et al., 2016). However, energy consumption shows a negative long-run relationship with urbanization in countries like China, India, Bangladesh, Bahrain, Georgia, Indonesia, Saudi Arabia, Singapore, and Turkey. For example, In Singapore, the investment in renewable solar energy and other distributed renewable sources has reduced greenhouse gas emissions considerably, resulting in a growing urban-tourist destination (Kannan et al., 2007; Balamurugan et al., 2012; Ali et al., 2017). On the other hand, the majority of the Asian countries show a significant long-run relationship between urbanization and carbon emissions. For the results of the dependent variable, URBAN, carbon emissions show a significant positive long-run impact on urbanization across the majority of the Asian countries.
At the 1% level of significance, the positive long-run impact of urbanization on carbon emissions is severe in some of the populous Asian countries including India, Indonesia, Pakistan, and Bangladesh with coefficients of 7.042, 10.634, 7.816, and 8.637, respectively. Concerning the positive long-run impact of carbon emissions on urbanization, the effect is highest in Qatar, UAE, Saudi Arabia, and the Maldives with coefficients of 1.552, 1.440, 0.829, and 0.616, respectively at the 1% level of significance. Although the DOLS estimator has been used in past studies, however, due to its weakness when compared with FMOLS estimator, the study also estimates the FMOLS and the results are presented in Table 6.
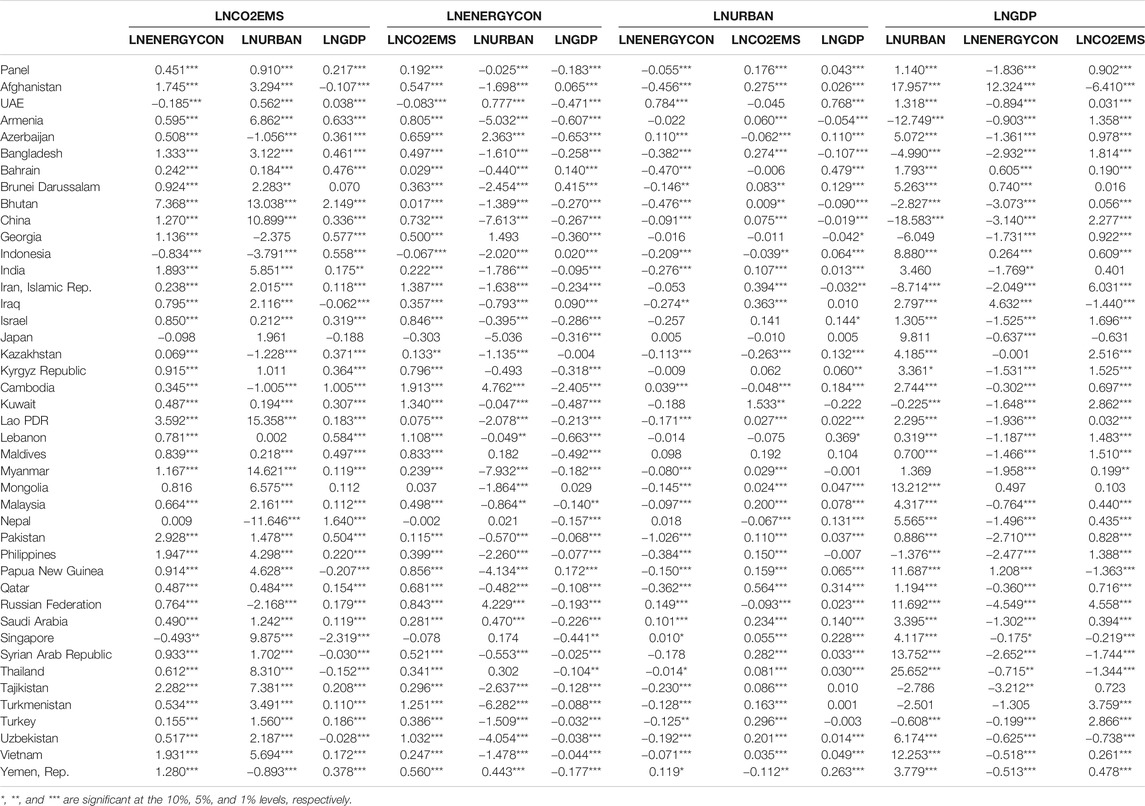
Table 6 presents the results of the long-run relationships between carbon emission, energy consumption, urbanization, and economic growth, with each as a dependent variable based on individual countries and panel FMOLS tests. As shown in Table 6, the study finds positive long-run effects of energy consumption, urbanization, and GDP on carbon emissions for the 42 Asian countries- group (panel). Results also reveal that energy consumption reduces urbanization and GDP in the long run. Meanwhile, GDP and energy consumption have negative bi-directional long-run relationships. This may be due to carbon taxation and appropriate energy pricing. The negative effect of energy consumption in reducing urbanization may also be due to a feedback loop for urban development, and countries may not benefit from increased productivity, which is in support of Munir et al. (2020). It is an indication that more and better policies to improve environmental quality in such a way that countries can benefit from increasing urbanization without affecting is the amount of urban carbon emission is needed. The panel FMOLS test revealed that there is long-run elasticity of Urbanization to carbon emissions and from carbon emissions to Urbanization but the coefficient for Urbanization to carbon emissions is stronger than the coefficient for carbon emissions to Urbanization. The results of the FMOLS are more consistent compared with DOLS. The panel FMOLS results indicate that a 1% increase in urbanization results in a 0.025% decrease in energy consumption, suggesting that the alternative energy use, adoptions of solar panels in cities, transport planning, and compact urban form are yielding better results in rapidly urbanizing Asia.
The results show that energy consumption, urbanization, and GDP contribute positively to carbon emissions in the long run to highly populated countries in Asia including China, Bangladesh, India, Iran, Pakistan, The Philippines, and Turkey. However, Indonesia’s economic growth (GDP) will benefit positively from the combined effect of urbanization, energy consumption, and carbon emissions. This may be due to Indonesia’s green bond and green Sukuk initiative (a shariah-compliant bond) where 100% of the proceeds exclusive go to finance or refinance green projects that contribute to mitigating and adapting climate change as well as preserving biodiversity. In Singapore, while urbanization has a positive long-run relationship with carbon emissions at a 9.87% change, it, however, increases GDP at the 4.117% change, suggesting that the country should pursue and maintain a balance in urban-carbon emission ratio policy that will reduce carbon emissions and at the same time increase GDP. The results for the Panel showed that a percentage increase in economic growth (GDP) increases carbon emissions and urbanization by 0.217% and 0.043%, respectively, but it reduces energy consumption by 0.183%. Asian countries’ economic growth benefits more from carbon emissions than GDP contributes to the amount of carbon emissions. Eight out of the 42 Asian countries (Armenia, Bangladesh, Bhutan, China, Iran, Kuwait, The Philippines, and Turkey) experience long-run negative effects of urbanization and energy consumption on economic growth while carbon emissions contribute to economic growth.
After estimating the DOLS and FMOLS, we proceed to estimate the panel cross-sectional dependence (CD) to ascertain whether there is cross-sectional dependence among the sampled countries and the need to adjust for regional interconnectedness. Table 7 presents the results for CD test.
Using four different methods to test for cross-sectional dependence, the results show that there is evidence of correlations in the variables at the statistics are all significant at the 1% level of significance. The results are expected since we expected that increasing Urban growth causes an increase in carbon emissions and Urban also increases energy consumption, and at the same time increasing energy consumption contributes to an increase in carbon emissions, and in turn impacts economic growth. Our panel CD results are in support of Munir et al. (2020) that also find the presence of cross-sectional dependence among ASEAN countries, which are among the Asian panel used in this paper. The increasing development in infrastructure and high level of tourists in Asia countries may also facilitate the relationships between the variables. The presence of integration and stationarity leads to the estimation of the second-generation panel cointegration test. First, we need to estimate a second-generation panel unit root using the Pesaran's CIPS panel unit root test. Second, estimate the cointegration test using Westerlund (2007) cointegration approach. The results for the Pesaran's CIPS panel unit root test are shown in Table 8.
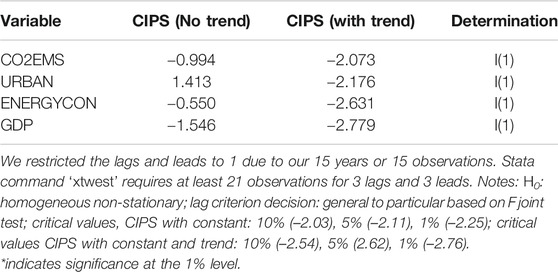
TABLE 8. Pesaran’s panel unit root Pesaran (2007) test.
Table 8 shows the Pesaran’s panel unit root using the CIPS test. The results show that the null hypothesis of a unit root is not rejected at the 1% level of significance, suggesting that the variables/series are integrated at their first difference, i.e. I(1). Thus, it requires the computation of the Westerlund (2007) as shown in Table 9 below.
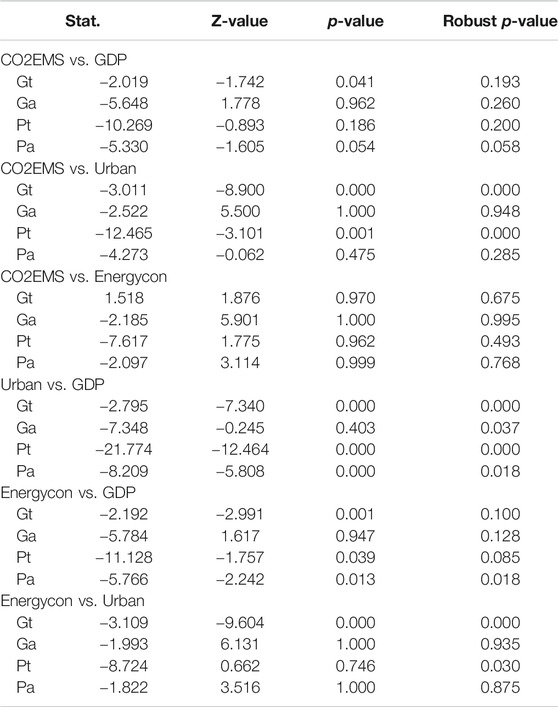
The study used the bootstrapped approach of Westerlund (2007) to allow for cross-sectional dependence and report bootstrapped p-values. As shown in Table 9, the Westerlund (2007) cointegration test revealed mixed findings, a few results fail to reject the null hypothesis of no cointegration between carbon emissions and energy consumption due to insignificant statistics. Only the statistic of Pa is significant for the cointegration between carbon emissions and GDP. Both the statistics of Gt and Pt are significant for the cointegration between carbon emissions and urbanization and between energy consumption and urbanization. Meanwhile, the statistics of Gt, Pa, and Pt are significant for the cointegration between energy consumption and GDP. The null hypothesis of no cointegration between urbanization and GDP is rejected as the statistics for Gt, Ga, Pt, and Pa are all significant. Substantially, there is evidence of cointegration between carbon emissions, urbanization, energy consumption, and GDP, suggesting that there is a long-run equilibrium relationship between the variables when we consider cross-dependence in the panel except for the long-run equilibrium relationship between carbon emissions and energy consumption. In conclusion, the results of the bootstrapped Westerlund (2007) test provide consistent and strong evidence of cointegration relationship between the pairs of Urban-GDP and Energycon-GDP; moderate evidence of cointegration relationship between the pairs of CO2EMS-Urban and Energycon-Urban, and weak evidence of cointegration relationship between CO2EMS and GDP. However, it finds no evidence of a cointegration relationship between CO2EMS and Energycon.
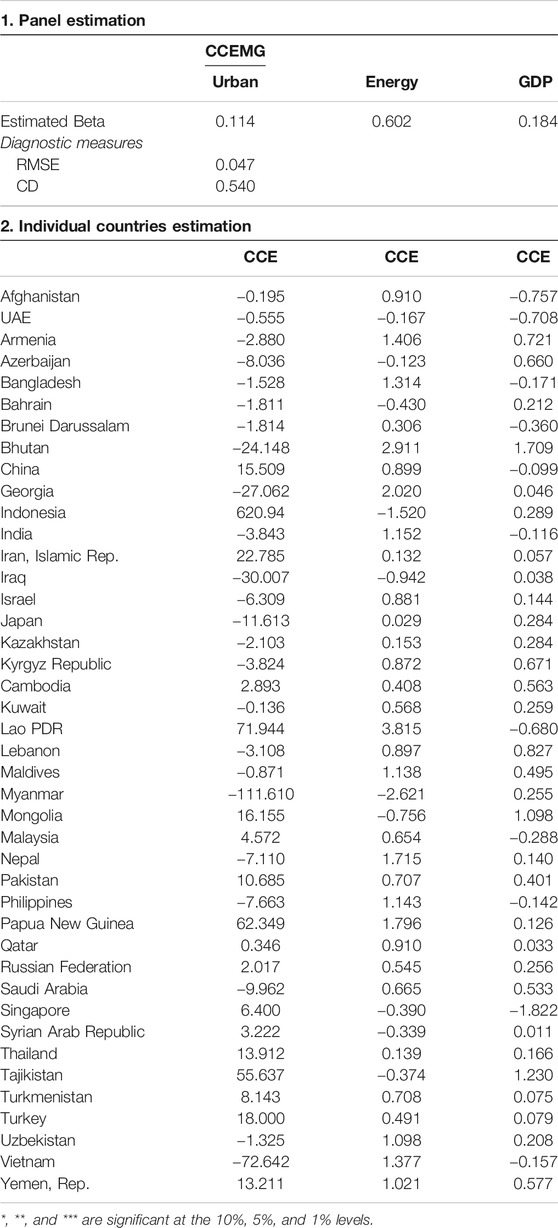
As stated, this study uses the CCEMG estimator to measure the relationship between carbon emissions, energy consumption, urbanization, and GDP in the panel and individual countries. Table 10 presents the empirical results of the panel estimators that take into consideration common factors, cross-sectional dependence, and slope heterogeneity. The carbon emissions-Urban coefficient is 0.114 and its significant difference from 1.000 indicates a relatively high degree of urbanization contributing to carbon emissions in the short-run among the panel countries. This suggests that in the long-run, the problem of urbanization is addressed, as the panel countries formulate and implement carbon reduction goals.
Concerning the EKC hypothesis of Grossman and Krueger (1995), the CCEMG results showed that there is evidence of the initial stage of the EKC hypothesis i.e. higher GDP does results in higher carbon emissions in Indonesia, Japan, Kuwait, Pakistan, Qatar, Saudi Arabia, Thailand, and Turkey. The formulation and implementation of energy and carbon emission reduction policies are still on-going in these countries, with slow improvement in economic development, a cleaner environment, and better life quality.
Robustness Test Using Pooled Mean Group-ARDL (PMG-ARDL)
This study further uses the Panel Pooled Mean Group-Autoregressive Distributive Lag (PMG-ARDL) estimator to establish the magnitude of cointegration as shown in Table 11.
As shown in Table 11, long-run relationship is inferred from the ECT coefficient values, confirming the presence of convergence speeds. The results depict that there is a long-run relationship between carbon emissions, energy consumption, urbanization, and economic growth. Our results are in line with Al-Mulali et al. (2013) who found long run relationships between carbon emissions, energy consumption, and urbanization. The long-run coefficient is the same across all the groups that make up the panel. In the long run, urbanization, energy consumption, and economic growth (GDP) granger cause carbon emissions at the 1% level. For the urbanization model, carbon emissions has significant relationship with economic growth positively while energy consumption and urbanization are negatively related in the long run at the 1% level. The error correction term (ECT) shows that there is cointegration among the variables across the different models in the panel and long run relationship. Thus, there is a long-run relationship at the 1% level for the carbon emissions model, energy consumption model, and economic growth (GDP) model. It suggests that any deviations from long-run equilibrium are corrected at the adjustment speeds of 48.41% for the carbon emissions model, 32.91% for the energy consumption model, and 27.42% for the economic growth (GDP) model. It suggests that the variables are characterizing a mean reversion behavior and appear to have self-correcting mechanisms. This indicates that the individual variables tend to converge in the long-run equilibrium in response to the changes in other variables. The results for the short-run relationship using the PMG-ARDL estimator are presented in Table 12.
Using the PMG-ARDL, the results for short run relationship in group panel show that energy consumption and carbon emission positively significantly related in the short run with a coefficient of 0.5014 at the 1% level. In relation to Urban model, energy consumption has a significant negative relationship with urbanization in the short run at the rate of 37.81%. For energy consumption model, both carbon emission and GDP have positive and negative relationships respectively, on energy consumption in the short run. Urbanization reduces GDP in the short run at the panel level. Although PMG estimator assumes common long run relationships between variables, however, the short run dynamics vary across countries. So, relying on grouped or panel short run estimates as shown in Table 12 may be misleading. Table 13 addresses individual countries’ short run relationships.
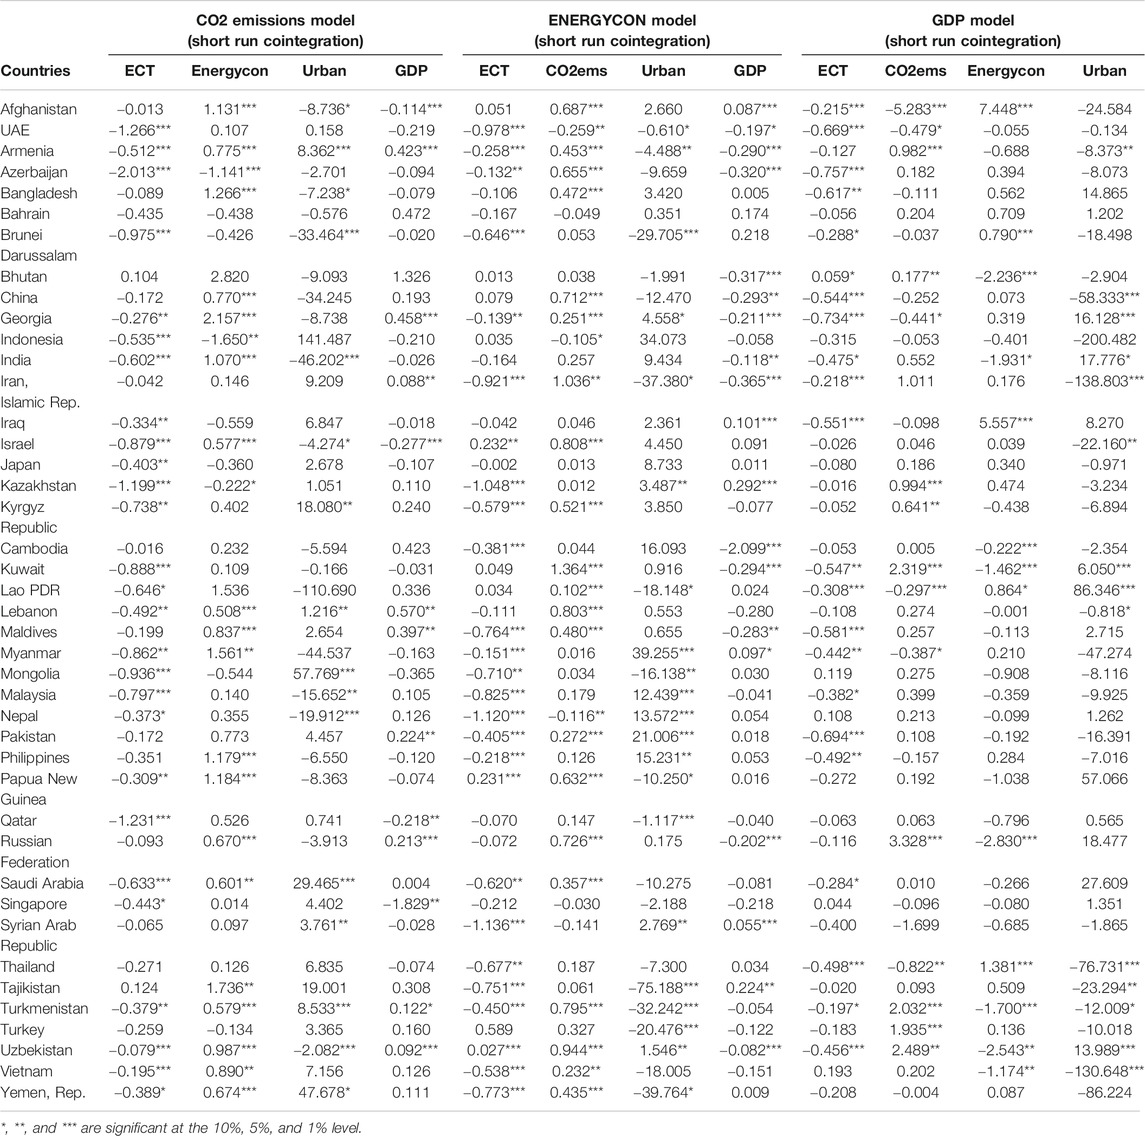
Table 13 shows the short-run relationship between carbon emissions, urbanization, energy consumption, and economic growth for individual countries using the PMG-ARDL estimator. It also shows that each country has a different error correction term, indicating the extent to which deviations from the long-run is corrected at the individual country level. The results show unidirectional relationship from GDP to energy consumption for China, UAE, and Russia. The unidirectional relationship is found from GDP to carbon emissions for Pakistan, Qatar, Singapore, Israel, Lebanon, and the Maldives. Unidirectional relationship is found from energy consumption to carbon emission in India, Kazakhstan, Myanmar, and the Philippines. However, bi-directional relationship (i.e. feedback hypothesis) is found from carbon emission to GDP in Russia, Georgia, Turkmenistan, Afghanistan, Armenia, and Uzbekistan in the short run.
Discussions and Conclusion
The upsurge in economic development, income level, and perhaps the geopolitical risk and war situations have influenced the link between energy consumption, urbanization, carbon emissions, and economic growth. The relationships between these variables informed the objective of this study. This study utilizes the second generation cross-sectional Pesaran (2007), Westerlund (2007), and Pesaran’s (2006) common correlated effects mean group estimation technique to examine the relationships between energy consumption, urbanization, carbon emissions, and economic growth in 42 Asian countries for the period 2000–2014. The Pedroni cointegration estimation results showed that urbanization and carbon emissions were cointegrated but the no cointegration when the energy consumption model is considered. Results for CCEMG estimator showed that there are long run relationships between urbanization, carbon emissions, energy consumption, and economic growth. The results show that carbon emissions play a significant role in increasing urbanization for countries experiencing civil and political war such as Afghanistan, Iraq, Turkey, and Vietnam. It suggests that war in these countries are mostly in the rural, boundaries and resources areas, influencing rural-urban migration, and thus, contributing to the high rate of urbanization. The level of energy consumption also increases the rate of urbanization in countries like the United Arab Emirates, the Russian Federation, and Saudi Arabia. It indicates that most industrial, commercial, and household use of energy are highly concentrated in the urban areas because as governments of these countries reduce unemployment, seekers of job opportunities focus on industrial, commercial, and corporate sectors. Thus, increasing urban employment cycle and destination change. China along with Bahrain, Indian, Malaysia, The Philippines, Saudi Arabia, Singapore, Thailand, and Vietnam contributes to carbon emissions through their number of urban destinations. Policy-wise, the government should shift investments to rural destinations to reduce rural-urban migration. Although for some high-income countries, like China, Malaysia, and Saudi Arabia where a large percentage of their investments and revenue generation is concentrated in commercial cities, shifting investment to local communities may discourage foreign investors. However, continued investments into the conservation and efficiency of energy may reduce future carbon emissions but the rural-tourism destination programs must be fostered to reduce further urban migration to sustain the energy efficiency programs for reduced carbon emissions while at the same time not influencing a further increase in urbanization.
Data Availability Statement
The raw data supporting the conclusions of this article will be made available by the authors, without undue reservation.
Author Contribution
All authors listed have made a substantial, direct, and intellectual contribution to the work and approved it for publication.
Conflict of Interest
The authors declare that the research was conducted in the absence of any commercial or financial relationships that could be construed as a potential conflict of interest.
References
Adedoyin, F. F., Gumede, M. I., Bekun, F. V., Etokakpan, M. U., and Balsalobre-lorente, D. (2020). Modelling coal rent, economic growth and CO2 emissions: does regulatory quality matter in BRICS economies? Sci. Total Environ. 710, 136284. doi:10.1016/j.scitotenv.2019.136284
Akaike, H. (1974). A new look at the statistical model identification. IEEE Trans. Automat. Contr. 19 (6), 716–723. doi:10.1109/tac.1974.1100705
Al-Mulali, U., Fereidouni, H. G., Lee, J. Y. M., and Sab, C. N. B. C. (2013). Exploring the relationship between urbanization, energy consumption, and CO2 emission in MENA countries. Renew. Sustain. Energy Rev. 23, 107–112. doi:10.1016/j.rser.2013.02.041
Al-Mulali, U., Ozturk, I., and Lean, H. H. (2015). The influence of economic growth, urbanization, trade openness, financial development, and renewable energy on pollution in Europe. Nat. Hazards 79 (1), 621–644. doi:10.1007/s11069-015-1865-9
Al-Mulali, U., and Ozturk, I. (2015). The effect of energy consumption, urbanization, trade openness, industrial output, and the political stability on the environmental degradation in the MENA (Middle East and North African) region. Energy 84, 382–389. doi:10.1016/j.energy.2015.03.004
Ali, H., Sanjaya, S., Suryadi, B., and Weller, S. R. (2017). Analysing CO2 emissions from Singapore's electricity generation sector: strategies for 2020 and beyond. Energy 124, 553–564. doi:10.1016/j.energy.2017.01.112
Andrews, D. W. K. (2005). Cross-section regression with common shocks. Econometrica 73 (5), 1551–1585. doi:10.1111/j.1468-0262.2005.00629.x
Arvin, M. B., Pradhan, R. P., and Norman, N. R. (2015). Transportation intensity, urbanization, economic growth, and CO2 emissions in the G-20 countries. Util. Pol. 35, 50–66. doi:10.1016/j.jup.2015.07.003
Azad, A. S. M. S. (2009). Random walk and efficiency tests in the Asia-Pacific foreign exchange markets: evidence from the post-Asian currency crisis data. Res. Int. Bus. Finance 23 (3), 322–338. doi:10.1016/j.ribaf.2008.11.001
Bai, J., and Kao, C. (2006). “On the estimation and inference of a panel cointegration model with cross-sectional dependence,” in Panel data econometrics: theoretical contributions and empirical applications, contributions to economic analysis, Editor B. Baltagi, 3–30.
Balamurugan, K., Srinivasan, D., and Reindl, T. (2012). Impact of distributed generation on power distribution systems. Energy Proc. 25, 93–100. doi:10.1016/j.egypro.2012.07.013
Baltagi, B. (2013). Econometric analysis of panel data. 5th Edn. West Sussex, Switzerland: John Wiley & Sons.
Bekun, F. V., Alola, A. A., and Sarkodie, S. A. (2019). Toward a sustainable environment: nexus between CO2 emissions, resource rent, renewable and nonrenewable energy in 16-EU countries. Sci. Total Environ. 657, 1023–1029. doi:10.1016/j.scitotenv.2018.12.104
Breusch, T. S., and Pagan, A. R. (1980). The Lagrange multiplier test and its applications to model specification in econometrics. Rev. Econ. Stud. 47 (1), 239–253. doi:10.2307/2297111
Chang, S. S., Gunnell, D., Sterne, J. A., Lu, T. H., and Cheng, A. T. (2009). Was the economic crisis 1997–1998 responsible for rising suicide rates in East/Southeast Asia? A time-trend analysis for Japan, Hong Kong, South Korea, Taiwan, Singapore and Thailand. Soc. Sci. Med. 68 (7), 1322–1331. doi:10.1016/j.socscimed.2009.01.010
Chen, Y., and Lee, C. C. (2020). Does technological innovation reduce CO2 emissions? Cross-country evidence. J. Clean. Prod. 121, 550. doi:10.3390/pr8091033
Choi, I. (2001). Unit root tests for panel data. J. Int. Money Finance 20 (2), 249–272. doi:10.1016/s0261-5606(00)00048-6
Dong, K., Hochman, G., and Timilsina, G. R. (2020). Do drivers of CO2 emission growth alter overtime and by the stage of economic development?. Energy Pol. 140, 111420. doi:10.1016/j.enpol.2020.111420
Engle, R. F., and Granger, C. W. J. (1987). Co-integration and error correction: representation, estimation, and testing. Econometrica 55, 251–276. doi:10.2307/1913236
Essandoh, O. K., Islam, M., and Kakinaka, M. (2020). Linking international trade and foreign direct investment to CO2 emissions: any differences between developed and developing countries?. Sci. Total Environ. 712, 136437. doi:10.1016/j.scitotenv.2019.136437
Farhani, S., Shahbaz, M., and Arouri, M. E. H. (2013). “Panel analysis of CO2 emissions, GDP, energy consumption, trade openness and urbanization for MENA countries”, in MPRA Working Paper No, 49258.
Gao, J., and Zhang, L. (2014). Electricity consumption-economic growth-CO2 Emissions nexus in Sub-Saharan Africa: evidence from panel cointegration. Afr. Dev. Rev. 26 (2), 359–371. doi:10.1111/1467-8268.12087
Gingrich, S., Kušková, P., and Steinberger, J. K. (2011). Long-term changes in CO(2) emissions in Austria and Czechoslovakia-Identifying the drivers of environmental pressures. Energy Pol. 39 (2), 535–543. doi:10.1016/j.enpol.2010.10.006
Granger, C. W. (1988). Some recent development in a concept of causality. J. Econom. 39 (1–2), 199–211. doi:10.1016/0304-4076(88)90045-0
Grossman, G. M., and Krueger, A. B. (1995). Economic growth and the environment. Quart. J. Econom. 110 (2), 353–377.
Im, K. S., Pesaran, M. H., and Shin, Y. (2003). Testing for unit roots in heterogeneous panels. J. Econom. 115 (1), 53–74. doi:10.1016/s0304-4076(03)00092-7
Ito, T., and Hashimoto, Y. (2005). High-frequency contagion of currency crises in Asia*. Asian Econ. J. 19 (4), 357–381. doi:10.1111/j.1467-8381.2005.00217.x
Kannan, R., Leong, K. C., Osman, R., and Ho, H. K. (2007). Life cycle energy, emissions and cost inventory of power generation technologies in Singapore. Renew. Sustain. Energy Rev. 11 (4), 702–715. doi:10.1016/j.rser.2005.05.004
Kao, C. (1999). Spurious regression and residual-based tests for cointegration in panel data. J. Econom. 90 (1), 1–44. doi:10.1016/s0304-4076(98)00023-2
Kasman, A., and Duman, Y. S. (2015). CO2 emissions, economic growth, energy consumption, trade and urbanization in new EU member and candidate countries: a panel data analysis. Econ. Modell. 44, 97–103. doi:10.1016/j.econmod.2014.10.022
Levin, A., Lin, C.-F., and James Chu, C.-S. (2002). Unit root tests in panel data: asymptotic and finite-sample properties. J. Econom. 108 (1), 1–24. doi:10.1016/s0304-4076(01)00098-7
Li, A., Zhou, D., Chen, G., Liu, Y., and Long, Y. (2020). Multi-region comparisons of energy-related CO2 emissions and production water use during energy development in Northwestern China. Renew. Energy 153, 940–961. doi:10.1016/j.renene.2020.01.060
Liu, C., and Arunkumar, N. (2019). Risk prediction and evaluation of transnational transmission of financial crisis based on complex network. Cluster Comput. 22 (2), 4307–4313. doi:10.1007/s10586-018-1870-3
MacLean, K. (2019). The Rohingya crisis and the practices of erasure. J. Genocide Res. 21 (1), 83–95. doi:10.1080/14623528.2018.1506628
Maddock, R. T. (1995). Environmental security in East Asia. Contemp. S. Asia 17 (1), 20. doi:10.1355/cs17-1b
Mahembe, E., Odhiambo, N. M., and Nsiah, C. 2019). Foreign aid, poverty and economic growth in developing countries: a dynamic panel data causality analysis. Cogent Econom. Finance 7 (1), 1626321. doi:10.1080/23322039.2019.1626321
Muhammad, S., Long, X., Salman, M., and Dauda, L. (2020). Effect of urbanization and international trade on CO2 emissions across 65 belt and road initiative countries. Energy 196, 117102. doi:10.1016/j.energy.2020.117102
Munir, Q., Lean, H. H., and Smyth, R. (2020). CO2 emissions, energy consumption and economic growth in the ASEAN-5 countries: a cross-sectional dependence approach. Energy Econ. 85, 104571. doi:10.1016/j.eneco.2019.104571
Murthy, V. N., and Ketenci, N. (2020). Capital mobility in Latin American and Caribbean countries: new evidence from dynamic common correlated effects panel data modeling. Financial Innov. 6 (1), 1–17. doi:10.1186/s40854-020-00204-2
Muye, I. M., and Muye, I. Y. (2017). Testing for causality among globalization, institution and financial development: further evidence from three economic blocs. Borsa Istanbul Rev. 17 (2), 117–132. doi:10.1016/j.bir.2016.10.001
Ng, T. H., Lye, C. T., and Lim, Y. S. (2016). A decomposition analysis of CO2 emissions: evidence from Malaysia's tourism industry. Int. J. Sustain. Dev. World Ecol. 23 (3), 266–277. doi:10.1080/13504509.2015.1117534
Oreskes, N., and Conway, E. M. (2008). Challenging knowledge: How climate science became a victim of the cold war, in Contingency and Dissent in Science Project. Centre for Philosophy of Natural and Social Science, London School of Economics and Political Science.
O’Ryan, R., Nasirov, S., and Álvarez-Espinosa, A. (2020). Renewable energy expansion in the Chilean power market: a dynamic general equilibrium modeling approach to determine CO2 emission baselines. J. Clean. Prod. 247, 119645.
Pedroni, P. (1999). Critical values for cointegration tests in heterogeneous panels with multiple regressors. Oxf. Bull Econ. Stat. 61 (S1), 653–670. doi:10.1111/1468-0084.61.s1.14
Pedroni, P. (2004). Panel cointegration: asymptotic and finite sample properties of pooled time series tests with an application to the PPP hypothesis. Econom. Theor. 28, 597–625. doi:10.1017/0S0266466604203073
Pedroni, P. (2001). Purchasing power parity tests in cointegrated panels. Rev. Econ. Stat. 83 (4), 727–731. doi:10.1162/003465301753237803
Pesaran, H. M. (2004). General diagnostic tests for cross-sectional dependence in panels, Cambridge Working Papers in Economics. Cambridge: University of Cambridge, 435.
Pesaran, M. H. (2006). Estimation and inference in large heterogeneous panels with a multifactor error structure. Econometrica 74 (4), 967–1012.
Pesaran, M. H. (2007). A simple panel unit root test in the presence of cross-section dependence. J. Appl. Econom. 22 (2), 265–312.
Phillips, P. C. B., and Hansen, B. E. (1990). Statistical inference in instrumental variables regression with I(1) processes. Rev. Econ. Stud. 57 (1), 99–125. doi:10.2307/2297545
Pradhan, R., and Arvin, B. M. (2015). “Foreign aid, economic growth, FDI, and trade openness in lower middle-income countries: a dynamic panel data analysis”, in Handbook on the economics of foreign aid (New York: Edward Elgar Publishing).
Salahuddin, M., Ali, M. I., Vink, N., and Gow, J. (2019). The effects of urbanization and globalization on CO. Environ. Sci. Pollut. Control Ser. 26 (3), 2699–2709. doi:10.1007/s11356-018-3790-4
Schwarz, G. (1978). Estimating the dimension of a model. Ann. Stat. 6 (2), 461–464. doi:10.1214/aos/1176344136
Shahbaz, M., Haouas, I., Sohag, K., and Ozturk, I. (2020). The financial development-environmental degradation nexus in the United Arab Emirates: the importance of growth, globalization and structural breaks. Environ. Sci. Pollut. Control Ser. 28, 1–15.
Stock, J. H., and Watson, M. W. (1993). A simple estimator of cointegrating vectors in higher order integrated systems. Econom. J. Econom. Soc. 93, 783–820. doi:10.2307/2951763
Tekin, R. B. (2012). Economic growth, exports and foreign direct investment in Least Developed Countries: a panel Granger causality analysis. Econ. Modell. 29 (3), 868–878. doi:10.1016/j.econmod.2011.10.013
Tirkaso, W. T., and Gren, M. (2020). Road fuel demand and regional effects of carbon taxes in Sweden. Energy Pol. 144, 111648. doi:10.1016/j.enpol.2020.111648
Usman, O., Alola, A. A., and Sarkodie, S. A. (2020). Assessment of the role of renewable energy consumption and trade policy on environmental degradation using innovation accounting: evidence from the US. Renew. Energy 150, 266–277. doi:10.1016/j.renene.2019.12.151
Wald, A. (1943). Tests of statistical hypotheses concerning several parameters when the number of observations is large. Trans. Am. Math. Soc. 54 (3), 426–482. doi:10.1090/s0002-9947-1943-0012401-3
Wang, Y., Li, L., Kubota, J., Han, R., Zhu, X., and Lu, G. (2016). Does urbanization lead to more carbon emission? Evidence from a panel of BRICS countries. Appl. Energy 168, 375–380. doi:10.1016/j.apenergy.2016.01.105
Wang, Y., and Liu, Q. (2006). Comparison of Akaike information criterion (AIC) and Bayesian information criterion (BIC) in selection of stock-recruitment relationships. Fish. Res. 77 (2), 220–225. doi:10.1016/j.fishres.2005.08.011
Westerlund, J. (2007). Testing for error correction in panel data. Oxford Bull. Econom. Stat. 69 (6), 709–748.
Weatherbee, D. E. (2019). Southeast Asia Divided: The ASEAN-Indochina Crisis. (New York, NY: Routledge).
Yang, J., Cai, W., Ma, M., Li, L., Liu, C., Ma, X., et al. (2020). Driving forces of China’s CO2 emissions from energy consumption based on Kaya-LMDI methods. Sci. Total Environ. 711, 134569. doi:10.1016/j.scitotenv.2019.134569
Zhu, H. M., You, W. H., and Zeng, Z. F. (2012). Urbanization and CO2 emissions: a semi-parametric panel data analysis. Econ. Lett. 117 (3), 848–850. doi:10.1016/j.econlet.2012.09.001
Keywords: cross-sectional dependence, Westerlund panel cointegration, common correlated effects mean group, economic growth, carbon emissions, urbanization, energy consumption
Citation: Adeneye YB, Jaaffar AH, Ooi CA and Ooi SK (2021) Nexus Between Carbon Emissions, Energy Consumption, Urbanization and Economic Growth in Asia: Evidence From Common Correlated Effects Mean Group Estimator (CCEMG). Front. Energy Res. 8:610577. doi: 10.3389/fenrg.2020.610577
Received: 26 September 2020; Accepted: 29 December 2020;
Published: 18 February 2021.
Edited by:
Samuel Asumadu Sarkodie, Nord University, NorwayReviewed by:
Festus Victor Bekun, Gelişim Üniversitesi, TurkeyAndrew Alola, Istanbul University, Turkey
Copyright © 2021 Adeneye, Jaaffar, Ooi and Ooi. This is an open-access article distributed under the terms of the Creative Commons Attribution License (CC BY). The use, distribution or reproduction in other forums is permitted, provided the original author(s) and the copyright owner(s) are credited and that the original publication in this journal is cited, in accordance with accepted academic practice. No use, distribution or reproduction is permitted which does not comply with these terms.
*Correspondence: Say Keat Ooi, b29pc2F5a2VhdEB1c20ubXk=
 Yusuf Babatunde Adeneye1
 Say Keat Ooi