
95% of researchers rate our articles as excellent or good
Learn more about the work of our research integrity team to safeguard the quality of each article we publish.
Find out more
ORIGINAL RESEARCH article
Front. Energy Res. , 26 November 2020
Sec. Electrochemical Energy Storage
Volume 8 - 2020 | https://doi.org/10.3389/fenrg.2020.604799
This article is part of the Research Topic Material and Composition Screening Approaches in Electrocatalysis and Battery Research View all 11 articles
The spinel Co3O4 has many beneficial properties for potential use in catalysis. In operando, water is always present and alters the properties of the catalyst. We have used ab initio molecular dynamics to understand the effect of water and solvation on the structure and reactivity of the Co3O4 (001) A-type and B-type surface terminations. Water adsorbs on both terminations via a partial dissociative mode, and the A-termination is seen to be more reactive. On this surface, a higher degree of dissociation is observed in the topmost layers of the crystal in contact with water. Water dissociates more frequently on the Co2+ sites (about 75%) than on the adjacent Co3+ sites, where the degree of dissociation is about 50%. Increasing water coverage does not change the degree of water dissociation significantly. OH− adsorption on the Co2+ sites leads to a reduction of the amount of reconstruction and relaxation of the surface relative to the clean surface at room temperature. Proton transfer within the water films and between water molecules and surface has localized character. The B-terminated interface is less dynamic, and water forms epitactic layers on top of the Co3+ sites, with a dissociation degree of about 25% in the contact layer.
Recent years have witnessed a rise of interest for heterogeneous catalysis in the liquid phase. Its paramount importance in industrial chemical process technology has prompted intense efforts to gain an atomistic-level understanding of the fundamental process steps. Due to their abundance, the use of transition metal oxides as heterogeneous catalysts is seen as an important low-cost alternative to costly noble metal-based ones. Unlike in the latter case, deep insight into the interplay of factors defining the activity and selectivity of metal oxide catalysts is still missing. More knowledge is still required about the different factors governing their efficiency in order to allow their rational design and application. Several metal oxides have been found relevant for catalysis, and their interactions with water have captured particular attention as water is always present in operando. Co3O4 is one of them, as it shows electronic, magnetic and redox properties that make it a potential candidate for many catalytic reactions. For example, Co3O4 nanoparticles have been successfully used for water and carbon monoxide oxidation, selective 2-propanol oxidation, or steam reforming of ethanol (Llorca et al., 2004; Deng and Tüysüz, 2014; Anke et al., 2019; Cai et al., 2019).
Zasada and co-workers combined DFT calculations and high resolution scanning transmission electron microscopy (HRSTEM) to investigate the structure and shape of cobalt spinel nanostructures (Zasada et al., 2011). Their calculations of surface energies predicted the following order of stability for the low index facets: (001) >(111) >(110), in agreement with Montoya et al., (2011) who came to the same conclusion in a separate DFT study. Based on these surfaces energies, a Wulff construction was applied to predict the shape of nanoparticles. They showed rhombicuboctahedral grains exposing mainly the (001) and (111) facets, with a percentage of exposure of 48% and 41%, respectively, and the (101) facet with a minor percentage of 11%. These predictions compared well with HRSTEM images of synthesized spinel nanocrystals. The impact of the vapor pressure of water on the equilibrium shape of the nanoparticles was studied by Zasada et al. (2010). Their study reports no faceting transformation upon water adsorption, and the percentage of exposure of the least stable (110) facet is slightly increased to 14%. The presence of water (in the submonolayer and monolayer regime) slightly changes the relative abundance of exposure between the (001) and (111) facets to 39% and 47%, respectively. However, as mentioned in the same study, the (001) facet remains the most attractive to catalyse liquid phase processes. The reason is that on the (111) facet, because of the highly unsaturated nature of the surface Co ions, water molecules do not desorb even at elevated temperatures of more than 450°C, which implies that water may block active sites and inhibit catalytic processes taking place at lower temperatures.
To enhance the catalytic response of Co3O4 nano-catalysts, several recipes have been proposed over the years to allow a selective exposure of the more reactive crystal facets for particular catalytic reactions(Sun et al., 2013). Depending on the recipe, Co3O4 nanoparticles assume the shapes of nanocubes, octahedrons, or nanorods, exposing, respectively, the (001), the (111), or the (101) facets only. These nanoparticle shapes were proven to be beneficial for many catalytical reactions such as hydrodesulfurization of carbonyl sulfide (Wang et al., 2011) or ethylene oxidation(Ma et al., 2010). For these reactions, the least-exposed (110) facet was found to be the most reactive one, and, therefore, the reaction was found to be selectively promoted on nanorods. Observations of this nature have motivated studies on the interaction between this particular facet and water (Xu and Li, 2011; Chen and Selloni, 2012; Creazzo et al., 2019), which have provided some atomistic understanding of the water monolayer regime (Chen and Selloni, 2012) and, very recently, also the inferface with liquid water (Creazzo et al., 2019), under electrochemical conditions.
Unlike for the (110) surface, atomic-level information for the (001)/H2O interface of Co3O4 is scarce, although this facet is reported as being the most stable one and the most relevant for many catalytical reactions. To our knowlegde, only an early attempt by Zasada et al. has been made to understand the water sub- and monolayer adsorption regime on an oxygen-poor Co3O4 surface(Zasada et al., 2010). Thus, several open issues need to be addressed for the (001) surface. The current paper aims at providing insight into the structure and reactivity of the (001) surface upon water adsorption. We use ab initio molecular dynamics simulations to study the following properties of interfacial water: 1) the active binding sites, 2) the adsorption mode, 3) the degree of dissociation, 4) the fundamental interactions that stabilize the adsorption layer, 5) the structural response of the substrate and 6) the hydrogen bond network. Specifically, we have studied the impact of increasing water content between 16 and 32 water molecules on the A-terminated surface, which contains 16 formal Co3+ and eight formal Co3+ ions, and on the B-terminated surface with 16 formal Co2+ ions, and we compared these simulations with room temperature simulations of the water-free systems.
Co3O4 crystallises in a spinel structure with a face-centered cubic unit cell. The primitive unit cell contains 14 atoms (2 Co2+ , 4 Co3+ , and 8 O2− ). Four such primitive cells form the conventional face-centered cubic unit cell of the antiferromagnetic spinel structure (Chen et al., 2011), consisting of 56 atoms (8 Co2+ , 16 Co3+ , and 32 O2− ions). When cutting the bulk in the (001) direction, two (001) surfaces are possible for different termination layers. A surface layer of 16 Co3+ ions forms the B-terminated structure. Slightly above this layer, an additional layer containing 8 Co2+ ions forms the A-termination. Figure 1 shows side-views of the two terminations. Note the exposed (green) Co2+ ions on the A-terminated surface (top figure), whereas the Co3+ ions (purple) are, on both ideal surfaces, embedded in the top-most oxygen layer.
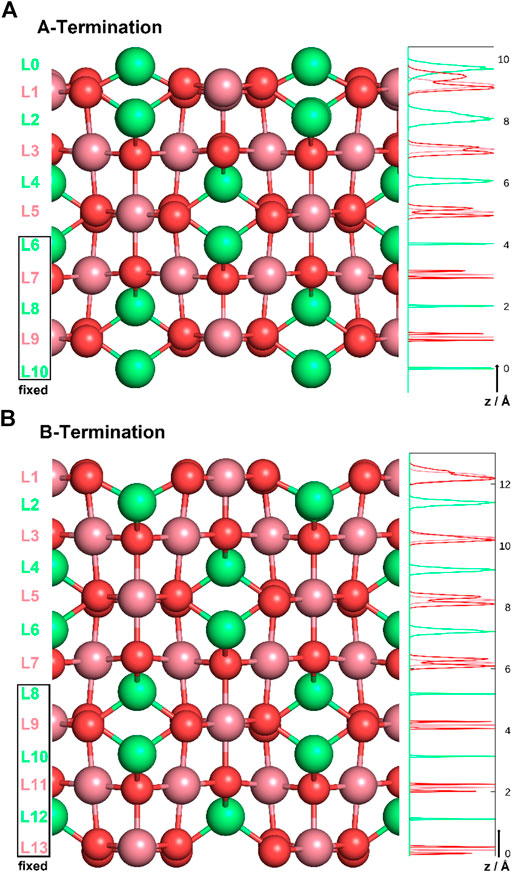
Figure 1. A- (top) and B-terminations (bottom) of the Co3O4 (001) surface. Co2+ ions are shown in green, Co3+ in purple, oxygen in red. On the left, various layers are defined, and atom density profiles along the z axis are shown on the right. Layers L6-L10 and L8-L13 were kept rigid in all studies of A- and B-terminated surfaces, respectively.
The Co3O4 (001) surfaces were modeled as slabs of 11 and 13 atomic layers for A- and B-termination, respectively. The choice of non-stoichiometric slabs with an odd number of layers was motivated by the requirement that two equivalent surfaces on top and bottom minimize the dipole moment within the supercell, at least in the water-free case. The atoms in the bottom five or six slab layers were kept immobile at their bulk positions for A- and B-termination (see Figure 1). All other atoms were free to move. Orthorhombic supercells with (2 × 2) periodicity in the lateral directions (x,y) and dimensions
Spin polarized Born-Oppenheimer molecular dynamics (MD) simulations were performed using the CP2K/Quickstep package (The CP2K developers group, 2016). The Generalized Gradient Approximation (GGA) within its PBE formulation (Perdew et al., 1996) was used to treat the exchange correlation effects. For a more efficient description of dispersion interactions, particularly in the water films, the Grimme D3 correction was added to the PBE exchange-correlation functional (Grimme et al., 2010). A Hubbard correction (Hubbard and Flowers, 1963) term (U) was added for a correct description of Co 3d states. In a previous study, different U values have been used for Co3O4. These values strongly depend on the computational procedure (Chen et al., 2011; Montoya et al., 2011; Chen and Selloni, 2012; Creazzo et al., 2019). For our system, the Hubbard correction was set to
A Nosé-Hoover thermostat with a target temperature of
We first studied the structural response of the A- and B-terminated substrates to water adsorption. The clean surfaces were taken as references. Figure 2 shows each clean surface termination before and after a
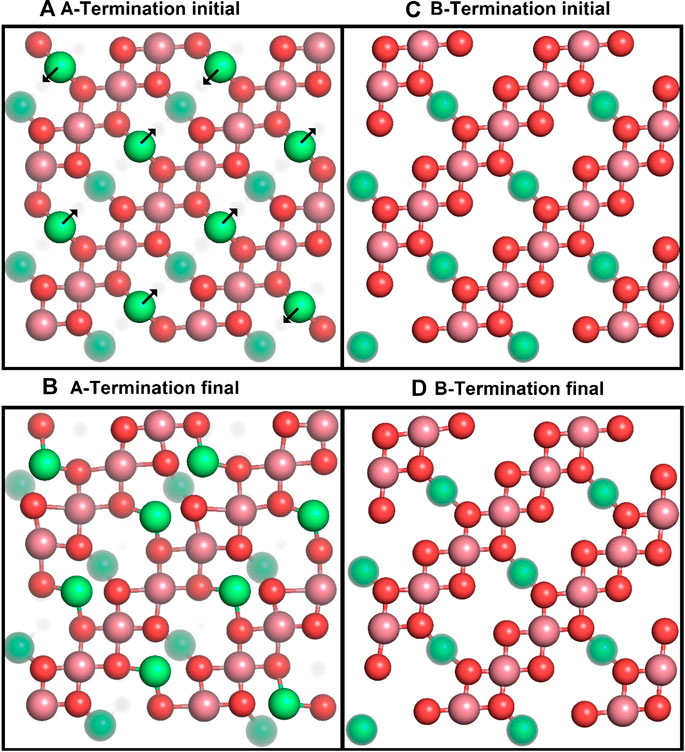
Figure 2. Top views of the initial (top row) and final (after 10 ps; bottom row) surface structures for A- (left) and B-terminated water-free Co3O4 (001) surfaces, with atom colouring (Co2+: green, Co3+: purple, O: red) as in Figure 1. Co2+ ions below the top surface layers are partially grayed out.
Figure 2 shows that the A-terminated water-free surface undergoes reconstruction at room temperature. The relaxation to the final structure is almost instantaneous at the begin of the simulation. The reconstructed A-terminated surface evolves from the unreconstructed one by (green) Co2+ ions moving along the diagonal rows in the direction to one of the empty sites. The occupation of these four-fold hollow sites has already been reported by Montoya et al. (2011). Figure 3A shows the radial distribution function (RDF) of the surface oxygen atoms (those in the L1 layer) to the outermost Co2+ ions in layer L0 (see Figure 1). At 300 K, the first maximum of the RDF shifts towards larger distances from the corresponding bulk crystal value of
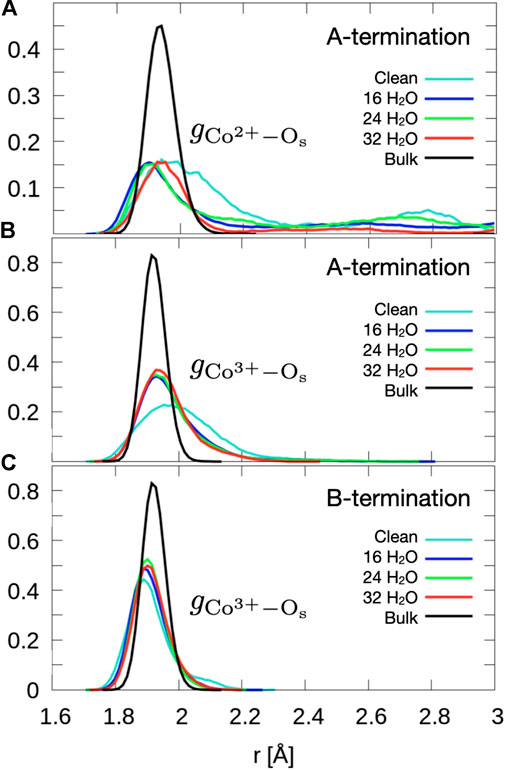
Figure 3. Radial distribution functions of surface oxygens to outermost (A) Co2+ of the A-termination (layer L0), (B) Co3+ of the A-termination (L1) and (C) the Co3+ of the B-termination (L1). Data are obtained by averaging over the last 10 ps.
The calculated average coordination numbers (defining the cut-off distance as 2.3 Å and averaging over the last half of the simulations, see Supplementary Figure S2 for illustration) of Co2+ ions in L0 and Co3+ ions in L1 reveal the reason for the lifting of the reconstruction upon water adsorption. Relative to the ideal bulk lattice, coordination in the L0 layer of the water-free surface increases from 2 to 3.5, while the coordination in L1 (Co3+) is reduced slightly from 5 to 4.9. With the adsorption of 16 water molecules, which mostly (see below) solvate the Co3+ ions in L1, the coordination number in L1 increases to 5.6, at the expense of a slight reduction of the average coordination in L0 from 3.5 to 3.0, indicative also of the lifting of the reconstruction addressed above. Increasing water content to 24 molecules solvates the L0 layer, by increasing the average coordination number of Co2+ to 3.7, while hardly changing the average coordination number in the L1 layer from 5.6 to 5.5. Increasing the water content to 32 water molecules leads to a very minor increase in the coordination number of Co2+ ions in the L0 layer to 3.8, while the coordination number in the L1 layer is stable at 5.5. Taken together with the snapshots in Figure 2, the results indicate that water adsorption leads to an (expected) increase in overall cobalt coordination number, which alleviates the need for reconstruction (driven by an increase in average coordination number), thereby reducing the strain energy of the crystal.
The free B-terminated surface shows no reconstruction during the 10 ps molecular dynamics runs, as can be observed by comparing Figures 2C, D. Relaxation effects are less prounounced than on the A-termination. The maximum of the RDF for Co3+ ions (layer L1) in Figure 3C shifts towards smaller distance on the free surface and is sharper than for the A-termination, where the shift is in the opposite direction (Figure 3B). Water adsorption reduces this shift relative to the bulk, which can be interpreted as the additional solvation of surface Co3+ ions, which increases their coordination number from 5 towards 6, thereby creating a more bulk-like local oxygen environment for the surface ions.
Figure 4 shows top, front and side views of the final snapshots of the simulated water films with 16, 24, and 32 molecules on the A- and B-terminated Co3O4 (001) surfaces. On both terminations, it is seen that, for all coverages, water adsorbs via a partial dissociative mode; the dissociation degree within the contact layer is by and large independent of water content. To gain some statistical insights into the varying properties of the water layers, their interfacial bonds and hydrogen bond network, we analyse density profiles, characteristic radial distribution functions and OH orientations of adsorbed species on the different surface terminations.
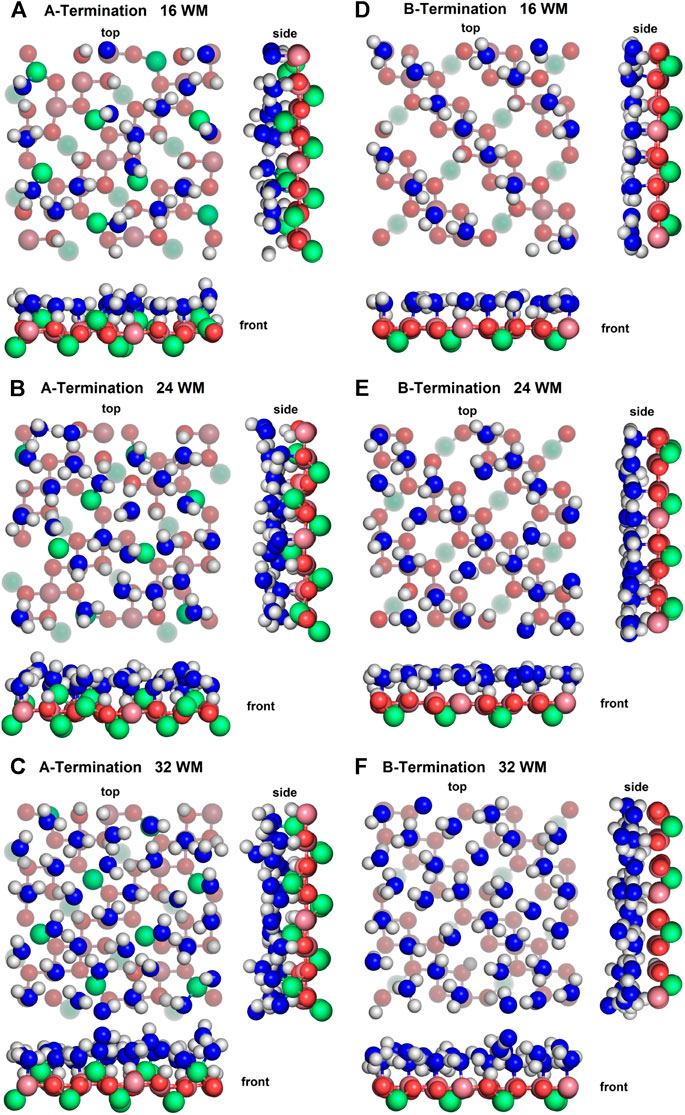
Figure 4. Snapshots of final configurations of each simulation. Co2+: green, Co3+: purple, slab oxygens: red, water/hydroxide oxygen: blue, hydrogen: white. Greyed-out atoms are located in lower layers.
On the A-termination, water can bind either to the Co2+ ions in layer L0 or to the Co3+ surface ions in the adjacent L1 layer. Altogether, 32 possible adsorption sites are, thus, present in the 2 × 2 cell (2 per Co2+ and one per Co3+ ion). Hence, 16, 24 and 32 adsorbed water molecules correspond, respectively, to 0.5, 0.75 and 1 ML coverage. Figure 5A shows the out-of-plane density profiles of water oxygen (thick lines) and hydrogen atoms (thin lines) at different coverages. All oxygen densities have two maxima, one around 2 Å and another one around 2.5 Å from the position of the L1 layer, indicating a buckled water overlayer. At the coverage of 0.5 ML the majority of the water molecules are found in the lower sublayer. As the first 16 water molecules have been found to preferentially solvate the Co3+ ions in the L1 layer, one possible explanation for the bimodality might be that the closer sublayer solvates Co3+ and the more distant sublayer solvates Co2+ ions. Integrating the density peak from 0 to 2.3 Å and from 2.3 to 3.0 Å yields on average approximately 12.8 water molecules or hydroxide species in the closer and 3.2 molecules in the more distant sublayer, which does not agree well with the visual inspection of the interface (see also Figure 6), which leads to an estimate of about six molecules interacting with the Co2+ ions in the L0 layer. Thus, it is quite likely that, in addition to the difference between Co3+ and Co2+ solvation, the intrinsic (static and dynamic) inhomogeneity of the L0 layer itself may contribute to the observed oxygen density (see discussion of Figure 7). Increasing water coverage to 0.75 ML increases the contribution of the closer subpeak of the oxygen density only slightly to 12.9, whereas most of the additional water molecules are found in the more distant sublayer, in agreement with the progressive solvation of Co2+ ions in L0. Even further increase of water content to 1 ML coverage yields 12.6 and 15.7 molecules solvating the closer and more distant layers, respectively. Thus, in summary, these data and coordination numbers suggest that at 1 ML coverage most Co3+ ions are solvated by one water molecule or hydroxy group, whereas on average more than 1.5 water molecules or hydroxy species interact with each Co2+ ion directly. The remaining water molecules at the higher water coverages are located in the diffuse range beyond 3 Å.
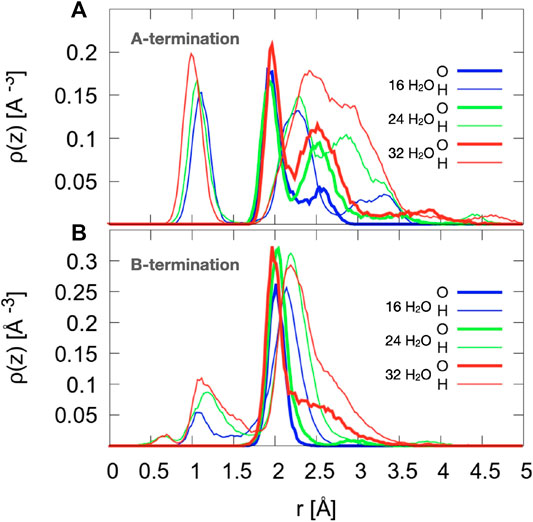
Figure 5. Density profiles of oxygen atoms of water and hydroxide species (thick lines) and all hydrogen atoms (thin lines), averaged over the last 10 ps. The center of mass of layer L1 (see Figure 1) is taken as reference.
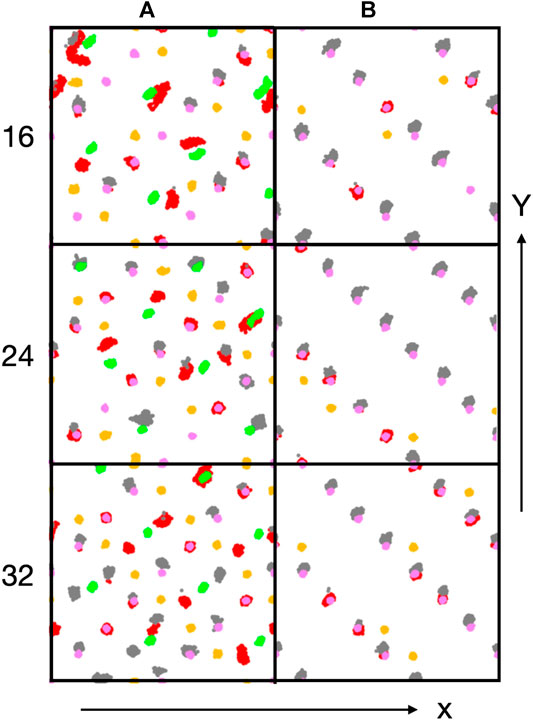
Figure 6. Trajectory traces of interfacial Co ions (Co2+: green, Co3+: purple) and oxygen atoms of hydroxyl groups (red: oxygen originally from water molecule, orange: oxygen original from lattice) and water oxygen atoms (grey). Water oxygen atoms have been shifted upwards (along the y-direction) by 0.5 Å for better discernibility.
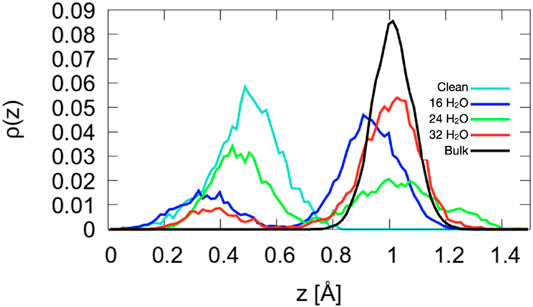
Figure 7. Density profiles of the Co2+ atoms for A-terminated surfaces. The center of mass of layer L1 (see Figure 1) is taken as reference position
The hydrogen density profiles show a peak centered around 1 to 1.1 Å, which corresponds to protons transferred from water molecules to the oxide ions. By integrating this peak one can conclude that on average 10.9, 12.0, and 14.0 water molecules transfer a proton to the oxygen atoms in the crystal lattice for 0.5, 0.75, and 1 ML coverage, respectively. The second hydrogen peak (clearly visible around 2.2-2.3 Å for the two lower coverages) indicates that the hydroxyl species formed from the water oxygen atoms are oriented on average at a substantial angle to the surface normal with the oxygen atom pointing down, which can be seen from the fact that this peak is further away than the oxygen peak (at around 2 Å). At the highest coverage (red line), the H peak starts rising at approximately the same distance from the reference surface, but the maximum is shifted further away from the surface, probably because the distribution of hydrogen atoms from OH overlaps with the distribution of water hydrogen atoms. Integrating this second hydrogen peak over the range from 1.7 to 2.6 Å yields 15.4, 18.9, and 25.0 hydrogen atoms. This also supports the conclusion that water and OH hydrogens are part of this second peak.
Figure 6 shows trajectory traces of surface cobalt ions (Co2+: green, Co3+: purple) and oxygen atoms from hydroxyl groups (red: O originally from water, orange: O originally from oxide) and from undissociated water molecules (grey, shifted upwards by 0.5 Å for better discernibility). First one notes, in agreement with the conclusions drawn before, that there is no visible reconstruction of the A-sites. Most oxygen traces for the A-terminated surface (left column) are localized, indicating a relatively immobile water/hydroxy overlayer. Already at 0.5 ML coverage (Figure 6) one notes a substantial amount of dissociated water molecules that transfer a proton to an (orange-colored) oxygen atom in the lattice and produce a second (red) hydroxy group. Undissociated water molecules are visible in grey. In line with the coordination numbers discussed above, many water molecules or hydroxy groups are attached to the Co3+ ions. However, not all of the Co3+ and not all of the Co2+ ions interact with these oxygen species. With increasing water content (Figure 6), all cobalt ions become solvated at 1 ML (32 water molecules), with the exception of a single Co3+ ion (at the upper right corner). Also note that there are several traces where red hydroxy and grey water traces are located roughly at the same spot, indicating proton equilibria between OH and H2O species. At 1 ML coverage, Co2+ ions are not fully solvated from the top but tend to have one or two patches of OH in the off-normal direction, indicating that also these ions are well solvated, often by two OH groups and/or water molecules.
As shown in Figure 7, the structure of the topmost Co2+ ion layer (L0) is not uniform. The density profiles are bimodal with two maxima separated by about 0.6 Å. The bistable nature of the Co2+ density has no obvious origin: While there is a larger tendency for ions solvated by a water molecule to be closer to the surface and a tendency for ions solvated by two hydroxide ions to be further from the surface, all other configurations can also be observed, at least at one of the three coverages. In addition, several ions dynamically switch from an oscillatory motion around one of the configurations to one around the other for extended periods of time. Certainly, the Co2+ ions and their environment form the most dynamic part of the A-terminated interface.
Proton transfer takes place both from water films to the surface and within the water films. In the former case, the dissociated H atoms are transferred to surface oxygens across the neighboring trench which are bound to Co2+ ions underneath. In the latter case, proton transfer is made via Grothuss mechanism between water molecules binding to the surface and the ones bridging two such molecules. This mechanism is more likely to occur with increasing coverage, as more bridging molecules are present on the surface. However, the high dissociation degree in the contact Co2+ layer remains almost the same (see Figures 4B,C).
Figure 8A shows the radial distribution functions of Co2+ ions in layer L0 at the surface and oxygen atoms of water and hydroxide molecules. At 0.5 ML, the Co2+-Ow radial distribution function shows a sharp peak centered at
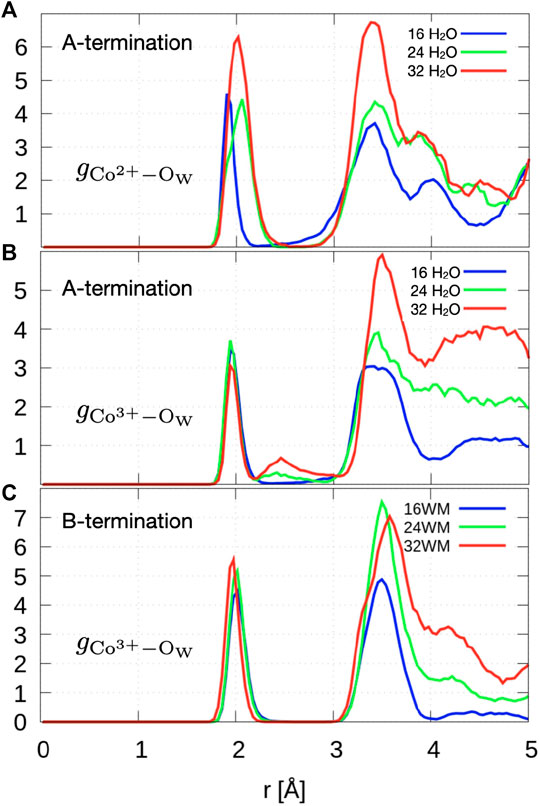
Figure 8. Radial distribution function of topmost Co2+/Co3+ to oxygen atoms of water and hydroxide ions.
Figure 9 shows the distribution of the cosine of the angle θ between the surface normal and the OH vector of intact water molecules, (top), OH groups formed from water molecules (center) and OH groups formed from the proton transferred from water to an oxygen atom of the surface (bottom). The plane of molecular water which adsorbs at 0.5 ML on Co3+ lies mostly parallel to the surface. Increased water coverage increases the number of configurations with protons pointing slightly towards the surface. In addition, some OH groups point almost straight up or straight down towards the surface. The predominantly flat orientation allows for optimum hydrogen bonding at the limited water coverage, even at 1 ML coverage.
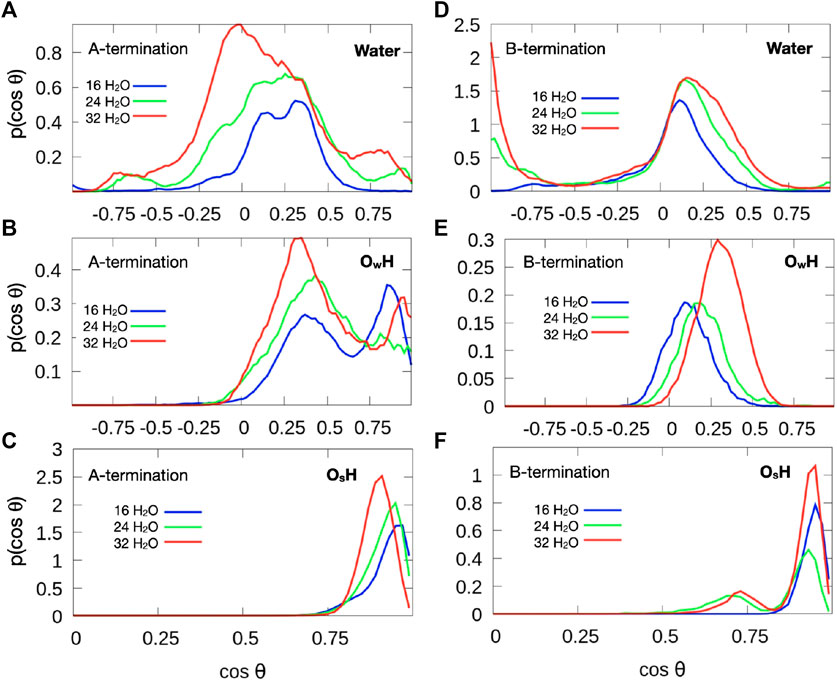
Figure 9. Orientation of OH vectors of water molecules (top), hydroxide species with oxygen from water molecule (
Hydroxide species, which are formed by proton detachment of an added water molecule, show a double maximum in their angular distribution (Figure 9B). One maximum in the range
On the B-termination only Co3+ sites are available for adsorption and 16 potential adsorption sites are available in the 2 × 2 supercell. The adsorption of 16, 24, and 32 water molecules thus corresponds to 1, 1.5, and 2 ML coverage, respectively. As seen from Figures 4D-F, water films are partially dissociated in the contact layers at all coverages, and the dissociation degree is 25% on average. Proton transfer occurs here also on unsaturated surface oxygen atoms that are not connected to an adjacent Co2+ in the lower (L2) layer, but less frequently than on those connected to the Co2+ in the top (L0) layer in the case of the A-termination. As is also visible in Figure 6, at 1 ML the lateral distributions in the (x, y) plane of topmost Co3+ ions (L1) show mostly water molecules in an epitactic layer binding on top of the Co3+ ions, while a few OH groups bridge them in a manner similarly as on the A-terminated surface.
Figure 5B indicates the formation of an almost flat water layer at 1 ML as illustrated by the oxygen density peaks at
The radial distribution function of Co3+-Ow (Figure 8C) shows a first peak centered around
Water molecules at small surface coverage are oriented almost parallel to the surface (Figure 9D). With increasing water content additional configurations occur where one OH points towards the surface while the other points at a small angle away from the surface. This behaviour is indicative of a growing hydrogen bond network. Hydroxide ions created from water molecules by proton transfer to the surface are strongly tilted (Figure 9E), with the OH vector almost parallel to the surface at low water coverage. With increasing coverage, the OH direction is more parallel to the surface normal. This behavior may also be associated with the fact that there is substantial proton exchange between OH species and water molecules (see red and grey spots in Figure 6). Most OH groups originating from a surface oxygen atom (Figure 9F), however, point almost upward, similarly to the A-terminated surface, although a few OH groups are also substantially tilted (at
Water dissociation into OH species and subsequent proton transfer to the surface is a frequent scenario on both surface terminations. Both surfaces are strongly hydroxylated. On the A-terminated surface, on average 5.5 of the 16 water molecules at the 0.5 ML coverage remain undissociated, while about 21 OH groups exist on average. With increasing water content the average number of OH groups increases to 23.5 and 28.0 for the simulations at 0.75 and 1.0 ML, respectively. The number of water molecules also increases from about 5.5 to 12 to 18 for 0.5, 0.75, and 1 ML, respectively. For the B-terminated surface, the number of OH groups increases only moderately from 6.0 to 6.2 and 10.1 and the number of water molecules from 13 to 20.9 to 26.8 (at 1, 1.5 and 2 ML, respectively).
Ab initio molecular dynamics simulations have shown that water adsorbs on both terminations of the Co3O4 (001) surface via a partially dissociative mode. The dissociation degree on the A-termination in contact with a water layer is significantly higher than on the B-termination.
On the A-terminated surface, water fully dissociates on or near all sites and thereby breaks up bridging oxygen atoms, mostly between Co3+ sites, but also near Co2+. One can even observe coadsorption of intact and dissociated water molecules on the same Co2+ ion. OH− adsorption promotes a bulk-like geometry of the reconstructed clean surface. The degree of dissociation on the adjacent Co3+ sites is 50% and remains constant with increasing water coverage. The interface is dynamic with frequent, localised proton transfers between water molecules and hydroxide species via a Grotthuss mechanism. Nevertheless, the oxygen arrangement in the water layer is quite rigid.
On the B-termination, a similar behaviour is observed. However, the interface is less reactive. Here, water forms epitactic layers on top of Co3+ sites and the dissociation degree is less than 25% in the contact layer at all coverages. Proton transfer within the water film and towards the surface is also observed, but with lower probability than on the A-terminated surface.
Both surfaces are strongly hydroxylated with rigid oxygen layers but mobile and disordered proton subsystems. Overall, water solvates the A-terminated surface more strongly. It is also noteworthy that on the A-terminated surface, if water is present, the surface reconstruction observed on the clean surface is released again, due to the ability of water to increase the coordination number of the Co2+ ions substantially without moving them along the rows.
In summary, the larger degree of water dissociation on the A-terminated surface and the higher local abundance of OH groups (relative to water molecules) around Co2+ ions as compared to Co3+ ions is consistent with thermal desorption experiments which show high-temperature desorption peaks most probably due to OH groups. These difficult to displace tightly bound OH groups may be at the origin of the observed low oxidation activity on the A-terminated (001) surface.
The raw data supporting the conclusions of this article will be made available by the authors, without undue reservation.
We have contributed equally to the work: planning, discussions and writting.
The authors declare that the research was conducted in the absence of any commercial or financial relationships that could be construed as a potential conflict of interest.
This study was funded by the Deutsche Forschungsgemeinschaft (DFG, German Research Foundation) – 388390466 – TRR 247 within the work of Project A6. The authors gratefully acknowledge computing time granted by the Center for Computational Sciences and Simulation (CCSS) of the Universität of Duisburg-Essen and provided on the supercomputer magnitUDE (DFG grants INST 20876/209-1 FUGG, INST 20876/243-1 FUGG) at the Zentrum für Informations- und Mediendienste (ZIM). We would also like to thank Rossitza Pentcheva and her group (TRR 247 Project B4) for helpful discussions and optimised oxide structures.
The Supplementary Material for this article can be found online at: https://www.frontiersin.org/articles/10.3389/fenrg.2020.604799/full#supplementary-material
Anke, S., Bendt, G., Sinev, I., Hajiyani, H., Antoni, H., Zegkinoglou, I., et al. . (2019). Selective 2-propanol oxidation over unsupported Co3O4 spinel nanoparticles: mechanistic insights into aerobic oxidation of alcohols. ACS Catal. 9(7):5974–5985 doi:10.1063/1.5053729.
Cai, Y., Xu, J., Guo, Y., and Liu, J.. (2019). Ultrathin, polycrystalline, two-dimensional Co3O4 for low-temperature co oxidation. ACS Catal., 9(3):2558–2567 doi:10.1021/acscatal.8b04064.
Chen., J., and Selloni, A.. Water adsorption and oxidation at the Co3O4 (110) surface. (2012). J. Phys. Chem. Lett. 3(19):2808–2814. doi:10.1016/j.cplett.2010.12.015.
Chen, J., Wu, X., and Selloni, A.. (2011). Electronic structure and bonding properties of cobalt oxide in the spinel structure. Phys. Rev. B. 83:245204. doi:10.1103/physrevlett.77.3865.
Creazzo, F., Ruth Galimberti, D., Pezzotti, S., and Gaigeot, M.-P.. (2019). DFT-MD of the (110)-Co3O4 cobalt oxide semiconductor in contact with liquid water, preliminary chemical and physical insights into the electrochemical environment. J. Chem. Phys. 150(4):041721. doi:10.1063/1.5053729
Deng, X., and Tüysüz, H.. (2014). Cobalt-oxide-based materials as water oxidation catalyst: recent progress and challenges. ACS Catal. 4(10):3701–3714. doi:10.1021/acscatal.9b01048.
Grimme, S., Antony, J., Ehrlich, S., and Krieg, H.. (2010). A consistent and accurate ab initio parametrization of density functional dispersion correction (DFT-D) for the 94 elements H-Pu. J. Chem. Phys., 132(15):154104.
Hubbard, J., and Flowers, B. H. Electron correlations in narrow energy bands. (1963). Proc. Roy. Soc. Lond. Math. Phys. Sci. 276(1365):238–257. doi:10.1021/jp109264b.
Kim, K. J. and Park, Y. R. (2003). Optical investigation of charge-transfer transitions in spinel Co3O4. Solid State Commun., 127(1):25–28. doi:10.1021/jp200581s.
Llorca, J. P., Dalmon, J.-A., and Homs, N.. (2004). Transformation of Co3O4 during ethanol steam-re-forming. activation process for hydrogen production. Chem. Mater. 16(18):3573–3578. doi:10.1021/cs500713d.
Ma, C. Y., Mu, Z., Li, J. J., Jin, Y. G., Cheng, J., Lu, G. Q., et al. . (2010). Mesoporous Co3O4 and au/Co3O4 catalysts for low-temperature oxidation of trace ethylene. J. Am. Chem. Soc., 132(8):2608–2613. doi:10.1021/cm049311p.
Montoya, A., and Haynes, B. S.. (2011). Periodic density functional study of Co3O4 surfaces. Chem. Phys. Lett. 502(1):63–68. doi:10.1063/1.3382344
Perdew, J. P., Burke, K., and Ernzerhof, M.. (1996). Generalized gradient approximation made simple. Phys. Rev. Lett. 77:3865–3868. doi:10.1039/c3ta12960h.
Shinde, V. R., Mahadik, S. B., Gujar, T. P., and Lokhande, C. D.. (2006). Supercapacitive cobalt oxide (Co3O4) thin films by spray pyrolysis. Appl. Surf. Sci. 252(20):7487–7492. doi:10.1016/j.apsusc.2005.09.004
Sun, H., Ang, H. M., Tadé, M. O., and Wang, S.. (2013). Co3O4 nanocrystals with predominantly exposed facets: synthesis, environmental and energy applications. J. Mater. Chem. 1:14427–14442. doi:10.1039/C3TA12960H
The CP2K developers group. CP2K is freely available from: http://www.cp2k.org/, (2016).
Wang, X., Ding, L., Zhao, Z., Xu, W., Meng, B., and Qiu, J.. (2011). Novel hydrodesulfurization nano-catalysts derived from Co3O4 nanocrystals with different shapes. Catal. Today 175(1):509–514. doi:10.1016/j.cattod.2011.02.052
Xu, X. L., and Li, J. Q.. (2011). DFT studies on H2O adsorption and its effect on CO oxidation over spinel Co3O4 (110) surface. Surf. Sci. 605(23):1962–1967. doi:10.1021/ja906274t.
Zasada, F., Piskorz, W., Cristol, S., Paul, J.-F., Kotarba, A., and Sojka, Z.. (2010). Periodic density functional theory and atomistic thermodynamic studies of cobalt spinel nanocrystals in wet environment: molecular interpretation of water adsorption equilibria. J. Phys. Chem. C. 114(50):22245–22253. doi:10.1021/jp109264b
Keywords: solvation, reactivity, ab initio molecular dynamics, surface termination, coordination number, Cobalt oxide, Spinel
Citation: Kox T, Spohr E and Kenmoe S (2020) Impact of Solvation on the Structure and Reactivity of the Co3O4 (001)/H2O Interface: Insights From Molecular Dynamics Simulations. Front. Energy Res. 8:604799. doi: 10.3389/fenrg.2020.604799
Received: 10 September 2020; Accepted: 21 October 2020;
Published: 26 November 2020.
Edited by:
Jun Huang, Central South University, ChinaReviewed by:
Mohammad J. Eslamibidgoli, Forschungszentrum Jülich, GermanyCopyright © 2020 Kox, Spohr and Kenmoe. This is an open-access article distributed under the terms of the Creative Commons Attribution License (CC BY). The use, distribution or reproduction in other forums is permitted, provided the original author(s) and the copyright owner(s) are credited and that the original publication in this journal is cited, in accordance with accepted academic practice. No use, distribution or reproduction is permitted which does not comply with these terms.
*Correspondence: T. Kox, dGltLmtveEB1bmktZHVlLmRl; E. Spohr, ZWNraGFyZC5zcG9ockB1bmktZHVlLmRl; S. Kenmoe, c3RlcGhhbmUua2VubW9lQHVuaS1kdWUuZGU=
Disclaimer: All claims expressed in this article are solely those of the authors and do not necessarily represent those of their affiliated organizations, or those of the publisher, the editors and the reviewers. Any product that may be evaluated in this article or claim that may be made by its manufacturer is not guaranteed or endorsed by the publisher.
Research integrity at Frontiers

Learn more about the work of our research integrity team to safeguard the quality of each article we publish.