 Xiangyu Sun
 Jijiang Ge1*
94% of researchers rate our articles as excellent or good
Learn more about the work of our research integrity team to safeguard the quality of each article we publish.
Find out more
TECHNOLOGY AND CODE article
Front. Energy Res., 21 January 2021
Sec. Advanced Clean Fuel Technologies
Volume 8 - 2020 | https://doi.org/10.3389/fenrg.2020.601158
This article is part of the Research TopicLow-Carbon Technologies for the Petroleum IndustryView all 19 articles
The results of visualization experiments primarily provide descriptions of local features or a general conclusion because, to obtain accurate numerical results, it is necessary to count each small point in the visual image and calculate the remaining oil based on the color. There is currently no method that can automatically and accurately calculate the recovery factor based on a visualized image. Computer graphics can be used to solve this problem, and Matlab software with its powerful image calculation functions was used to analyze and calculate images of visualization experiment processes. This article first summarizes the development and respective characteristics of the visual experiment evaluation of oil displacement agents. Then, the corresponding relationship between the actual oil displacement recovery parameters and the image parameters is introduced in detail, and a calculation formula for the visual image recovery factor is summarized. Finally, using the quantitative visual experimental results from different oil displacement agent injection methods as an example, we compared the different oil displacement processes and their recovery. The different characteristics of the two injection methods were evaluated, and the feasibility of the calculation method was verified. This method provides data support for interpreting visual experimental processes and a description of the experimental results. This provides a clear and unified calculation method for the recovery factors of oil displacement processes, which often involve many difficult-to-compare processes.
At present, most oil fields in China have entered the tertiary oil recovery period, and it is necessary to inject oil-displacing agents into oil and gas formations to improve oil recovery; therefore, the evaluation of oil-displacing agents is particularly important and is usually divided into two stages (Pei et al., 2017; Li et al., 2018; Wu et al., 2018). The first is the phase state test of the oil-displacing agent itself. This stage mainly analyzes the properties and parameters to indirectly evaluate the oil-displacing effect of the oil-displacing agent and formulate injection plans. The second stage is directly evaluating the performance of the oil-displacing agent to enhance the recovery factor by simulating the exploitation of a formation. According to the injection plan, the oil-displacing agent is tested, and the results are compared with previous estimates to improve the performance of the oil-displacing agent (Sun et al., 2019).
The two most commonly used methods for complete and systematic process simulation evaluation of oil-displacing agent enhanced oil recovery are numerical simulation experiments and core displacement experiments. Traditional core displacement experiments provide the oil displacement efficiency, but it is impossible to observe the oil-displacing process in the formation of crude oil. It also does not reflect the different influences of different variables (such as injection mode, injection speed, concentration, dose, etc.) on the internal reservoir, and therefore it is impossible to improve the oil-displacing agent system according to the differences between experimental phenomena during displacement (Wang et al., 2019). For the mathematical model evaluation experiments, although the oil displacement process can be observed, it is a simulation process calculated based on geological characteristics and oil displacement agent parameters using discovered laws. However, the seepage laws of many low-permeability pores have not been fully clarified, making it difficult to simulate the real underground fluid flow process (Artun and Kulga, 2020; Liu et al., 2020a; Miah et al., 2018; Sabet et al., 2020; Shi et al., 2019; Wu et al., 2019; Zhang et al., 2020a). At the same time, the evaluation results obtained by this method are too modular and difficult to verify.
In addition to the two conventional methods of core displacement evaluation and mathematical simulation evaluation, visualization model evaluation methods have also been used, such as microfluidics and micromodels (Priest et al., 2011). In fact, as early as 1954, Charles et al. studied gas-liquid displacement and liquid-liquid displacement in capillary tubes (Templeton, 1954). In 1959, Chatenever et al. first used a plane model filled with glass beads to roughly study the solution gas flooding behavior and developed a model from a thin tube to a plane model (Chatenever et al., 1959). In 1971, Donaldson and others tested the oil displacement in a lipophilic system and a hydrophilic system by filling sand in a glass plate. The resulting visualization model was used to develop a sand-filling model (Donaldson and Thomas, 1971). In 1982, Wang et al. used a microscopic visualization glass bead filling model to study the CO2 flooding process, which further reduced the visualization plane model (Wang, 1982). In 1986, Trygstad et al. developed a visualization model for etching microscopic rock pores on a glass plate, which changed the pores of the microscopic model from homogeneous to heterogeneous (Ttygstad et al., 1986). In 2007, Clerke et al. fitted the displacement efficiency calculated by a mathematical model with a microscopic visualization model and established a connection between the visualization model and the digital model (Clerke, 2007). In 2011, based on a visualization model, Shabani et al. used a refinement algorithm to show the color contrast of the displacement channels and applied image-processing technology to the visualization displacement model (Afrapoli et al., 2011). In the following ten years, micro-visualization model technology developed rapidly, resulting in a variety of visualization models and test methods. The magnification of the observation lens continuously increased, making it easier to observe phenomena (Neel et al., 2018; Zhang et al., 2020b).
Visualization model experiments require only short test times and provide easy observations, explanations, and understanding, and convenient methods for improving oil-displacing agents, but their further development is limited by their ability to calculate experimental results (Chen et al., 2019). Visualization evaluation methods are mostly used to observe subtle phenomena of fluids in porous media. The analysis of overall oil displacement results is relatively vague and general and cannot provide accurate oil recovery values to support further trend analysis and rule induction of experimental data. The main reason why the experimental results cannot be accurately analyzed is that the visualization model is small and the output fluid of the experiment is difficult to measure. Secondly, because the color of crude oil or formation water is similar to some injections, it is not easy to distinguish the mixed or overlapping parts based on experimental images. To solve the above problems and increase the accuracy of the visualization simulations, an evaluation method using a visualization glass plate model to evaluate oil-displacing agents and writing an analysis program in Matlab for visual image analysis and data calculation is proposed.
There are many types of visualization models, which can be divided by their size (macro models and micro models), the simulated stratigraphic structure (homogeneous models and heterogeneous models), and the production method (etching models and filling models). Etching models are based on the stratum structure or a specific shape using an etching machine to engrave hollow pore channels on a transparent plastic or glass plate. In recent years, the development of microfluidics using micro-etching methods has made breakthroughs in many fields. In the petroleum industry, microfluidic models are mostly used to observe changes in the fluid structure and droplet flow. For example, Kang et al. observed the morphology and stability of sodium polyacrylate emulsions in a 5 × 5 cm glass microetching model (Wang et al., 2020). The advantage of this etching model is that the image is clear and easy to compare and analyze. The disadvantage is that the model structure cannot be changed, and its flexibility is insufficient. The filling model involved digging out a regular-shaped groove of a specified size between two transparent plates and then filling the groove with specific sand to simulate a formation. This model generally simulates a homogeneous layer or a fractured formation. For example, Pei et al. observed the influence of plugging agent injection on the remaining oil distribution in an 18 × 18 cm sand filling model (Pei et al., 2018). The advantage of this model is that the permeability of the simulated formation can be adjusted according to the formation conditions. The disadvantage is that it cannot simulate heterogeneous formations, the sand filling process is cumbersome, and the experimental efficiency is low.
Comparison and screening showed that the visual glass plate model developed by Ren in 2003 is suitable for simulating oil displacement experiments for different formation pore structures (Fu et al., 2016; Liu et al., 2020b). A transparent glass plate experiment was observed through a lens that provided 20-times magnification and allowed the experiment process video to be recorded. This method could show the increased production effect of oil displacement agent flooding compared with water flooding, and also show some of the subsequent effects of the oil displacement system on the formation. It is also possible to more intuitively observe the state when oil droplets are trapped and carried out of the simulated formation during the crude oil viscosity reduction process. In addition, visual glass plate model experiments can show the oil production and production increase process of the oil field by recording the whole experiment, which is easier for field technicians to understand. The phenomenon occurring during displacement can also explain the phenomena of fluid mechanics, reservoir physics, and other disciplines, and helps understand the dynamics of underground fluids. At the same time, it also complements and validates traditional core displacement experiments and numerical simulation experiments (Guo et al., 2018; Mask et al., 2019; Zhang et al., 2019).
The advantage of the glass plate model compared with other visualization models is that it has an independent device for simulating formations. This model is not etched or filled with sand on a visualization glass plate but is micro-etched on two independent hard plastic films and then filled with fine particles. After the two plastic films are processed into a simulated formation, the back of the hard plastic film is glued to the center of the two glass plates. Then, the glass plates are aligned and compacted according to the corresponding positions of the plastic film etching structure, and the model is completed. This method of simulating stratum with an independent hard plastic film is convenient for changing the structure of the stratum and making strata with different homogeneities. According to the reservoir conditions or requirements, a variety of infrared etching designs that simulate the formation structure can be carried out on the plastic film. The permeability difference between the heterogeneous layers can be adjusted by changing the size of the fill gravel, which makes it easy to distinguish between high-permeability and low-permeability regions during the experiment. After the experiment, the plastic film used to simulate the formation can be gently scraped off with a knife, and a new stratum-simulating thin plate can be immediately attached to the glass plate for the next set of experiments, which greatly improves the experimental efficiency.
However, the current limitation of this visualization glass plate model method is that it can only perform test experiments at room temperature and low pressures. Under high pressures, the rubber plugged around the plastic film that simulates a formation can leak fluid and cause the experiment to fail. The maximum pressure that the experiment can withstand is only about 3 MPa; therefore, this model cannot be used to test strong plugging agents. At present, the problem that needs to be solved in high-temperature experiments is the observation and recording problem during constant-temperature heating.
A typical computer graphics research tool is Matlab (Matrix and Laboratory) software, which is an advanced computing environment that mainly involves scientific computing, visualization, and interactive programming. It is widely used for data visualization and results prediction, by converting data into images. In contrast, image processing (image digitization) is also its main function, but this function has relatively few applications in oilfield development. The study found that many image processing functions of Matlab are similar to the principle of the image analysis method sought by the visual model test. It must be able to divide and highlight the indistinguishable area of the image color and also obtain an accurate value through analysis.
This paper is based on the visualization of a glass plate model, according to the graphics processing function of Matlab, using image processing technology to analyze a visual displacement experiment. After programming as required, the following analysis is performed on the visual displacement picture.
(1) Edge detection: the edge detection will display the displacement range and residual oil in the range;
(2) Contour extraction: based on (1), the displacement range, i.e., the sweep coefficient (the ratio between the reservoir volume swept by the displacement agent and the entire oil-containing volume), was extracted and determined. The calculation method is shown in Eq. 1;
(3) Generate a gray-scale histogram: Based on (2), the gray-scale histogram generated from the image can be used to calculate the corresponding oil washing efficiency according to the proportion of the vertical axis (the ratio of the amount of oil produced by the oil layer affected by the oil displacing agent to the reserves of this part of the oil layer). The calculation method is shown in Eq. 2;
(4) Generate a three-dimensional grayscale image based on (2), which can be rotated, and the grayscale size of each point can be observed. The displacement model that clearly shows the oil content is used to compare the displacement effect of each position throughout the whole experiment, and it is easy to identify deficiencies in the oil displacement agent, making it easy to identify areas for improvement.
The calculation principle of the experimental recovery factor is based on the empirical formula of the recovery degree of geological reserves proposed by Sipachv and Nazarov. The oil recovery factor is equal to the product of the swept efficiency of water flooding and the oil washing efficiency (Eq. 3). Figure 1 is used as an example to explain in detail how to use computer graphics to obtain relevant parameters for calculating the displacement recovery factor.
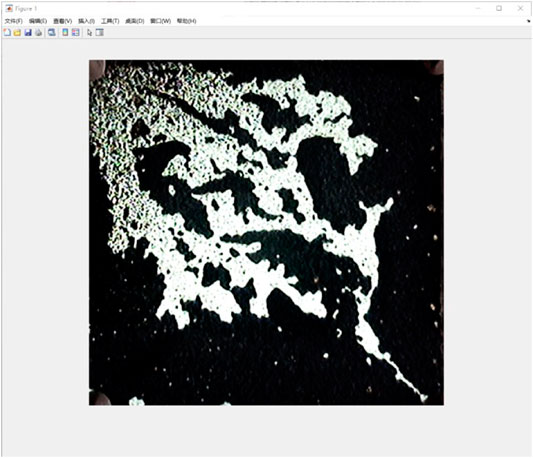
FIGURE 1. Oil displacement outline of the visualization glass plate experiment.
First, the selected picture is converted into a gray-scale image by removing the color of the injection or oil with dye (Figure 2A). Authors also generates a pixelated grid on the picture to facilitate subsequent understanding and analysis, as shown in Figure 2B. Based on this, edge detection and contour extraction are performed on the image (Figure 2C). Compared with the original image, the image after contour extraction is divided into three parts: the outer part of the contour, the inner part of the contour, and the coordinate axis. The color of the untouched crude oil outside the displacement channel (the part outside the contour) is inverted to white. The displacement channel (the inner part of the contour) retains the original grayscale. The pixelated grid axis of the contour extraction map is used to calculate the area within the contour range and its percentage in the entire picture. The calculation formula used for the above process is as follows:
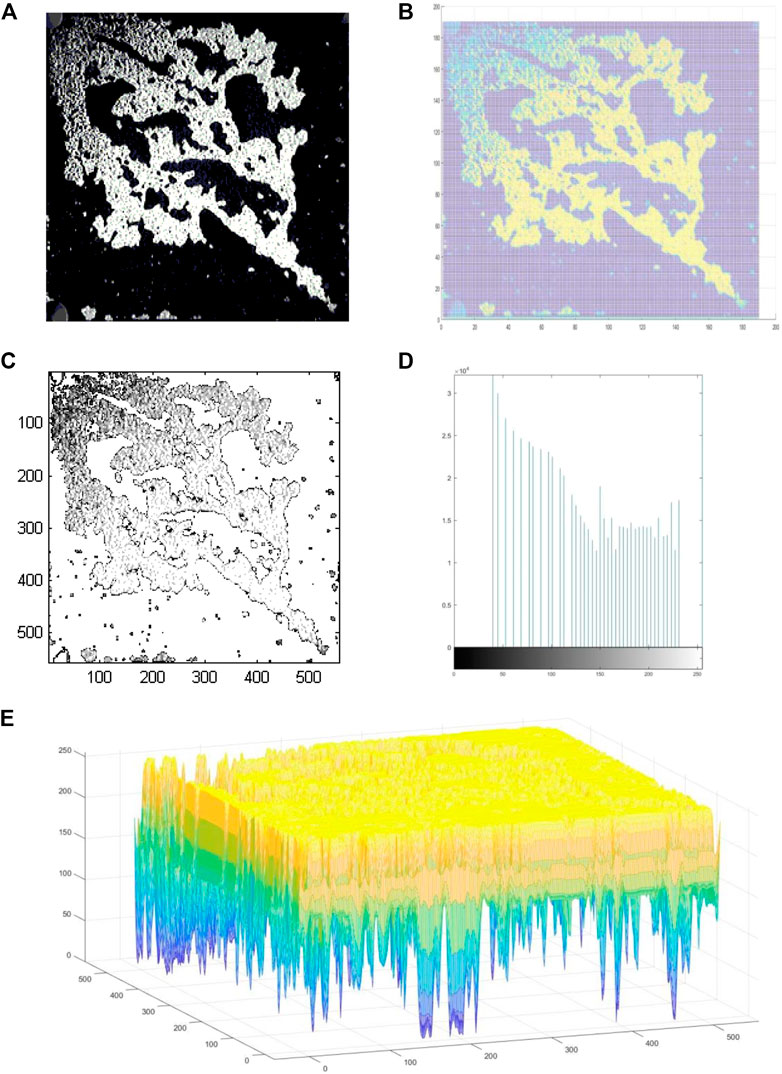
FIGURE 2. The visualization displacement experiment analyzed by Matlab software. (A) Grayscale image, (B) Pixelated grid image, (C) Edge detection and contour extraction image, (D) Grayscale histogram and (E) Three‐dimensional graph.
The above-mentioned parameters calculated by the program are compared with the actual values obtained from the visual model simulation flooding experiment. The visualization model is used to simulate the entire oil layer, which is described numerically as the product of the horizontal and vertical coordinates. The displacement channel is the sweep range of the oil-displacing agent, that is, the area within the contour range in Figure 2C. Then, the percentage of the area within the outline to the area of the entire picture is the sweep efficiency of the oil-displacing agent.
A grayscale histogram is generated for Figure 2C, where the horizontal axis of the generated grayscale histogram is pixels (grayscale), and the vertical axis represents the number of pixels (the number of grayscales), see Figure 2D. The grayscale gradually increases from left to right on the horizontal axis (the color changes from black to white). The grayscale in the program is divided into 255 pieces, where each piece represents a grayscale color. The grayscale at 0 on the horizontal axis is the smallest, which represents the crude oil that has not been displaced in the experiment. The maximum gray value of the horizontal axis is 255 in the original image, which represents the point where the crude oil in the displacement channel has been completely displaced during the experiment. The height of each blue histogram represents the total number of points in this grayscale.
Combined with the definition of oil washing efficiency and oil-displacement recovery rate, the value of 255 on the horizontal axis represents a 100% oil washing efficiency; therefore, the oil washing efficiency of each point is obtained by subtracting each value representing the grayscale on the horizontal axis from 255 and then dividing by 255. The sum of all the points of a certain gray level forms a blue bar on the vertical axis, as shown in Figure 2D. The sum of all the blue bars is the area affected by the entire displacement. The generated three-dimensional graph is more conducive to understanding the above process from the scope of the entire experiment (Figure 2E). That is, the ratio of the cumulative value of the oil washing efficiency of each point to the sum of the numbers of all points is the oil washing efficiency in the affected range. The calculation formula is as follows:
Matlab’s image processing feature was used to analyze visualization experiments by combining the experimental process of the visual physical model experiment with the specific numerical results calculated through mathematical model analysis. This provides a clear and unified calculation method for a large number of difficult-to-compare oil displacement processes. It can conveniently compare the different effects of various quantitative experiments and promote the development of evaluation techniques using visual models.
This paper uses Chenzhuang oil and Yong eight oil as specific examples and uses the above analysis method to screen the oil-displacement agent PA-5 and OH-3 systems. The influence of different injection methods on the oil displacement effect of the oil-displacement agent was also evaluated.
Chenzhuang oil and Yong eight oil were provided by Shengli Oilfield Petroleum Exploration and Development Institute, and their basic characteristics are shown in Table 1. The two oil-displacing agent systems, PA-5 and OH-3, were obtained from the Shengli Oilfield site, and their composition is shown in Table 2.
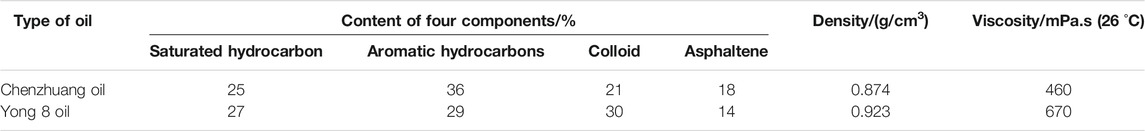
TABLE 1. Basic properties of crude oil.
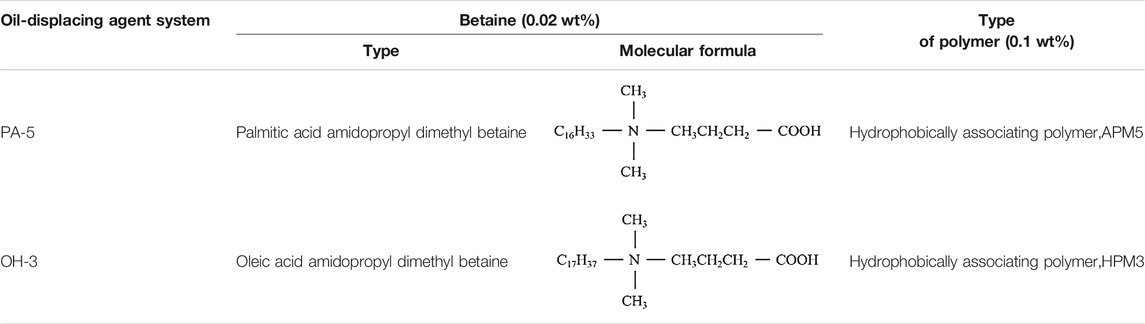
TABLE 2. Composition of the oil-displacing agent system.
The two visualization glass plate models were designed according to the stratigraphic structure and parameters of the reservoir. The permeability of the homogeneous formation is about 80–1,000 mD, the low permeability zone of the heterogeneous formation is about 300–400 mD, and the high permeability zone is about 800–1,000 mD. The above formation porosity is about 20%. A GK-8000A projector of Hangzhou Gaoke Industry and Trade Co., Ltd. was used to observe the oil displacement process. A 100DX Teledyne ISCO micro-syringe pump was used to inject the oil displacement agent, and a Haian Petroleum Scientific Research Instrument Co., Ltd. pressure acquisition system was used to control the injection pressure. The instruments that were connected together are shown in Figure 3.
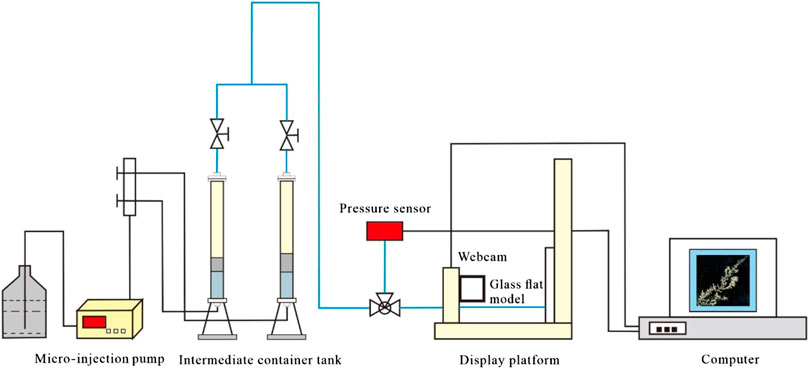
FIGURE 3. Visualization glass plate experimental instrument connection and oil-displacement process.
First, the quartz sand and conglomerate particles were sieved into two sizes of 100 and 50 mesh, respectively, and then the same size quartz sand and conglomerate particles were mixed in a mass ratio of 3:1.50 mesh mixed particles were used to make high-permeability formations, and 100 mesh mixed particles were used to make low-permeability areas. A special glue-containing clay was used to adhere closely-accumulated particles to two square rigid plastic templates (length: 16 cm). As shown in Figure 4, the hard plastic template formation model was pasted on the middle positions of two 0.5 cm thick and 18 cm long square glass plates. The corresponding positions of the simulated formation structure were aligned between the two glass plates, and the four sides of the simulated formation plate were sealed with a rubber cord with a diameter of 0.3 cm. The four sides of the glass plate were clamped with clamps dedicated to the model. Then, the visualization glass plate model was ready for experimental tests.
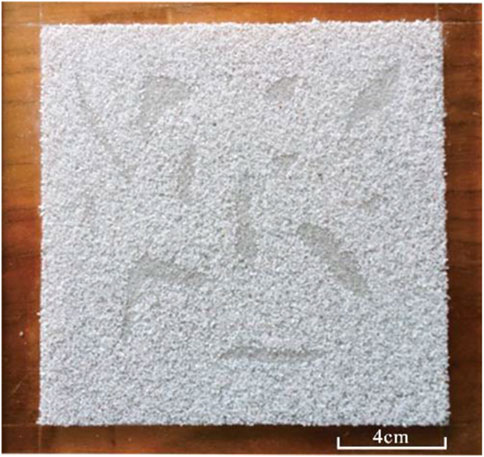
FIGURE 4. Heterogeneous formation of the visualization glass plate model.
In this experiment, two kinds of visual glass plate oil displacement experiments with homogeneous and heterogeneous simulated formations were designed, as shown in Table 3. Each group of experiments was repeated 3 times to reduce experimental error, and the reported result is the average of the three replicates. The experiment process is as follows (the experiment was carried out at 26 °C and atmospheric pressure, and the displacement rate was 0.3 ml/min):
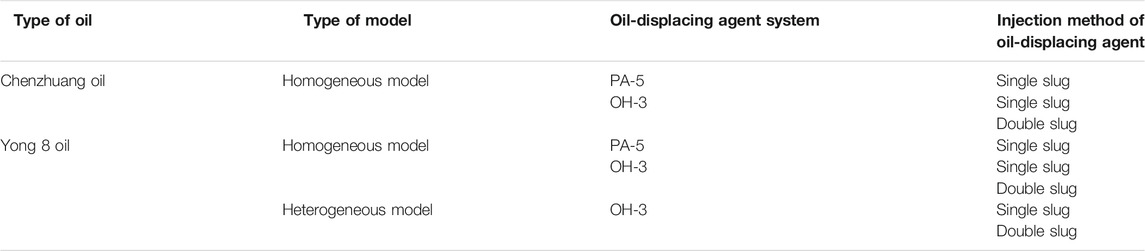
TABLE 3. Visual glass plate model of the oil displacement experiment scheme.
After the glass plate model was filled with oil, water flooding was conducted until the produced fluid contained 95% water. The subsequent oil-displacing agent injection methods are divided into single-slug and double-slug. The single-slug involves a one-time injection of 0.5 PV oil displacing agent, and the double-slug involves injecting 0.3 PV oil-displacing agent first, then 0.3 PV water, and then injecting 0.3 PV of the oil-displacing agent for a second time. After the oil-displacing agent is injected, water flooding is resumed until the water production rate reaches 98%.
The homogeneous visualization glass plate model was used to observe and measure the effectiveness of the oil-displacing agent on enhancing oil recovery and the distribution of remaining oil at different times, as shown in Figure 5.
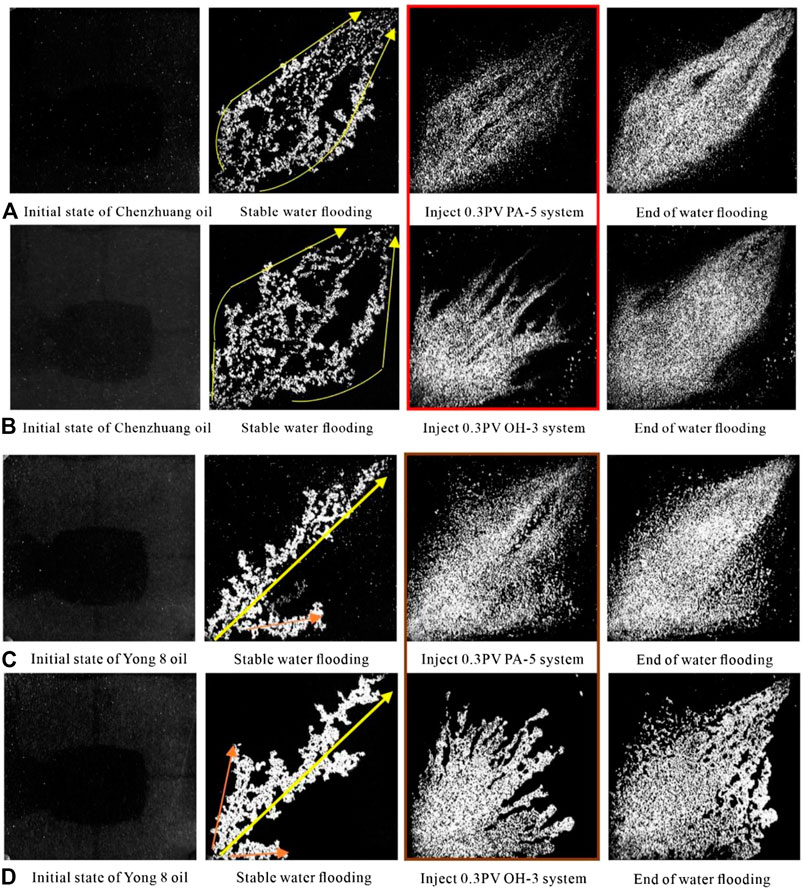
FIGURE 5. Experimental process of the visualization glass plate homogeneous model. *The yellow arrow is the main channel, the orange is the tributary, the red box is the effect of PA-5 and OH-3 on Chenzhuang oil, and the brown box is the effect of PA-5 and OH-3 on Yong eight oil.
After the homogeneous formation was displaced by water, the Yong eight oil-water displacement channel was diagonal, and the initially produced tributaries no longer flowed with the water displacement. This is due to the phenomenon of fingering in the main flow channel, in which the crude oil flows out of the production well from this channel first, causing the pressure of the branch channel to decrease. The diagonal main channel of the Chenzhuang oil-water drive channel is narrow, and most oil flows out of the wellhead along the upper and lower tributaries (Figure 5, yellow arrows). This phenomenon differs from the commonly known rule of diagonal main channels, so accurate numerical simulations cannot be performed.
These two different phenomena are mainly related to the viscosity of crude oil. When low-viscosity Chenzhuang oil is displaced by water, the flow pressure in the diagonal channel gradually increased due to the accumulation of crude oil and is greater than the respective pressures of the two branch channels; thus, the upper and lower branches will flow out of the production well first. At this time, the pressure of the production well decreases, the pressure gradient between the diagonal channel and the production well rises, and the fingering phenomenon intensifies, which narrows the diagonal channel. For high-viscosity oil, the pressure difference between the flow channels is not sufficient to drive the tributaries to flow out of the production well quickly, so the diagonal flow rule is still obeyed. Image analysis of the first water displacement of the four tests was used to calculate the oil recovery rate of the water flooding, as shown in Figure 6. Although all the recovery rates of water displacement are in the range of 13–15%, the water displacement processes of the two oils in the formation were different. This precisely achieves the purpose of using visual model experiments to distinguish different experimental processes.
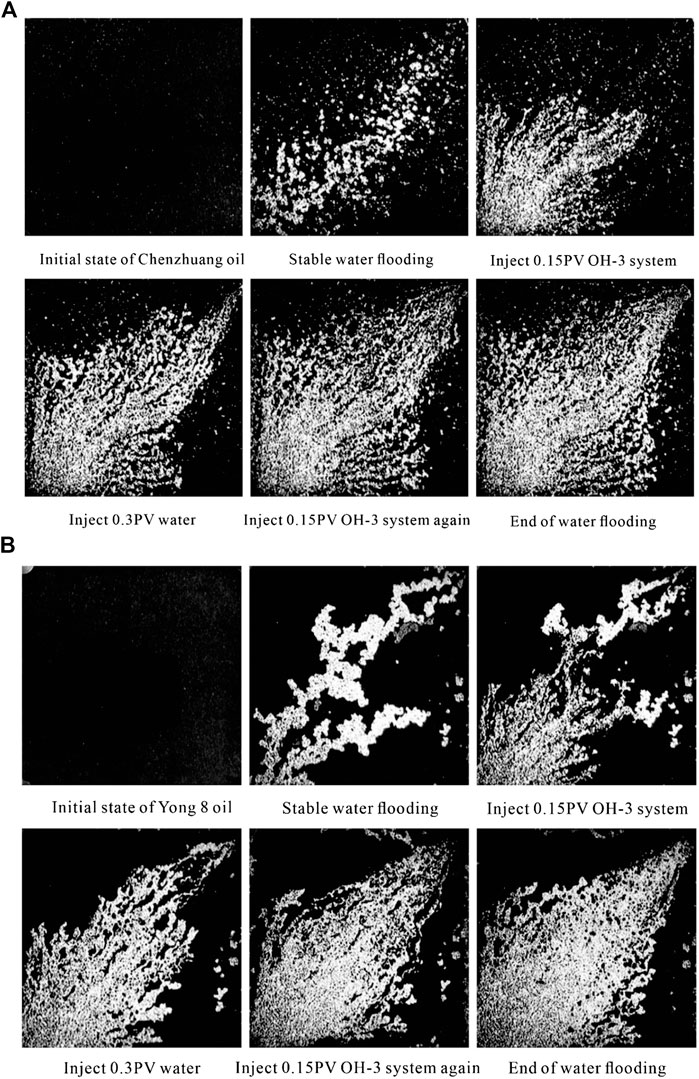
FIGURE 6. Comparison of the recovery factor between single slug (0–1 water displacement, 1–4 oil-displacing agent injection, 4–5 the last water displacement) and double slug (0–1 water displacement, 1-2 first oil-displacing agent injection, 2–3 water injection, 3–4 secondary oil-displacing agent injection, 4–5 the last water displacement) injection methods.
In the experiment, the OH-3 oil-displacing system was better than the PA-5 system after being injected into the formation, and the oil-displacement effect on Yong eight oil was better than that on Chenzhuang oil, as shown in the boxed diagram in Figures 5, 6. Continuing water displacement after agent injection will cause the oil displacing agent to flow forward and carry the crude oil along the road to the wellhead after reducing the viscosity of the oil. After that, continued water injection does not greatly improve the recovery factor. In the four groups of experiments, the highest last water displacement recovery factor was improved by 3%, which was obtained by using PA-5 oil displacement agent to displace Chenzhuang oil.
The oil-displacing agent did not significantly increase the oil recovery as expected due to the high concentration of the oil-displacing agent, which formed a film on the surface of the crude oil. This phenomenon is particularly obvious near the injection well. Thus, a high oil-displacing agent concentration does not always result in a better oil-displacing effect. The effect of the oil-displacing agent is directly related to its injection rate and concentration. To further exploit the remaining oil near the oil well, it is necessary to adjust the application method of oil-displacing agents. Subtle differences before and after the last water displacement can only be compared and analyzed using image analysis to obtain accurate data, which reflects the advantages of this automatic calculation method.
The results of the image analysis after the experiment showed that although the displacement has a wide range and the sweep efficiency is about 60%, the oil washing efficiency was not high, and the overall recovery rate is still about 25%; therefore, the key to enhancing oil recovery in homogeneous oil reservoirs to improve the oil washing efficiency.
The OH-3 oil-displacing agent system was tested using the double-slug injection method, and the recovery factor of the two oils was calculated by the Matlab image analysis method (Figures 6, 7). The two-stage oil-displacing agent and the water in the middle stage gradually expanded the outer edge of the original water-flooding channel, which increased the spread to 70%, but the oil washing efficiency was improved to only 40%; therefore, the improvement of oil displacement recovery rate was still small.
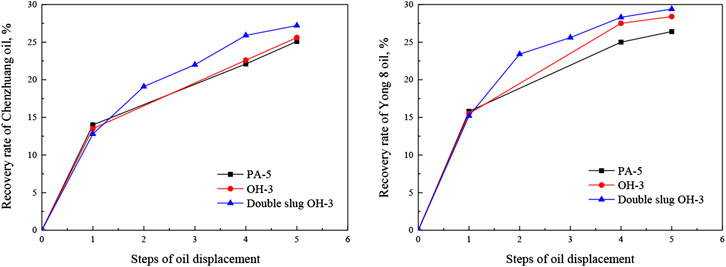
FIGURE 7. Double slug experiment of the homogeneous formation of the visualization glass plate model.
For homogeneous formations, the double-slug injection method only slightly improves the oil recovery efficiency. The final water displacement after injection of the agent has little effect on enhancing the oil recovery, which is an urgent problem that needs to be solved for subsequent enhancement of oil recovery after injecting an oil-displacing agent.
A heterogeneous model experiment was used to test the effect of single-slug injection of the OH-3 oil displacement agent system for enhancing the oil recovery of Yong eight oil, as shown in Figure 8A. During water displacement, the oil in the high-permeability area was driven out, and the oil in the low-permeability area was retained. The OH-3 oil-displacing agent system reduces the viscosity of the crude oil at the edge of the tight block under shear and gradually peels off the peripheral oil, which drives the oil-displacing agent into tight formations. The oil-displacing agent slowly penetrates into tight blocks, reducing the viscosity of the remaining oil in the tight block and allowing it to flow into the high-permeability zone, which gradually increases the oil washing efficiency to 55%. So, the total recovery factor is 8% higher than that of the homogeneous layer, which is mainly due to the improved oil washing efficiency.
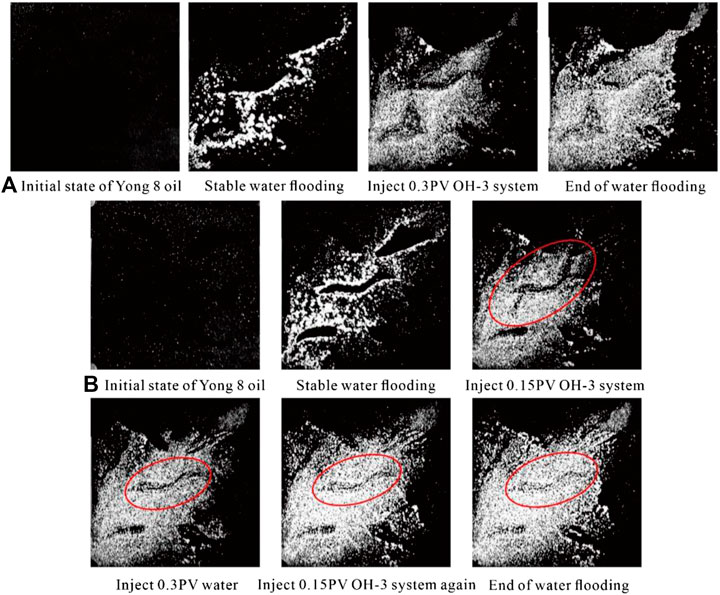
FIGURE 8. Heterogeneous formation experiment for the visualization glass plate model. (A) Single‐slug injection, (B) Dual‐slug injection.
The oil displacement effect of the OH-3 system using the dual-slug injection method was further tested, as shown in Figure 8B. Results analysis showed that the oil washing efficiency in the tight block was higher. Only the water injection stage between the two oil-displacing agent slugs increased the oil recovery of the tight block by about 3%. This is because the water injected between the two injections of the OH-3 oil-displacing agent slug also acted as an “oil-displacing agent,” which generated a peeling oil effect. The water between the slugs of the two oil-displacing agents has a predetermined isolation effect and also adjusts the concentration of the injected OH-3 oil-displacing agent system. This prolongs the action time of the oil-displacing agent and gives full play to the viscosity-reducing effect of the oil-displacing agent. The final water displacement can slightly improve the oil washing efficiency at the edge of tight reservoirs, but it has little effect on the internal oil displacement of tight blocks. The total recovery factor of this method was 47%, which is 18% higher than that of the double-slug injection method in the homogeneous layer (Figure 9). Therefore, high concentrations of oil-displacing agents are more suitable for heterogeneous reservoirs, and the injection rate should be as slow as possible to ensure maximum viscosity reduction of crude oil in tight areas to achieve a higher oil washing efficiency.
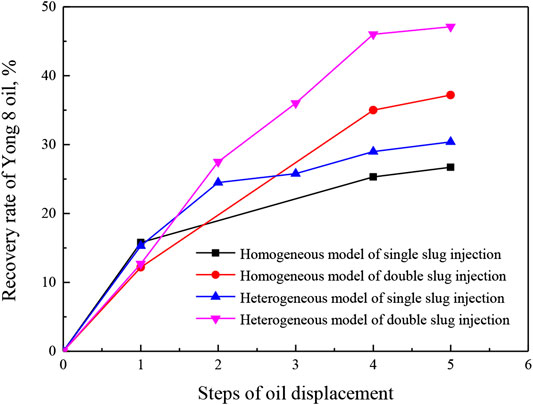
FIGURE 9. Improvement in Yong eight oil recovery using the OH-3 oil-displacing agent system.
(1) In this paper, the image processing function of Matlab software was used to combine the oilfield oil displacement recovery factor calculation formula, which linked experimental images with the parameters in the formula and summed a set of evaluation methods based on computer graphics for visualization plate model displacement experiments.
(2) Matlab software image processing technology was used to digitized visualization experimental results by combining physical model experiments with digital model analysis technology. This provided a convincing comparison of oil displacement efficiency and perfected the visualization simulation technology.
(3) The evaluation of an oil-displacing agent was used as an example by visualizing a glass plate model experiment and Matlab image processing. The improvement effects of two different injection methods on the oil recovery rate were compared, and it was found that OH-3 oil-displacing agent using a dual-slug injection method was more suitable for heterogeneous reservoirs.
The raw data supporting the conclusion of this article will be made available by the authors, without undue reservation.
XS developed the original structure of the draft. JG revised the manuscript by substantially restructuring it and adding up critical insights. SR and AZ did some experiments and assisted in processing related data. JG is the corresponding author who communicate on behalf of all authors.
This study was conducted using funds from the National Natural Science Foundation of China (No. 51574266), the Major Scientific and Technological Projects of CNPC under Grant (ZD2019-183-007), National Key R&D Program of China (2018YFA0702400) and Postgraduate Innovation Funding Project of China University of Petroleum (East China) (YCX2020024).
Author AZ was employed by company Tarim Oilfield, PetroChina.
The remaining authors declare that the research was conducted in the absence of any commercial or financial relationships that could be construed as a potential conflict of interest.
Artun, E., and Kulga, B. (2020). Selection of candidate wells for re-fracturing in tight gas sand reservoirs using fuzzy inference. Petrol. Explor. Dev 47 (2), 413–420. doi:10.1016/S1876-3804(20)60058-1
Chatenever, A., Indra, M. K., Kyte, J. R., and Alme, M. (1959). Microscopic observations of solution gas-drive behavior Tokyo, Japan: SPEJ.
Chen, L., Suzuki, T., Nonomura, T., and Asai, K. (2019). Characterization of luminescent mini-tufts in quantitative flow visualization experiments: surface flow analysis and modelization. Exp. Therm. Fluid Sci 103, 406–417. doi:10.1016/j.expthermflusci.2019.02.002
Clerke, E. A. (2007). Permeability and microscopic displacement efficiency of M_1 bimodal pore systems in arab-D limestone Manama, Bahrain: SPE.
Donaldson, E. C., and Thomas, R. D. (1971). Microscopic observations of oil displacement in water-wet and oil-wet systems Orleans, LA: SPE.
Fu, L., Zhang, G., Ge, J., Liao, K., Pei, H., Jiang, P., et al. (2016). Study on organic alkali-surfactant-polymer flooding for enhanced ordinary heavy oil recovery. Colloids Surf. A 508, 230–239. doi:10.1016/j.colsurfa.2016.08.042
Guo, J., Yang, Y., Zhang, D., Wu, W., Yang, Z., and He, L. (2018). A general model for predicting apparent viscosity of crude oil or emulsion in laminar pipeline at high pressures. J. Petrol. Sci. Eng 160, 12–23. doi:10.1016/j.petrol.2017.10.034
Li, X., Shi, L., Li, H., Liu, P., Luo, J., and Yuan, Z. (2018). Experimental study on viscosity reducers for SAGD in developing extra-heavy oil reservoirs. J. Petrol. Sci. Eng 166, 25–32. doi:10.1016/j.petrol.2018.03.022
Liu, H., Yang, F., Yang, Z., and Duan, Y. (2020a). Modeling the viscosity of hydrofluorocarbons, hydrofluoroolefins and their binary mixtures using residual entropy scaling and cubic-plus-association equation of state. J. Mol. Liq 308, 113027. doi:10.1016/j.molliq.2020.113027
Liu, Z., Wu, G., and Wei, C. (2020b). Physical experiments and numerical simulations of viscosity reducer flooding for ordinary heavy oil. J. Petrol. Sci. Eng 192, 107194. doi:10.1016/j.petrol.2020.107194
Mask, G., Wu, X., and Ling, K. (2019). An improved model for gas-liquid flow pattern prediction based on machine learning. J. Petrol. Sci. Eng 183, 106370. doi:10.1016/j.petrol.2019.106370
Miah, M. I., Elhaj, M. A., Ahmed, S., and Hossain, M. E. (2018). Modeling of temperature distribution and oil displacement during thermal recovery in porous media: a critical review. Fuel 226, 423–440. doi:10.1016/j.fuel.2018.04.018
Neel, G., Debashis, D., and Brijes, M. (2018). “Analysis of crack propagation in shale using microscopic imaging techniques.” in 52nd U.S. Rock Mechanics/Geomechanics Symposium, Seattle, WA, June, 2018. ARMA.
Pei, H., Shu, Z., Zhang, G., Ge, J., Jiang, P., Qin, Y., et al. (2018). Experimental study of nanoparticle and surfactant stabilized emulsion flooding to enhance heavy oil recovery. J. Petrol. Sci. Eng 163, 476–483. doi:10.1016/j.petrol.2018.01.025
Pei, H., Zhang, G., Ge, J., Jiang, P., Zhang, J., and Zhong, Y. (2017). Study of polymer-enhanced emulsion flooding to improve viscous oil recovery in waterflooded heavy oil reservoirs. Colloids Surf. A 529, 409–416. doi:10.1016/j.colsurfa.2017.06.039
Priest, C., Reid, M. D., and Whitby, C. P. (2011). Formation and stability of nanoparticle-stabilised oil-in-water emulsions in a microfluidic chip. J. Colloid Interface Sci 363 (1), 301–306. doi:10.1016/j.jcis.2011.07.060
Sabet, N., Mohammadi, M., Zirahi, A., Zirrahi, M., Hassanzadeh, H., and Abedi, J. (2020). Numerical modeling of viscous fingering during miscible displacement of oil by a paraffinic solvent in the presence of asphaltene precipitation and deposition. Int. J. Heat Mass Tran 154, 119688. doi:10.1016/j.ijheatmasstransfer.2020.119688
Shabani Afrapoli, M., Nikooee, E., and Alipour, S. (2011). Experimental and analytical study of microscopic displacement mechanisms of MIOR in porous media Houston, TX: SPE.
Shi, L., Ma, D., Liu, P., Li, X., Xi, C., and Wang, C. (2019). Experimental and numerical simulation studies on effects of viscosity reducers for steam assisted gravity drainage performances in extra-heavy oil reservoirs. J. Petrol. Sci. Eng 173, 146–157. doi:10.1016/j.petrol.2018.10.008
Sun, Z., Wu, X., Kang, X., Lu, X., Li, Q., Jiang, W., et al. (2019). Comparison of oil displacement mechanisms and performances between continuous and dispersed phase flooding agents. Petrol. Explor. Dev 46 (1), 121–129. doi:10.1016/S1876-3804(19)30011-4
Templeton, C. C. (1954). A study of displacements in microscopic capillaries. J. Pet. Technol 6, 7. doi:10.2118/307-G
Trygstad, J. C., Ehrlich, R., and Wardlaw, N. C. (1986). Physical modeling of microscopic rock-pore heterogeneities Tulsa, OK: SPE.
Wang, F., Yang, H., Li, M., Kang, X., Zhang, X., Zhang, H., et al. (2020). Study on stabilization of emulsion formed by the supramolecular system of amphiphilic polymer and sodium polyacrylic acid. J. Mol. Liq 314, 113644. doi:10.1016/j.molliq.2020.113644
Wang, Y., Hou, J., Tang, Y., and Song, Z. (2019). Effect of vug filling on oil-displacement efficiency in carbonate fractured-vuggy reservoir by natural bottom-water drive: a conceptual model experiment. J. Petrol. Sci. Eng 174, 1113–1126. doi:10.1016/j.petrol.2018.12.014
Wu, M., Ding, M., Yao, J., Li, C., Li, X., and Zhu, J. (2019). Development of a multi-continuum quadruple porosity model to estimate CO2 storage capacity and CO2 enhanced shale gas recovery. J. Petrol. Sci. Eng 178, 964–974. doi:10.1016/j.petrol.2019.03.077
Wu, Z., Liu, H., Wang, X., and Zhang, Z. (2018). Emulsification and improved oil recovery with viscosity reducer during steam injection process for heavy oil. J. Ind. Eng. Chem 61, 348–355. doi:10.1016/j.jiec.2017.12.033
Zhang, A., Yang, Z., Li, X., Xia, D., Zhang, Y., Luo, Y., et al. (2020a). An evaluation method of volume fracturing effects for vertical wells in low permeability reservoirs. Petrol. Explor. Dev 47 (2), 441–448. doi:10.1016/S1876-3804(20)60061-1
Zhang, N., Wei, M., Fan, J., Aldhaheri, M., Zhang, Y., and Bai, B. (2019). Development of a hybrid scoring system for EOR screening by combining conventional screening guidelines and random forest algorithm. Fuel 256, 115915. doi:10.1016/j.fuel.2019.115915
Keywords: visualization experiment, computer graphics, MATLAB software, glass plate model, recovery factor
Citation: Sun X, Ge J, Ren S and Zhao A (2021) Evaluating the Effect of Oil-Displacing Agents Using Computer Graphics and Visualization Glass Plate Model Experiments. Front. Energy Res. 8:601158. doi: 10.3389/fenrg.2020.601158
Received: 31 August 2020; Accepted: 25 November 2020;
Published: 21 January 2021.
Edited by:
Wei Yu, University of Texas at Austin, United StatesReviewed by:
Bo Jiang, Nanjing University of Science and Technology, ChinaCopyright © 2021 Sun, Ge, Ren, and Zhao. This is an open-access article distributed under the terms of the Creative Commons Attribution License (CC BY). The use, distribution or reproduction in other forums is permitted, provided the original author(s) and the copyright owner(s) are credited and that the original publication in this journal is cited, in accordance with accepted academic practice. No use, distribution or reproduction is permitted which does not comply with these terms.
*Correspondence: Jijiang Ge, Z2VqaWppYW5nQDE2My5jb20=
Disclaimer: All claims expressed in this article are solely those of the authors and do not necessarily represent those of their affiliated organizations, or those of the publisher, the editors and the reviewers. Any product that may be evaluated in this article or claim that may be made by its manufacturer is not guaranteed or endorsed by the publisher.
Research integrity at Frontiers
Learn more about the work of our research integrity team to safeguard the quality of each article we publish.