- 1State Key Laboratory of Oil and Gas Reservoir Geology and Exploitation, Southwest Petroleum University, Chengdu, China
- 2Baikouquan Oil Production Plant, PetroChina Xinjiang Oilfield Company, Karamay, China
- 3Exploration and Development Research Institute of Petro China Xinjiang Oilfield Company, Karamay, China
Tight oil is a kind of unconventional oil and gas resource with great development potential. Due to the unconventional characteristics of low porosity and low permeability in tight oil reservoirs, single wells generally have no natural productivity, and industrial development is usually conducted in combination with horizontal wells and hydraulic fracturing techniques. To capture the flow behavior affected by fractures with complex geometry and interaction, we adopted embedded discrete fracture models (EDFMs) to simulate the development of fractured reservoirs. Compared with the traditional discrete fracture models (DFMs), the embedded discrete fracture models (EDFMs) can not only accurately represent the fracture geometry but also do not generate a large number of refine grids around fractures and intersections of fractures, which shows the high computational efficiency. To be more consistent with the real characteristic of the reservoir and reflect the advantage of EDFMs on modeling complex fractures, in this work, the hydraulic fractures are set as oval shape, and we adopted 3-dimensional oil–gas two-phase model considering capillary forces and gravity effects. We developed an EDFM simulator, which is verified by using the fine grid method (FGM). Finally, we simulated and studied the development of tight oil without and with random natural fractures (NFs). In our simulation, the pressure varies widely from the beginning to the end of the development. In real situation, tight oil reservoirs have high initial pressure and adopt step-down bottom hole pressure development strategy where the bottom hole pressure of the last stage is below the bubble point pressure and the free gas appears in the reservoir. Modeling studies indicate that the geometry of fracture has a great influence on the pressure and saturation profiles in the area near the fractures, and dissolved gas flooding contributes to the development of tight oil, and NFs can significantly improve production, while the effect of the stress sensitivity coefficient of NFs on production is more significant in the later stage of production with lower reservoir pressure.
Introduction
Along with the increasing social and economic development of world, the demand for energy is getting larger and larger. In China, conventional oil and gas resources only account for about 20% of the total resources, while the proportion of unconventional oil and gas resources is as high as 80% (Zou et al., 2012). Therefore, the abundant unconventional oil and gas resource is a major source of short- and long-term energy in China. As a kind of important unconventional oil and gas resource, tight oil is accumulated in tight clastic or carbonate reservoirs that is interbedded with or adjacent to oil-generating strata, which has not been migrated over large distances. Tight oil wells usually have no natural production capacity, or the natural production capacity is lower than the minimum industrial production capacity. To obtain economic development of tight oil, horizontal wells and hydraulic fracturing techniques are often used to stimulate the tight rock. It is important to accurately characterize and simulate the production of wells and variation of pressure in reservoirs for choosing the best stimulation and development strategy. However, compared with low-permeability matrices, fractures have high conductivity and complex geometry, which makes the numerical simulation of fluid flow very challenging. There are two major classes of models proposed to model the fractured system: dual continuum models and discrete fracture models (DFMs).
Dual continuum models are widely used in the industry. The concept of the dual porosity (DP) model was first proposed by Barenblatt et al. (1960). Later, Warren and Root (1963) developed the DP model, known as the sugar cube model. In Warren and Root’s model, reservoirs are divided into two systems: matrix system and fracture system. Fluid exchange between the two systems is described by interporosity flow. Warren and Root’s model is also called DP single permeability (DPSK or DPSP) because fluid stores in two systems, while fluid flow only occurs in the fracture system. The dual continuum model, in addition to DP single permeability, also includes the DP dual permeability (DPDK or DPDP) model and the multiple interacting continuum (MINC) model. DPDK was proposed by Blaskovich et al. (1983). In DPDK, both the fracture and the matrix systems are not only storage space but also flow channels of fluid. Multiple interacting continuum (Pruess and Narasimhan, 1982; Wu and Pruess, 1988) creates a series of “nested” matrix control volumes in fracture control volumes, which makes it successful to model nonisothermal and multi-phase flow and effectively reduces the subgridding cells compared to explicit discretization. Continuum models are widely used in analytical and semi-analytical solutions to research the fractured unconventional reservoirs (Zhao et al., 2013; Al-Rbeawi, 2017a; Al-Rbeawi, 2017b; Zhang et al., 2018; Kou and Wang, 2020). However, dual continuum models are only suitable for the reservoir with a large number of highly connected and small fractures (Karimi-Fard and Firoozabadi, 2003). Moreover, they may have difficulties representing highly localized anisotropy in reservoirs (Moinfar et al., 2013).
To overcome these limitations, DFMs were developed. DFMs can explicitly represent the real geometry of fractures. Each fracture has its own size, shape, orientation, and permeability. Scholars used many methods for simulation with DFMs, such as finite element methods (Kim and Deo, 2000; Karimi-Fard and Firoozabadi, 2003; Zhang et al., 2016), mixed finite element methods (Hoteit and Firoozabadi, 2006), control volume finite element methods (Bastian et al., 2000), and hybrid finite element/finite volume methods (Fu et al., 2005). Most of above methods rely on unstructured grids, which provide flexibility to model more realistic fracture geometries. However, the quality of the generated unstructured grids relies much on the mathematical algorithms applied, which could be very complicated for certain scenarios (Jiang et al., 2014). Besides, DFMs will generate a large number of refined grids around the position where fractures intersect or are densely distributed, which results in low computational efficiency.
Therefore, there is still a demand for improvement in the DFM. Lee et al. (2001) and Li and Lee (2008) proposed embedded DFMs (EDFMs). Compared to DFMs, embedded DFMs have simpler mathematical algorithms for generating grids and will not generate many refined grids when fractures have complex geometric features. Based on such advantages, many scholars used embedded DFMs to simulate and research the flow phenomenon in the fractured tight reservoir.
However, most scholars modeled the hydraulic fractures (HFs) as rectangle plates, which cannot reflect the complex geometry of HFs and the characteristic of fluid flow in the fractured reservoir. Besides, recent studies ignore the feature of abnormal high pressure in tight oil reservoirs. Owing to the stress sensitivity, the permeability of the matrix and fractures will gradually decrease as the pressure of reservoir drops down caused by development of the reservoir. Therefore, if the initial pressure of the reservoir is not high enough, the permeability of the matrix and fractures will only decrease a little from the beginning to the end of development. Consequently, some simulation results may seem overly optimistic because of the relatively high permeability. Furthermore, in the late stage of actual tight oil development, bottom hole pressure (BHP) will drop below the bubble point pressure, and two-phase flow of oil and gas occurs in the reservoir. Nevertheless, recent studies about tight oil hardly consider the fact of oil–gas two-phase flow and the energy of dissolved gas.
In this study, we used embedded DFMs to simulate the development of fractured reservoirs. Then, we verified our EDFM simulator and demonstrated EDFMs’ advantages for modeling complex fractures by a scenario setting HFs as oval shape in 3D reservoir models. In order to reflect the actual development of tight reservoir, reservoirs have high initial pressure, and multistage fractured wells adopt the step-down BHP production strategy. Moreover, an oil–gas two-phase flow model is applied to capture the phenomenon of dissolved gas drive. At last, we generate nature fractures in reservoirs to study the influence of nature fractures in the tight reservoir.
Methodology
Embedded Discrete Fracture Models
Lee et al. (2001) and Li and Lee (2008) developed embedded DFMs. Embedded DFMs use orthogonal structured grids to represent the matrix. In this model, each fracture passes through many matrix grids and is divided into a series of segments by matrix cell boundaries. These fracture segments are fracture cells, which are “embedded” into matrix cells, so this model is called embedded DFMs. In embedded DFMs, fluid flows in both matrix and fracture systems, and interporosity flow also occurs between two systems.
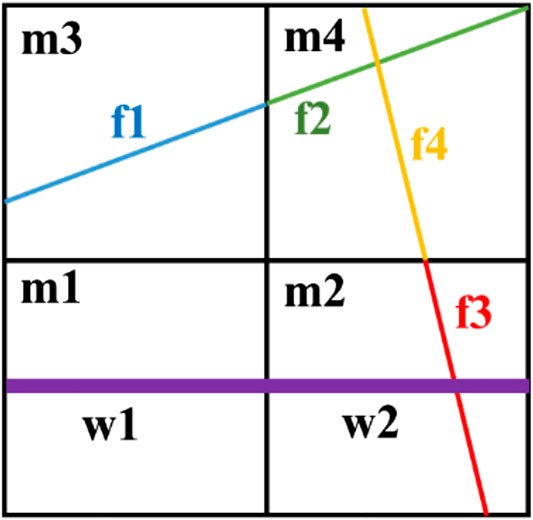
Figure 1 shows a 2D scenario of the EDFM. In this scenario, two fractures are divided into four fracture cells, and one fracture cell (f3) connects to the wellbore. As you can see, there are many kinds of connection relationship between cells, such as two adjacent matrix cells, fracture cell, and its embedded matrix cell, two adjacent fracture cells inside the same fracture, two intersecting fracture cells in two different fractures, and fracture cell and its connecting well cells. To describe and record these connection relationship, non-neighboring connection concept (Moinfar et al., 2013; Xu, 2015) and connection list method (Jiang et al., 2014; Zhao et al., 2019) are usually used, which is also helpful for assembling computational matrices.
The mass exchange between these connections can be calculated by the following unified form:
where q (in m3/day) represents the flow rate, T represents the transmissibility,
The main difference among these connections is the calculation method of the transmissibility geometric factor, which is described as below. It is noted that, in this study, fluid cannot directly flow from the matrix to the wellbore, which fits the fact of hydraulic fracturing. Therefore, there is no connection between the matrix and wellbore.
(1) Two adjacent matrix cells, such as m1–m2 in Figure 1
(2) Fracture cell and its embedded matrix cell, such as m3–f1 in Figure 1 (Li and Lee, 2008)
(3) Two adjacent fracture cells inside the same fracture, such as f1–f2 in Figure 1 (Xu, 2015)
(4) Two intersecting fracture cells inside same matrix cell, such as f2–f4 in Figure 1 (Moinfar et al., 2014)
(5) fracture cell and its connecting wellbore, such as f3–w2 in Figure 1 (Moinfar et al., 2013)
Model Assumptions and Boundary Conditions
The basic assumptions for this research are as follows. 1) The flow obeys Darcy flow in both the fracture and matrix. 2) Ignore changes in temperature in the reservoir. 3) The reservoir is rectangular. 4) The shapes of fractures are parallel plates of equal thickness. 5) Only fluid from the HF flows into the wellbore, and no fluid from the matrix flows into the wellbore. 6) Ignore capillary force in fractures.
The boundary conditions of the reservoir and fractures are as follows. 1) The reservoir has closed boundaries. 2) There is fluid exchange between the matrix and the fracture. 3) In order to conform to the actual hydraulic fracturing technology, only the fluid in HFs flows into wellbore directly, while fluid in the matrix do not flows into wellbore directly.
Governing Equations
The mass conservation equations of two-phase oil–gas flow are
where subscripts o and g represent oil and gas, respectively;
In EDFMs, the interporosity flow is represented in the source sink term q. Owing to kinds of cell connection in the EDFM, the mass conservation equation (Eqs. 8 and 9) can be transformed into the following discrete form: the left side of the equation is expressed as the sum of the flow into the cell by different connections, while the right side of the equation still maintains the form of net cumulative fluid.
Combined with the relationship of saturation,
the equations of the matrix cells can be transformed as follows:
and the equations of fracture cells can be transformed as follows:
where
Stress Sensitivity in Tight Reservoirs
In order to highlight the flow mechanism of tight reservoirs, the stress sensitivity of tight reservoirs is considered to study stress sensitivity effects of matrix and fracture permeability. There are kinds of types of stress-sensitive models, including binomial, logarithmic, power law, and exponential relationship (Jones, 1975; David et al., 1994; Zhao et al., 2011; Xiao et al., 2016).
In this study, a widely used exponential relationship model is adopted for both matrix permeability and fracture permeability:
where a (in MPa−1) represents the stress sensitivity coefficient,
Model Verification
EDFMs have the flexibility to handle fractures with complex shapes and in any orientation. In our model, the HFs are considered as oval shape in 3D reservoirs, and fractures are allowed to be not perpendicular to the border of reservoir, so it is complex to generate 3D unstructured cells by DFMs. Therefore, we used fine matrix grid (FMG) method to verify accuracy of our simulator developed by using embedded DFMs.
In the FMG method, the reservoirs are divided into a large number of FMGs, and the effect of high permeability of fracture is considered into the matrix cells. When a matrix grid passes through fracture, to maintain fracture conductivity, the permeability of this matrix cell will increase as below.
where
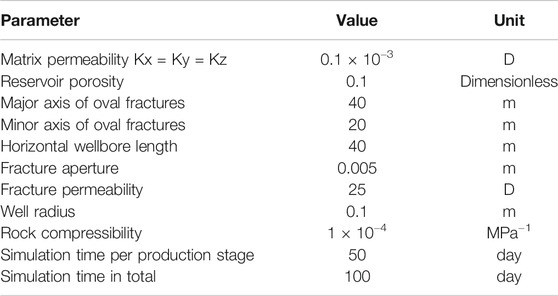
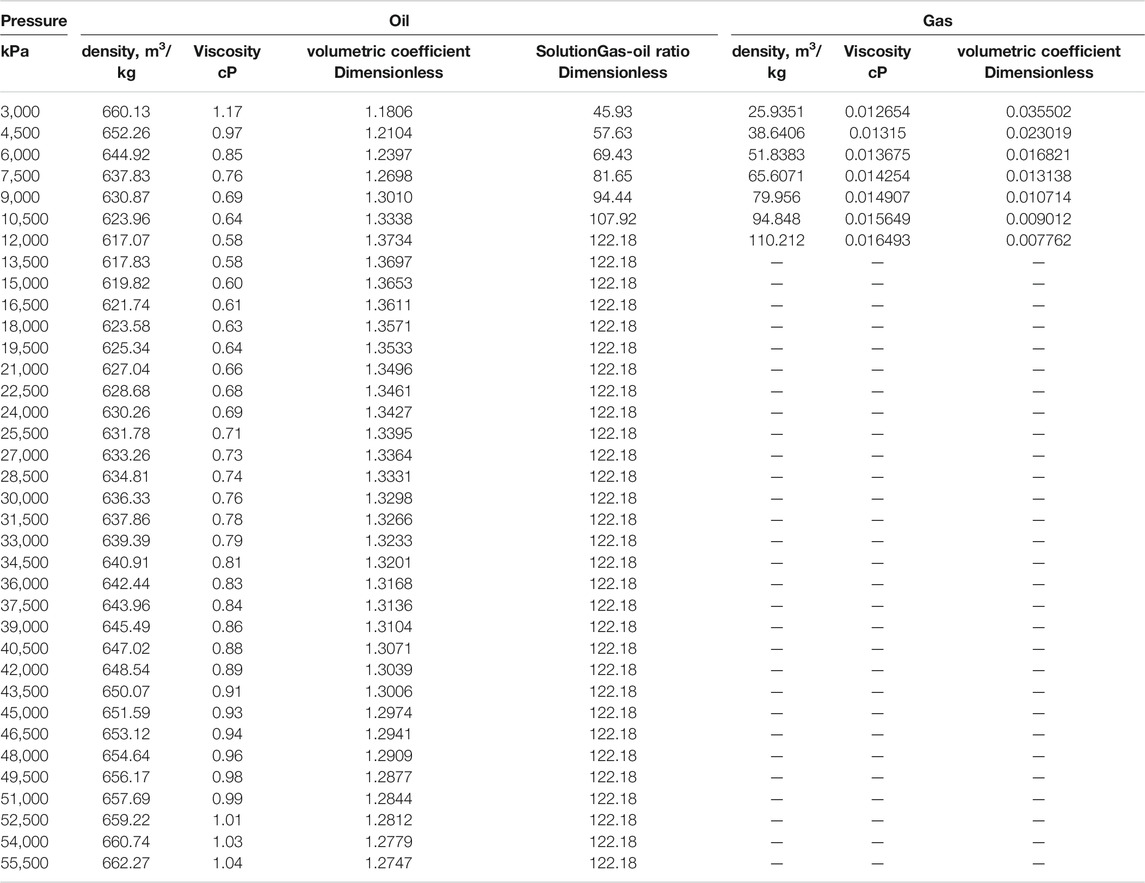
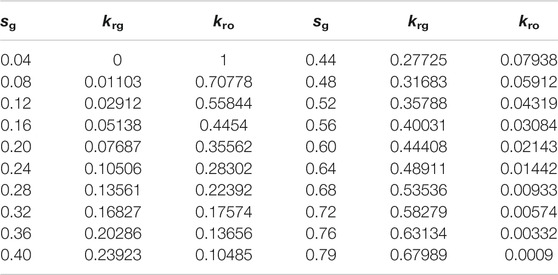
In this verification, we modeled the development of the tight oil reservoir. The size of the reservoir is 100 m × 100 m × 100 m. There is a horizontal well with two HFs of oval shape. The angle between the fracture plane and horizontal well is 55°, as shown in Figure 2. The reservoir’s initial pressure is 30 MPa. The development process of the reservoir consists of two stages of production with two constant BHP, 20 and 10 MPa, respectively. Because the bubble point pressure is 12 MPa, the first production stage is a single-phase (oil) flow, and the second production stage is a two-phase (oil-gas) flow. We also considered the influence of gravity and capillary effect in the matrix in two-phase flow, while the capillary effect in fracture is ignored. The PVT property of oil and gas is shown in Appendix, and other reservoir properties and some simulation parameters are shown in Table 1. The oil and gas relative permeability relationship and gas–oil capillary force of matrix are shown in Appendix. We ignore the capillary force in fractures. The oil and gas relative permeability of fracture cells is equal to the oil and gas saturation of fracture cells.
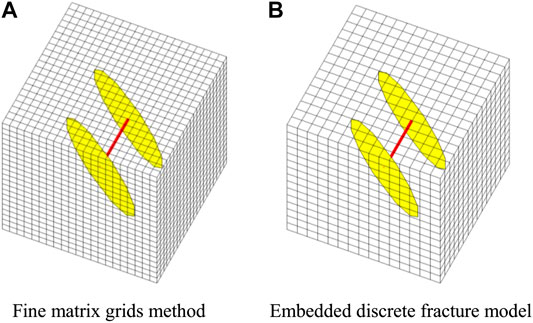
FIGURE 2. The matrix cell size and the location of the horizontal well with oval hydraulic fractures.
In the FMG method, the number of matrix cells is 9,261 (21 × 21 × 21), while the number of matrix cells is only 3,375 (15 × 15 × 15) in the embedded DFM. Adding the number of fracture cells 198, the total number of cells in EDFM is 3,573. The matrix cell and the location of the fractured horizontal well are shown in Figure 2.
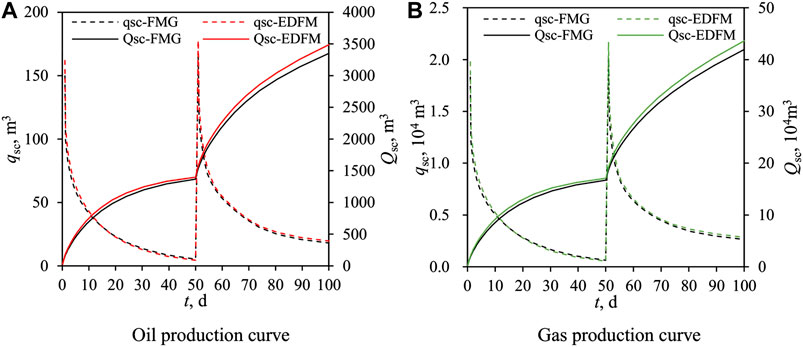
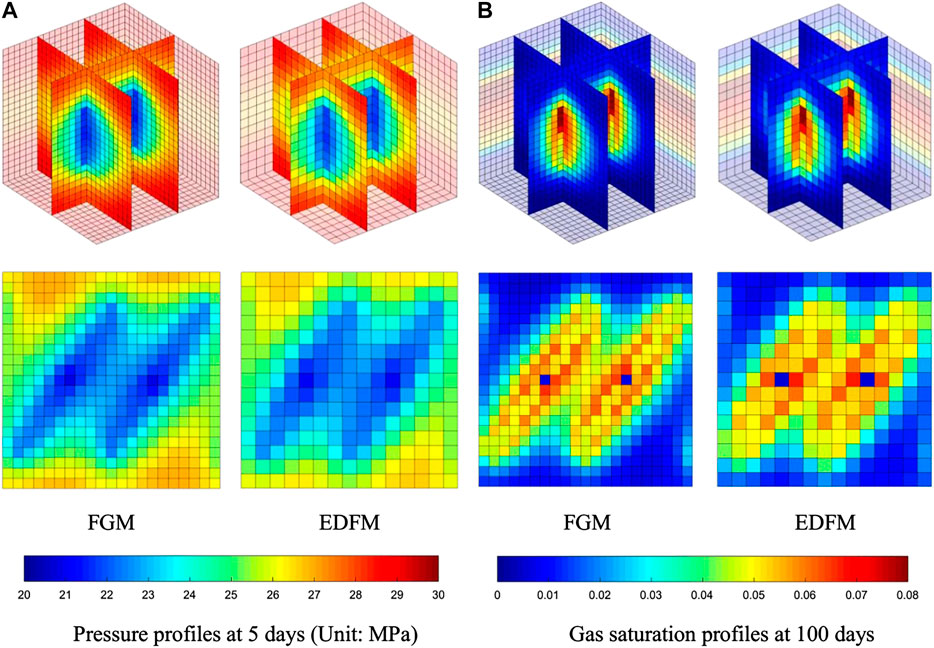
We simulated this scenario with the EDFM and FMG. The oil and gas production curve is shown in Figure 3, where the dotted lines represent daily production and the solid lines represent cumulative production. Figure 4 compares the pressure profiles after 5 days of production and the gas saturation profiles after 100 days of production of the EDFM and FMG. In Figure 4, the two-dimensional figures represent the pressure and saturation profiles on the horizontal surface where the horizontal well is located. Although the total cell number of the EDFM is about one-third of that of FMGs, all figures (Figures 3 and 4) indicate that our EDFM simulator can reach similar accuracy as the FGM simulator. Moreover, as shown in Figure 4, in the region containing free gas around fractures, the gas saturation at higher place is higher than that at lower place, confirming our simulator can reflect the effect of density and gravity. Besides, the daily production declines more slowly and cumulative production is larger in the second stage, reflecting the effect of dissolved gas flooding on production, which is consistent with qualitative knowledge.
From this verification, it seems that FMGs are similar to EDFMs and EDFMs do not show much advantage. However, if there are more fractures with more complex interaction relationship and we still want to get enough simulation accuracy, such as Figure 9, there will be much more fine cells in FMGs to achieve satisfying accuracy, resulting in very low efficiency for model calculation.
Example Simulation
A Multi-Stage Horizontal Well With Oval Hydraulic Fractures
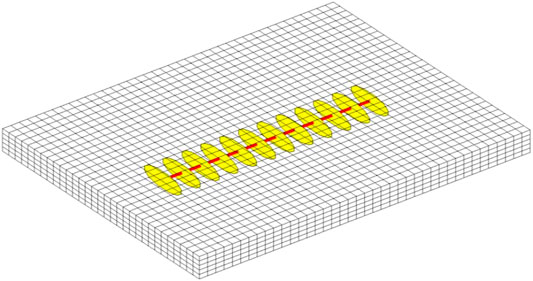
First, we stimulated the development of a horizontal well with multi-stage oval HFs, as shown in Figure 5. In order to reflect the actual development of the tight reservoir, reservoirs have high initial pressure, and multi-stage fractured wells adopt the step-down BHP production strategy. At the last step-down BHP production stage, the BHP is lower than bubble point pressure of oil, resulting in oil–gas two-phase fluid flow in the reservoir.
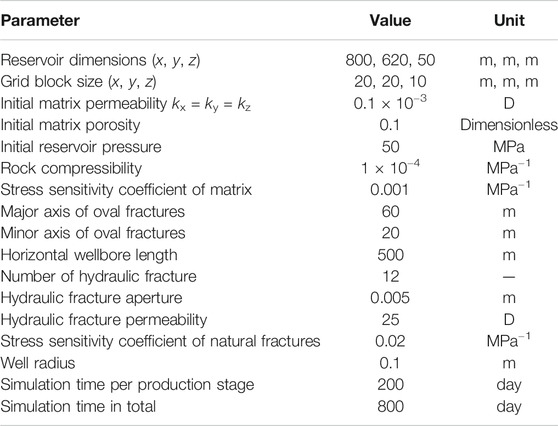
We set the initial reservoir pressure at 50 MPa. There are four stages of production (200 days per stage). The BHP of four stages is set as 40, 30, 20, 10 MPa. Because the bubble point pressure is 12 MPa, the last stage of production is oil–gas two-phase flow in the reservoir. Other simulation parameters are listed in Table 2. The PVT property of oil and gas is shown in Appendix. Appendix shows the oil and gas relative permeability relationship and gas–oil capillary force of the matrix. For fractures, we ignore the capillary force in fractures, and the oil and gas relative permeability of fracture cells is equal to the oil and gas saturation of fracture cells.
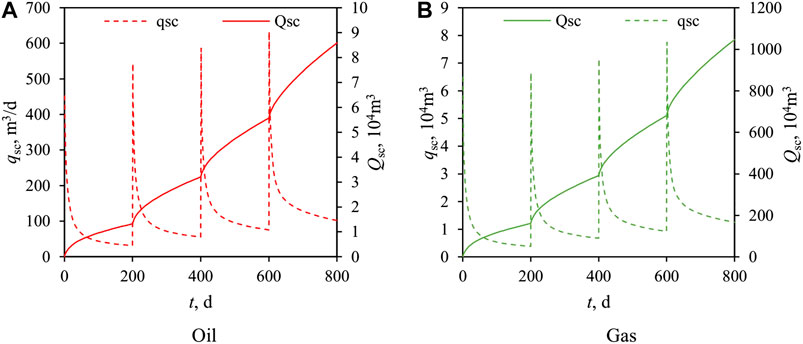
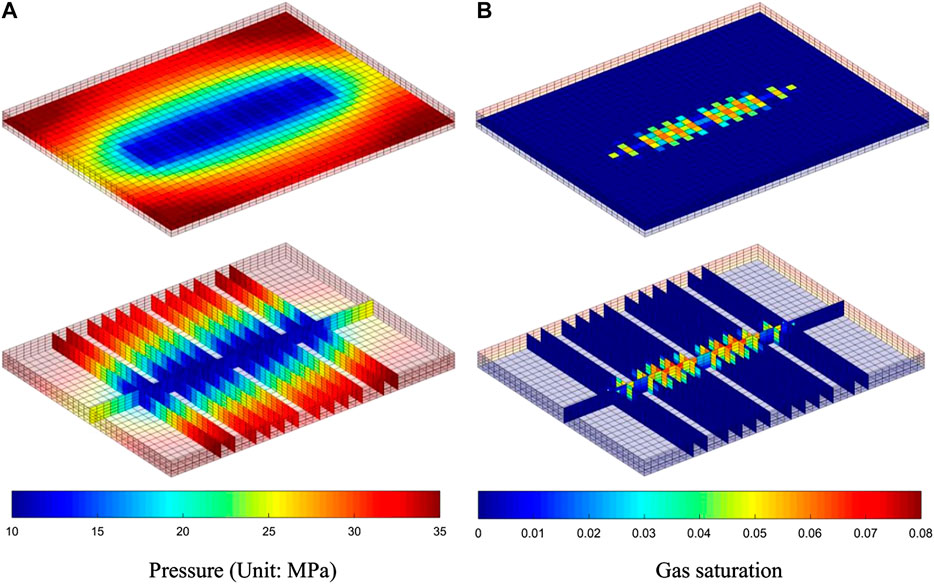
We simulated this scenario. The results of daily and accumulative production of oil and gas are shown in Figure 6. The simulation results show that in each production stage, the early production decreases rapidly, followed by a slow rate of production decline. Figure 7 shows the pressure and gas saturation at the end of simulation. The free gas dissolved from oil in formation occurs only in the near-well area because the region of pressure below the bubble point is relatively small, which is only around the well. Moreover, due to the good seepage condition in the near-well area, the free gas is quickly produced by the fractured well, which keeps the gas saturation in the near-well area low and does not significantly affect the oil phase permeability. Figure 8 presents the pressure and gas saturation profiles of a vertical y-z section of reservoir where the fracture in the middle of horizontal well locates. Figure 8 clearly exhibits the effect of fracture shape, gravity, and fluid density on pressure and saturation profiles.
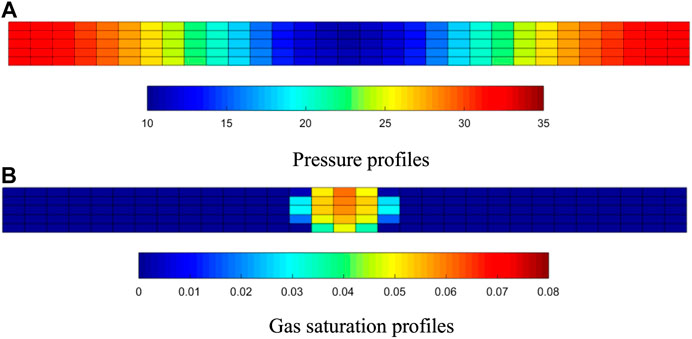
FIGURE 8. Pressure and gas saturation profiles of a x-y section of reservoir where a fracture locates.
Influence of Stress Sensitivity of Natural Fractures
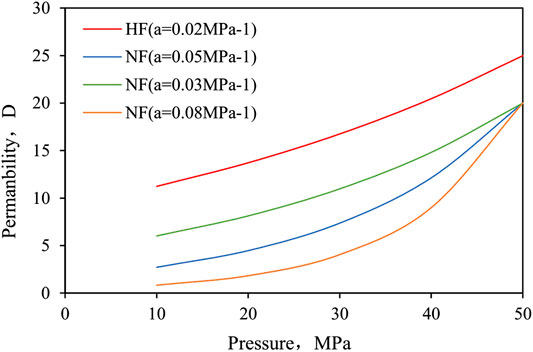
Because of the absence of proppant, natural fractures (NFs) are generally more stress-sensitive than HFs, resulting in NFs to be nearly closed at late period of production and causing a significant impact on well production. In our work, we generated 70 random NFs (as shown in Figure 9). The parameters of NFs are listed in Table 3. Then, we studied the effect of stress sensitivity of NFs by varying the stress sensitivity coefficient of NFs (0.03, 0.05, and 0.08 MPa−1), while the stress sensitivity coefficient of HFs and the matrix are smaller, 0.02 and 0.001 MPa−1, respectively. Figure 10 represents the relationship between permeability of fractures and pressure, including HFs and NFs.
Figure 11 shows the relationship between production and the stress sensitivity coefficient of NFs, where the dotted lines represent the production without NFs. Simulation results demonstrate the remarkable effect of increasing production of NFs. According to Figure 11, in the first stage of production (0–200 days), the difference of production among three stress sensitivity coefficients is small. As time goes on, the difference of production among three stress sensitivity coefficients become lager, and the effect of NFs on production decreases with the increase in the stress sensitivity coefficient. At the last stage, NFs with 0.08 MPa−1 stress sensitivity coefficient have little effect on production compared the scenario without NFs.
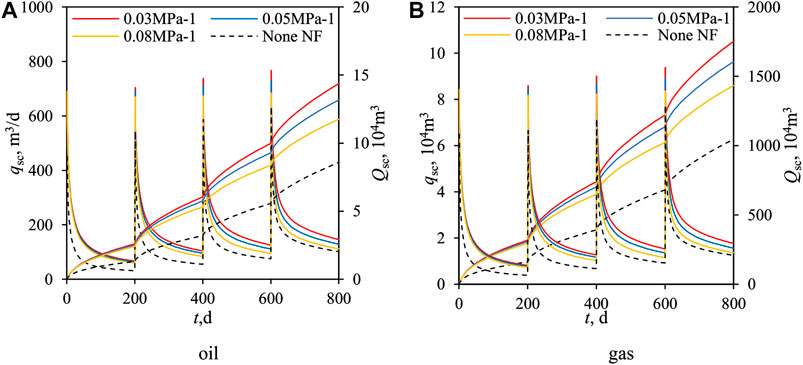
FIGURE 11. Oil and gas production curve under different stress sensitivity coefficient of natural fractures.
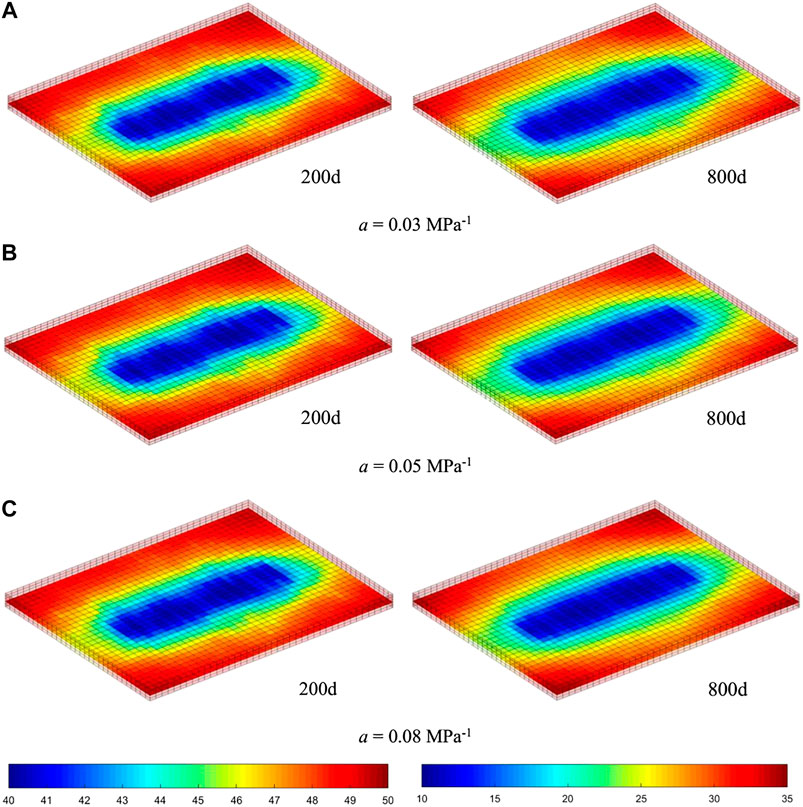
Figure 12 presents the pressure profiles after 200 and 800 days of production. In Figure 12A, pressure profiles under different stress sensitivity coefficients are almost the same, and the distribution of pressure is also affected by fractures obviously. However, in Figure 12B, pressure profiles differ from each other, which is reflected in the smoothness of the shape of isopiestic lines affected by NFs. In Figure 12B, on the condition that the stress sensitivity coefficient is 0.08 MPa−1, the pressure profile is almost the same as if there were no NFs (Figure 7A). Besides, at the first stage of production, the permeability of NFs in three scenarios is quite different (Figure 11), but the production of three scenarios is almost equal (Figure 11), which may be due to the fact that the production/development of the tight reservoir with fractures is determined only by the matrix when the permeability difference between matrix and fracture is extremely great. Because the permeability of the tight reservoir matrix is very small, the fluid transport capacity from the matrix to the fracture is much smaller than the capacity in fractures. Therefore, when the permeability of fractures is high enough, the overall flow in the formation is mainly determined by the matrix with smaller permeability. As the fracture permeability decreases, production becomes more sensitive to the permeability of fractures.
Conclusion
In our work, an EDFM simulator is developed to study the development of multi-stage horizontal wells in tight reservoirs. To capture the complex shape of HFs, the HFs are considered as oval shape. In our simulations, reservoirs have high initial pressure, and wells adopt the step-down BHP production strategy conforming to the character of the actual tight reservoir and its development strategy. Moreover, the phenomenon of solution gas drive is also captured by applying an oil–gas two-phase flow model. Our EDFM simulator is verified by using the fine matrix cell method, which also demonstrates the advantages of the EDFM for modeling fractures with complex shape. Finally, we generate random nature fractures in reservoirs to study the influence of nature fractures and their stress sensitivity in tight reservoirs. From simulations, we could obtain following conclusions from simulation results:
(1) The geometry of fracture has a great influence on the pressure and saturation profiles in the area near the fractures, but the influence distance is limited.
(2) Dissolved gas drive contributes to the development of tight oil. Free gas first appears in the near-wellbore fractured zone with low pressure and quickly flows out of the reservoir because of the good seepage condition in the near-wellbore fractured zone, which does not harm the oil permeability around wells significantly.
(3) As high-permeability channels in the reservoir, NFs can greatly improve production and affect the shape of the oval-like low-pressure zone formed by multi-stage fractured horizontal wells. However, with the development of production, the stress-sensitive effect of NF permeability gradually weakens the positive effect of NFs on production, and the effect of stress sensitivity coefficient on production is more significant in the late stage of production with low reservoir pressure.
Data Availability Statement
The raw data supporting the conclusions of this article will be made available by the authors, without undue reservation.
Author Contributions
Z-dY participates in most work in this research. YW participates in developing simulator and derive formulas. XZ participates in developing simulator and derive formulas. MQ participates in derive formulas and dealing with results and data. ZY participates in derive formulas and dealing with results and data. LL participates in most work in this research. Z‐hY took part in the revision of our manuscript and made valuable comments and contribution to our revision.
Conflict of Interest
Authors Z-dY, YW, XZ and SS were employed by PetroChina Xinjiang Oilfield Company. Authors MQ and Z-hY were employed by Exploration and Development Research Institute of PetroChina Xinjiang Oilfield Company.
The remaining author declares that the research was conducted in the absence of any commercial or financial relationships that could be construed as a potential conflict of interest.
Appendix
References
Al-Rbeawi, S. (2017a). Analysis of pressure behaviors and flow regimes of naturally and hydraulically fractured unconventional gas reservoirs using multi-linear flow regimes approach. J. Nat. Gas Sci. Eng. 45, 637–658. doi:10.1016/j.jngse.2017.06.026
Al-Rbeawi, S. (2017b). How much stimulated reservoir volume and induced matrix permeability could enhance unconventional reservoir performance. J. Nat. Gas Sci. Eng. 46, 764–781. doi:10.1016/j.jngse.2017.08.017
Barenblatt, G. I., Zheltov, I. P., and Kochina, I. N. (1960). Basic concepts in the theory of seepage of homogeneous liquids in fissured rocks [strata]. J. Appl. Math. Mech. 24 (5), 1286–1303. doi:10.1016/0021-8928(60)90107-6
Bastian, P., Chen, Z., Ewing, R., Helmig, R., Jakobs, H., and Reichenberger, V. (2000). Numerical simulation of multiphase flow in fractured porous media. Numerical treatment of multiphase flows in porous media. Berlin, Heidelberg: Springer, 50–68.
Blaskovich, F., Cain, G., Sonier, F., Waldren, D., and Webb, S. J. (1983). “A multicomponent isothermal system for efficient reservoir simulation,” in Middle East oil technical conference and exhibition, Manama, Bahrain, 14–17 March.
David, C., Wong, T.-F., Zhu, W., and Zhang, J. (1994). Laboratory measurement of compaction-induced permeability change in porous rocks: implications for the generation and maintenance of pore pressure excess in the crust. Pure Appl. Geophys. 143, 425–456. doi:10.1007/bf00874337
Fu, Y., Yang, Y., and Deo, M. (2005). “Three-dimensional, three-phase discrete-fracture reservoir simulator based on control volume finite element (CVFE) formulation,” SPE reservoir simulation symposium, The Woodlands, TX, 31 January–2 February (Dallas, TX: Society of Petroleum Engineers).
Hoteit, H., and Firoozabadi, A. (2006). Compositional modeling of discrete-fractured media without transfer functions by the discontinuous galerkin and mixed methods. SPE J. 11 (3), 341–352. doi:10.2118/90277-pa
Jiang, J., Shao, Y., and Younis, R. (2014). “Development of a multi-continuum multi-component model for enhanced gas recovery and CO2 storage in fractured shale gas reservoirs,” in SPE improved oil recovery symposium, Tulsa, OK, 12–16 April (Dallas, TX: Society of Petroleum Engineers).
Jones, F. O. (1975). A laboratory study of effects of confining pressure on fracture flow and storage capacity in carbonate rocks. J. Petrol. Technol. 27 (1), 21–27. doi:10.2118/4569-pa
Karimi-Fard, M., and Firoozabadi, A. (2003). Numerical simulation of water injection in fractured media using the discrete-fractured model and the galerkin method. SPE Res. Eval.Eng. 6 (2), 117–126. doi:10.2118/83633-pa
Kim, J.-G., and Deo, M. D. (2000). Finite element, discrete‐fracture model for multiphase flow in porous media. AIChE J. 46 (6), 1120–1130. doi:10.1002/aic.690460604
Kou, Z., and Wang, H. (2020). Transient pressure analysis of a multiple fractured well in a stress-sensitive coal seam gas reservoir. Energies 13 (15), 3849. doi:10.3390/en13153849
Lee, S. H., Lough, M. F., and Jensen, C. L. (2001). Hierarchical modeling of flow in naturally fractured formations with multiple length scales. Water Resour. Res. 37 (3), 443–455. doi:10.1029/2000wr900340
Li, L., and Lee, S. H. (2008). Efficient field-scale simulation of black oil in a naturally fractured reservoir through discrete fracture networks and homogenized media. SPE Reservoir Eval. Eng. 11 (4), 750–758. doi:10.2118/103901-pa
Moinfar, A., Varavei, A., Sepehrnoori, K., and Johns, R. T. (2013). “Development of a coupled dual continuum and discrete fracture model for the simulation of unconventional reservoirs,” in SPE reservoir simulation symposium, The Woodlands, TX, 18–20 February (Dallas, TX: Society of Petroleum Engineers).
Moinfar, A., Varavei, A., Sepehrnoori, K., and Johns, R. T. (2014). Development of an efficient embedded discrete fracture model for 3D compositional reservoir simulation in fractured reservoirs. SPE J. 19 (2), 289–303. doi:10.2118/154246-pa
Pruess, K., and Narasimhan, T. (1982). A practical method for modeling fluid and heat flow in fractured porous media. SPE J. 25 (1), 14–26. doi:10.2118/10509-PA
Warren, J. E., and Root, P. J. (1963). The behavior of naturally fractured reservoirs. Soc. Petrol. Eng. J. 3 (3), 245–255. doi:10.2118/426-pa
Wu, Y.-S., and Pruess, K. (1988). A multiple-porosity method for simulation of naturally fractured petroleum reservoirs. SPE Reservoir Eng. 3 (1), 327–336. doi:10.2118/15129-pa
Xiao, W., Li, T., Li, M., Zhao, J., Zheng, L., and Li, L. (2016). Evaluation of the stress sensitivity in tight reservoirs. Petrol. Explor. Dev. 43 (1), 107–114. doi:10.1016/s1876-3804(16)30013-1
Xu, Y. (2015). Implementation and application of the embedded discrete fracture model (EDFM) for reservoir simulation in fractured reservoirs. Austin, TX: The University of Texas at Austin.
Zhang, L., Kou, Z., Wang, H., Zhao, Y., Dejam, M., Guo, J., et al. (2018). Performance analysis for a model of a multi-wing hydraulically fractured vertical well in a coalbed methane gas reservoir. J. Petrol. Sci. Eng. 166, 104–120. doi:10.1016/j.petrol.2018.03.038
Zhang, R. H., Zhang, L. H., Wang, R. H., Zhao, Y. L., and Huang, R. (2016). Simulation of a multistage fractured horizontal well with finite conductivity in composite shale gas reservoir through finite-element method. Energy & Fuels. 30 (30), 9036–9046.
Zhao, J., Xiao, W., Li, M., Xiang, Z., Li, L., and Wang, J. (2011). The effective pressure law for permeability of clay-rich sandstones. Pet. Sci. 8 (2), 194–199. doi:10.1007/s12182-011-0134-0
Zhao, Y.-l., Zhang, L.-h., Zhao, J.-z., Luo, J.-x., and Zhang, B.-n. (2013). "Triple porosity" modeling of transient well test and rate decline analysis for multi-fractured horizontal well in shale gas reservoirs. J. Petrol. Sci. Eng. 110, 253–262. doi:10.1016/j.petrol.2013.09.006
Zhao, Y. l., Liu, L. f., Zhang, L.-h., Zhang, X. Y., and Li, B. (2019). Simulation of a multistage fractured horizontal well in a tight oil reservoir using an embedded discrete fracture model. Energy Sci. Eng. 7 (5), 1485–1503. doi:10.1002/ese3.379
Keywords: numerical simulation, flow in porous media, tight oil reservoirs, embedded discrete fracture model, Multi-stage fractured horizontal well
Citation: Yang Z-d, Wang Y, Zhang X-y, Qin M, Su S-w, Yao Z-h and Liu L (2020) Numerical Simulation of a Horizontal Well With Multi-Stage Oval Hydraulic Fractures in Tight Oil Reservoir Based on an Embedded Discrete Fracture Model. Front. Energy Res. 7:601107. doi: 10.3389/fenrg.2020.601107
Received: 31 August 2020; Accepted: 20 October 2020;
Published: 23 November 2020.
Edited by:
Kaiqiang Zhang, Imperial College London, United KingdomReviewed by:
Salam Al-Rbeawi, Middle East Technical University, TurkeyFreddy Humberto Escobar, South Colombian University, Colombia
Xu Jianchun, China University of Petroleum, China
Copyright © 2020 Yang, Wang, Zhang, Qin, Yao and Liu. This is an open-access article distributed under the terms of the Creative Commons Attribution License (CC BY). The use, distribution or reproduction in other forums is permitted, provided the original author(s) and the copyright owner(s) are credited and that the original publication in this journal is cited, in accordance with accepted academic practice. No use, distribution or reproduction is permitted which does not comply with these terms.
*Correspondence: Lingfu Liu, bGluZ2Z1LmxpdUBvdXRsb29rLmNvbQ==; Zhi-dong Yang, WWFuZ3pkNjg4QHBldHJvY2hpbmEuY29tLmNu
 Zhi-dong Yang1,2*
 Lingfu Liu