- 1Aero-Thermo-Mechanics Laboratory, Université Libre de Bruxelles, Ecole Polytechnique de Bruxelles, Bruxelles, Belgium
- 2Université Libre de Bruxelles and Vrije Universiteit Brussel, Combustion and Robust Optimization Group (BURN), Bruxelles, Belgium
- 3Thermal Engineering and Combustion Unit, University of Mons (UMONS), Mons, Belgium
- 4Department of Chemistry, Materials, and Chemical Engineering “G. Natta”, Politecnico di Milano, Milano, Italy
Ammonia/hydrogen-fueled combustion represents a very promising solution for the future energy scenario. This study aims to shed light and understand the behavior of ammonia/hydrogen blends under flameless conditions. A first-of-its-kind experimental campaign was conducted to test fuel flexibility for different ammonia/hydrogen blends in a flameless burner, varying the air injector and the equivalence ratio. NO emissions increased drastically after injecting a small amount of NH3 in pure hydrogen (10% by volume). An optimum trade-off between NOx emission and ammonia slip was found when working sufficiently close to stoichiometric conditions (ϕ = 0.95). In general, a larger air injector (ID25) reduces the emissions, especially at ϕ = 0.8. A well-stirred reactor network with exhaust recirculation was developed exchanging information with computational fluid dynamics (CFD) simulations, to model chemistry in diluted conditions. Such a simplified system was then used in two ways: 1) to explain the experimental trends of NOx emissions varying the ammonia molar fraction within the fuel blend and 2) to perform an uncertainty quantification study. A sensitivity study coupled with latin hypercube sampling (LHS) was used to evaluate the impact of kinetic uncertainties on NOx prediction in a well-stirred reactor network model. The influence of the identified uncertainties was then tested in more complex numerical models, such as Reynolds-averaged Navier–Stokes (RANS) simulations of the furnace. The major over-predictions of existing kinetic scheme was then alleviated significantly, confirming the crucial role of detailed kinetic mechanisms for accurate predictive simulations of NH3/H2 mixtures in flameless regime.
Introduction
Global warming and air pollution are pushing to identify new solutions that can reduce CO2 and greenhouse gas (GHG) emissions (UNFCCC, 2015), through the replacement of fossil fuels with renewable energies (RE). Notwithstanding the intermittent nature of RE sources (wind, solar, etc.), continuous, and on demand, power production can be achieved by exploiting RE surplus in power to fuel techniques (Evans et al., 2012). In this contest, hydrogen is one of the most promising energy carrier, in spite of the challenges related to its storage and transportation. In order to bypass these complications, “green” H2 may be converted to other molecules with different properties. In this regard, ammonia shows a very high potential (Kobayashi et al., 2018), as it has very high H2 density and it can be liquefied at pressures higher than 9.9 bar at ambient temperature. From an economic perspective, “green ammonia” was also found to be competitive with natural gas-based ammonia plants (“gray ammonia”), as a result of the recent cost reductions in solar and wind technologies (Philibert, 2017). However, comparing to other liquid fuels (i.e., gasoline), ammonia presents some safety issues, being considered a high health hazard, since it is corrosive to the skin, eyes, and lungs. Once it turns to gas, ammonia is colorless with a sharp, penetrating, intensely irritating odor.
Takizawa et al. (2008) and Hayakawa et al. (2015) performed laminar flame speed measurements for ammonia in different conditions, showing its limited reactivity, which may lead to combustion instabilities (Valera-Medina et al., 2017a). To overcome these practical issues, NH3 combustion doped with hydrogen was tested in internal combustion engines (Frigo and Gentili, 2013), rapid compression machines (Pochet et al., 2017), and swirl burners (Valera-Medina et al., 2017b; Valera-Medina et al., 2019) for utilization within a gas turbine environment, where it was found to have significant NOx emissions. Originally, ammonia kinetics was given prominence for its role in both fuel NOx formation and abatement through selective non-catalytic reduction (SNCR) (see Cremer et al., 2000). The pioneering work from Miller and Bowman (1989) in ammonia kinetic modeling was validated via several species measurements and laminar flame speeds (Maclean and Wagner, 1967; Green and Miller, 1981). Lately, Glarborg et al. (2018) reviewed the nitrogen chemistry in combustion, including the NH3 sub-mechanism. Nowadays, even other widely validated kinetic models for ammonia oxidation are available in the literature, for instance, the ones from Shrestha et al. (2018), Otomo et al. (2018) and Stagni et al. (2020).
Over the last years, particular attention was paid to flameless combustion, introduced by Wünning and Wünning (1997), which is characterized by preheated and diluted reactants, non-visible flame, and uniform distributed temperatures. These features result in a stable, complete, and efficient combustion, together with a strong reduction of pollutants, such as CO, NOx, and soot. Later on, high temperature air combustion (HiTAC) (Katsuki and Hasegawa, 1998), moderate or intense low oxygen dilution (MILD) (Cavaliere and de Joannon, 2004), and colorless distributed combustion (CDC) (Arghode and Gupta, 2010; Arghode et al., 2012) were also investigated.
In spite of the reasonable number of investigations involving natural gas or methane (see Plessing et al., 1998; Özdemir and Peters, 2001; Dally et al., 2004; Szego et al., 2008; Veríssimo et al., 2011; Veríssimo et al., 2013; Huang, 2018), the amount of detailed studies available for furnaces operating under flameless or MILD conditions using non-conventional fuels is scarce and limited to few operating conditions (see Ayoub et al., 2012; Mosca, 2017; Sabia et al., 2019; Ferrarotti et al., 2018). For the first time in the literature, Sorrentino et al. (2019) investigated the feasibility of pure ammonia combustion using a MILD lab-scale cyclonic burner, varying the mixture equivalence ratio, nominal thermal power, and inlet preheating level. They pointed out the need of operating above 1300 K to ensure both combustion stability and low NOx emissions. A minimum in NOx emissions (less than 100 ppm) was observed for equivalence ratios (ER) between 1 and 1.1, with tolerable ammonia slip.
Cavaliere and de Joannon (2004) suggested that, in terms of fluid dynamics, the reactive zone in MILD combustion might evolve as in a well-stirred reactor (WSR). The feasibility of such an approximation was recently demonstrated through systematic comparison with experimental data from attached flames (Chen et al., 2017). Medwell et al. (2016) successfully extended such hypothesis to the Jet in Hot Coflow (JHC) flames, focusing on the chemistry-dominated effects, to distinguish among two different resembling regimes in non-premixed flames, that is, MILD combustion and autoignition lifted flames. Conclusively, Zieba et al. (2019) proposed to adopt a series of plug flow reactors (PFRs) with recirculation, while Rocha et al. (2020) adopted a freely propagating flame model with exhaust gas recirculation (EGR).
The main purpose of this work is to present first-of-their-kind experimental data from an industrial flameless burner fired with NH3/H2 blends over a wide range of operating conditions. Since the main challenges associated with ammonia combustion are NOx emissions and ammonia slip, such campaign aimed at finding a configuration with optimal trade-off between the two, and at testing fuel flexibility in the ULB flameless furnace. The second goal consists in using the data gathered in this study to extend the validation of existing numerical models for turbulence/chemistry interaction (partially stirred reactor—PaSR model), which was extensively validated for other fuels, in traditional (Chomiak and Karlsson, 1996; Hua et al., 2005; Sabelnikov and Fureby, 2013; Duwig and Iudiciani, 2014) and flameless/MILD conditions (Ferrarotti et al., 2018; Ferrarotti et al., 2019; Amaduzzi et al., 2020; Li et al., 2021). The last objective is to verify whether the origin of the deviation between experimental measurements and model predictions for NOx emission is attributable to uncertainty in ammonia kinetics. In these regards, a canonical WSR model with exhaust gases recirculation was adopted to isolate the effect of kinetics, and to identify influential reactive steps for NOx formation, through sensitivity analysis. Subsequently, uncertainty quantification (UQ) techniques were adopted to identify the uncertainty bounds for NOx emissions, due to the identified impactful reactions. A conceptual scheme of the followed methodology is shown in Figure 1.
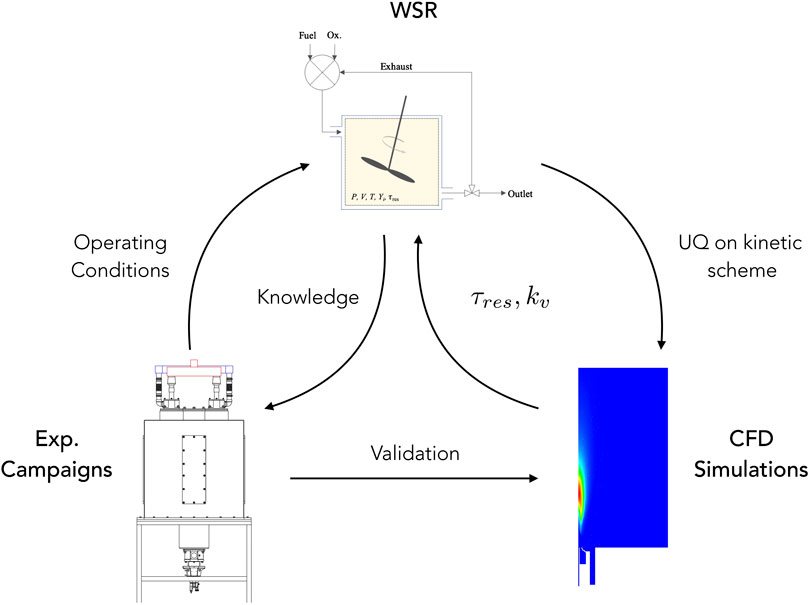
FIGURE 1. Conceptual scheme about the interactions between experiments, CFD modeling, and WSR model.
The remainder of the work is organized as follows. Section 2 presents the proposed methodology. Section 3 describes the aforementioned experimental campaign, exploring the feasibility of flameless/MILD combustion for NH3/H2 mixtures, and the related validation of numerical models, together with the range of NOx predictions induced by the uncertainty factor of influential rate constant in the kinetic sub-model. Finally, conclusions are drawn in Section 4.
Methodology
Experimental Facility and Measurement Techniques
In the following subsections, the experimental facility is presented with particular focus on the description of the operating conditions and the main measurement techniques. The furnace was introduced in Ferrarotti et al. (2018), and it is shown in Figure 2. It is composed of a cubic combustion chamber (1,100 × 1,100 × 1,100 mm) insulated with a 200-mm-thick high-temperature ceramic foam layer, resulting in inner dimensions of 700 × 700 × 700 mm. A commercial WS REKUMAT M150 recuperative Flame-FLOX burner (nominal power of 20 kW) is mounted at the bottom of the combustion chamber. The burner has an integrated metallic finned heat exchanger to extract energy from the flue gases and to preheat the combustion air. The test bench shows a configuration similar to industrial furnaces, allowing to vary geometry, injection system, air excess, and load. The fuel is injected via a centrally located nozzle (inner diameter ID 8 mm) and surrounded by a coaxial air jet, whose dimensions can be varied to adjust the air jet entrainment (ID 16-20-25 mm) (Figure 2 (bottom right)). The unit is equipped with an air cooling system (Figure 2) consisting of four cooling tubes [outer diameter (OD) of 80 mm], with a length of 630 mm inside the furnace. Varying the air flow allows the combustion chamber to operate at different stable conditions, thus simulating the effect of a variable load. On each vertical wall of the combustion chamber, an opening is available for measurements. One side is equipped with a 110 × 450-mm quartz window allowing OH* chemiluminescence measurements. The other three openings are blocked using the same insulation material, and they host ports for temperature measurements. Temperature inside the chamber is sampled at different locations. Three sides of the furnace are closed with insulated plates. One of them (Figure 2) is equipped with twelve equally spaced thermocouple ports, at a related distance of 50 mm. In particular, an air-cooled suction pyrometer equipped with a 0.5-mm diameter B-type thermocouple (platinum rhodium—30%/platinum rhodium—6%) is used to measure the in-flame temperature profiles. It works with a Venturi tube connected to a compressed air circuit at a maximum pressure of 6 bar(g). The thermocouple is protected from chemical attack and from radiation heat exchange with the surrounding walls by two concentric sintered alumina shields (Ferrarotti et al., 2018). According to the specifications of the manufacturer, the associated uncertainty is 0.5% of the reading. Finally, the exhaust gas temperature (before the heat exchanger) is given by a shielded N-type thermocouple (Nicrosil/Nisil) positioned on the central plane and shifted 200 mm with respect to the axis, on the bottom wall (Figure 2). Other K-type thermocouples measure temperature of the main operating parameters, such as fuel, cooling air, combustion air, and exhaust gases after the heat exchanger temperature. An intensified charge-coupled device (ICCD) camera allows to record chemiluminescence images to analyze the topology of the reaction zones. In the current configuration, images were recorded with an ICCD camera (LaVision 1,392 × 1,040 pixels—16 bits) equipped with a UV 78 mm f/3.8 lens and an interferential filter to collect OH* (310 × 10 nm). Considering the size of the window (110 × 450 mm), the accessible area on the symmetry plane of the furnace goes from 40 to 500 mm from the burner exit. A series of
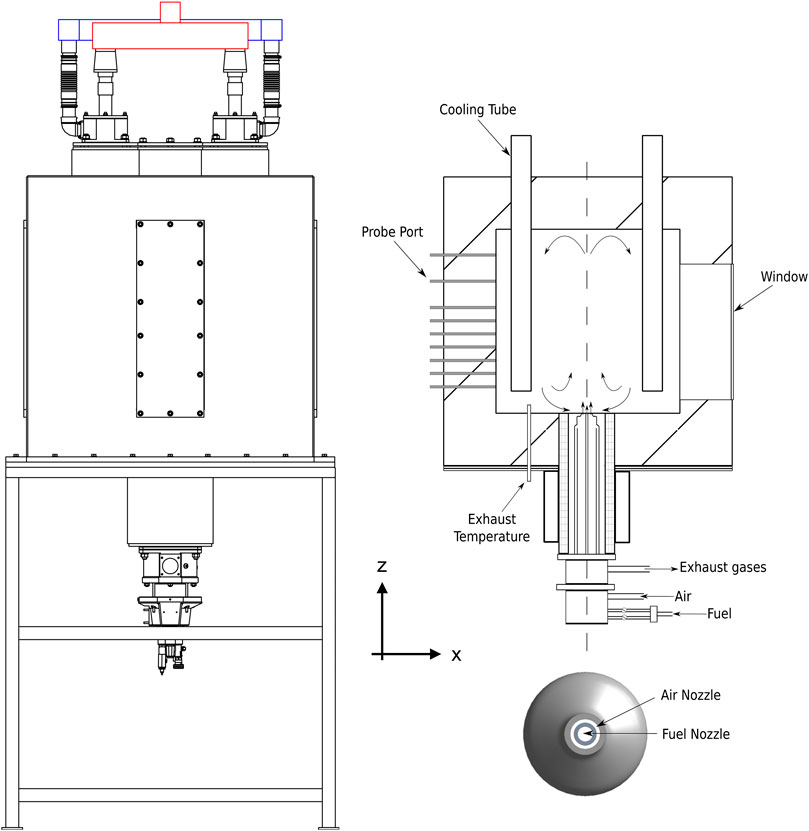
FIGURE 2. Schematic of the furnace (left), vertical cross section (top right), and burner nozzle (bottom right). For sake of clarity, only a part of the probe ports is shown.
Numerical Modeling
Computational Fluid Dynamics Model
The Reynolds-averaged Navier–Stokes (RANS) simulations were solved with the commercial code Fluent 19.3 by Ansys, Inc. Turbulence chemistry interactions were handled with the PaSR combustion model (Ferrarotti et al., 2018; Ferrarotti et al., 2019). In the latter model, the chemical time scale is retrieved from the species formation rate, while a static formulation for the mixing time scale is computed as follows:
The constant
Well Stirred Reactor With Exhaust Gas Recirculation
As recommended by Medwell et al. (2016), an adiabatic, non-isothermal well-stirred reactor, with recirculation, was adopted to model the chemistry of a highly diluted and preheated reactive mixture (i.e., MILD-like conditions). Indeed, as flameless combustion is characterized by a slower chemistry, ignition is likely to take place in flame kernels with premixed fuel and oxidizer, and relatively low strain rate, i.e., distant from the inlet. In this study, the use of WSR with recirculation is intended to map pollutants emissions (i.e., NOx) in different operating conditions, and to qualitatively reproduce experimental trends. Also, this simplified model was used for UQ (see Uncertainty Quantification). Figure 1(top) shows a schematic representation of the adopted network. The mixing unit receives three streams in input, namely fuel, air and exhaust gases. The temperature of each stream is equal to that of experiments. It has to be pointed out that the temperature of exhaust gases was assumed to be equal to that measured at the outlet (before the heat exchanger). This was done to avoid modeling of heat losses along the recirculation region, where the mixture may be assumed to be nonreactive (Zieba et al., 2019). As proposed by Medwell et al. (2016), intermediate species were included in the EGR, since they were found to take part in pre-ignition chemistry in MILD regime (Sidey et al. (2014)). The complete list of recirculated species in the exhaust gas is NH3, H2, O2, N2, H, O, H2O, OH, HO2, and NO. The network consists in a Matlab script involving the perfectly stirred reactor solver in OpenSMOKE++ by Cuoci et al. (2015).
The residence time of the reactor
where
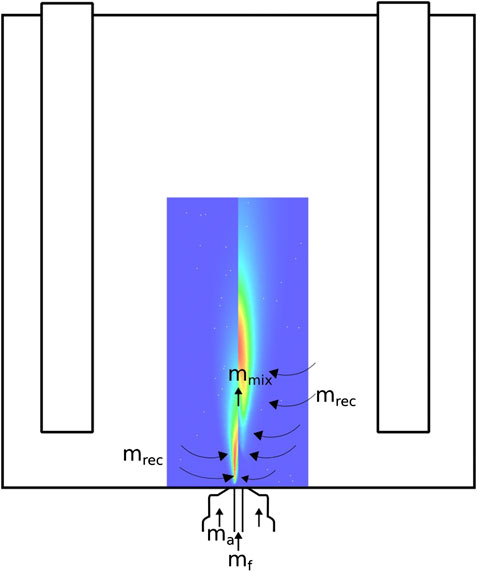
FIGURE 3. Schematic representation of the internal recirculation pattern used to calculate
Uncertainty Quantification
The uncertainty related to a reaction rate constant is often expressed in terms of a factor (see Baulch et al., 2005), which is usually defined as follows:
where k is the kinetic rate constant for a generic reaction, and the subscripts nom, max, and min represent its nominal, maximum, and minimum value, respectively. According to Eq. 3, the kinetic rate constant, for each reactions in a kinetic mechanism, can be addressed as a random variable with estimated uncertainty (i.e., with a factor of
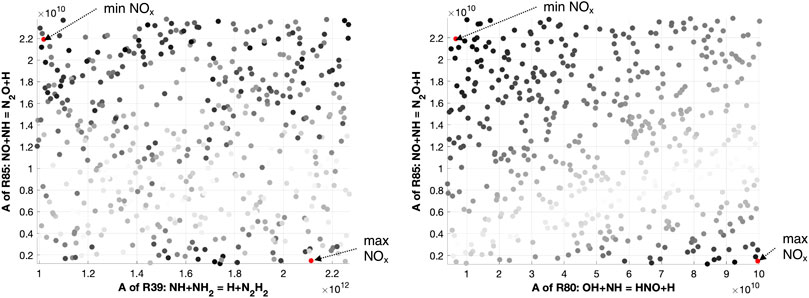
FIGURE 4. Latin hypercube sampling samples for reactions R80, R85, and R39. Here, the gray scale represents in black the points with maximum NO deviation from the nominal mechanism, and in white the points with minimum NO deviation.
Results and Discussion
Experimental Results
This section focuses on the quantification of NOx emissions and ammonia slip observed while burning different ammonia/hydrogen mixtures using an industrial flameless burner. To the authors’ knowledge, this is the first time such analysis is carried out. Different combinations of air injectors (diameters of 25 and 16 mm hereafter referred to as ID25 and ID16), equivalence ratio (0.8–1), and fuel composition were tested. Rich conditions were excluded from the study to ensure a full conversion of the fuel and to minimize the content of ammonia-slip released in atmosphere. Figure 5 shows the intense yellow color typical of ammonia combustion for different NH3-H2 blends, for the case ID25 and ϕ = 1.
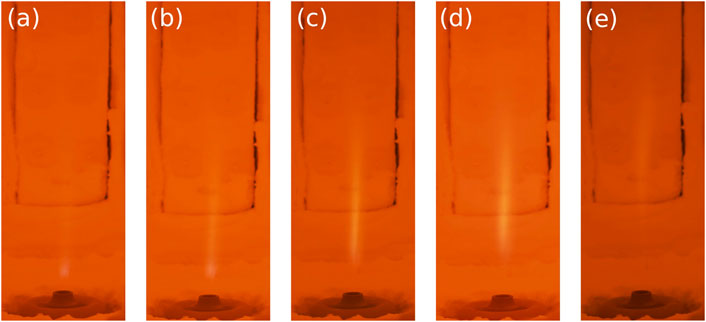
FIGURE 5. Photographs of NH3-H2 combustion for (A) N10H90, (B) N20H80, (C) N40H60, (D) N50H50, and (E) N60H40. ID25, ϕ = 1. Canon EOS 80D 1/70 s exposure time.
Figures 6, 7 compare averaged experimental temperature profiles extracted at different axial locations and OH* imaging for the N50H50 mixture, varying the air ID and the ER. Using ID16 and ϕ = 0.8, the reaction region is located in a region between 110–160 mm from the nozzle, with a maximum temperature of around 1750 K, at z = 150 mm. The OH* contour also appears more spread and less intense than the other cases. Indeed, ID16 ensures a very high injection velocity (∼185 m/s), leading to a high strain rate value close to the burner exit. At a certain axial distance, when the latter weakens, ignition occurs, leading to a noticeable lift-off. Keeping the same injector, but reducing the air excess (ϕ = 1), thinner reaction layer shifted toward the burner exit is observed. However, for this case, as well as for ID25, the actual maximum temperature is likely to be located below the first available measurement port (z = 100 mm). When the ID25 is employed, the OH* region is shifted even more upstream (between 50 and 80 mm) and the temperatures profiles are smoother for the investigated region.
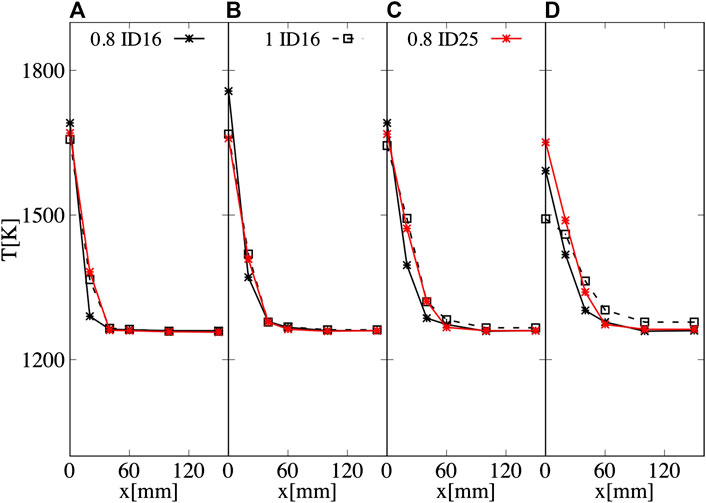
FIGURE 6. Averaged temperature measured at (A) z = 100 mm, (B) z = 150 mm, (C) z = 200 mm, and (D) z = 400 mm for N50H50, varying the air ID and ϕ. Averaged experimental uncertainty of 10 K.
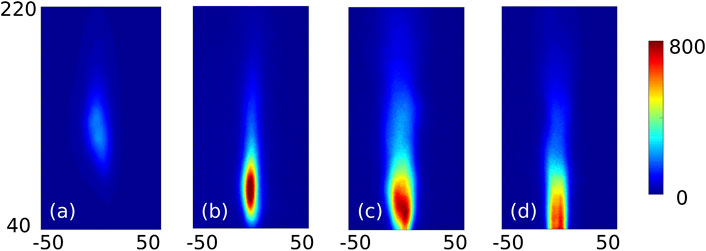
FIGURE 7. Averaged OH* distribution for ID16 ϕ = 0.8 (A) and ϕ = 1 (B) and for ID25 ϕ = 0.8 (C) and ϕ = 1 (D). Units in mm and counts. N50H50.
Figure 8 (left) shows the normalized NO (at 3% of O2) and ammonia-slip emissions, varying the ammonia molar fraction and the ER for ID25. Differently from nitrogen-free fuels (i.e., methane and hydrogen), when a fuel blend containing ammonia is used, different pathways are involved. With a small amount of NH3 (10% in volume), NO emissions grow considerably (from 159 to 827 ppm for ϕ = 0.8), reaching a peak between 50% and 60% NH3 of 3,500 ppm. Moreover, results suggest that the stoichiometry has a major impact on NO formation, confirming literature outcomes from Somarathne et al. (2017) and Sorrentino et al. (2019). As expected, the minimum NO emission levels were obtained close to stoichiometric conditions. Under these conditions, NO is less sensitive to the reaction O + NH2 = H + HNO (R31 in Table 1) due to a lower availability of the radical O. HNO is then converted to NO via the reaction HNO + H → NO + H2 (more details in next Section). Furthermore, going toward ϕ = 1, the peak is shifted progressively toward lower ammonia molar fraction up to 10% NH3 for ϕ = 1 (137 ppm). Very low NO emissions (single digit) can be achieved for this last condition (ϕ = 1), for a percentage of ammonia above 50%. The stabilization of pure ammonia combustion was not achieved, since extinction occurred above 80% NH3, for all the investigated conditions. In the literature, there are example of pure ammonia burning in MILD regime, for instance, Sorrentino et al. (2019) managed to use pure ammonia in a cyclonic burner, under specific conditions. Further investigations will focus on extending the extinction limit preheating ammonia and/or reducing the thermal power to enhance the reactivity and increase the residence time, respectively. Finally, reaching conditions close to stoichiometry, unburned ammonia might be found in the exhaust gases (NH3-slip). At ϕ = 1 (Figure 8 (right)), NH3-slip rapidly increases. reaching values about ∼3,000 ppm, while it is almost zero for lean conditions. An optimal window can be found between ϕ = 0.95 and ϕ = 1.00 with a strong reduction in NO emission (maximum value 400 ppm) as well as low NH3-slip. However, it must be pointed out that it is easier to clean the exhaust gases removing ammonia (i.e., by condensation and adsorption) than adopting techniques to abate NO (i.e., DeNOx).
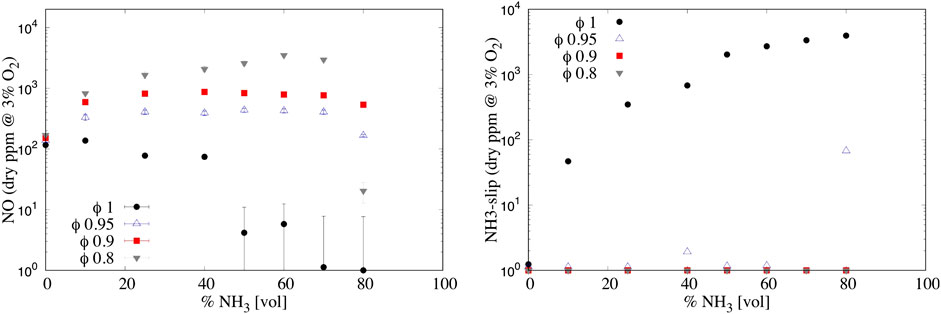
FIGURE 8. (Left) NO and (right) NH3-slip emissions varying the NH3 percentage in the fuel (vol.) and the equivalence ratio ϕ for ID 25 mm. Uncertainty is reported only for NO, while for NH3-slip the averaged relative uncertainty can be considered as 8%.
The effect of the air injector ID is shown in Figures 9 for both NO (left) and NH3-slip (right) emissions. A higher air inlet velocity tends to increase NOx emissions as well. This might be explained considering the following: a higher recirculation ratio

FIGURE 9. (Left) NO and (right) NH3-slip emissions varying the NH3 percentage in the fuel (vol.) and the equivalence ratio ϕ for ID 16 mm. Uncertainty is reported only for NO, while for NH3-slip the averaged relative uncertainty can be considered as 8%.
Uncertainty Analysis
The WSR analysis is not intended to quantitatively predict the experimental data shown in Figures 8, 9, but to provide qualitative information about NO formation in hydrogen–ammonia mixtures. Figure 10 shows the NO estimations computed with the WSR network, varying the ammonia molar fraction in the fuel, for the two different ER (i.e., ϕ = 0.8, 1). These estimations are referred to as mean values. Their variability due to separate influence of the uncertainties in
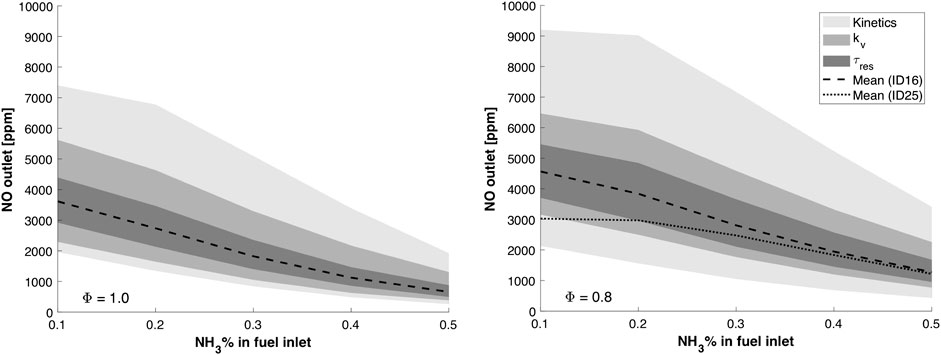
FIGURE 10. Effect of the recirculation degree
Remarkably, the simplified reactor network is capable of qualitatively capturing the NOx dependence on the equivalence ratio, as observed experimentally (see Experimental results). In fact, the following conclusions can be withdrawn by looking at the mean model predictions:
• at ϕ = 1 (see Figure 10) (left), for ID16, a peak is observed in correspondence of the N10H90 mixture, then emissions diminish as ammonia concentration in the fuel raises;
• at ϕ = 0.8 (see Figure 10) (right), NO emissions increase with respect to stoichiometric conditions;
• at ϕ = 0.8, a lower NO production can be achieved using a larger air injector (ID25). This is in line with what was found experimentally (see Figure 8). The lower inlet velocity, due to ID25 configuration, reduces the entrainment of exhaust gas
As the adopted
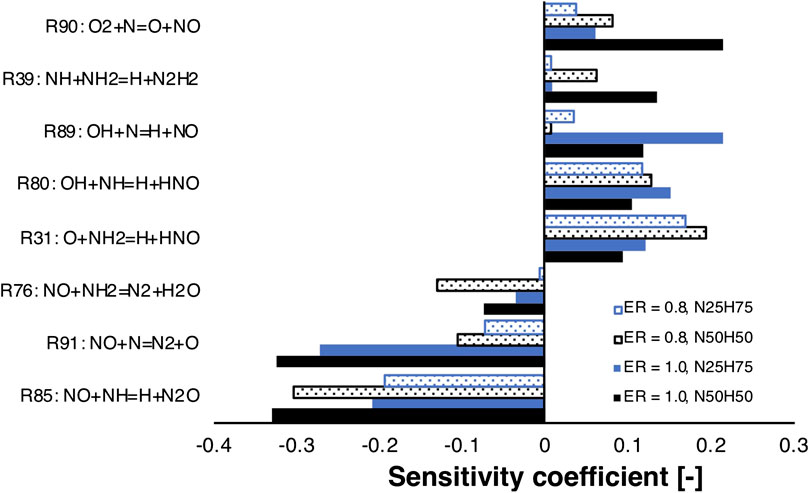
FIGURE 11. NO sensitivity analysis for NH3/H2 mixtures at different fuel compositions and equivalence ratios. ID16.
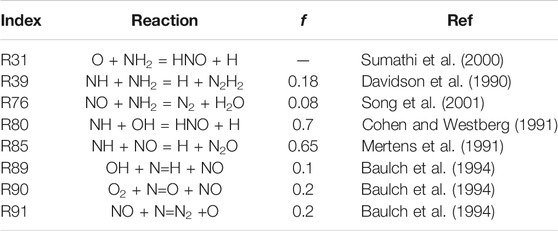
In particular, reactions involved in the hydrogen core mechanism were discarded a priori. The sub-mechanism for thermal NOx, involving R89, R90, and R91, was found to be particularly sensitive, especially for stoichiometric mixtures. However, it was not considered for the UQ, as the authors assumed it to be well-characterized (see Baulch et al., 1994). Interestingly, R85 is the most important reaction with negative sensitivity coefficient. It is also important to point out that NO is very sensitive to R31, which forms HNO, for lean conditions, where more oxygen is available. Indeed, HNO is then converted to NO via HNO + H = NO + H2. This may explain why lean conditions produce higher NO emissions. However, R31 and R76 were found to have high sensitivity coefficient for temperature and consequently ruled out from the UQ study. Regarding other reactions, R80 converts NH into HNO and impact positively the sensitivity, and R39 is only sensitive for higher ammonia content in the fuel than 25%. Indeed, this reaction affects more and more the formation of NO as NH2, and NH production increase, due to higher availability of NH3 as well as lower H and OH radicals’ concentrations. As a consequence, only R80, R85, and R39 were selected for the UQ study. Table 1 reports the adopted uncertainty factors for reactions in Figure 11, based on literature information.
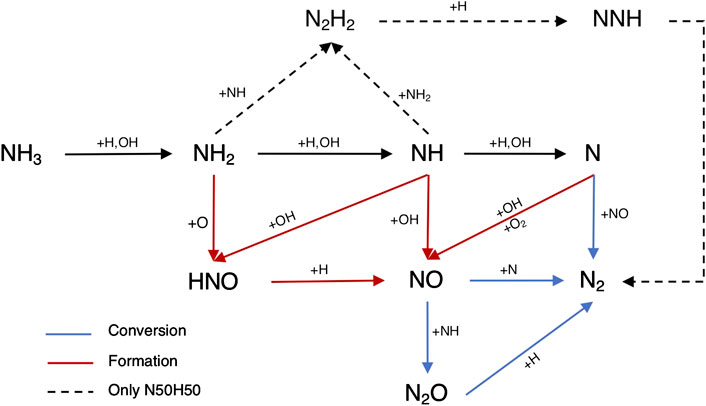
In addition, a flux analysis was performed for both N25H75 and N50H50 mixtures (see Figure 12), to explain the NO emissions trends.
Ammonia reactivity proceeds along NH2 → NH → N, and NO is part of its oxidation. In fact, NH2 mainly forms NH and HNO in R31, which gives NO. The NH intermediate has a crucial role, as not only leads to NO through HNO in R80, but also reacts with it in R85 to form N2O, which is almost completely converted to N2 in the termination step H + N2O = N2 + OH. In addition, NH is converted to N, which exhibits an analogous behavior, that is, it produces NO in R89 and R90, but also reacts with it in R91, again as a termination step. Up to N10H90, hydrogen concentration is so high that the radical pool is extremely rich in H and OH, prompting HNO production (R80) and its next conversion to NO, determining an emissions peak. The latter peak is even more pronounced at ϕ = 0.8 because of the higher availability of local O radical, prompting the HNO production via R31. As the NH3 percentage in the fuel increases (i.e., at N50H50), these pathways weaken, and R39 starts competing. The latter reaction offers an alternative path to NH, namely, N2H2 → NNH → N2, which tends to reduce the NO formation by subtracting NH and NH2 from the pool of reactants. So, R39 is part of the reason why richer fuel mixtures in NH3 show decreased NO emissions. In fact, this reaction shows a positive impact of NO sensitivity in Figures 11 as it competes with NH → NO →N2O → N2, which represents the preferential way for the system to reduce NO emissions. Finally, one possible explanation for the existence of a shifted peak at ϕ = 0.8 (see Figure 8) is the higher oxygen content, which pushes the NO production through HNO in R31 for richer mixtures with respect to stoichiometric conditions, delaying the effect of R39. As previously reported in Figure 4, the LHS study suggests that the maximum NO production in Figure 10 is located nearby the maximum of R85, minimum of R39, and R80. The opposite is true for the minimum NO formation in Figure 10, in agreement with the sensitivity and flux analysis.
Uncertainty Propagation in the CFD Simulation
This section is focused on the influence of existing uncertainties in detailed kinetic mechanisms on NO predictions with more complex numerical models, that is, RANS simulations with PaSR sub-model for turbulence/chemistry interaction. To do so, the two mechanisms that were found to give maximum and minimum NO output values from the previously described LHS study were tested. A first validation for temperature profiles is presented for case N50H50 ID16 ϕ = 1. Here, a value of 0.5 was employed for
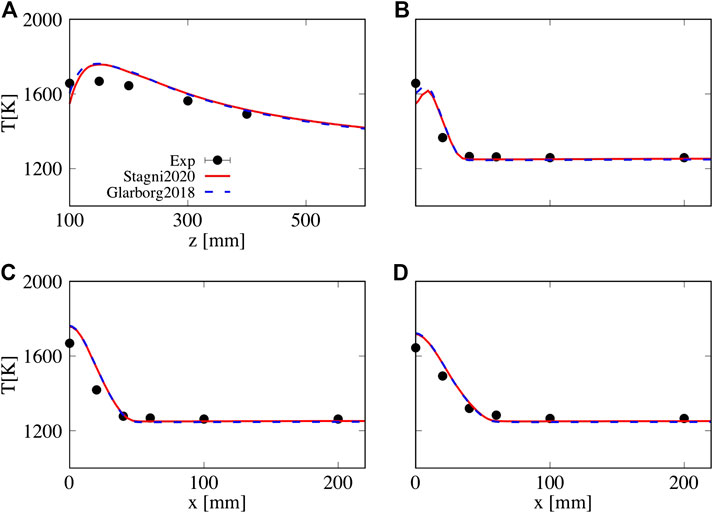
FIGURE 13. Sensitivity of temperature predictions to different kinetic schemes, Stagni2020 and Glarborg 2018. (A) Axial, (B) z = 100 mm, (C) z = 150 mm, and (D) z = 200 mm,
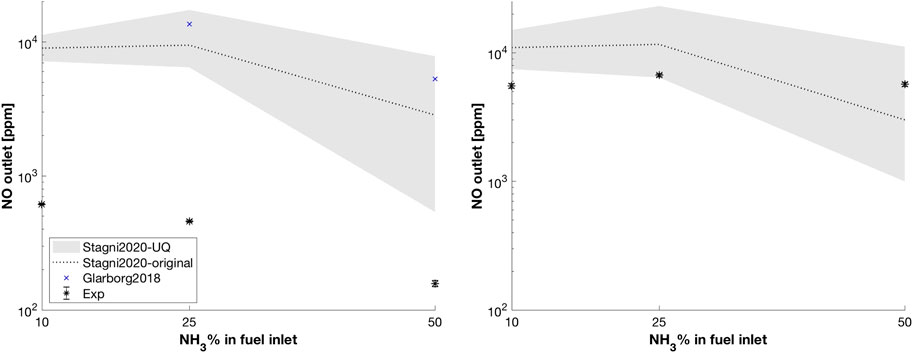
FIGURE 14. Dry NO pollutant emissions predicted using different kinetic schemes, varying the fuel composition. The gray area represents the uncertainty propagation of the LHS study for Stagni 2020. ID16, ϕ = 1 (left) and ϕ = 0.8 (right). Relative experimental uncertainty 2%.
In order to verify the major role of an accurate kinetic sub-model in this chemistry-controlled regime (flameless), results from the previously performed LHS study on the WSR network were tested in CFD simulations. Again, this means performing additional simulations using the set of kinetic parameters corresponding to the maximum and minimum NO emissions on the LHS chart (Figure 4). Figure 14 also shows the uncertainty propagation associated with R39-80-85 on the NO emissions. At ϕ = 1, the lower band moves toward the experimental values, allowing a massive reduction compared to the original model from Stagni et al. (2020). This is true especially for N50H50, where NO emissions decrease from 2,851 to 539 ppm. On the contrary predicted, temperature profiles in the furnace (not shown here) remain almost constant, meaning that the effect of kinetic of the three reactions is relevant only for NO. Much better results were achieved at ϕ = 0.8, where the uncertainty bounds almost intersect the experimental data region for N10H90 and contains it for N25H75 and N50H50.
Conclusion
A novel, interdisciplinary approach to study ammonia/hydrogen blends in flameless combustion was presented in this work. To the authors’ knowledge, these mixtures were experimentally investigated for the first time in such regime. The main findings of this work are summarized in the following:
• An experimental campaign was performed to confirm the enhanced fuel flexibility of the ULB furnace fired with ammonia/hydrogen blends. Operating configurations in terms of trade-off between NOx emissions and ammonia slip could be identified. In fact, ammonia slip emissions are negligible in lean conditions, while they become relevant close to ϕ = 1. The optimal working point was identified for all fuel mixtures at ϕ = 0.95, which allows to reduce NO emissions with respect to leaner conditions, while keeping NH3-slip below 10 ppm. Additionally, a peak in NO emissions was observed for both tested injectors (ID16 and ID25) in stoichiometric conditions, for the mixture N10H90. Then, emissions decreased up to extinction, which occurred for a volume content of ammonia above 80%. In general, for lean cases (ϕ = 0.8), the NO production increased, and a shifted peak toward higher ammonia content in the fuel (N60H40) was observed. Using a bigger air injector (ID25) also help controlling pollutants emissions, as the associated residence time increasing enhances NO conversion to N2.
• Subsequently, these high-fidelity data were used to extend the validation of existing turbulence/chemistry interaction sub-model (PaSR), for non-conventional fuels and conditions. The agreement between temperature measurements and estimations was found to be satisfactory (see Figure 13), and nearly insensitive to the adopted kinetics, that is, Stagni et al. (2020) and Glarborg et al. (2018). However, in terms of NOx emissions, substantial differences between predictions with the two mechanisms were observed (see Figure 14 (left)). In light of this pronounced difference, the error in pollutant emissions can be partially attributed to the uncertainties intrinsically embedded in the kinetic sub-model. Finally, in spite of the large over-prediction at
• A WSR network was designed, and fed with boundary conditions from experiments and CFD simulations for the residence time
In conclusion, a significant portion of the discrepancy between the pollutant emissions from simulations and experimental observations can be associated to inherent uncertainties in recent kinetic mechanisms for ammonia/hydrogen combustion. In fact, the latter were found to be reliable for temperature prediction, while over-predicting NO emission significantly (see Figure 14). Thus, this work indicates the need to improve existing NH3/H2 models, especially in diluted conditions. In particular, specific reactions (Table 1) need better characterization, to improve models of practical systems. This is particularly true for stoichiometric conditions, where the discrepancies between numerical model predictions and experiments were found to be most significant.
Future experimental campaigns will focus on reducing the emissions of pollutants, namely, NH3 and NOx. In this perspective, the effect of fuel preheating and water dilution will be investigated (Ariemma et al., 2020), still need to be characterized. Using a larger injector (ID > 25 mm) could further increase the residence time, thus reducing NO emissions. Finally, a possible option could be to fire the furnace in slightly fuel rich conditions in combination with ammonia slip capture at the furnace outlet. The latter approach would reduce the combustion efficiency though.
Data Availability Statement
The original contributions presented in the study are included in the article, and further inquiries can be directed to the corresponding authors.
Author Contributions
All the authors contributed to the conception and design of the work. In addition, MF performed the experimental and numerical analyses, collected and interpreted the data, and drafted the paper. AB performed the kinetic and UQ analysis and drafted the paper. RA contributed to the experimental and numerical analyses. AP supervised the work, provided feedback about the methods and results, and contributed to the writing (review and editing).
Funding
This project has received funding from the European Research Council (ERC) under the European Union’s Horizon 2020 research and innovation program under grant agreement no. 714605. The first, second, and third authors wish to thank the Fonds de la Recherche Scientifique (FNRS) Belgium for financing their research.
Conflict of Interest
The authors declare that the research was conducted in the absence of any commercial or financial relationships that could be construed as a potential conflict of interest.
Acknowledgments
The authors would finally like to acknowledge and thank the technical support of Adrien Fita-Codina from the Burn laboratory.
References
Amaduzzi, R., Ceriello, G., Ferrarotti, M., Sorrentino, G., and Parente, A. (2020). Evaluation of modeling approaches for mild combustion systems with internal recirculation. Front. Mech. Eng. 6, 20. doi:10.3389/fmech.2020.00020
Arghode, V. K., Gupta, A. K., and Bryden, K. M. (2012). High intensity colorless distributed combustion for ultra low emissions and enhanced performance. Appl. Energy 92, 822–830. doi:10.1016/j.apenergy.2011.08.039
Arghode, V. K., and Gupta, A. K. (2010). Effect of flow field for colorless distributed combustion (CDC) for gas turbine combustion. Appl. Energy 87, 1631–1640. doi:10.1016/j.apenergy.2009.09.032
Ariemma, G. B., Sabia, P., Sorrentino, G., Bozza, P., de Joannon, M., and Ragucci, R. (2020). Influence of water addition on MILD ammonia combustion performances and emissions. Proc. Combust. Inst. doi:10.1016/j.proci.2020.06.143
Ayoub, M., Rottier, C., Carpentier, S., Villermaux, C., Boukhalfa, A. M., and Honore, D. (2012). An experimental study of mild flameless combustion of methane/hydrogen mixtures. Int. J. Hydrogen Energy 37, 6912–6921. doi:10.1016/j.ijhydene.2012.01.018
Baulch, D. L., Bowman, C. T., Cobos, C. J., Cox, R. A., Just, T., Kerr, J. A., et al. (2005). Evaluated kinetic data for combustion modeling: supplement II. J. Phys. Chem. Ref. Data 34, 757. doi:10.1063/1.1748524
Baulch, D. L., Cobos, C. J., Cox, R. A., Frank, P., Hayman, G., Just, T., et al. (1994). Evaluated kinetic data for combustion modeling. supplement i. J. Phys. Chem. Ref. Data 23, 847–848. doi:10.1063/1.555953
Cavaliere, A., and de Joannon, M. (2004). Mild combustion. Prog. Energy Combust. Sci. 30, 329–366. doi:10.1016/j.pecs.2004.02.003
Chen, Z., Reddy, V. M., Ruan, S., Doan, N. A., Roberts, W. L., and Swaminathan, N. (2017). Simulation of MILD combustion using perfectly stirred reactor model. Proc. Combust. Inst. 36, 4279–4286. doi:10.1016/j.proci.2016.06.007
Chomiak, J., and Karlsson, A. (1996). Flame liftoff in diesel sprays. Symposium (International) on Combust. 26, 2557–2564. doi:10.1016/S0082-0784(96)80088-9
Cohen, N., and Westberg, K. R. (1991). Chemical kinetic data sheets for high-temperature reactions. Part II. J. Phys. Chem. Ref. Data 20, 1211. doi:10.1063/1.555901
Cremer, M. A., Montgomery, C. J., Wang, D. H., Heap, M. P., and Chen, J. Y. (2000). Development and implementation of reduced chemistry for computional fluid dynamics modeling of selective non-catalytic reduction. Proc. Combust. Inst. 28, 2427–2434. doi:10.1016/S0082-0784(00)80656-6
Cuoci, A., Frassoldati, A., Faravelli, T., and Ranzi, E. (2015). OpenSMOKE++: an object-oriented framework for the numerical modeling of reactive systems with detailed kinetic mechanisms. Comput. Phys. Commun. 192, 237–264. doi:10.1016/j.cpc.2015.02.014
Dally, B. B., Riesmeier, E., and Peters, N. (2004). Effect of fuel mixture on moderate and intense low oxygen dilution combustion. Combust. Flame 137, 418–431. doi:10.1016/j.combustflame.2004.02.011
Davidson, D. F., Kohse-Höinghaus, K., Chang, A. Y., and Hanson, R. K. (1990). A pyrolysis mechanism for ammonia. Int. J. Chem. Kinet. 22, 513–535.
Duwig, C., and Iudiciani, P. (2014). Large eddy simulation of turbulent combustion in a stagnation point reverse flow combustor using detailed chemistry. Fuel 123, 256–273. doi:10.1016/j.fuel.2014.01.072
Evans, A., Strezov, V., and Evans, T. J. (2012). Assessment of utility energy storage options for increased renewable energy penetration. Renew. Sustain. Energy Rev. 16, 4141–4147. doi:10.1016/j.rser.2012.03.048
Ferrarotti, M., Fürst, M., Cresci, E., de Paepe, W., and Parente, A. (2018). Key modeling aspects in the simulation of a quasi-industrial 20 kW moderate or intense low-oxygen dilution combustion chamber. Energy & Fuels 32, 10228–10241. doi:10.1021/acs.energyfuels.8b01064
Ferrarotti, M., Li, Z., and Parente, A. (2019). On the role of mixing models in the simulation of MILD combustion using finite-rate chemistry combustion models. Proc. Combust. Inst. 37, 4531–4538. doi:10.1016/j.proci.2018.07.043
Florian, A. (1992). An efficient sampling scheme: updated Latin Hypercube Sampling. Probabilist. Eng. Mech. 7, 123–130. doi:10.1016/0266-8920(92)90015-A
Frigo, S., and Gentili, R. (2013). Analysis of the behaviour of a 4-stroke Si engine fuelled with ammonia and hydrogen. Int. J. Hydrogen Energy 38, 1607–1615. doi:10.1016/j.ijhydene.2012.10.114
Glarborg, P., Miller, J. A., Ruscic, B., and Klippenstein, S. J. (2018). Modeling nitrogen chemistry in combustion. Prog. Energy Combust. Sci. 67, 31–68. doi:10.1016/j.pecs.2018.01.002
Green, R. M., and Miller, J. A. (1981). The measurement of relative concentration profiles of NH2 using laser absorption spectroscopy. J. Quant. Spectrosc. Radiat. Transf. 26, 313–327. doi:10.1016/0022-4073(81)90126-6
Hayakawa, A., Goto, T., Mimoto, R., Arakawa, Y., Kudo, T., and Kobayashi, H. (2015). Laminar burning velocity and Markstein length of ammonia/air premixed flames at various pressures. Fuel 159, 98–106. doi:10.1016/j.fuel.2015.06.070
Hua, W., Yong-chang, L., Ming-rui, W., and Yu-sheng, Z. (2005). Multidimensional modeling of dimethyl ether (dme) spray combustion in di diesel engine. J. Zhejiang Univ. - Sci. 6, 276–282. doi:10.1007/BF02842056
Huang, X. (2018). Measurements and model development for flameless combustion in a Lab-scale furnace. PhD thesis. Delft (Netherlands): TUDelft
Iman, R. L., and Conover, W. J. (1980). Small sample sensitivity analysis techniques for computer models, with an application to risk assessment. Commun. Stat. Theor. Methods 9, 1749–1842. doi:10.1080/03610928008827996
Katsuki, M.,, and Hasegawa, T. (1998). The science and technology of combustion in highly preheated air. Symposium (International) on Combust. 27, 3135–3146. doi:10.1016/S0082-0784(98)80176-8
Kobayashi, H., Hayakawa, A., Somarathne, K., and Okafor, E. (2018). Science and technology of ammonia combustion. Proc. Combust. Inst. 37, 109–133. doi:10.1016/j.proci.2018.09.029
Li, Z., Evans, M. J., Ye, J., Medwell, P. R., and Parente, A. (2021). Numerical and experimental investigation of turbulent n-heptane jet-in-hot-coflow flames. Fuel 283, 118748. doi:10.1016/j.fuel.2020.118748
Maclean, D. I.,, and Wagner, H. G. (1967). The structure of the reaction zones of ammonia-oxygen and hydrazine-decomposition flames. Symposium (International) on Combust. 11, 871–878. doi:10.1016/S0082-0784(67)80213-3
Medwell, P. R., Evans, M. J., Chan, Q. N., and Katta, V. R. (2016). Laminar flame calculations for analyzing trends in autoignitive jet flames in a hot and vitiated coflow. Energy and Fuels 30, 8680–8690. doi:10.1021/acs.energyfuels.6b01264
Mertens, J. D., Chang, A. Y., Hanson, R. K., and Bowman, C. T. (1991). A shock tube study of the reactions of NH with NO, O2, and O. Int. J. Chem. Kinet. 23, 173–196. doi:10.1002/kin.550230208
Miller, J. A., and Bowman, C. T. (1989). Mechanism and modeling of nitrogen chemistry in combustion. Prog. Energy Combust. Sci. 15, 287–338. doi:10.1016/0360-1285(89)90017-8
Mosca, G. (2017). Experimental and numerical study of MILD combustion. PhD thesis. Mons (Belgium): University of Mons.
Otomo, J., Koshi, M., Mitsumori, T., Iwasaki, H., and Yamada, K. (2018). Chemical kinetic modeling of ammonia oxidation with improved reaction mechanism for ammonia/air and ammonia/hydrogen/air combustion. Int. J. Hydrogen Energy 43, 3004–3014. doi:10.1016/j.ijhydene.2017.12.066
Özdemir, I. B., and Peters, N. (2001). Characteristics of the reaction zone in a combustor operating at mild combustion. Exp. Fluid 30, 683–695. doi:10.1007/s003480000248
Philibert, C. (2017). Producing ammonia and fertilizers: new opportunities from renewables. IEA Renewable Energy Division Report, 1–6.
Plessing, T., Peters, N., and Wünning, J. G. (1998). Laseroptical investigation of highly preheated combustion with strong exhaust gas recirculation. Symposium (International) on Combust. 27, 3197–3204. doi:10.1016/S0082-0784(98)80183-5
Pochet, M., Truedsson, I., Foucher, F., Jeanmart, H., and Contino, F. (2017). Ammonia-hydrogen blends in homogeneous-charge compression-ignition engine. SAE Technical Papers, Technical Paper 2017-24-0087.
Rocha, C. R., Bai, X. S., and Costa, M. (2020). Combustion and emission characteristics of ammonia under conditions relevant to modern gas turbines. Combust. Sci. Technol. doi:10.1080/00102202.2020.1748018
Sabelnikov, V., and Fureby, C. (2013). Extended les-pasr model for simulation of turbulent combustion. Progress in Propulsion Physics 4, 539–568. doi:10.1051/eucass/201304539
Sabia, P., Sorrentino, G., Bozza, P., Ceriello, G., Ragucci, R., and De Joannon, M. (2019). Fuel and thermal load flexibility of a MILD burner. Proc. Combust. Inst. 37, 4547–4554. doi:10.1016/j.proci.2018.09.003
Shrestha, K. P., Seidel, L., Zeuch, T., and Mauss, F. (2018). Detailed kinetic mechanism for the oxidation of ammonia including the formation and reduction of nitrogen oxides. Energy and Fuels 32, 10202–10217. doi:10.1021/acs.energyfuels.8b01056
Sidey, J., Mastorakos, E., and Gordon, R. L. (2014). Simulations of autoignition and laminar premixed flames in methane/air mixtures diluted with hot products. Combust. Sci. Technol. 186, 453–465. doi:10.1080/00102202.2014.883217
Somarathne, K. D. K. A., Hatakeyama, S., Hayakawa, A., and Kobayashi, H. (2017). Numerical study of a low emission gas turbine like combustor for turbulent ammonia/air premixed swirl flames with a secondary air injection at high pressure. Int. J. Hydrogen Energy 42, 27388–27399. doi:10.1016/j.ijhydene.2017.09.089
Song, S., Hanson, R. K., Bowman, C. T., and Golden, D. M. (2001). Shock tube determination of the overall rate of NH2 + NO ? products in the thermal De-NOx temperature window. Int. J. Chem. Kinet. 33, 715–721. doi:10.1002/kin.1068
Sorrentino, G., Sabia, P., Bozza, P., Ragucci, R., and de Joannon, M. (2019). Low-NOx conversion of pure ammonia in a cyclonic burner under locally diluted and preheated conditions. Appl. Energy 254, 1–7. doi:10.1016/j.apenergy.2019.113676
Stagni, A., Cavallotti, C., Arunthanayothin, S., Song, Y., Herbinet, O., Battin-Leclerc, F., et al. (2020). An experimental, theoretical and kinetic-modeling study of the gas-phase oxidation of ammonia. React. Chem. Eng. 5, 696–711. doi:10.1039/c9re00429g
Sumathi, R., Sengupta, D., and Nguyen, M. T. (2000). Theoretical study of the H 2 + NO and related reactions of [ H 2 NO ]. Isomers 5639, 3175–3183. doi:10.1021/jp9804953
Szego, G., Dally, B. B., and Nathan, G. (2008). Scaling of NOx emissions from a laboratory-scale mild combustion furnace. Combust. Flame 154, 281–295. doi:10.1016/j.combustflame.2008.02.001
Takizawa, K., Takahashi, A., Tokuhashi, K., Kondo, S., and Sekiya, A. (2008). Burning velocity measurements of nitrogen-containing compounds. J. Hazard Mater. 155, 144–153. doi:10.1016/j.jhazmat.2007.11.089
UNFCCC (2015). United-Nations framework convention on climate change, adoption of the paris agreement. Tech/Rep.
Valera-Medina, A., Gutesa, M., Xiao, H., Pugh, D., Giles, A., Goktepe, B., et al. (2019). Premixed ammonia/hydrogen swirl combustion under rich fuel conditions for gas turbines operation. Int. J. Hydrogen Energy 44, 8615–8626. doi:10.1016/j.ijhydene.2019.02.041
Valera-Medina, A., Marsh, R., Runyon, J., Pugh, D., Beasley, P., Hughes, T., et al. (2017a). Ammonia–methane combustion in tangential swirl burners for gas turbine power generation. Appl. Energy 185, 1362–1371. doi:10.1016/j.apenergy.2016.02.073
Valera-Medina, A., Pugh, D. G., Marsh, P., Bulat, G., and Bowen, P. (2017b). Preliminary study on lean premixed combustion of ammonia-hydrogen for swirling gas turbine combustors. Int. J. Hydrogen Energy 42, 24495–24503. doi:10.1016/j.ijhydene.2017.08.028
Veríssimo, A. S., Rocha, A. M., and Costa, M. (2013). Experimental study on the influence of the thermal input on the reaction zone under flameless oxidation conditions. Fuel Process. Technol. 106, 423–428. doi:10.1016/j.fuproc.2012.09.008
Veríssimo, A. S., Rocha, A. M., and Costa, M. (2011). Operational, combustion, and emission characteristics of a small-scale combustor. Energy and Fuels 25, 2469–2480. doi:10.1021/ef200258t
Wünning, J. A., and Wünning, J. G. (1997). Flameless oxidation to reduce thermal no-formation. Prog. Energy Combust. Sci. 23, 81–94. doi:10.1016/S0360-1285(97)00006-3
Keywords: uncertainty propagation, ammonia, hydrogen, flameless, partially stirred reactor
Citation: Ferrarotti M, Bertolino A, Amaduzzi R and Parente A (2020) On the Influence of Kinetic Uncertainties on the Accuracy of Numerical Modeling of an Industrial Flameless Furnace Fired With NH3/H2 Blends: A Numerical and Experimental Study. Front. Energy Res. 8:597655. doi: 10.3389/fenrg.2020.597655
Received: 21 August 2020; Accepted: 02 November 2020;
Published: 17 December 2020.
Edited by:
Alfonso Chinnici, University of Adelaide, AustraliaReviewed by:
Mariano Martín, University of Salamanca, SpainYusuf Bicer, Hamad bin Khalifa University, Qatar
Copyright © 2020 Ferrarotti, Bertolino, Amaduzzi and Parente. This is an open-access article distributed under the terms of the Creative Commons Attribution License (CC BY). The use, distribution or reproduction in other forums is permitted, provided the original author(s) and the copyright owner(s) are credited and that the original publication in this journal is cited, in accordance with accepted academic practice. No use, distribution or reproduction is permitted which does not comply with these terms.
*Correspondence: Andrea Bertolino, QW5kcmVhLkJlcnRvbGlub0B1bGIuYmU=; A. Parente, QWxlc3NhbmRyby5QYXJlbnRlQHVsYi5iZQ==
 Marco Ferrarotti
 Andrea Bertolino
 Ruggero Amaduzzi
 Alessandro Parente