 Liangping Sun
 Leiming Li
 Bingquan Liu
- School of Economics and Management, China University of Petroleum (East China), Qingdao, China
The promotion of industrial environmental efficiency (IEE) has attracted considerable attention from scholars and policymakers. Previous studies have focused on the factors driving IEE without considering the leader-follower relationship between the two stages of IEE and have used aggregated indicators to detect the effect of urbanization on IEE. In this study, we open the “black box” of IEE and regard it as a serial system comprised of the economic development (ED) stage and the environmental governance (EG) stage. We select typical provinces belonging to the ED-oriented regions and EG-oriented regions for our analysis. We quantify IEE by using the slack-based model (SBM), decompose the effect of urbanization into four typical factors and detect the effect of the urbanization-related factors by using a tobit regression model. Next, we compare the effect of the urbanization-related factors in the different regions. The results show that overall, in 2011–2015, IEE in the different regions was low and fluctuating, and it increased in ED-oriented regions while remaining stable in EG-oriented regions. The IEE of the ED-oriented regions was always higher than that of the EG-oriented regions, with the gap increasing over time. The IEE of the two stages varied in each type of region. Urbanization-related factors had different effects on the IEE of the different stages in the two types of region, and the same factor had significantly different effects in different regions.
Introduction
Through the process of reform and openness, the industry of China is developing rapidly and is the largest contributor to the economic development of China. Figure 1 reports the energy consumption in China from 2010 to 2017. A total of 66.3% of total energy, 95% of coal, and 99% of crude oil are consumed in the industrial sectors. In addition, the amount of industrial wastewater discharge reached 18.16 billion tons in 2017, accounting for approximately 23.55% of the total wastewater discharge in China. The extensive development of industry has consumed too much energy and caused serious environmental pollution. Additionally, China is still in a stage of rapid motorization and urbanization, which indicates that it will consume more energy and its industry will cause more pollution. Therefore, it is of great importance to quantify industrial environmental efficiency (IEE) and detect the factors that drive it.
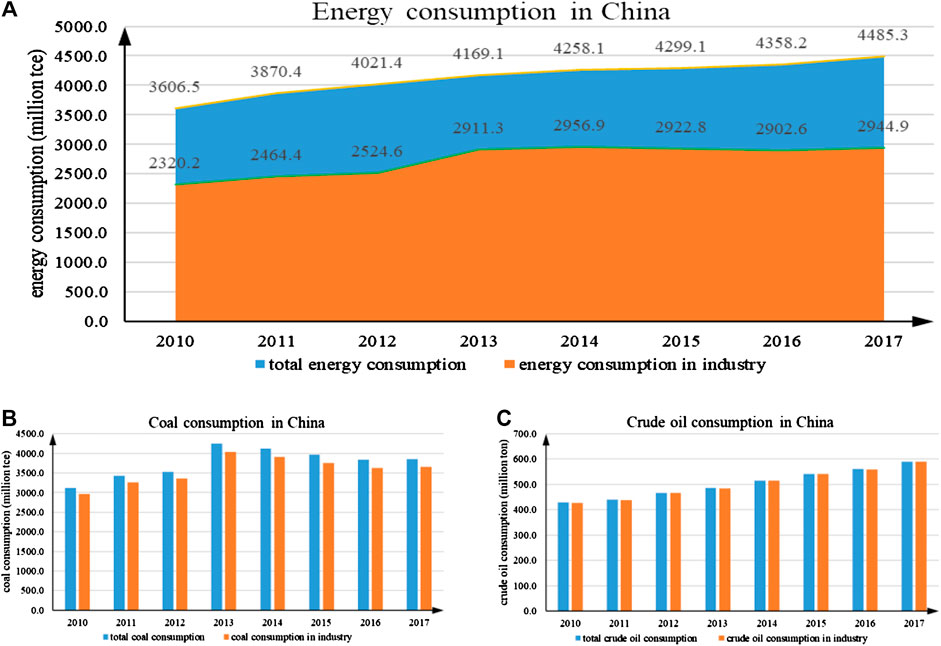
FIGURE 1. The total and main energy consumption in China.
IEE has been studied continuously by scholars in recent years. Two important issues are related to this topic: quantifying IEE scientifically and identifying the key drivers of IEE.
For the first issue, IEE is an application of environmental efficiency (EE) in industry. After the definition of EE was proposed by the World Business Council for Sustainable Development (WBCSD) in 1992, many scholars attempted to measure the environmental impact that accompanies economic development. EE was defined as the ratio of economic outputs to environmental consumption in earlier studies, which ignored other inputs for economic outputs and could only provide the EE value without determining the measures that promote EE (Aldanondo-Ochoa et al., 2014). To solve these problems, many efficiency analysis techniques have been proposed, and these approaches can be categorized into two types: parametric approaches and nonparametric approaches (Chen et al., 2017). Moreover, stochastic frontier analysis (SFA) is a typical parametric approach, and data envelopment analysis (DEA) is a typical nonparametric approach (Long et al., 2018; Chen et al., 2012). In particular, the DEA method is widely used because it does not require the specification of the functional relations between inputs and outputs of decision-making units (DMUs) (Chen et al., 2017; Cook et al., 2012; Deng et al., 2016).
The traditional DEA model always maximizes outputs and minimizes inputs and does not take environmental pollution into consideration (Feng and Wang, 2018). However, environmental pollution as an undesired output is always accompanied by the desired output. Therefore, we should maximize outputs and minimize inputs and environmental pollution at the same time when quantifying EE. There are some standard methods for dealing with undesired outputs, including regarding the undesired outputs as inputs (Li et al., 2018), changing the undesired outputs into desired outputs by using their reciprocals (Liu et al., 2019), and adjusting the model to account for environmental production technology (Fernández et al., 2018).
In addition to the radial methods mentioned above, a slack-based measurement (SBM) method was proposed by Tone (Tone, 2001), which aimed at minimizing input excesses and desired output shortfalls at the same time. As radial methods can easily lead to many efficient DMUs, the SBM method is believed to be more appropriate for addressing undesired outputs (Park et al., 2018) and has been widely used in EE assessment. For example, Zhang et al. (2019) evaluated the EE of 283 cities in China with the Super-SBM model and compared the EE performance among different regions. Xiao et al. (2018) calculated the energy-environmental efficiency of 31 sectors in China and proposed policy implications from both the microcosmic and macroscopic perspectives. Wang et al. (2019a) measured the EE of a cruise shipping company with the Super-SBM model in a study on corporate social responsibility. Zhang et al. (2016) and Na et al. (2017) performed similar studies.
Although the studies mentioned above have proposed many methods for handling undesired outputs, they still regard EE as the efficiency of environmental pollution discharge. Actually, in the process of industrial production, there are two general stages. In the first stage, raw materials, parts, and other resources are changed into products, and some environmental pollutants are generated at the same time. In the second stage, environmental protection technology, purification equipment, and R&D activities are used to reduce pollution. Therefore, IEE can be decomposed into two components: economic development efficiency and environmental governance efficiency. In this way, we can detect IEE in detail.
Furthermore, although the IEE of each region should include economic development efficiency and environmental governance efficiency, the development goals of each region are substantially different because of imbalanced development in China. Actually, the regional imbalance in development in China has always been serious and is becoming increasingly more serious. Some developing regions have vast environmental capacity and usually aim at growing the economy. However, some developed regions usually face strong calls for environmental protection and focus on environmental governance to attract talent. Therefore, there is a leader-follower relationship between the ED stage and EG stage in each region. However, this relationship has not often been considered in the literature.
For the second issue, many scholars have focused on the industrial structure, FDI, R&D, economic development level, energy structure, and environmental regulations to determine the key drivers that impact IEE (He et al., 2016; Huang and Qiuping, 2015; Li and Qi, 2014; Lyu et al., 2018; Wang et al., 2015; Wang et al., 2018a; Wang et al., 2018b; Wang et al., 2019b). The urbanization of China has grown rapidly in recent decades, and it is believed that urbanization will affect the industrial structure, energy structure, and economic development level and ultimately affect IEE (Chen et al., 2017; Li et al., 2018; Feng and Wang, 2017; Han et al., 2018; Pan et al., 2015; Sanz-Díaz et al., 2017). In this context, it is necessary to determine the effect of urbanization on IEE. Most of the existing literature uses an aggregate index to represent urbanization, e.g., the proportion of the urban population to the total population, and tests for an effect on IEE. However, there are many urbanization-related factors that have different effects on IEE (Bingquan et al., 2018). Therefore, using an aggregate index to represent urbanization can only give the combined effect on IEE and cannot detect the effect of each urbanization-related factor. What is worse, it will lead to irrational efficiency promotion plans and unreasonable urbanization development policies.
In summary, this paper contributes to the literature in two ways. 1) Due to the significantly imbalanced development of regions in China, provinces have different goals for IEE promotion. Some provinces take improving ED as their primary (i.e., leader) goal and improving EG as their secondary (i.e., follower) goal. In other provinces, the opposite is true. In contrast to the existing literature, this paper divides IEE into two stages—the ED stage and EG stage—and divides the provinces into two groups based on their observed leader-follower relationship. Then, an IEE assessment model is proposed based on the leader-follower relationships and SBM to break open the “black box” of IEE. 2) Instead of using an aggregate index to describe urbanization, this paper decomposes the effect of urbanization on IEE into four significant drivers—the population change effect, industrial structure change effect, spatial change effect, and economic growth effect—to detect the detailed effect of urbanization on IEE and provide more precise information for IEE promotion in different provinces.
The rest of the paper is organized as follows. Sector 2 describes the models and data. Sector 3 reports the results and discussions. Sector 4 concludes.
Methodology
Industrial Environmental Efficiency Assessment Model
According to the industry production process, in the ED stage, energy, materials, and industrial investment are used to generate products and produce environmental pollution. In the EG stage, environmental protection technology and equipment are used to treat the pollutants to meet the standards for discharge. Therefore, IEE can be divided into two stages, and the corresponding process is shown in Figure 2.
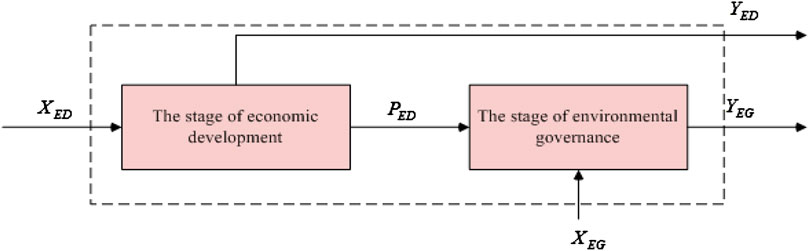
FIGURE 2. The Stages of IEE.
Suppose there are n DMUs that represent the provinces under assessment. In the ED stage,
Although each DMU includes both stages, the development goals of the provinces are different. In developing provinces that have vast environmental capacity, economic growth is the dominant goal, and these provinces are called ED-oriented regions. In developed provinces where the call for environmental protection is stronger, environmental governance is the dominant goal, and these provinces are called EG-oriented regions. In this context, we propose an IEE assessment model based on SBM and the leader-follower relationship between the ED stage and EG stage.
According to network DEA, on the one hand, for the ED-oriented regions, we should maximize the efficiency of the ED stage first and then maximize the efficiency of the EG stage under the constraint that the efficiency of the ED stage does not decrease during this second step (Liu et al., 2019). In this case, the assessment model for the performance of the ED stage is described by Eq. 1.
In Eq. 1,
Let
where
As environmental governance is a secondary goal for ED-oriented regions, the assessment model for the performance of the EG stage can be described by Eq. 3.
In Eq. 3,
Similarly, let
where
On the other hand, for EG-oriented regions, environmental governance is the dominant goal, and economic development is the secondary goal. Therefore, we should maximize the efficiency of the EG stage first and then maximize the efficiency of the ED stage under the constraint that the efficiency of the EG stage does not decrease. In this context, we maximize the performance of the EG stage using Eq. 5.
Let
where
Similarly, the performance of the ED stage of EG-oriented regions can be calculated by Eq. 7.
Let
where
Using the performance of each stage, we can define the IEE of each stage and of the whole process. According to Hu et al. (2006), the IEE of the ED stage can be defined in Eq. 9.
Accordingly, the IEE of the EG stage can be defined in Eq. 10.
Therefore, the total IEE can be defined in Eq. 11.
In this context, the characteristics of IEE can be analyzed.
(1) If
(2) If
(3) If and only if
Regression Analysis of Industrial Environmental Efficiency Determinants
To detect the determinants of IEE in each stage and the whole process, a multiple linear regression model should be constructed. As the values of
where
Variables and Data
(1) Inputs and outputs of the IEE assessment model
Based on some existing studies (Huang and Qiuping, 2015; Chen et al., 2017; Feng et al., 2018; Wang et al., 2018), this paper takes industrial investment, industrial employment, and energy consumption as inputs in the ED stage and industrial GDP as the desired output and industrial wastewater discharge, industrial solid waste discharge, and industrial waste gas (“three wastes”) as the undesired outputs. In the EG stage, this paper takes the three wastes from the ED stage, investment in treatment for the three wastes as inputs, and takes the actual level of treatment of the three wastes as output. The indicators are listed in Table 1.
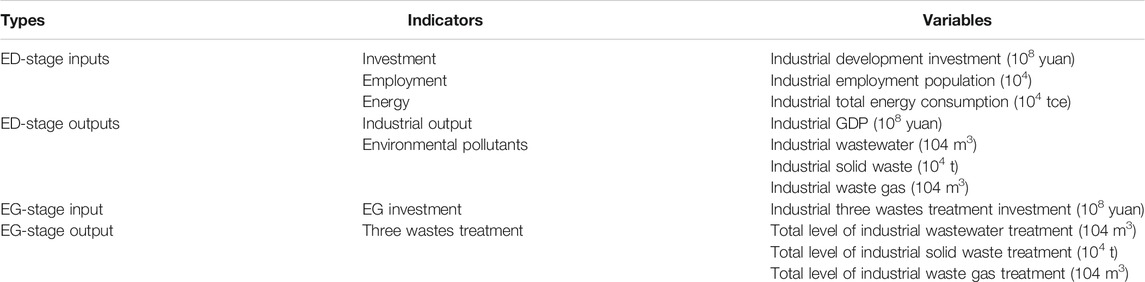
TABLE 1. Indicators for the IEE assessment model.
Determinants of Industrial Environmental Efficiency
The process of urbanization is expected to affect IEE significantly. Specifically, the main effects are listed as follows.
①It is obvious that the population distribution will change with population migration from rural areas to cities. As a result, population density will increase in urban areas and will provide a large supply of labor for industry development. Moreover, the increase in population density will affect environmental capacity and will finally affect IEE. Therefore, we use urban population density (upd) to reflect the effect of urbanization due to population change on IEE.
②The development of urbanization requires many industrial products, which promotes the development of the secondary industry. As a result, the proportion of the secondary industry to the national economy will change, especially the manufacturing sector, which will grow rapidly. Meanwhile, along with the development of the manufacturing sector, the consumption of energy and water will increase sharply. Therefore, we use the proportion of the manufacturing sector (pms) to the national economy to reflect the effect of urbanization due to changes in the industrial structure on IEE.
③Obviously, the size of urban areas will increase along with the development of urbanization, especially in developing regions. However, sprawl from the built-up areas in urban cities will decrease the space available for industry development. Additionally, disorganized plans for urbanization have caused a seriously disordered spatial layout, which reduces the ability of the urban ecosystem to self-adjust, and this disordered layout has caused serious environmental problems. Therefore, we use the proportion of the built-up area to the total area of the urban city (pbu) to reflect the spatial change effect of urbanization on IEE.
④The income of residents is expected to increase with migration from rural areas to urban areas. As a result, the disposable income of residents will grow. The growth of the income of residents will generate new demand for industrial products, which will promote the development of industry. The environmental awareness of residents will increase when disposable income increases, and the call for environmental governance will become stronger, which will affect IEE. Therefore, we use per-capita disposable income (pcdi) to reflect the effect of urbanization due to changes in the income of residents on IEE.
In addition, to control for the effect of other important determinants of IEE, we use per-capita GDP (rgdp) to reflect the effect of economic growth, total imports and exports (tie) to reflect the effect of international trade, and research expenditure (res) to reflect the effect of research investment. These variables are listed in Table 2.
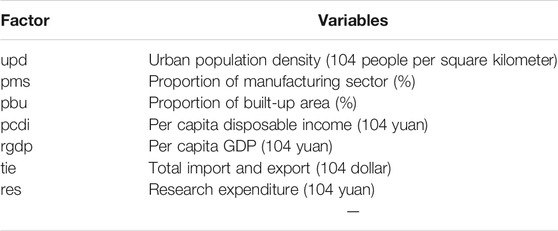
TABLE 2. List of variables for the analysis of the factors driving industrial environmental efficiency.
The data listed in Table 1 and Table 2 are cited from the China Statistical Yearbook (2012–2016) and the China Environmental Statistics Yearbook (2012–2016).
Results and Discussion
Analysis of Industrial Environmental Efficiency in Different Regions
Overall Analysis of Industrial Environmental Efficiency in Different Regions
We select 16 typical provinces and divide these provinces into two groups: EG-oriented regions and ED-oriented regions, according to their development stage in 2011–2015 and in line with previous studies (Liu et al., 2019; Wang et al., 2018; Wang et al., 2015). The provinces selected are listed in Table 3.

TABLE 3. Provinces in different regions.
Table 4 reports the EE of ED-oriented regions during different stages. Table 5 reports the EE of EG-oriented regions during different stages.
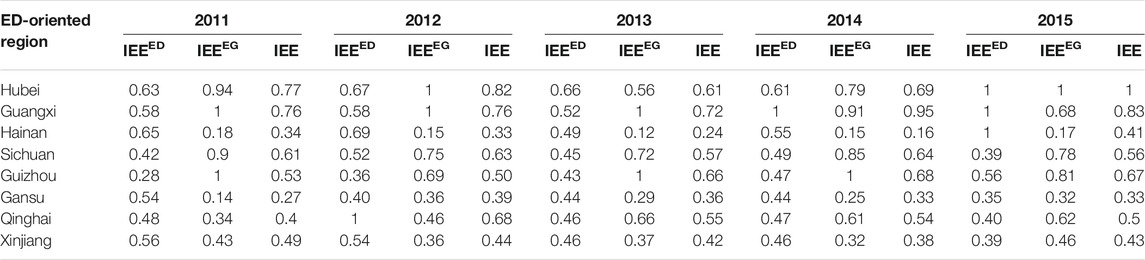
TABLE 4. IEE of ED-oriented provinces.
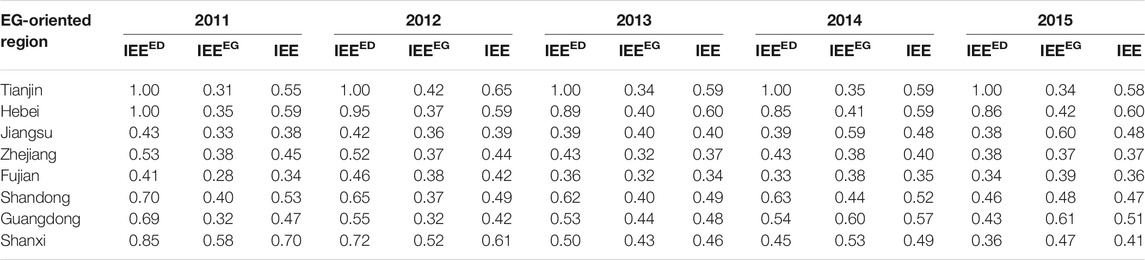
TABLE 5. IEE of EG-oriented provinces.
Overall, the IEE in the different regions was low, especially in the EG-oriented regions. Figure 3 presents the changes in the average IEE in different regions during 2011–2015. As shown in Figure 3, the IEE of both types of regions is low and fluctuates during the observation period. Overall, the IEE of the ED-oriented regions increased, while the IEE of the EG-oriented regions remained stable during 2011–2015. IEEED increased sharply in ED-oriented regions, while it decreased sharply in EG-oriented regions. IEEEG clearly increased in EG-oriented regions, especially beginning in 2013, while it slowly decreased in ED-oriented regions. In this context, the IEE of ED-oriented regions is significantly dominated by IEEED, while the IEE of EG-oriented regions is significantly dominated by IEEEG. It is interesting that for ED-oriented regions, IEEED increased sharply beginning in 2013 and became larger than IEEEG in 2015, indicating the rapid development of industry; meanwhile, IEEEG slowly decreased due to the increase in environmental pollution. Therefore, it is important for ED-oriented regions to introduce green industries and reduce pollution discharge. For EG-oriented regions, the sharp decrease in IEEED may be because of industrial transfer, which caused a great decline in industrial output.
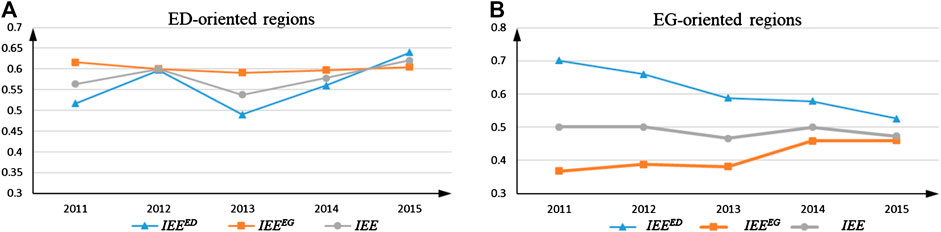
FIGURE 3. The change of IEE, IEEED and IEEEG in different regions.
Comparative Analysis of ED-Oriented Regions and EG-Oriented Regions
To explore the leader-follower relationship in the different regions, this paper further conducts a comparative analysis of the efficiency of the regions in the two stages, as shown in Figure 4. It is obvious that the IEE of the ED-oriented regions is always higher than that of the EG-oriented regions during the observation period, and the gap is increasing. This may be due to their different development goals. For ED-oriented regions, economic development is the leader goal, and it is believed that developing industry is particularly helpful for regional economic growth. Meanwhile, for EG-oriented regions, which have experienced rapid industry development and have a better economic base, environmental governance is the leader goal, and many industrial enterprises are removed, especially heavily polluting enterprises. Therefore, the gap may become increasingly larger in the next few years.
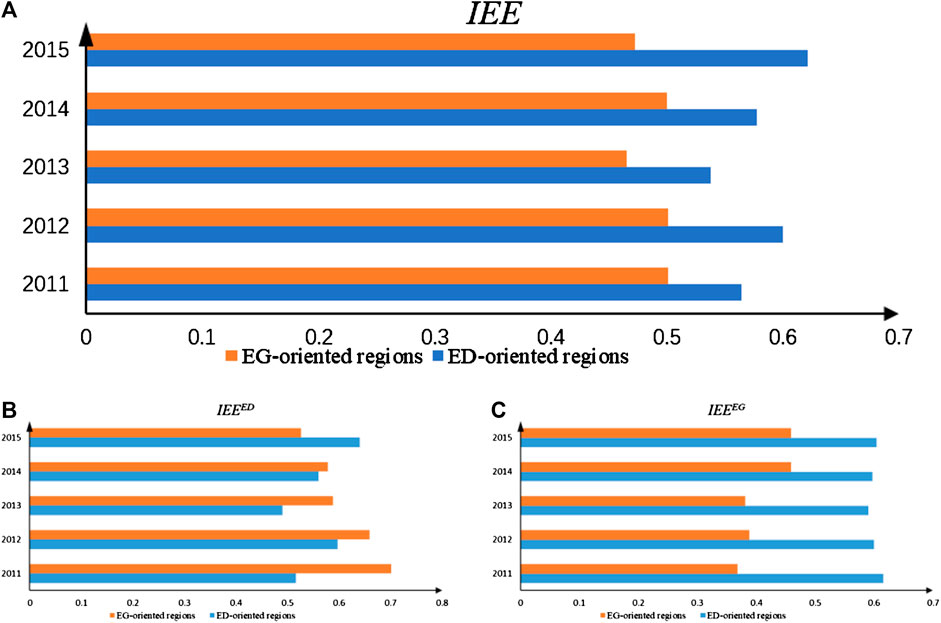
FIGURE 4. The comparison of IEE, IEEED and IEEEG in different regions.
It is obvious that the IEEED of ED-oriented regions gradually caught up with that of EG-oriented regions from 2011 to 2014 and exceeded it in 2015. It is believed that the IEEED of ED-oriented regions will increase with the development of industry. Meanwhile, the gap in IEEEG between ED-oriented regions and EG-oriented regions decreased in the observation period due to the rapid increase in IEEEG in EG-oriented regions. Hopefully the IEE in the environmental governance stage will improve its performance in the EG-oriented regions.
Analysis of the Determinants
Using a tobit panel regression analysis model, the effects of various factors on IEE, IEEED, and IEEEG are detected, and the results are shown in Table 6.
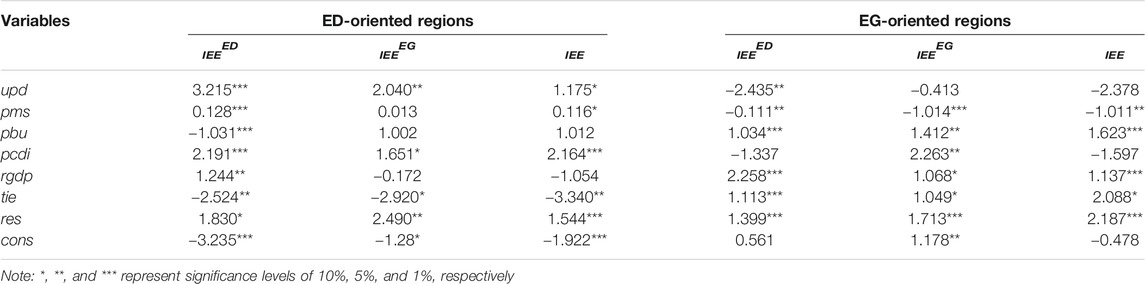
TABLE 6. Regression results for factors impacting IEE.
According to Table 6, the determinants have significantly different effects on IEE, IEEED, and IEEEG, and the same determinant even has different effects on the IEE, IEEED, and IEEEG of different regions, which is especially the case for the urbanization-related determinants. To study the different effects of the same determinant on the IEE, IEEED, and IEEEG of different regions, we conduct a comparative analysis between the different stages and the different regions.
(1) Comparative analysis of the effect of population change due to urbanization
Obviously, the change in urban population density has a significant effect on the IEE, IEEED, and IEEEG of ED-oriented regions. Specifically, an increase in urban population density has a significantly positive effect on the IEE (significant at the 10% level), IEEED (significant at the 1% level), and IEEEG (significant at the 5% level) of ED-oriented regions, indicating that as urbanization develops, an increasing number of people move into cities and provide a large supply of competent industrial workers for each sector of industry, thus promoting the economic growth of industry. The same is true for the EG stage in ED-oriented regions. An increase in population provides many sanitation workers and service staff for environmental governance, thus increasing the amount of pollutants treated.
Interestingly, the change in urban population density only has a significant effect on IEEED (significant at the 5% level) and has no significant effect on the IEEEG and IEE of EG-oriented regions. In particular, it is negatively related to IEEED (significant at the 5% level), indicating that an increase in population density decreases the IEE of the ED stage in EG-oriented regions. This may be because most of the EG-oriented regions are developed provinces that have experienced rapid industrial development, and many high-pollution and labor-intensive sectors have been transferred to developing regions. Therefore, an increase in population density cannot increase the output of industry. Instead, too many people flooding into cites decreases the environmental carrying capacity and capacity for environmental self-repair of the region, thus decreasing IEEEG.
(2) Comparative analysis of the effect of industrial structure change
A change in industrial structure has significantly different effects on IEE in both types of regions. For ED-oriented regions, it is positively related to IEEED (significant at the 1% level) and IEE (significant at the 10% level), while it is positively related to IEEEG but is not significant. This indicates that a change in industrial structure is helpful for increasing IEE, especially IEEED and IEE, by increasing the proportion of industry to the national economy. However, it should be noted that increasing the proportion of industry may increase the IEEED and IEE in the short term by increasing industrial output for ED-oriented regions because of their excellent environmental carrying capacity. However, IEE will decrease with the increase in industrial pollution. Therefore, it is important to introduce environmentally friendly industries into ED-oriented regions.
For EG-oriented regions, the change in industrial structure is negatively related to IEEED (significant at the 5% level), IEEEG (significant at the 1% level), and IEE (significant at the 5% level), indicating that an increase in the proportion of industry to the national economy will decrease IEE not only in the ED stage but also in the EG stage. This may be because the ecological system is fragile after years of development, and the cost of environmental governance is very high. Therefore, it will be helpful for EG-oriented regions to transfer some sectors of industry to other regions and support the development of the service industry.
(3) Comparative analysis of the effect of urban spatial structure change
In ED-oriented regions, the change in urban spatial structure is negatively related to IEEED (significant at the 1% level), while no significant correlation was observed with IEEEG or IEE. This indicates that the IEE of the ED stage decreased with an increase in built-up areas in cities. This may be because the increase in built-up areas was mainly due to real estate development, which occupied the development space that would otherwise have been used by industry. Meanwhile, the blind expansion of urban space has also led to incomplete infrastructure construction and imperfect industrial layouts, which decrease IEEED. In this context, the rational planning of urban layout and the reservation of development space for industry will be conducive to increasing industry EE for ED-oriented regions.
However, the contrary is true for EG-oriented regions. The change in urban spatial structure is positively related to IEEED (significant at the 1% level), IEEEG (significant at the 5% level), and IEE (significant at the 1% level). This means that the IEE of each stage and the overall efficiency increased with the increase in built-up areas in cities. This is because the urbanization level in EG-oriented regions is high, and there is not much space for industry development or environmental governance. Therefore, an increase in urban area provides space for industry development, especially for emerging industrial sectors, which are high value-added and low-pollution sectors. In addition, the increase in urban area provides space for industrial environmental governance, which improves the capacity for environmental governance in the region.
(4) Comparative analysis of the effect of a change in the income of residents
Notably, an increase in the income of residents increased the industry EE of ED-oriented regions. As shown in Table 6, the disposable income of residents is positively related to IEEED (significant at the 1% level), IEEEG (significant at the 10% level), and IEE (significant at the 5% level). This may be because increasingly more people moved to cities because of the increase in income for residents that occurred along with the development of urbanization, and this population increase then provided a large supply of competitive industrial workers. Meanwhile, the growing population also generated a great deal of demand for industrial products, thereby increasing IEEED.
However, calls from residents for a better environment increased along with the increase in income, which forced the local government to execute rigorous policies to promote environmental quality. Therefore, industrial firms should be required to upgrade their production equipment to reduce pollution emissions and their waste treatment equipment to improve waste treatment capacity. In this context, an increase in the income of residents is positively related to IEEEG not only in ED-oriented regions but also in EG-oriented regions.
(5) Comparative analysis of the effect of control variables
Economic growth (rgdp) is positively related to the IEE of each stage in EG-oriented regions but is only positively related to the IEE of the ED stage in ED-oriented regions. This may be because the purchasing power of residents increases along with economic growth, thus generating a great deal of demand for industrial products and thereby increasing the IEE of the ED stage. Additionally, as EG-oriented regions are developed provinces, economic growth can provide many resources for environmental governance, thus increasing the IEE of the EG stage in EG-oriented regions. However, as ED-oriented regions are developing provinces, the resources allocated to environmental governance are few, causing economic growth to have no significant effect on the IEE of the EG stage in ED-oriented regions.
International trade (tie) is negatively related to the IEE of each stage in ED-oriented regions, indicating that IEE decreases along with the development of international trade in ED-oriented regions. This may be because parts manufacturing and assembly are dominant sectors in the industry of ED-oriented regions, which are typically high energy-consumption, high-pollution, and low value-added sectors. Therefore, the development of international trade increases pollution emissions and increases the pressure for environmental governance, thus decreasing IEE. However, international trade is positively related to the IEE of each stage in EG-oriented regions. This may be because research and design is the dominant sector in the industry of EG-oriented regions, which is typically low energy-consumption, low-pollution, and high value-added.
Research investment (res) is positively related to the IEE of each stage in both types of region, indicating that increasing research investment will upgrade industrial production technology, which can not only increase industrial output but also decrease environmental pollution. Moreover, increased research investment can also upgrade environmental pollution treatment technology, which improves the capacity for environmental governance in the region.
Conclusions and Policy Implications
Conclusion
This paper proposes a two-stage efficiency measurement model based on DEA and the concept of leader-follower relationships to evaluate the IEE of ED- and EG-oriented regions in China. To detect the detailed effect of urbanization on the IEE of each stage and on overall efficiency, a tobit regression model was used, as the values for the efficiency measure were truncated. The main conclusions of this paper are as follows. 1) Overall, the IEE in different regions was low in 2011–2015, especially in EG-oriented regions. Additionally, IEE increased in ED-oriented regions but remained stable in EG-oriented regions. 2) In contrast, the IEE of ED-oriented regions was always higher than that of EG-oriented regions during the observation period, and the gap increased. The IEE of the ED stage in ED-oriented regions increased, while it decreased sharply in EG-oriented regions, and the IEE of the EG stage decreased slowly in ED-oriented regions, while it obviously increased in EG-oriented regions. 3) Urbanization had different effects on the IEE of the different regions. Moreover, the same factor had significantly different effects in different regions, and the same factor even had significantly different effects on different stages in the same region.
Policy Implications
For ED-Oriented Regions
First, as population density has a significantly positive effect on the IEE of the two stages and on overall efficiency, it is important for local governments in ED-oriented regions to moderately increase population density to provide a large supply of industrial workers for industrial production and governance. Second, due to the positive effect of the industrial structure on the IEE of the ED stage and on overall efficiency, it would be helpful to transfer some low-pollution industrial sectors from EG-oriented regions or other countries to the ED-oriented regions. However, it is worth noting that improving the capacity for environmental governance in advance to match the industrial transfers will be important for ED-oriented regions. Third, blind spatial expansion has a negative effect on the IEE of the ED stage, so it is important to scientifically optimize urban layout, especially through improving the construction of infrastructure. Fourth, growth in income increases the IEE of the two stages and overall efficiency significantly; therefore, guiding residents to green consumption patterns would be conducive to simultaneously increasing the efficiency of both stages. Fifth, it is important to optimize the foreign trade structure, as foreign trade is negatively related to the IEE of the two stages and to overall efficiency. The local government should take measures to decrease the level of labor-intensive and low-end manufacturing but should encourage the export of high-end manufacturing products.
For EG-Oriented Regions
First, population density is negatively related to the IEE of the ED stage. Therefore, purposively guiding some industrial workers to ED-oriented regions or guiding industrial workers to change to other related industries may be helpful for increasing the IEE of the ED stage in EG-oriented regions. Second, the industrial structure is negatively related to the IEE of the two stages and to overall efficiency. Therefore, local governments should slow down the development of the traditional manufacturing sector to decrease the proportion of the manufacturing sector to the national economy and should implement policies to encourage the development of advanced manufacturing industries. Third, the spatial structure is positively related to the IEE of the two stages and to overall efficiency. Therefore, it moderately increases the space available for the development of industry, especially for advanced manufacturing sectors. Urban renewal will be of great importance, as there is not much vacant space in EG-oriented regions. Fourth, income growth is positively related to the IEE of the EG stage, indicating that public scrutiny plays an important role in environmental governance. Therefore, it will be of great importance to open channels for public feedback. Fifth, as international trade was positively related to the IEE of the two stages and to overall efficiency, the local governments of EG-oriented regions should encourage the development of high-tech production, which will help upgrade the industrial structure in China.
For Both Types of Regions
First, research investment can not only lead to upgrades in production technology, thus increasing industrial output and decreasing pollution, but can also improve the level of environmental governance. Therefore, local governments should encourage research institutes and industrial enterprises to increase their investments in research to break through problems in industrial production and environmental governance that have bottlenecked. Second, improving the level of economic development will increase the revenue of governments. In this case, the local governments will be capable of taking measures to encourage the development of advanced manufacturing, eliminate obsolete production technology, and support new technology for industrial production and environmental governance.
Data Availability Statement
The raw data supporting the conclusions of this article will be made available by the authors, without undue reservation.
Author Contributions
LS writes the manuscript, collects some data YL proposes the IEE assessment model and caculates the results LL revises the manuscript and improves the policy impliaction BL revises the manuscript thoroughly.
Funding
This paper was supported by the Fundamental Research Funds for the Central Universities (No. 19CX04036B).
Conflict of Interest
The authors declare that the research was conducted in the absence of any commercial or financial relationships that could be construed as a potential conflict of interest.
References
Aldanondo-Ochoa, A. M., Casasnovas-Oliva, V. L., and Arandia-Miura, A. (2014). Environmental efficiency and the impact of regulation in dryland organic vine production. Land Use Pol. 36, 275–284. doi:10.1016/j.landusepol.2013.08.010
Bingquan, L., Tian, C., Li, Y., Huihui, S., and Zhanxin, M. (2018). Research on the effects of urbanization on carbon emissions efficiency of urban agglomerations in China. J. Clean. Prod. 197, 1374–1381. doi:10.1016/j.jclepro.2018.06.295
Chen, N., Xu, L., and Chen, Z. (2017). Environmental efficiency analysis of the Yangtze River Economic Zone using super efficiency data envelopment analysis (SEDEA) and tobit models. Energy 134, 659–671. doi:10.1016/j.energy.2017.06.076
Chen, P.-C., Chang, C.-C., Yu, M.-M., and Hsu, S.-H. (2012). Performance measurement for incineration plants using multi-activity network data envelopment analysis: the case of Taiwan. J. Environ. Manag. 93, 95–103. doi:10.1016/j.jenvman.2011.08.011
Chen, Y., Han, Y., and Zhu, Q. (2017). Energy and environmental efficiency evaluation based on a novel data envelopment analysis: an application in petrochemical industries. Appl. Therm. Eng. 119, 156–164. doi:10.1016/j.applthermaleng.2017.03.051
Cook, W. D., Harrison, J., Rouse, P., and Zhu, J. (2012). Relative efficiency measurement: the problem of a missing output in a subset of decision making units. Eur. J. Oper. Res. 220, 79–84. doi:10.1016/j.ejor.2012.01.022
Deng, G., Li, L., and Song, Y. (2016). Provincial water use efficiency measurement and factor analysis in China: based on SBM-DEA model. Ecol. Indicat. 69, 12–18. doi:10.1016/j.ecolind.2016.03.052
Feng, C., Huang, J.-B., and Wang, M. (2018). Analysis of green total-factor productivity in China's regional metal industry: a meta-frontier approach. Resour. Pol. 58, 219–229. doi:10.1016/j.resourpol.2018.05.008
Feng, C., and Wang, M. (2018). Analysis of energy efficiency in China's transportation sector. Renew. Sustain. Energy Rev. 94, 565–575. doi:10.1016/j.rser.2018.06.037
Feng, C., and Wang, M. (2017). The economy-wide energy efficiency in China's regional building industry. Energy 141, 1869–1879. doi:10.1016/j.energy.2017.11.114
Fernández, D., Pozo, C., Folgado, R., Jiménez, L., and Guillén-Gosálbez, G. (2018). Productivity and energy efficiency assessment of existing industrial gases facilities via data envelopment analysis and the Malmquist index. Appl. Energy. 212, 1563–1577. doi:10.1016/j.apenergy.2017.12.008
Han, L., Han, B., Shi, X., Su, B., Lv, X., and Lei, X. (2018). Energy efficiency convergence across countries in the context of China's Belt and Road initiative. Appl. Energy. 213, 112–122. doi:10.1016/j.apenergy.2018.01.030
He, F., Dongdong, M., and Zhu, L. (2016). Measurement and factors of environmental technology efficiency in China under the constraint of haze. R&D Management. 28, 34–43. doi:10.13581/j.cnki.rdm.20160906.004
Hu, J.-L., Wang, S.-C., and Yeh, F.-Y. (2006). Total-factor water efficiency of regions in China. Resour. Pol. 31, 217–230. doi:10.1016/j.resourpol.2007.02.001
Huang, Y., and Qiuping, S. (2015). Research on environmental efficiency and environmental total factor productivity in China's regional economies. China Population,Resources and Environment. 25, 25–34. doi:10.3969/j.issn.1002-2104.2015.12.004
Li, J., Huang, X., Kwan, M.-P., Yang, H., and Chuai, X. (2018). The effect of urbanization on carbon dioxide emissions efficiency in the Yangtze River Delta, China. J. Clean. Prod. 188, 38–48. doi:10.1016/j.jclepro.2018.03.198
Li, M., and Wang, Q. (2014). International environmental efficiency differences and their determinants. Energy 78, 411–420. doi:10.1016/j.energy.2014.10.026
Liu, B., Li, Y., Hou, R., and Wang, H. (2019). Does urbanization improve industrial water consumption efficiency. Sustainability 11, 1–11. doi:10.3390/su11061787
Long, X., Chen, B., and Park, B. (2018). Effect of 2008's Beijing Olympic Games on environmental efficiency of 268 China's cities. J. Clean. Prod. 172, 1423–1432. doi:10.1016/j.jclepro.2017.10.209
Lyu, K., Bian, Y., and Yu, A. (2018). Environmental efficiency evaluation of industrial sector in China by incorporating learning effects. J. Clean. Prod. 172, 2464–2474. doi:10.1016/j.jclepro.2017.11.163
Na, J.-H., Choi, A.-Y., Ji, J., and Zhang, D. (2017). Environmental efficiency analysis of Chinese container ports with CO 2 emissions: an inseparable input-output SBM model. J. Transport Geogr. 65, 13–24. doi:10.1016/j.jtrangeo.2017.10.001
Pan, X., Liu, Q., and Peng, X. (2015). Spatial club convergence of regional energy efficiency in China. Ecol. Indicat. 51, 25–30. doi:10.1016/j.ecolind.2014.10.026
Park, Y. S., Lim, S. H., Egilmez, G., and Szmerekovsky, J. (2018). Environmental efficiency assessment of U.S. transport sector: a slack-based data envelopment analysis approach. Transport. Res. Transport Environ. 61, 152–164. doi:10.1016/j.trd.2016.09.009
Sanz-Díaz, M. T., Velasco-Morente, F., Yñiguez, R., and Díaz-Calleja, E. (2017). An analysis of Spain's global and environmental efficiency from a European Union perspective. Energy Pol. 104, 183–193. doi:10.1016/j.enpol.2017.01.030
Tone, K. (2001). A slacks-based measure of efficiency in data envelopment analysis. Eur. J. Oper. Res. 130, 498–509. doi:10.1016/s0377-2217(99)00407-5
Wang, G., Li, K. X., and Xiao, Y. (2019a). Measuring marine environmental efficiency of a cruise shipping company considering corporate social responsibility. Mar. Pol. 99, 140–147. doi:10.1016/j.marpol.2018.10.028
Wang, J., Wang, S., Li, S., Cai, Q., and Gao, S. (2019b). Evaluating the energy-environment efficiency and its determinants in Guangdong using a slack-based measure with environmental undesirable outputs and panel data model. Sci. Total Environ. 663, 878–888. doi:10.1016/j.scitotenv.2019.01.413
Wang, K., Lijuan, S., Liu, L., Du, Y., Meng, X., and Yang, B. (2018a). Study on the temporal-spatial heterogeneity and driving factors of air environmental efficiency for yangtze river economic zone. Resources and Environ.Yangtze Basin. 27, 453–462. doi:10.11870/cjlyzyyhj201803001
Wang, K., Wei, Y.-M., and Huang, Z. (2018b). Environmental efficiency and abatement efficiency measurements of China's thermal power industry: a data envelopment analysis based materials balance approach. Eur. J. Oper. Res. 269, 35–50. doi:10.1016/j.ejor.2017.04.053
Wang, Q., Zhao, Z., Shen, N., and Liu, T. (2015). Have Chinese cities achieved the win-win between environmental protection and economic development? From the perspective of environmental efficiency. Ecol. Indicat. 51, 151–158. doi:10.1016/j.ecolind.2014.07.022
Xiao, C., Wang, Z., Shi, W., Deng, L., Wei, L., Wang, Y., et al. (2018). Sectoral energy-environmental efficiency and its influencing factors in China: based on S-U-SBM model and panel regression model. J. Clean. Prod. 182, 545–552. doi:10.1016/j.jclepro.2018.02.033
Zhang, J., Zeng, W., and Shi, H. (2016). Regional environmental efficiency in China: analysis based on a regional slack-based measure with environmental undesirable outputs. Ecol. Indicat. 71, 218–228. doi:10.1016/j.ecolind.2016.04.040
Keywords: Network DEA, industrial environmental efficiency, two-stage production system, leader-follower relationship, Tobit
Citation: Sun L, Li L, Li Y and Liu B (2020) Does Urbanization Promote Regional Industrial Environmental Efficiency? A Comparison of Economic Development-Oriented Regions and Environmental Governance-Oriented Regions. Front. Energy Res. 8:589733. doi: 10.3389/fenrg.2020.589733
Received: 31 July 2020; Accepted: 22 September 2020;
Published: 22 December 2020.
Edited by:
Jing Meng, University College London, United KingdomReviewed by:
Jingui Jiang, Harbin Engineering University, ChinaXu Tang, China University of Petroleum, China
Copyright © 2020 Sun, Li, Li, and Liu. This is an open-access article distributed under the terms of the Creative Commons Attribution License (CC BY). The use, distribution or reproduction in other forums is permitted, provided the original author(s) and the copyright owner(s) are credited and that the original publication in this journal is cited, in accordance with accepted academic practice. No use, distribution or reproduction is permitted which does not comply with these terms.
*Correspondence: Bingquan Liu, bGl1YnFAdXBjLmVkdS5jbg==; Liangping Sun, amdsaXViaW5ncXVhbkAxMjYuY29t