- 1China-UK Low Carbon College, Shanghai Jiao Tong University, Shanghai, China
- 2Thermal and Environmental Engineering Institute, Tongji University, Shanghai, China
Biomass-based gasification is an attractive and promising pathway for hydrogen production. In this work, a biomass-based hydrogen production system integrated with organic Rankine cycle was designed and investigated to predict the performance of hydrogen production yield and electricity generation under various operating conditions. The modified equilibrium model presented desirable results for the produced syngas compositions compared with the experimental data. Hydrogen yields from four types of biomass (wood chips, daily manure, sorghum, and grapevine pruning wastes) were compared under the same operating condition, with wood chips exhibiting the maximum hydrogen yield of 11.59 mol/kg. The effects of gasification temperature, equivalence ratio, and steam-to-biomass ratio on the hydrogen yield and electricity generation were investigated by using the response surface method. Furthermore, the system was optimized using a genetic algorithm based on the response surface model. A preferred optimal solution with a hydrogen yield of 39.31 mol/kg and an output power of 3,558.08 kW (0.99 kW h/kg) was selected by the linear programming technique for multidimensional analysis of the preference method.
Introduction
Hydrogen is one of the promising energy sources and will be most likely to play a critical role in energy production, energy storage, and transport sector in the future (Salam et al., 2013). Currently, hydrogen is dominantly produced from fossil energy, specifically natural gas. Renewable sources such as solar and biomass can be utilized to produce hydrogen through various production pathways including electrolysis, photo-electrochemical, and thermochemical processes (Puigarnavat et al., 2010). Biomass gasification as an alternative pathway has received substantial attention for hydrogen-rich syngas and enhanced hydrogen production in the past two decades due to its high energy efficiency and low CO2 emissions (Li et al., 2001). Biomass feedstocks such as agricultural and forestry residues, dedicated energy crops, and industrial and municipal wastes are potential energy sources and suitable for hydrogen production (Salam et al., 2018).
Over the past years, many studies have been carried out to predict the optimal operating conditions and system performance based on different models of biomass gasification (Wang and Kinoshita, 1992; Gil et al., 1997; Chen et al., 2016). Modeling methods for gasification include equilibrium models (Watkinson et al., 1991), kinetic models, dynamic models for specific reactor types, and neural network models (Inayat et al., 2020). The equilibrium model is usually based on the principle of Gibbs free energy minimization. The kinetic model requires a clearly defined kinetic reaction mechanism. For more complex systems, the reaction mechanism requires extensive and detailed reaction information (Vamvuka et al., 1995). The dynamic model provides relatively complete information about the reaction mechanism and reactor configuration, while thermodynamic equilibrium calculations are independent of the gasifier type, and the model is more suitable for process design studies on the influence of the fuels and process parameters (Karmakar and Datta, 2011).
Zainal et al. (2001) established the gasification model of wood chips based on the equilibrium model and verified the reliability of the equilibrium model through experimental data. The hydrogen volume fraction (20–25%) increased with the increasing moisture content in the wood chips. Couto et al. (2015) evaluated and compared the performance of the equilibrium model based on Gibbs free energy minimization and the CFD method in semi-industrial–scale fluidized bed gasification modeling. The results showed that the established equilibrium model can effectively predict the product syngas composition using different raw materials under different operating conditions. The CFD model provided dynamic information and can estimate the composition of syngas or other operating parameters at any point in time and space. The equilibrium model based on Gibbs free energy minimization was desirable by comparing the prediction results. Arun et al. (2016) used an equilibrium model to calculate and determine the effects of the equivalence ratio (ER), moisture content (MC), and reaction temperature (RT) on corn cob gasification in the down draft gasifier. They found from the simulation results that when the equivalence ratio was greater than 0.3, the composition of hydrogen and carbon monoxide predicted by the model was close to the experimental values.
In recent years, some scholars have modified the biomass gasification equilibrium model through actual experimental data for better prediction of syngas composition. Kaewluan and Pipatmanomai (2011) measured the carbon conversion efficiency (79–87%) of wood chips during bubbling fluidized bed gasification. The carbon conversion efficiency increased with the increasing gasification temperature. Lapuerta et al. (2008) conducted experiments on different biomass wastes including grapevine pruning wastes, pinus pruning, and sawdust. They determined different carbon conversion efficiencies (50–98%) under different operating conditions. Both equivalence ratio and gasification temperature gave a positive effect on the carbon conversion efficiency. Rodriguez-Alejandro et al. (2016) also discussed adjusting the equilibrium constants of the methanation reaction and water–gas shift reaction to modify the ratio of methane and carbon monoxide in syngas production.
Since the syngas at the outlet of the gasifier contains high enthalpy, it is necessary to recover and utilize this energy to improve the system efficiency. The organic Rankine cycle, another important subsystem involved in this study, is one of the best candidates to recover waste heat from energy systems into power due to its reliability, easy maintenance, and economic feasibility (Yu et al., 2017). Behzadi et al. (2020) proposed a biomass-fired proton exchange membrane fuel cell (PEMFC) integrated with an organic Rankine cycle and thermoelectric generator using different gasification agents. The results revealed that steam as the gasification agent is more suitable in terms of the economic and environmental performance indicators. Results of multi-objective optimization indicated that the output power and total cost rate using steam as the gasification agent are 1.849 kW and 5.094 $/h, respectively. A heat recovery system was employed for power generation from a PEM fuel cell’s waste heat by Marandi et al. (2019). The proposed system which involved the parallel organic Rankine cycle for utilizing the provided heat could generate 1,353 kW power. Energy efficiency and exergy efficiency of the overall system were computed to be 58.15 and 36.64%, respectively.
As for hydrogen or hydrogen-rich syngas production from biomass gasification, most studies focused on improving the hydrogen yield and integrating the gasification process with a hydrogen PEM fuel cell or solid oxide fuel cell for downstream processing, while how to make good use of the waste heat from the processes lacks investigation. Therefore, in this work, we proposed a designed system of enhanced hydrogen production from biomass gasification with waste heat recovery for electricity generation from the organic Rankine cycle. Based on the designed system, the optimal product yields and corresponding operational conditions were analyzed and identified using a set of mathematical methods. The overall analysis was organized through the following steps. At first, the equilibrium model, which is frequently used and generally exhibited a large deviation in syngas compositions, was modified by accounting for carbon conversion efficiency and equilibrium constant correction to reflect a solid validation and prediction of the system performance. On the basis of the process model, a regression model was subsequently established and the response surface methodology was applied to predict the optimal hydrogen yield and output power from the system for multi-generation purposes. By taking advantage of the constructed regression model, the multi-objective optimization method was introduced to project the optimal state points of the system under various conditions. This application could shed light on how to improve the system design and its overall performance in terms of specific indicators.
Materials and Methods
System Description
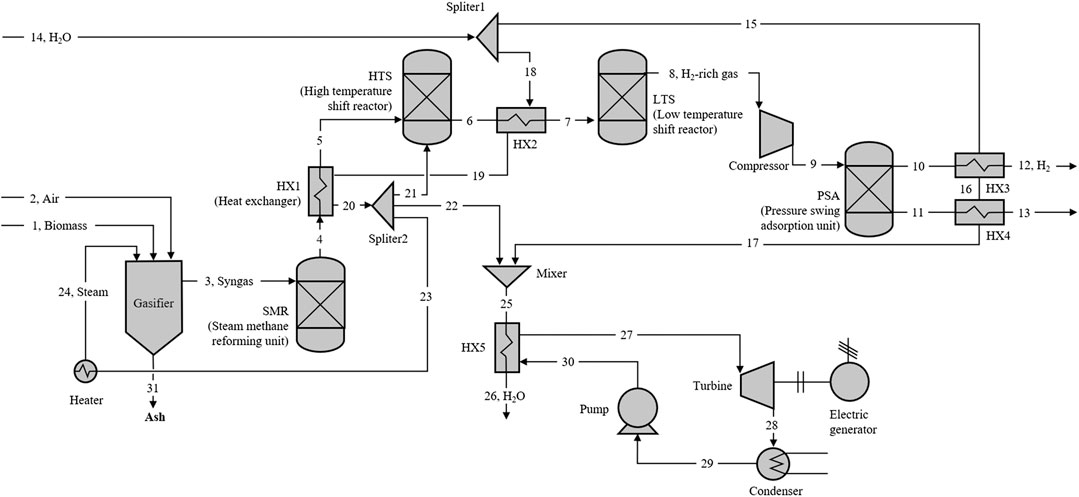
The proximate and ultimate compositions of the feedstock including wood chips, daily manure, sorghum, and grapevine (Lapuerta et al., 2008; Huang, 2009; Maglinao et al., 2015; Rodriguez-Alejandro et al., 2016) are presented in Table 1. Among the four biomass, the hydrogen contents of wood chips and sorghum are higher, while daily manure owns the lowest volatile content and hydrogen content. The simplified flow diagram of the designed system for producing hydrogen and electricity is shown in Figure 1. The system consists of five main units: the 1) biomass gasification unit, 2) steam methane reforming unit (SMR), 3) water–gas shift unit (HTS and LTS), 4) hydrogen separation unit (PSA), and 5) organic Rankine cycle (ORC). The key parameters and main assumptions associated with these modules are listed in Table 2, and the thermodynamic calculations and the system evaluation are performed using Python.
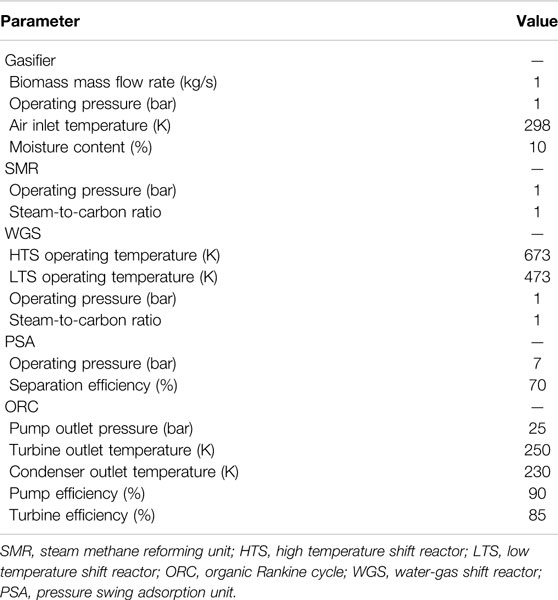
TABLE 2. Input operating parameters (Marandi et al., 2019; Behzadi et al., 2020).
Gasification Unit
Table 3 presents the most common chemical reactions (Basu, 2013; Molino et al., 2016) employed by equilibrium models. The Boudouard reaction, char reforming reaction (or water–gas reaction), water–gas shift, and methane formation are widely used as indicated in the literature, while the methane reforming reaction is also considered in some articles (Dupont et al., 2007; Jarungthammachote and Dutta, 2007; Melgar et al., 2007; Azzone et al., 2012; Couto et al., 2013; Dutta et al., 2014; La Villetta et al., 2017; Susastriawan et al., 2017; Shayan et al., 2018). In this work, the following four reactions were used to describe the gasification reaction, as shown in Eqs 1–4:
The equilibrium constants for the methane formation reaction and water–gas shift reaction are shown in Eqs 5 and 6, where Pi and Xi are the partial pressure and molar yield of the specific gas, respectively. The equilibrium constant K can be calculated using Eq. 7, where
In all cases, sulfur and nitrogen contents were ignored due to the low S and N contents in biomass. The global gasification reaction can be written as follows:
where x and y are the number of atoms of hydrogen and oxygen per number of atom of carbon in the biomass, w is the mole of moisture per mol of biomass, wsteam is the mole of steam added per mol of dry ash–free biomass, mair is the mole of oxygen per mol of biomass, and xi is the molar number of the unknown product gas. Elemental balances of carbon, oxygen, and hydrogen are illustrated in Eqs 11–13, respectively.
The gasification process is assumed to be adiabatic; thus, the heat balance can be derived according to Eq. 14 as indicated by Zainal et al. (2001):
where
where
To solve the unknown gas species concentrations, the equation set including Eqs 5 and 6 and 11–14 is closed and solved simultaneously by using the Newton–Jacobi method using Python.
Steam Methane Reforming Unit
The syngas from the gasifier is fed into the steam methane reforming (SMR) unit to enhance the hydrogen production from methane. The steam methane reforming reaction is endothermic and tends to shift to the right side at high temperatures. For simplification, the operating temperature of the SMR system is set to be consistent with the gasification temperature. No additional steam is added to the SMR unit, since there is sufficient steam in the syngas.
Water–Gas Shift Unit
A two-step water–gas shift reaction is adopted in the system to enhance the hydrogen production from carbon monoxide conversion. Two WGS reactors with one at a high temperature (HTS) of 673 K and the other at a low temperature (LTS) of 473 K are employed in the system (Moneti et al., 2016). Excess heat from the reactor is recovered through heat exchanges via the organic Rankine cycle (ORC).
Separation Unit
The pressure swing adsorption (PSA) unit is required to gain high hydrogen purity. Pressurization is achieved by a compressor before the PSA. A separation efficiency of 70% for hydrogen and an operating pressure of 7 bar are applied in the simulation by referring to the optimized values found in the literature (Carrara et al., 2010; Villarini et al., 2016).
ORC Unit
In the ORC system, the organic fluid is pumped by the pump into the ORC evaporator (HX5), and subsequently, it passes through the ORC turbine to generate power. In this study, the widely used R123 with a normal boiling temperature of 300.5 K and a triple point temperature of 166 K was selected as the organic fluid (Emadi et al., 2020). Main operating parameters are shown in Table 2 referring to Marandi et al., (2019) and Behzadi et al. (2020).
As shown in Eq. 15, energy transferred to the ORC can be determined by energy conversion in Heat Exchanger 5. The generated power from the turbine and the power consumption in the pump can be calculated using Eqs 16 and 17, respectively. Due to the energy loss during the operating process, the efficiency of turbine and pump is considered to achieve the actual outlet enthalpy (
Model Calibration and Modification
Thermodynamic equilibrium models usually ignore the conversion efficiency of carbon, but in fact, carbon cannot be completely converted during the gasification process (Eq. 10) (Marandi et al., 2019). Meanwhile, thermodynamic equilibriums such as the water–gas shift reaction (Eq. 3) and methanation reaction (Eq. 4) are usually hard to achieve in actual experiments. Therefore, correction factors based on experimental data were used to reflect the actual carbon conversion efficiency and nonequilibrium factors shown as follows:
where
Compared with the original thermodynamic equilibrium model, correcting the equilibrium constants can improve the accuracy of hydrogen yield prediction. Besides that,
where
Sensitivity Analysis and Optimization
Once establishing the full process model as aforementioned, hydrogen production and power generation can be projected according to various combinations of input operating parameters. To investigate the variation of key parameters simultaneously, the response surface methodology (RSM) was employed based on Design-Expert (DX10) version 10.0.3 software. The operating conditions of the overall system were designed by using the Box–Behnken (BBD) method, and the corresponding data were incorporated to meet the design requirements. After that, a response surface model was constructed to formulate the mathematical relationship between the target outputs such as hydrogen yields and power output and the input operational conditions, which was further illustrated by the contour plots. Therefore, the impacts of the key input parameters on the target indicator can be thoroughly explored from the sensitivity analysis.
Built upon the regression model, the multi-objective optimization of target indicators could be performed using the genetic algorithm (NSGA-Ⅱ), which transforms the problem-solving process into a mechanism similar to the crossing and mutation of chromosome genes in biological evolution. The genetic algorithm was employed in this work due to its capability of speeding up the search for optimal solutions and the set of optimal solutions constituting the Pareto front and was invoked from the Geatpy platform.
Results and Discussion
Model Validation
The syngas compositions from four biomass types including wood chips and sorghum were compared between different models (M1: the original equilibrium model, M2: the modified model considered the carbon conversion efficiency, and M3: the modified model considered the carbon conversion efficiency and nonequilibrium constants) and the experimental data of specific biomass. The main operating parameters (gasification temperature and equivalence ratio) of the simulation were kept consistent with the actual experimental conditions.
Figure 2 shows the results of wood chip gasification under the operating conditions of gasification temperatures varying from 813 to 1,058 K and ER of 0.33. The experimental data were derived from a pilot-scale fluidized bed gasifier, and air was used as the gasification agent (Rodriguez-Alejandro et al., 2016). As shown in Figure 2A, the modified model considering carbon conversion efficiency (M2) could not improve the hydrogen production and the calculated error exceeds 100%. When both the carbon conversion efficiency and equilibrium constants were modified simultaneously (M3), the error between the predicted hydrogen production value and the experimental data was reduced to 42%. Figure 2B shows a comparison of the carbon monoxide production yield on a dry basis between different levels of models. The results of M2 were relatively close to the experimental values with a calculated error of 24.4%, while the error between M3 and the experimental values was 25.1%. Figure 2C shows a comparison of the methane production yield, and the average error was reduced by 20.9% from M3 to M1. Only when the temperature was higher than about 923 K, the predicted methane yield of theoretical models was close to the experimental data.
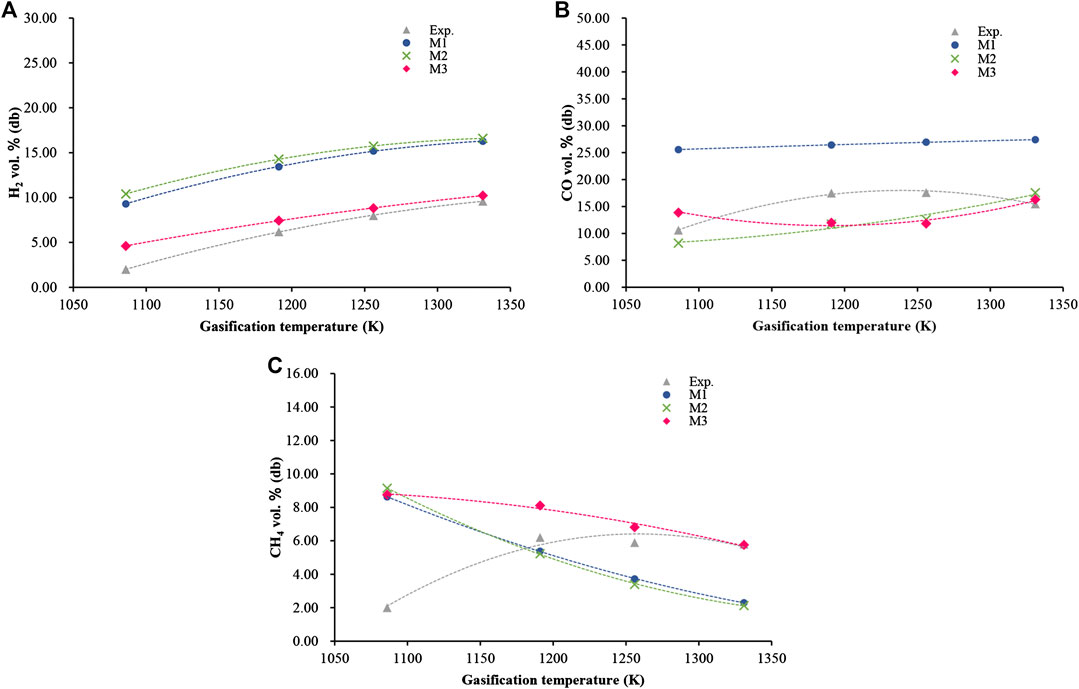
FIGURE 2. Comparison of syngas compositions between model values and experimental results for wood chips: (A) volume fraction of hydrogen; (B) volume fraction of carbon monoxide; (C) volume fraction of methane.
Figure 3 shows the results of sorghum gasification at the operating conditions of 1,013 < T < 1,073 K and ER = 0.35. The reactor was a pilot-scale fluidized bed gasifier and used air supplied by a blower as the fluidizing medium. Experimental data came from Maglinao et al. (2015). As shown in Figure 3A, the correction of the carbon conversion efficiency and the nonequilibrium constants (M3) could reduce the average error of the hydrogen production prediction values from more than 100 to 35.9% compared with the model that only modified the carbon conversion efficiency (M2). Figure 3B shows a comparison of the carbon monoxide production yield. The average error between M2 and the experimental values was 48.5%, while the error between M3 and the experimental values was 21.8%. Figure 3C shows a comparison of the methane production yield. Compared with the experimental results, M2 resulted in an average error of 42.7% and the error would decrease as the temperature increased.
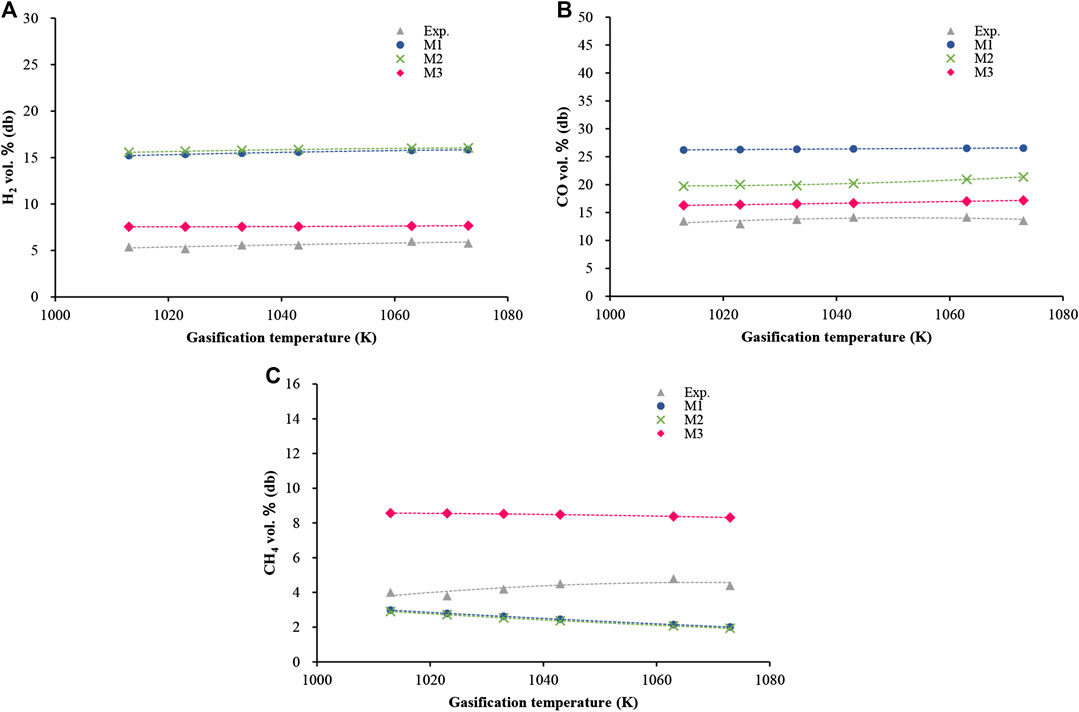
FIGURE 3. Comparison of syngas compositions between model values and experimental results for sorghum: (A) volume fraction of hydrogen; (B) volume fraction of carbon monoxide; (C) volume fraction of methane.
As shown above, the original equilibrium model (M1) overestimated the production contents of hydrogen and carbon monoxide, while the production of methane was underestimated (George et al., 2016). The errors of carbon monoxide yield prediction were reduced in M2, and M3 could effectively improve the prediction of hydrogen yield. Besides that, M3 improved the methane prediction yield of wood chips, while M2 showed higher accuracy for sorghum. RMS values gradually decreased by applying the carbon conversion efficiency and the nonequilibrium constants, as summarized in Table 4 for different biomass. In general, the modified equilibrium model is desirable for the prediction of the syngas productions of these four kinds of biomass.
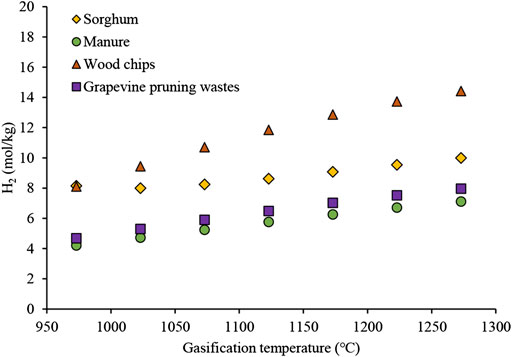
Figure 4 shows the comparison of hydrogen production yield out of the gasifier between different biomass at the same operating condition of 973 < T < 1,073 K and ER of 0.3. As shown in Table 5, the trend in the hydrogen yield was as follows: wood chip (11.59 mol/kg dry biomass) > sorghum (8.80 mol/kg dry biomass) > grapevine pruning (6.41 mol/kg dry biomass) > daily manure (5.72 mol/kg dry biomass). The differences in the yields of hydrogen might be attributed to the different biomass volatiles (Wei et al., 2014; Zhang et al., 2019) or the hydrogen contents based on the ultimate analysis.
Energy Analysis
Different fluids were investigated to select the best working fluids for the proposed system, as illustrated in Supplementary Figure S1. Output power was used as a standard to measure the performance of the fluids. The results show that R123 is the best working fluid by generating a total power of 2,268.93 kW. Results were derived by thermodynamic modeling and considering the assumptions given in Table 6.
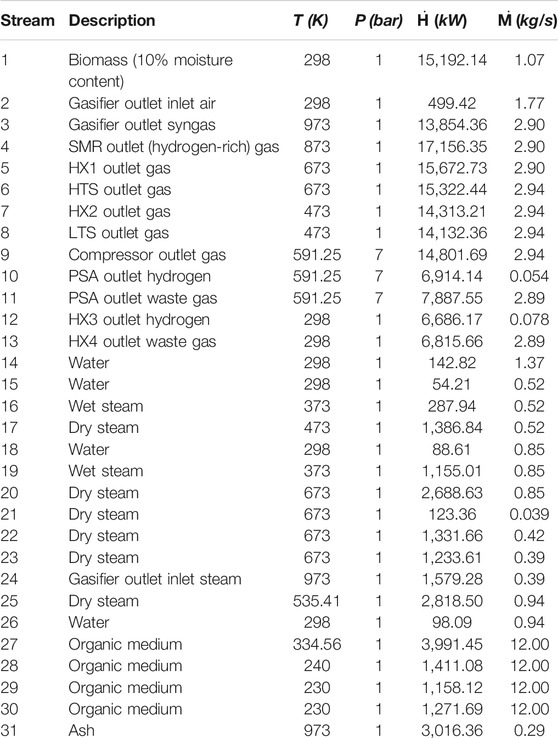
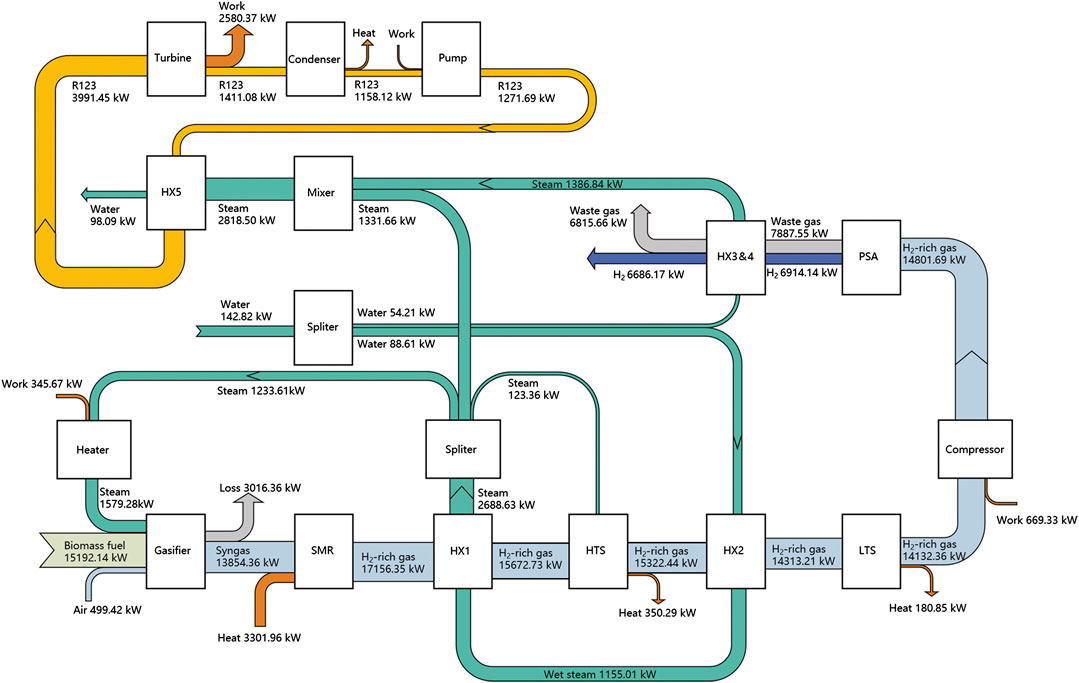
Furthermore, the detailed stream states of the system are shown in Sankey diagram of the energy flows (see Figure 5). The produced syngas heat is recovered to preheat the reaction agent and supplies heat to the ORC, which contributes to improving the energy conversion efficiency. Under the given design conditions, the largest energy loss occurs in the biomass gasification process since a certain proportion of biomass carbon does not react in the modified equilibrium model.
Effects of Operating Conditions on Hydrogen Production and Output Power
As mentioned above, wood chips produced the most maximum amount of hydrogen and showed a good degree of regression, so it was used as the biomass feedstock for further analysis. The hydrogen production (the mole of hydrogen per kilogram of biomass, mol/kg) and the output power are the evaluation parameters, while the independent variables were gasification temperature (923–1,223 K), equivalence ratio (0.1–0.6) and steam-to-biomass ratio (0.1–1.5).
The empirical prediction models of produced hydrogen yield and output power were statistically analyzed using an ANOVA (analysis of variance) as shown in Supplementary Table S3. The terms of “A, B, and C” refer to gasification temperature, equivalence ratio, and steam-to-biomass ratio, respectively. Generally speaking, a p-value of less than 0.05 indicates a significant term in the regression model (Cuevasglory et al., 2017). Both the gasification temperature (A) and ER (B) were highly correlated with the production yield of hydrogen and the system output power. Both models were considered significant since p-values were less than 0.001. R-squared values of 0.9988 and 0.9976 for the hydrogen production model and output power model are observed, respectively. Additionally, “Adeq Precision” measures the signal-to-noise ratio, and a value greater than 4 is desirable. The values of the models (45.28, 39.30) indicate adequate signals. Therefore, both models are desirable to navigate the design space.
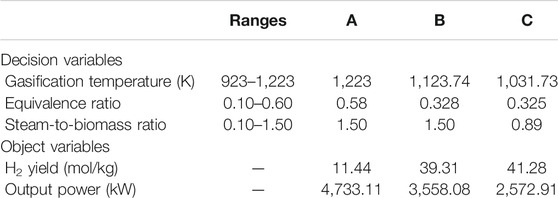
From Figure 6, it can be seen that the yield of hydrogen increased with the increasing equivalence ratio under the condition of relatively low equivalence ratio. When the equivalence ratio exceeded a certain level, the hydrogen yield turned down. An appropriate ER value could maximize the hydrogen production yield. Temperature and steam-to-biomass ratio made same impacts. From the empirical regression model, the highest hydrogen production was calculated as 41.28 (mol/kg) at conditions of 1,031.73 K, 0.325, and 0.886 (temperature, equivalence ratio, and steam-to-biomass ratio). Figure 7 shows the effects of gasification temperature, ER, and S/B on output power. The energy recovery system which utilizes the heat of the exhaust gas transfers energy to the ORC system, and the heat of gasifier outlet syngas increases with the gasification temperature and S/B. Therefore, larger operating parameters (gasification temperature and S/B) can improve the output power of the ORC system. The highest output power was calculated as 4,733.11 (kW) at conditions of 1,223 K, 0.579, and 1.5 (temperature, equivalence ratio, and steam-to-biomass ratio). Figures 6D and 7D show the actual and predicted response values of the regression model. The values were concentrated near the line, which indicated that it is a reliable regression model with small errors.
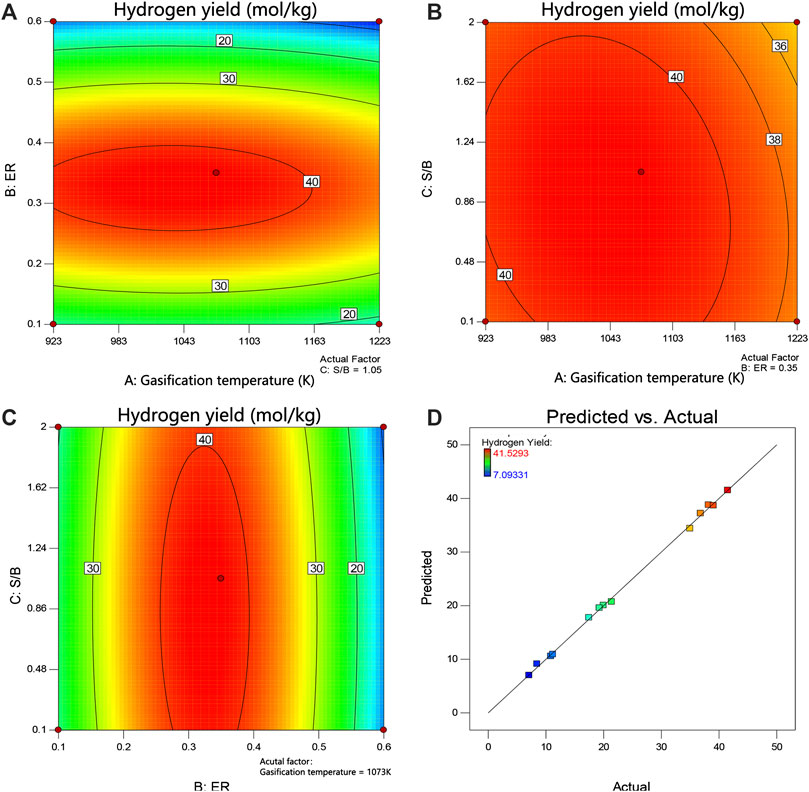
FIGURE 6. Response surface and the effect of operating conditions on H2 production from wood chips: (A) S/B: 1.05, (B) ER: 0.35, (C) temperature: 1,073 K, and (D) actual vs. predicted plot.
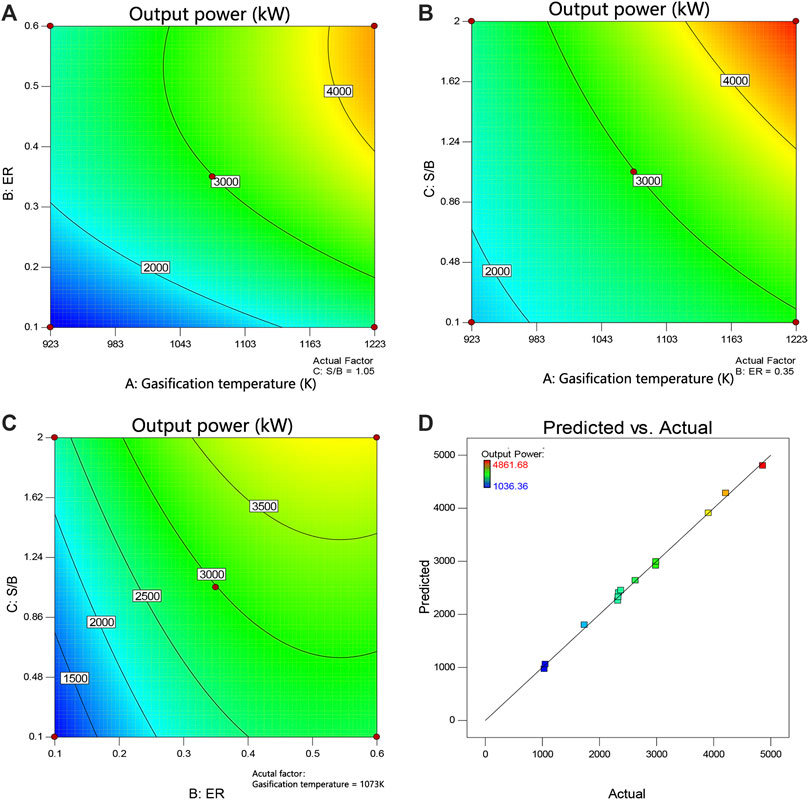
FIGURE 7. Response surface and the effect of operating conditions on power generation from wood chips: (A) S/B: 1.05, (B) ER: 0.35, (C) temperature: 1,023 K, and (D) actual vs. predicted plot.
The equation in terms of actual equation can be used as the regression model to make predictions, while the coded coefficients are useful for identifying the relative impact of the factors by comparing the factor coefficients. Actual factors should not be used to determine the relative impact of each factor because the coefficients are scaled to accommodate the units of each factor, and the intercept is not at the center of the design space. As shown in Supplementary Table S4, the coded coefficients for the hydrogen production yield were gasification temperature (A = −1.46), equivalence ratio (B = −5.06), and steam-to-biomass ratio (C = −0.73), which indicated that the equivalence ratio was the major influential independent variable. The influential coded coefficients contributing to the increasing output power were the linear terms of gasification temperature (A = 866.00), equivalence ratio (B = 790.34), and steam-to-biomass ratio (C = 633.79). Gasification temperature was the major parameter contributing to the increasing output power since the heat exchanger could recover more energy into the ORC system with the increasing gasification temperature.
Multi-Objective Optimization Results
The formulated multi-objective optimization (MOO) problem for the designed system is shown in Table 7. In this study, two important optimization objectives were studied using the genetic algorithm method (NSGA-Ⅱ) incorporated in Python: 1) maximization of hydrogen production yield and 2) maximization of output power (Li et al., 2019).
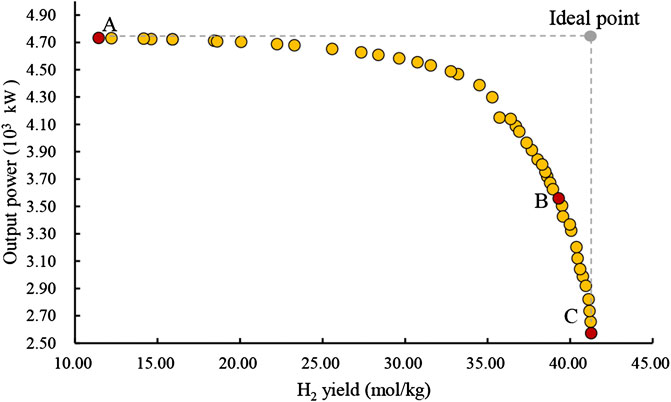
Figure 8 depicts the Pareto frontier diagram of the optimal solution points of objective functions for the model. Selecting the relatively best point depends on the policy of decision since all the points on the Pareto front are the optimal points. For instance, if the system needs to be optimized from the hydrogen yield aspect alone, point C is the best solution point, while the value of the output power is minimized. Point A is the best point if maximized output power is the focus. In this research, the LINMAP (linear programming technique for multidimensional analysis of preference) selection method was used to find the preferred optimal solution (Zhiyuan et al., 2017). The LINMAP method is executed with the following three steps:
• The points of the Pareto front curve are made nondimensional by Eq. 24.
• The distances (norms) of the points on the Pareto front from the ideal point which has the best value for both objective functions are obtained with Eq. 25.
• The point with the lowest distance is selected as the preferred optimal solution (point B).
In the above equations,
Conclusion
An equilibrium model based on the Gibbs free energy minimization method was modified by correcting the carbon conversion efficiency and the nonequilibrium factors. The model was validated by comparing with the experimental data from wood chips and sorghum in fluidized bed reactors. The hydrogen yield of wood chips was highest among the four kinds of biomass under the same working condition because of its high volatile and hydrogen content. The Box–Behnken method for a statistical analysis was applied to study the effect of gasification temperature, equivalence ratio, and steam-to-biomass ratio on the hydrogen production yield and output power. The equivalence ratio was the most significant factor affecting the hydrogen production yield, while gasification temperature had the greatest influence on the system power output. The highest hydrogen production was predicted to be 41.28 (mol/kg) at conditions of 1,031.73 K, 0.325, 0.886 (gasification temperature, equivalence ratio, and steam-to-biomass ratio), while the maximum output power was produced as 4,733.11 (kW) at conditions of 1,223 K, 0.579, 1.5 (gasification temperature, equivalence ratio, and steam-to-biomass ratio) from the established regression models. A preferred optimal solution with the hydrogen yield of 39.31 (mol/kg) and output power of 3,558.08 (kW) was achieved when considering the hydrogen yield and power output as the equally important objectives.
Data Availability Statement
All datasets presented in this study are included in the article/Supplementary Material.
Author Contributions
XZ: method, investigation, and writing. YZ and XJ: resources. YF: review and editing. QD: conceptualization, writing, and supervision.
Conflict of Interest
The authors declare that the research was conducted in the absence of any commercial or financial relationships that could be construed as a potential conflict of interest.
Acknowledgments
The authors would like to acknowledge the financial support from the SJTU-UoE Collaborative Research Fund (WF610561702/059) from Shanghai Jiao Tong University.
Supplementary Material
The Supplementary Material for this article can be found online at: https://www.frontiersin.org/articles/10.3389/fenrg.2020.584215/full#supplementary-material
References
Arun, K., Ramanan, M. V., and Ganesh, S. S. (2016). Stoichiometric equilibrium modeling of corn cob gasification and validation using experimental analysis. Energy & Fuels. 30 (9), 7435–7442. doi:10.1021/acs.energyfuels.6b01634
Azzone, E., Morini, M., and Pinelli, M. (2012). Development of an equilibrium model for the simulation of thermochemical gasification and application to agricultural residues. Renew. Energy. 46, 248–254. doi:10.1016/j.rnene.2012.03.017
Basu, P. (2013). Biomass gasification, pyrolysis and torrefaction: practical design and theory. 2nd ed. Cambridge, MA: Academic Press.
Behzadi, A., Arabkoohsar, A., and Gholamian, E. (2020). Multi-criteria optimization of a biomass-fired proton exchange membrane fuel cell integrated with organic rankine cycle/thermoelectric generator using different gasification agents. Energy 201, 117640. doi:10.1016/j.energy.2020.117640
Carrara, A., Perdichizzi, A., and Barigozzi, G. (2010). Simulation of an hydrogen production steam reforming industrial plant for energetic performance prediction. Int. J. Hydrog. Energy. 35 (8), 3499–3508. doi:10.1016/j.ijhydene.2009.12.156
Chen, H., Zhang, X., Wu, B., Bao, D., Zhang, S., Li, J., et al. (2016). Analysis of dual fluidized bed gasification integrated system with liquid fuel and electricity products. Int. J. Hydrog. Energy. 41 (26), 11062–11071. doi:10.1016/j.ijhydene.2016.05.049
Couto, N., Rouboa, A., Silva, V., Monteiro, E., and Bouziane, K. (2013). Influence of the biomass gasification processes on the final composition of syngas. Energy Procedia. 36, 596–606. doi:10.1016/j.egypro.2013.07.068
Couto, N., Silva, V., Monteiro, E., Brito, P., and Rouboa, A. (2015). Modeling of fluidized bed gasification: assessment of zero-dimensional and CFD approaches. J. Therm. Sci. 24 (4), 378–385. doi:10.1007/s11630-015-0798-7
Cuevasglory, L., Pino, J. A., Sosamoguel, O., Sauriduch, E., and Bringaslantigua, M. (2017). Optimization of the spray-drying process for developing stingless bee honey powder. Int. J. Food Eng. 13 (1). doi:10.1515/ijfe-2016-0217
Dupont, C., Boissonnet, G., Seiler, J.-M., Gauthier, P., and Schweich, D. (2007). Study about the kinetic processes of biomass steam gasification. Fuel 86 (1), 32–40. doi:10.1016/j.fuel.2006.06.011
Dutta, P. P., Pandey, V., Das, A. R., Sen, S., and Baruah, D. C. (2014). Down draft gasification modelling and experimentation of some indigenous biomass for thermal applications. Energy Procedia. 54, 21–34. doi:10.1016/j.egypro.2014.07.246
Emadi, M. A., Chitgar, N., Oyewunmi, O. A., and Markides, C. N. (2020). Working-fluid selection and thermoeconomic optimisation of a combined cycle cogeneration dual-loop organic Rankine cycle (ORC) system for solid oxide fuel cell (SOFC) waste-heat recovery. Appl. Energy. 261, 114384. doi:10.1016/j.apenergy.2019.114384
George, J., Arun, P., and Muraleedharan, C. (2016). Stoichiometric equilibrium model based assessment of hydrogen generation through biomass gasification. Procedia Tech. 25, 982–989. doi:10.1016/j.protcy.2016.08.194
Gil, J., Corella, J., Aznar, M. P., and Caballero, M. A. (1999). Biomass gasification in atmospheric and bubbling fluidized bed: Effect of the type of gasifying agent on the product distribution. Biomass and Bioenergy. 17, 389–403. doi:10.1016/S0961-9534(99)00055-0.
Huang, Y. (2009). Influence of temperature on the gasification of cattle manure in fluid bed. Beijing, China: Chinese Academy of Agricultural Sciences.
Inayat, A., Raza, M., Khan, Z., and Ghenai, C., Aslam, M., and Shahbaz, M. (2020). Flowsheet modeling and simulation of biomass steam gasification for hydrogen production. Chem. Eng. Technol. 43 (4), 649–660. doi:10.1002/ceat.201900490
Jarungthammachote, S., and Dutta, A. (2007). Thermodynamic equilibrium model and second law analysis of a downdraft waste gasifier. Energy 32 (9), 1660–1669. doi:10.1016/j.energy.2007.01.010
Kaewluan, S., and Pipatmanomai, S. (2011). Gasification of high moisture rubber woodchip with rubber waste in a bubbling fluidized bed. Fuel Process. Technol. 92 (3), 671–677. doi:10.1016/j.fuproc.2010.11.026
Karmakar, M. K., and Datta, A. B. (2011). Generation of hydrogen rich gas through fluidized bed gasification of biomass. Bioresour. Technol. 102 (2), 1907–1913. doi:10.1016/j.biortech.2010.08.015
Lapuerta, M., Hernández, J., Pazo, A., and López, J. (2008). Gasification and co-gasification of biomass wastes: effect of the biomass origin and the gasifier operating conditions. Fuel Process. Technol. 89 (9), 828–837. doi:10.1016/j.fuproc.2008.02.001
La Villetta, M., Costa, M., and Massarotti, N. (2017). Modelling approaches to biomass gasification: a review with emphasis on the stoichiometric method. Renew. Sustain. Energy Rev. 74, 71–88. doi:10.1016/j.rser.2017.02.027
Li, C., Huang, J., Wang, K., Chen, Z., and Liu, Q. (2019). Optimization of processing parameters of laser skin welding in vitro combining the response surface methodology with NSGA-II. Infrared Phys. Technol. 103, 103067. doi:10.1016/j.infrared.2019.103067
Li, X., Grace, J. R., Watkinson, A. P., Lim, C. J., and Ergüdenler, A. (2001). Equilibrium modeling of gasification: a free energy minimization approach and its application to a circulating fluidized bed coal gasifier. Fuel, 80(2), 195–207. doi:10.1016/s0016-2361(00)00074-0
Maglinao, A. L., Capareda, S. C., and Nam, H. (2015). Fluidized bed gasification of high tonnage sorghum, cotton gin trash and beef cattle manure: evaluation of synthesis gas production. Energy Convers. Manag. 105, 578–587. doi:10.1016/j.enconman.2015.08.005
Marandi, S., Mohammadkhani, F., and Yari, M. (2019). An efficient auxiliary power generation system for exploiting hydrogen boil- off gas (bog) cold exergy based on pem fuel cell and two-stage orc: thermodynamic and exergoeconomic viewpoints. Energy Convers. Manag. 195, 502–518. doi:10.1016/j.enconman.2019.05.018
Melgar, A., Perez, J. F., Laget, H., and Horillo, A. (2007). Thermochemical equilibrium modelling of a gasifying process. Energy Convers. Manag. 48 (1), 59–67. doi:10.1016/j.enconman.2006.05.004
Molino, A., Chianese, S., and Musmarra, D. (2016). Biomass gasification technology: the state of the art overview. J. Energy Chem. 25 (1), 10–25. doi:10.1016/j.jechem.2015.11.005
Moneti, M., Di Carlo, A., Bocci, E., Foscolo, P. U., Villarini, M., and Carlini, M. (2016). Influence of the main gasifier parameters on a real system for hydrogen production from biomass. Int. J. Hydrog. Energy. 41, 11965–11973. doi:10.1016/j.ijhydene.2016.05.171
Puigarnavat, M., Bruno, J. C., and Coronas, A. (2010). Review and analysis of biomass gasification models. Renew. Sustain. Energy Rev. 14 (9), 2841–2851. doi:10.1016/j.rser.2010.07.030
Rodriguez-Alejandro, D. A., Nam, H., Maglinao, A. L., Capareda, S. C., and Aguilera-Alvarado, A. F. (2016). Development of a modified equilibrium model for biomass pilot-scale fluidized bed gasifier performance predictions. Energy 115 (1), 1092–1108. doi:10.1016/j.energy.2016.09.079
Salam, M. A., Ahmed, K., Akter, N., Hossain, T., and Abdullah, B. (2018). A review of hydrogen production via biomass gasification and its prospect in Bangladesh. Int. J. Hydrog. Energy. 43 (32), 14944–14973. doi:10.1016/j.ijhydene.2018.06.043
Salam, M. A., Sufian, S., and Murugesan, T. (2013). Catalytic hydrogen adsorption of nano-crystalline hydrotalcite derived mixed oxides. Chem. Eng. Res. Des. 91 (12), 2639–2647. doi:10.1016/j.cherd.2013.05.024
Shayan, E., Zare, V., and Mirzaee, I. (2018). Hydrogen production from biomass gasification; a theoretical comparison of using different gasification agents. Energy Convers. Manag. 159, 30–41. doi:10.1016/j.enconman.2017.12.096
Susastriawan, A. A. P., Saptoadi, H., and Purnomo, (2017). Small-scale downdraft gasifiers for biomass gasification: a review. Renew. Sustain. Energy Rev. 76, 989–1003. doi:10.1016/j.rser.2017.03.112
Vamvuka, D., Woodburn, E. T., and Senior, P. R. (1995). Modelling of an entrained flow coal gasifier. 1. development of the model and general predictions. Fuel 74 (10), 1452–1460. doi:10.1016/0016-2361(95)00051-6
Villarini, M., Di Carlo, A., Bocci, E., Villarini, M., Foscolo, P. U., and Carlini, M. (2016). Performance evaluation at different process parameters of an innovative prototype of biomass gasification system aimed to hydrogen production. Energy Convers. Manag. 130, 34–43. doi:10.1016/j.enconman.2016.10.039
Wang, Y., and Kinoshita, C. M. (1992). Experimental analysis of biomass gasification with steam and oxygen. Sol. Energy. 49, 153–158. doi:10.1016/0038-092x(92)90066-j
Watkinson, A. P., Lucas, J. P., and Lim, C. J. (1991). A prediction of performance of commercial coal gasifiers. Fuel 70 (4), 519–527. doi:10.1016/0016-2361(91)90030-e
Wei, L., Yang, H., Li, B., Wei, X., Chen, L., Shao, J., et al. (2014). Absorption-enhanced steam gasification of biomass for hydrogen production: effect of calcium oxide addition on steam gasification of pyrolytic volatiles. Int. J. Hydrog. Energy. 39 (28), 15416–15423. doi:10.1016/j.ijhydene.2014.07.064
Yu, H., Eason, J., Biegler, L. T., and Feng, X. (2017). Simultaneous heat integration and techno-economic optimization of Organic Rankine Cycle (ORC) for multiple waste heat stream recovery. Energy 119, 322–333. doi:10.1016/j.energy.2016.12.061
Zainal, Z. A., Ali, R., Lean, C. H., and Seetharamu, K. N. (2001). Prediction of performance of a downdraft gasifier using equilibrium modeling for different biomass materials. Energy Convers. Manag. 42 (12), 1499–1515. doi:10.1016/s0196-8904(00)00078-9
Zhang, Y., Xu, P., Liang, S., Liu, B., Shuai, Y., and Li, B. (2019). Exergy analysis of hydrogen production from steam gasification of biomass: a review. Int. J. Hydrog. Energy. 44 (28), 14290–14302. doi:10.1016/j.ijhydene.2019.02.064
Keywords: biomass gasification, non-equilibrium model, hydrogen production, response surface method, multi-objective optimization
Citation: Zhang X, Zhou Y, Jia X, Feng Y and Dang Q (2020) Multi-Criteria Optimization of a Biomass-Based Hydrogen Production System Integrated With Organic Rankine Cycle. Front. Energy Res. 8:584215. doi:10.3389/fenrg.2020.584215
Received: 16 July 2020; Accepted: 10 September 2020;
Published: 22 October 2020.
Edited by:
Xiao-Yu Wu, University of Waterloo, CanadaReviewed by:
Kaige Wang, Zhejiang University, ChinaHaoshui Yu, Massachusetts Institute of Technology, United States
Copyright © 2020 Zhang, Zhou, Jia, Feng and Dang. This is an open-access article distributed under the terms of the Creative Commons Attribution License (CC BY). The use, distribution or reproduction in other forums is permitted, provided the original author(s) and the copyright owner(s) are credited and that the original publication in this journal is cited, in accordance with accepted academic practice. No use, distribution or reproduction is permitted which does not comply with these terms.
*Correspondence: Qi Dang, cWkuZGFuZ0BzanR1LmVkdS5jbg==
 Xiaoqi Zhang1
 Xiaotong Jia
 Qi Dang
