
94% of researchers rate our articles as excellent or good
Learn more about the work of our research integrity team to safeguard the quality of each article we publish.
Find out more
ORIGINAL RESEARCH article
Front. Energy Res., 30 October 2020
Sec. Process and Energy Systems Engineering
Volume 8 - 2020 | https://doi.org/10.3389/fenrg.2020.583346
Steam methane reforming processes represent the economically most competitive processes for the production of synthesis gas and hydrogen despite their high energy costs. Although there is a strong need for highly resource-efficient production, literature on the optimal design of reformers remains scarce due to the inherently high complexity of these processes. This contribution addresses design aspects of reformers for the case study of a side-fired reformer. Based on a two-dimensional furnace representation heat transfer and the optimal tube bundle arrangement for a fixed furnace chamber are investigated using simulation-based parametric study with both a lean radiation-based model and a computational fluid dynamics model that enables the consideration of fuel efficiency. Radiative heat transfer prevails in the reformer on the furnace side and inter-tube distances of at least three diameters are optimal within the investigated design space. The line arrangement of reformer tubes is beneficial in terms of total heat transferred, fuel efficiency as well as the homogeneity of the tube surface temperatures. These findings pave the way for further studies such as three-dimensional design aspects.
In order to mitigate global warming and provide services more sustainably, closing material cycles and pushing alternative energy sources are just as important as a significant increase in resource efficiency (IPC, 2018). Making more out of less is particularly relevant for energy-intensive processes. The German society for chemical technology and biotechnology estimates that the annual emission of up to 20–30 Mt of carbon dioxide emissions could be avoided using proper measures to increase energy efficiency (Bazzanella and Ausfelder, 2017). Novel process designs, process intensification, as well as retrofitting of existing processes must do their part to achieve this goal (Freund and Sundmacher, 2000; Zhang et al., 2013). The supply of such essential chemical building blocks like synthesis gas and hydrogen cyanide (HCN) is nowadays ensured by high temperature catalytic gas-phase processes such as steam methane reforming and the production of hydrogen cyanide in the HCN-methane-ammonia (BMA) route (Gail et al., 2000; Reimert et al., 2000). These processes are similar to tube bundle heat exchangers, since the heterogeneously-catalyzed endothermic synthesis reaction occurs inside tubes that are placed in a furnace where short-chain hydrocarbons are burned. Steam, dry, and mixed reforming are all vital in the context of a transition to alternative feedstocks and for using CO2 as a raw material. In addition to that, steam reforming is currently the most economic process to produce H2 (Reimert et al., 2000). The three most dominant chemical reactions inside a methane reforming tube include the reforming, total reforming and water gas shift reactions:
Due to their industrial relevance, research on reforming processes is abundant, going from new catalysts to novel reactor concepts. Innovative reactor designs include autothermal reactor concepts where the heat of the reaction is provided by an exothermal reaction in an adjacent compartment such as catalytic combustion, the use of micro-channels to mitigate transport barriers, and the utilization of solar energy to replace carbon feedstock as a heat source (Dybkjaer, 1995; Frauhammer et al., 1999; Tonkovich et al., 2004; Z’Graggen and Steinfeld, 2008; Liesche and Sundmacher, 2018b). Industrially relevant reactor types, however, include various types of tube bundle reactors and are distinguished using the placement of the burners as side-fired, top- or bottom-fired (Reimert et al., 2000). Modeling of reformers is challenging due to the fast reaction kinetics, complex flow patterns, and significance of all modes of heat transfer—including radiation. This is why high-fidelity models of a full-scale top-fired reformer have been published only recently (Zheng et al., 2010; Tran et al., 2017). The authors used their reformer model to suggest process intensification strategies such as modification of individual tube loads and the selective closing of exhaust flue gas channels to obtain more homogeneous temperature profiles throughout the furnace. Additional literature on the optimization of industrial-type reformers is scarce and limited to studies where optimal heat flux profiles along the tube axial coordinate could be identified (Piña et al., 2001; Latham et al., 2011). The optimization of a tube bundle design has not been exploited yet, except for tube arrangements in heat exchangers at low temperatures, e.g., Daróczy et al. (2014). Considering multiple objectives, simulation-based optimization can yield a range of optimal solutions as for example Park et al. (2018) showed for a stirred tank reactor.
An optimization of the tube bundle, however, requires a very large number of simulations and comes, therefore, at the price of a sacrifice in modeling fidelity to reduce total computing times to a reasonable amount. In this context, a model reduction representing only the essential physical phenomena is crucial for meaningful results. Many sources indicate that radiation is responsible for 95% of total heat transfer (Yu et al., 2006; Olivieri and Vegliò, 2008; Tran et al., 2017). It was shown recently, however, that this assumption does not hold under any circumstances and that convection may indeed play a significant role at reduced furnace temperatures and in high convection zones of the furnace (Liesche and Sundmacher, 2019).
Both the analysis of heat transfer and the identification of optimal tube bundle configurations in a steam reforming furnace are the objectives of this study. For these reasons, the relevance of radiative heat transfer is analyzed depending on the placement of the reformer tubes for the case study of a side-fired reformer. In addition, it is required to reduce the complexity of the full-scale reforming furnace to two dimensions in order to obtain a model that would make it suitable for simulation-based optimization. In order to achieve these objectives a single reformer tube model is coupled with two different types of furnace reactors models.
Following this introduction, all three models are presented starting with the single reformer tube model (Section 2.1), the radiation-based tube bundle furnace model (Section 2.2) and the computational fluid dynamics (CFD) model (Section 2.3). The results section discusses the simulations of a single tube (Section 3.1), the analysis of heat transfer modes (Section 3.2), the applicability of the fast radiation-based tube bundle furnace model (Section 3.3) and the results of simulations of the tube bundle arrangement for the parametric reformer case study (Section 3.4). At the end, all findings are summarized and conclusions are drawn in the last Section 4.
A side-fired tube bundle furnace is illustrated in Figure 1A: Endothermic reforming reactions take place inside of tubes that are placed inside of a furnace. The burners surrounding the tubes provide the heat for the synthesis reactions.
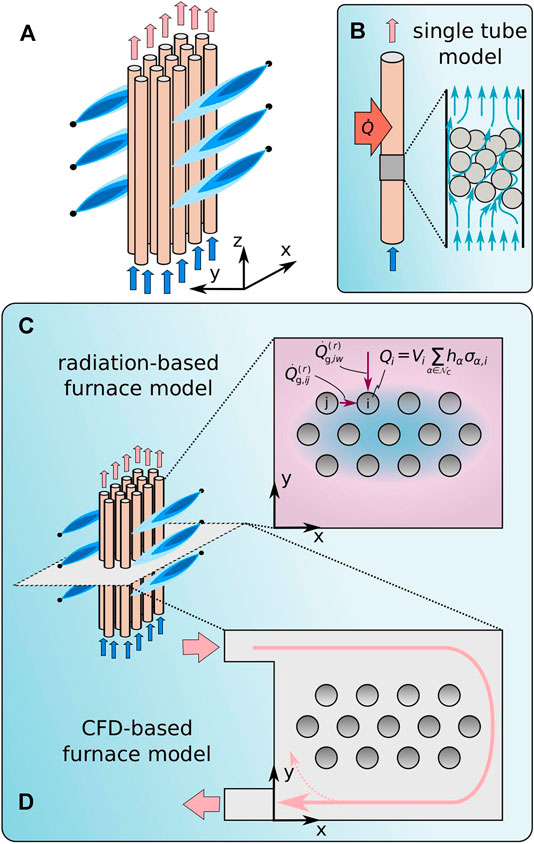
FIGURE 1. Sketch of a side-fired tube bundle furnace (A) and three different models: the single tube model (B), the radiation-based furnace model (C), and the CFD-based furnace model (D).
In order to identify optimal tube bundle arrangements that include parameters such as optimal tube diameters, their placement and corresponding flue gas flows, an effective reduction of the full furnace complexity is essential in a way that the attained furnace simulations become computationally manageable at reasonable cost as shown in Figures 1B–D. For this reason the three-dimensional reforming furnace is decoupled, separating the inner tube processes from the furnace-side flow. This decoupling approach involve three distinct modeling steps.
In the first step, a single reforming tube is modeled as depicted in Figure 1B in order to capture transport, chemical conversion and axial dispersion in a single reforming tube. An axisymmetric pseudo-homogeneous model is used for a single synthesis tube that was presented and validated against industrial data earlier (Lao et al., 2016). In the consecutive step, the tube bundle arrangement in the furnace is investigated using cross-sectional models of the furnace—neglecting the axial coordinate—in order to address cross-sectional heat transport limitations and to identify the optimal bundle arrangement. This model decomposition is advantageous because shadow effects among tubes and associated flow patterns are expected to prevail over axial transport processes for side-fired furnace designs. At first, a purely radiation-based tube bundle furnace model is applied that was developed in a previous study (Liesche and Sundmacher, 2019) where temperature distribution must be assumed (Figure 1C). In the third step, the Navier-Stokes equations for the furnace cross section are solved using a computational fluid dynamics (CFD) model as depicted in Figure 1D. This procedure has the advantage that the fuel efficiency of a design can be evaluated based on the overall furnace energy balance.
These three modeling levels of increasing complexity are described in the next sections.
Reforming tubes in industry are designed as fixed bed reactors which in turn involve multi-scale processes ranging from molecular reaction steps to internal diffusion in catalyst pellets up to the scale of the overall reforming tube. The modeling of this level of detail, however, is not required in the context of the overall furnace design. Instead of small-scale phenomena that affect for example the dynamics of a reformer tube, the overall performance of a single tube is of interest. Therefore, the focus is on the impact of variations of the boundary conditions of a single reformer tube such as tube wall surface area and tube wall temperature. For this purpose the pseudo-homogeneous reforming tube model by Lao et al. is adopted. Here, the internal tube flow is modeled in an axisymmetric two-dimensional domain with a porous medium to reach pseudo-homogeneity which means that no local distinction between catalyst particles and continuous phase is made.
Using the single reformer tube model simulations are performed in order to deliver suitable boundary conditions for the cross-sectional furnace radiation-based and CFD models that are introduced below. These simulations are required to relate the tube surface temperature to the heat flux into the reforming tube. Moreover, these simulations are also used to quantify the reformer performance in terms of product yields and space-time yields.
The three chemical reactions—reforming, total reforming and water gas shift—of Eq. 1 are modeled using the reaction kinetic model of Xu and Froment that is frequently used in the modeling of reforming and methanation reactions (Xu and Froment, 1989a; Xu and Froment, 1989b; Bremer et al., 2017; Liesche and Sundmacher, 2018b). The rate expressions are multiplied with an effectiveness factor of 0.1 (Wesenberg and Svendsen, 2007), typical for steam reformer operation.
The tube is discretized using a sparse mesh based on the pseudo-homogeneous and axisymmetric model assumptions. Lengthwise, 1,000 elements are distributed equidistantly, while 10 elements in radial direction fill the domain. In radial direction, the elements are distributed hyperbolically where the first element height is set to 4.0 m
The gas composition at the inlet of a single reforming tube is a mixture of the gases CH4, H2O, CO, H2, and CO2 with the molar fractions of 0.2487, 0.7377, 0.0001, and 0.0117, respectively. The synthesis gas with a mass flow of
The geometry of the single reforming tube reflects tube dimensions that are found in industrial steam reformers (Reimert et al., 2000; Lao et al., 2016). Its length is 12.5 m and its diameter is 12.6 cm (Lao et al., 2016). In order to study the impact of the tube geometry on the tube bundle performance, different radii of reforming tubes are investigated. Variations of the single reforming tube diameter has two direct consequences: increasing the diameter leads to increased radial transport resistance inside the tube. At the same time, the tube wall surface is increased, enhancing the heat transfer with the flue gas in the furnace. This impact is included in the study below when varying the reforming tube radius. The reference radius of 0.063 m is first considered; then, the radii are varied.
In addition, the assumed temperature profile at the wall by Lao et al. is replaced by a constant wall temperature, as Figure 2 illustrates. State-of-the-art steam reformer tubes sustain temperatures up to approximately 1,200 K (Reimert et al., 2000). In this numerical study of the single tube, temperatures up to 1,800 K are tolerated even though such high temperatures are presently considered infeasible. This is due to the fact that the single tube simulations serve as boundary conditions for the furnace simulations and numerical instabilities relating to a too narrowly defined wall temperature interval need to be avoided.
In summary, the surface wall temperature Twall, and reforming tube radii r are varied within the following range:
For each possible tuple (
Based on the single reforming tube simulations, a radiation-based furnace model is adopted for the application of steam reforming (Liesche and Sundmacher, 2019). This two-dimensional furnace model is based on two fundamental assumptions for the furnace: convective heat transfer is neglected and two flue gas temperatures—within the bundle and in between the tube bundle and the furnace walls—are required. These assumptions enable an elegant formulation of the tube energy balances while maintaining the most significant features for the tube bundle design as shown in the results. The radiation-based model contains energy balances for each individual tube, as illustrated in Figure 1C: the heat of reaction inside the ith tube
where
where
where equal areas
The gas emissivity
In this equation
The parameters φiw and φij denote view factors between the ith tube and wth wall as well as with another tube j. In general, the view factor φij relates the overall heat flux of surface i to the heat flux between surfaces i and j (Modest, 2013):
All surfaces are assumed to be homogeneous and diffuse emitters which means that the directional distribution of the radiative intensity leaving the surface is described by Lambert’s law (Modest, 2013). Consequently,
and for inter-tube view factors with equal tube surface areas
applies. The challenge of the view factor determination in a tube bundle is the correct description of shadowing effects between tubes. This is done using hyperbolic tangent functions as switching functions in the interval
where
Subsequently, the view factor φij is determined as the integration of this function over the entire angular space divided by
In order to quantify shadowing it is irrelevant for the total inter-tube view factor if tube i is shaded by tube j or vice versa. Instead, the total inter-tube view factors of each tube i and of the overall bundle are of interest. Using the formulation shown in Eq. 11, the total visual angle of tubes j and k from i is given as the sum of the functions subtracted by their product
This method of view factor calculation between tubes is compared with the crossed-strings method (Modest, 2013) vs. the ratio
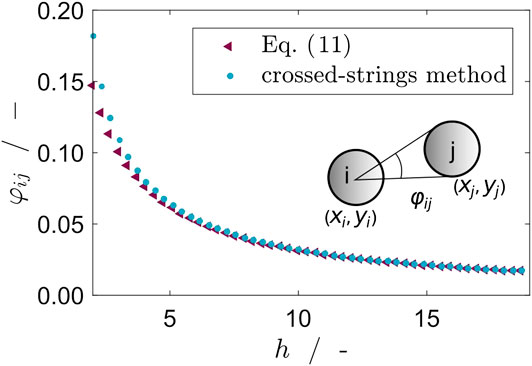
FIGURE 3. View factors between tube i and j:
In addition to the radiation-based model, a CFD-based model of the two dimensional flow domain is formulated as illustrated in Figure 1D. The consideration of a two-dimensional cross section instead of the full-scale furnace where entry and exhaust regions are neglected is self-evident: it does not match the predictive power of a simulation which fully resolves turbulence, kinetics, and radiation. However, this approach enables the simulation of multiple design configurations at comparatively low computational cost of each individual simulation. Thus, furnace configurations can be compared and the best design out of the design search space is identified as opposed to an in-depth modeling of a single scenario (Tran et al., 2017).
The target of the CFD-based furnace model that is depicted in Figure 1D is the identification of the best tube bundle arrangement in the furnace. When considering a variable and large number of tubes, a full optimization study is in principle possible but it requires a huge number of CFD simulations (Daróczy et al., 2014). In that study, we considered the identification of optimal tube bundle heat exchangers for liquid flow and within a narrow temperature window as compared to the high temperature application of a tube bundle furnace where additional models such as radiative heat transfer need to be considered. An optimization along the lines of Daróczy et al. would lead to unacceptably high computational costs here. As an alternative, a simulation-based optimization approach based on current tube bundle furnace designs that considers selected geometrical distributions is adequate to identify the optimal tube arrangement.
The position of a reformer tube of circular cross section is uniquely described by the coordinates of its center resulting in two parameters per tube. This parameter space is reduced even further to one distance factor per arrangement by assuming typical industrial arrangements such as a single line tube arrangement of top-fired reformers and aligned, staggered and rectangular arrangements that are used in BMA reactors for HCN synthesis. Besides, the tube radius must be specified. The resulting four different types of bundle arrangements that are considered in this study are illustrated in Figure 4.
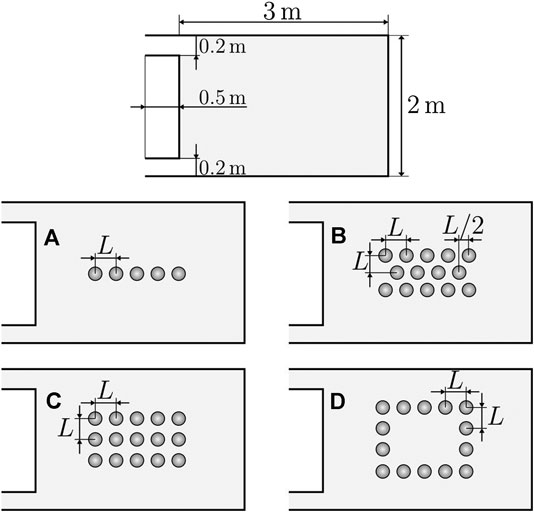
FIGURE 4. Schematic representation of the furnace geometry and four canonical tube arrangements assessed in the parameter study. Configurations: line (A), staggered (B), aligned (C), and rectangle (D).
The furnace geometry for all bundle designs is fixed as a rectangular cross section with dimensions 2
The configuration A is a linear configuration with five tubes. They are equidistantly distributed with the inter-tube distance of L. This configuration is a common arrangement for real furnaces, for example used by Tran et al. The free volume around this tube arrangement is large, resulting in high flue gas emissivities.
The configuration denoted as B stems from the arrangement that is typically applied in BMA reactors which were investigated in a separate study (Liesche and Sundmacher, 2019). It consists of 14 tubes, arranged in two rows of five enclosing one row of four tubes. Within each row, the tubes are again equidistantly distributed. The middle row is shifted by
The configuration denoted as C is similar to the previous configuration. However, it contains 15 tubes which are equally distributed in both directions without staggering between the layers. The intention of this configuration is to investigate shadowing effects in an arrangement with many local symmetries.
The last configuration denoted as D is arranged in a rectangular shape with a hollow core. It contains 14 tubes and is a super-structure of A.
For all four tube bundle configurations, two design parameters remain: the characteristic distance L, and the inner tube radius r. The latter must obviously be kept small enough compared to L in order to avoid tube collisions. This small number of parameter enables a systematic parameter study. Results for inner tube radii r are presented for three different values—a typical industrially applied radius of 0.063 m, and one smaller and one larger radius of 0.040 and 0.080 m, respectively. A constant tube wall thickness of 0.01 m is assumed.
The second parameter from the geometrical parameterization, L, is obtained as the product of the distance factor h and the reference tube radius
The following values for the distance factor h are considered in this study:
These values include industrially applied inter-tube distances (Reimert et al., 2000; Lao et al., 2016; Tran et al., 2017). Besides, cases ranging from tightly-packed bundles up to tube bundle configurations where the outer tubes are close to the inner furnace walls are considered.
In addition to these geometrical parameters, the flue gas mass flow is varied on the basis of individual tubes in order to enable a fair comparison of the four design types with their varying tube numbers.
The upper mass flow value limits the maximum inflow velocity of flue gas to values that are experienced in furnaces of approximately 15 m s−1 (Zheng et al., 2010). The total flue gas mass flow
For each possible parameter combination (r,
The large flow domain, relatively high velocities, and low viscosity of the flue gas make the flow inside such a furnace inherently turbulent. Turbulence is modeled in CFD using the Reynolds-Averaged Navier-Stokes (RANS) equations. The well-established, two-equation realizable k-ε model is used to model turbulent effects. Wall boundary layers are represented with a two-layer wall function, which blends between a fully resolved boundary layer and a wall model. Inflow turbulence intensity is assumed in a standard manner to be
In the real process, fuel combustion takes place within the furnace to heat up the tube bundles. Similar to the single reforming tube, however, resolving of the full-scale microscopic phenomena on the furnace is not within the scope of this project because it is not helpful for the overall comparative evaluation of bundle arrangements. In addition, resolving a high level of detail is limited by the involved high computational cost (Hilbert et al., 2004). As a consequence, the combustion and flame structure inside the furnace are replaced with an nonreactive hot flue gas that stems from the complete combustion of methane. The flue gas is modeled as an ideal gas mixture of CO2, H2O, O2, and N2 with molar fractions of 0.05, 0.10, 0.10, and 0.75, respectively, that enters the furnace domain at 1,800 K.
Similar to the single tube and radiation-based model, a gray participating medium is adequate to account for radiative heat transfer and scattering effects are neglected. The discrete ordinate method (DOM), is selected as modeling approach for radiation. The furnace walls are considered adiabatic, gray, homogeneous and diffuse emitters. The wall emissivities
The absorption coefficient of the flue gas
The ratio
The constants
The endothermic reforming reaction inside the tubes is driven by the heat flux into the reforming tubes. The temperature-dependent heat flux that is obtained from single tube simulations is thus served as a boundary condition for the furnace simulations. The thermal boundary layer on the tube surfaces coupled to convection is derived from the evolution of the turbulent boundary layer along all walls. The wall thickness of the tubes is taken into account when computing the heat flux to the tubes within the bundle, using standard theory for steady heat flux through a pipe wall.
The outlet of the furnace cross section is a zero-gradient pressure outlet boundary. To increase numerical stability, temporary backflow conditions in case of occurring backflow are tolerated. Similar to the simulations of the single reforming tubes, all simulations are carried out with the CFD solver StarCCM + V13.02. In addition, the furnace simulations are automatized using a Java program and StarCCM+‘s application programming interface (API). The computations were partly performed on the high performance computing cluster “Mechthild” of the Max Planck Institute for Dynamics of Complex Technical Systems.
For each individual simulation a polyhedral mesh is generated for the whole domain. Near the walls, 35 prismatic layers are used to resolve the flow and temperature boundary layer, with a growth factor of 1.2. In order to scrutinize the validity of the simulations, a mesh-dependency study is first carried out. The results of this mesh study are exemplified for the total heat flux into all tubes in the Supplementary Material. The total heat flux
A mesh size of around 800,000 elements is selected because it is a good compromise between duration of computation and accuracy for the furnace scenario. The deviation to a mesh with twice the number of cells is very low with 0.28%. The total number of cells is kept constant across all furnace simulations.
Using some individual adaptation for few scenarios, 975 simulations out of the 1,008 converged based on the described CFD setup and mesh topology.
The results section is structured according to the hierarchical furnace design procedure that is illustrated in Figure 1. Initially, key performance characteristics are defined based on single reforming tube simulations. At the same time, the correlations of these performance numbers with heat flux to the reforming tubes are highlighted. Consecutively, the prevalence of radiative heat transfer is analyzed for the proposed furnace design space and the applicability of the radiation-based furnace model for quick comparative decision-making is illustrated. The final part of the results section identifies the most promising design candidate among the investigated samples based on the performance criteria of the single-tube simulations as well as energy efficiency.
Two key design parameters of a single reforming tubes are identified as the tube radius and the temperature of the tube wall. The impact of both parameters is illustrated in Figure 1. The wall heat flux
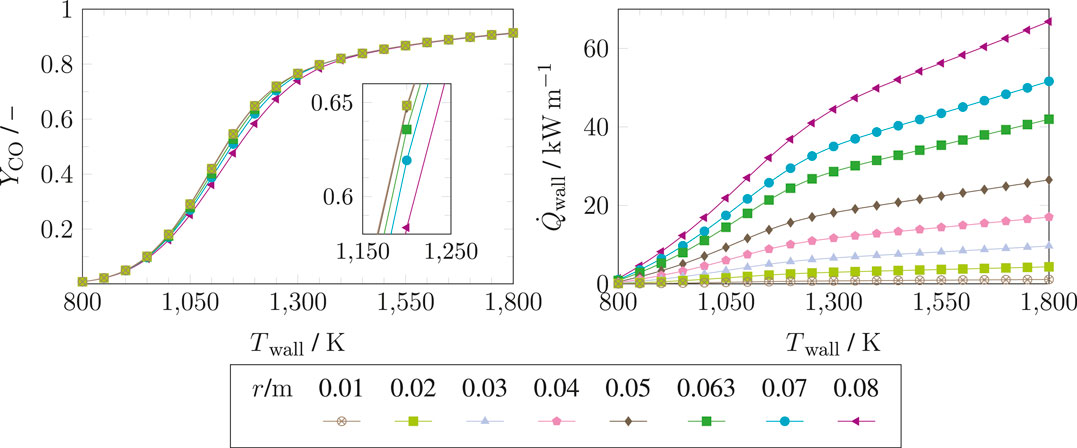
FIGURE 5 . Yield of CO, YCO of a single reforming tube, and wall heat flux
The production of synthesis gas—a mixture of H2 and CO—is limited by the fact that a certain share of CO2 is simultaneously formed due to the chemical equilibrium. For this reason, the yield of CO,
The conversion of the reactant methane CH is calculated between inlet and outlet of a single reforming tube as:
Selectivity toward CO is calculated as:
Whereas the yield is a measure for product quality, the space time yield STYi is introduced as a measure of the product quantity that is obtained. For this purpose the product molar flow is related to the catalyst volume inside of the reactor. The latter increases quadratically with the tube radii, which is why it is considered for the variation of tube radii. The space-time yield for the target product
An additional aspect is visible from both Figure 5: Almost equal yields are attained irrespective of the reforming tube radii and despite an increase in radial transport resistance with larger radii. Nonetheless, there are differences in product yield for the decisive temperature range between 1,050 and 1,300 K. It is also important to highlight that a significantly larger amount of heat is transferred to the tubes with larger tube radii as opposed to smaller ones. At the same time, the utilization of smaller tubes leads to higher pressure drops for equal mass flows in each tube. All these results show that there is a trade-off between smaller and larger tube radii on the reforming side: smaller tube radii are beneficial for high yields but suffer from higher pressure drops and vice versa for large tube radii.
The prevalence of radiative heat transfer can be estimated with the dimensionless Boltzmann number B which is the convection-to-radiation ratio:
In this equation
For low velocities of
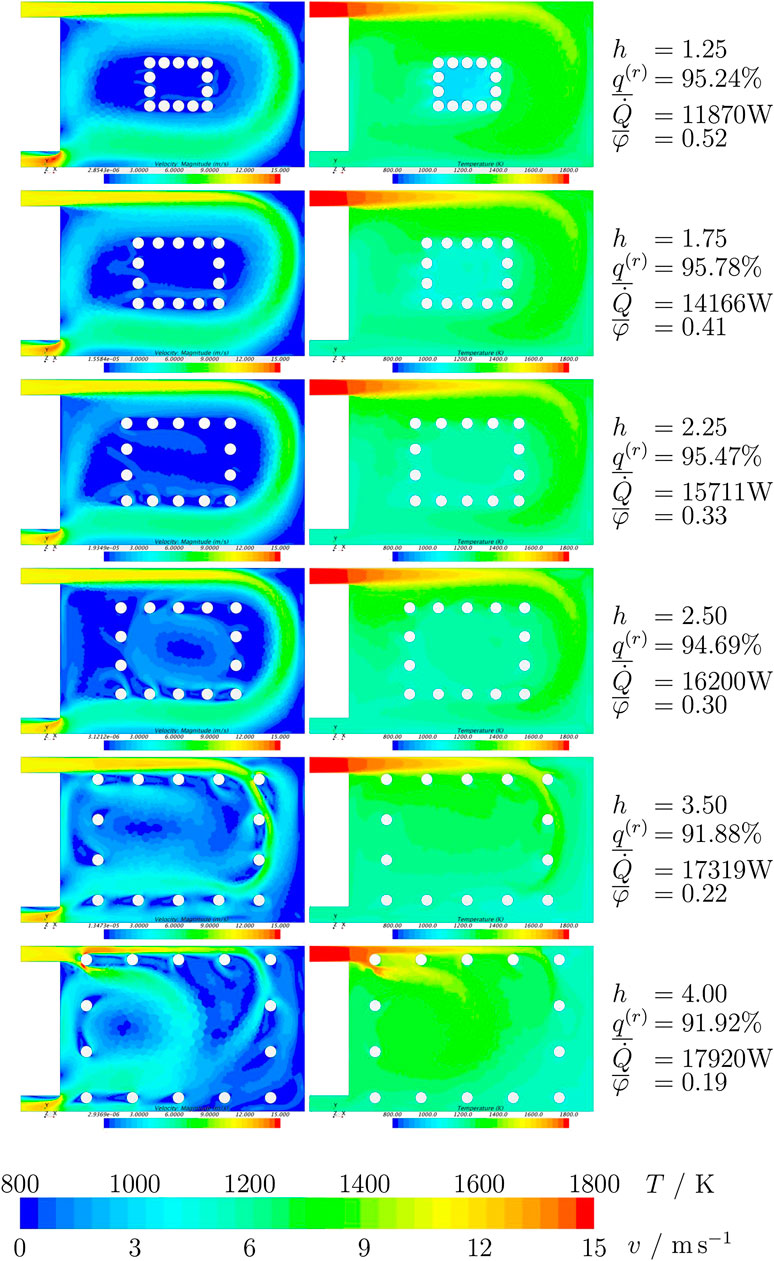
FIGURE 7. Velocity magnitude (left column) and temperature fields (right column) for the configuration D at different distance factors with an inner tube radius of
The velocity magnitudes vary from close to zero between tubes up to 15 ms at the flue gas inlet in the top left corner. This velocity distribution illustrates that tubes along top and right-hand furnace walls are closest to the main flow of hot gases. When h is large, these tubes are directly exposed to the main stream. Looking at the velocities of the top four simulations, the following behavior is observed: In the vicinity of the tube arrangement, velocities drop below
In order to quantify this assumption for all furnace design scenarios, a mean radiative heat flux ratio
The radiative heat flux ratio
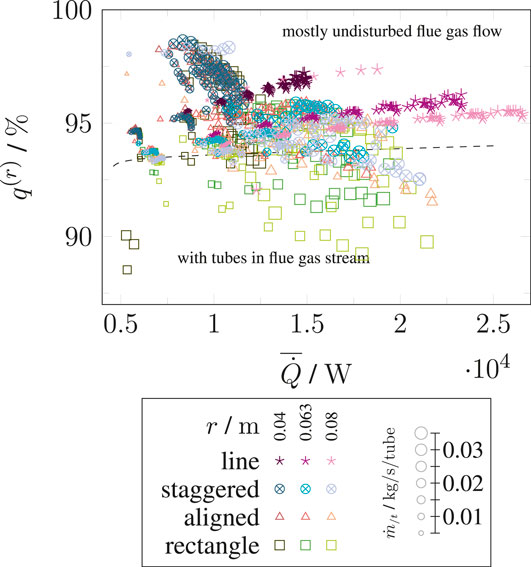
FIGURE 8. Radiative heat flux ratio
A black line in Figure 8 separates scenarios where tubes are placed near or within the flue gas flow (bottom) to scenarios where the tubes remain at a distance from the furnace walls (top). In particular for the rectangular arrangement D that is illustrated with squares in Figure 8 convection plays a more important role especially for the largest tube radii. The reason for the importance of convection for rectangular arrangements is already visible in Figure 4. Whereas the line arrangement (A) does not expand in transverse direction for larger L, staggered and aligned arrangements (B, C) stretch with
In addition to the geometrical parameters, Figure 8 demonstrates the impact of increasing flue gas mass flows. Generally, convective heat transfer increases with the flue gas mass flow. If high flue gas mass flows, large tube radii, and large distance factors occur in the same simulation, convection conveys 5–10% of the total heat flux, and even up to 12% in some configurations.
The applicability of the simplified radiation-based model for tube bundle design of furnace that is described in Section 2.2 is now analyzed. Two assumptions are essential in order to apply this model: 1) the dominance of radiative heat transfer in the furnace and 2) the assumption that a relatively homogeneous temperature distribution in the furnace can be assumed with a higher temperature near the furnace walls compared to the furnace space in between the tubes. The first assumption has been justified in the previous section and the latter is illustrated in Figure 7 in the right column. The flue gas enters the domain with temperatures of 1,800 K. This temperature drops very rapidly to values in the range 1,300–1,500 K around the tubes, and later 1,100–1,200 K in-between tubes and in the center of the bundle arrangement if the tubes do not obstruct the flue gas flow. As a consequence, the resulting temperature distribution can be approximated using the two temperature domains of the radiation-based model (Liesche and Sundmacher, 2019).
Two parameters that influence furnace bundle design were identified previously (Liesche and Sundmacher, 2019): the flue gas emissivity and the view factors. Whereas the impact of flue gas emissivities cannot be directly observed in the CFD simulations due to the overlay of convection near furnace walls the view factors for all furnace simulations can be observed. The mean of the inter-tube view factors for any given furnace simulation is defined as
Results for all furnace simulations are illustrated in Figure 9.
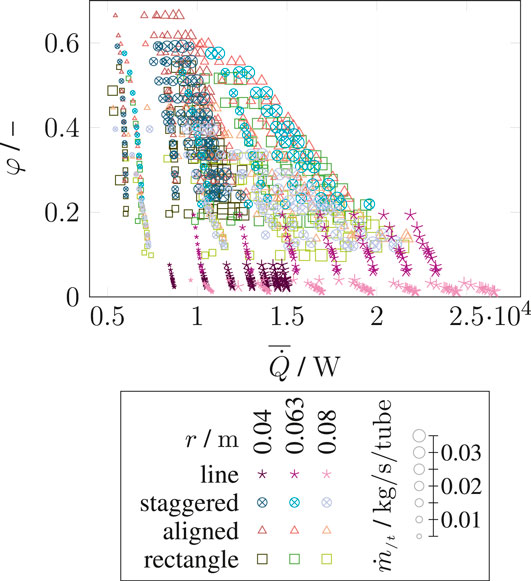
FIGURE 9. Average view factor
For almost all cases, a smaller
In the following figures, the radiation-based model is benchmarked using the CFD model. Staggered B and aligned C tube bundle arrangements are modeled using the radiation-based model and the CFD based furnace model and their results are compared in Figure 10. Colored symbols correspond to the CFD model for three different mass flow rates whereas the black symbols denote the radiation-based model that was first described in (Liesche and Sundmacher, 2019). It is evident, that the CFD simulations of the intermediate flue gas flow match the radiation-based results well. The results differ by a maximum temperature difference of 15 K. This is an additional indicator that confirms the assumptions made in the radiation-based model. Instead of solving the full Navier-Stokes equations the radiation-based model is therefore useful for a fast comparison of different designs. The drawback of neglecting radiation is also clearly visible in Figure 10: the flue gas mass flow has a strong impact on the absolute temperatures that are attained. This could in principle be reflected in the radiation-based model by assuming different temperatures near the walls and in between the tubes, but the temperature distributions are hard to estimate and are typically not known a priori. For cases where the flow structure is simple enough, the model by Liesche and Sundmacher is an excellent option to reduce simulation efforts.
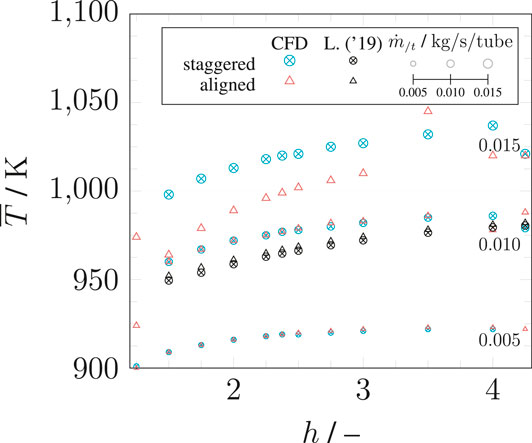
FIGURE 10. Mean tube surface temperature of all tubes in the bundle
Both furnace models are compared for different tube diameters including the standard deviations of tube surface temperatures in Figure 11. As before, there is a qualitative agreement of both models but the tube surface temperatures vary more strongly in the CFD-based model. Similar to Figure 10 this effect stems from the approximations of the temperature field. The mean surface temperatures increase with increasing distance h for all scenarios and all models. A second important aspect are the larger standard deviations across the tube bundle for the CFD-based model. The tubes at the boundaries of the staggered bundle are affected by convection whereas the inner tubes see nearly no convection at all. That explains the stronger variations of tube temperatures across the tube bundle. In addition, the minimum of standard deviations occurs at smaller values of the distance factor h compared to the radiation-based model because the impact of convection increases with h in the CFD-based model. As a consequence, variations in the tube surface temperatures should be analyzed preferably with the CFD-based model.
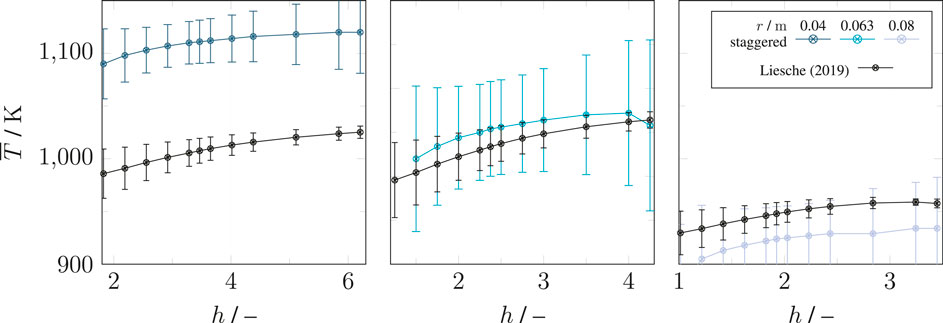
FIGURE 11. (A) Mean tube surface temperature
In summary, the radiation-based model is fully sufficient for a fast comparison of different furnace geometries in terms of overall performance. The CFD-based model should be preferred in situations where the absolute tube surface temperature values and variations across the tube bundle are of primary interest. In addition, the energy efficiency of a bundle design can only be identified using the CFD-based model because the overall energy balance is included for the furnace flue gas flow.
The last part of the previous section showed that variations of tube temperatures in a bundle can be assessed with more detail using the CFD-based model. Therefore, the optimal bundle arrangement among the case studies that were analyzed in this study is identified using the CFD-based model. The optimal scenario is identified using the three design parameters that were identified in section 2.3 as radius r, distance factor h and flue gas massflow
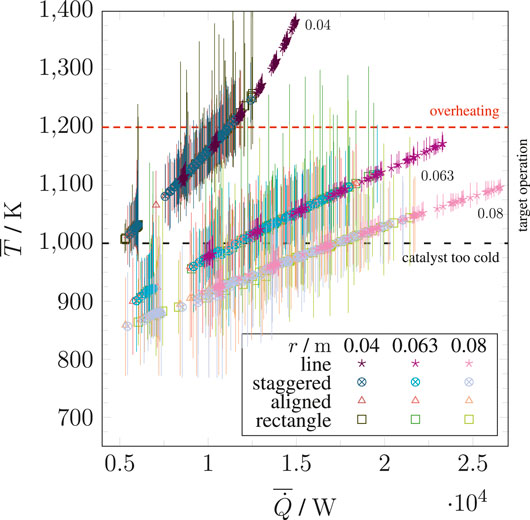
FIGURE 12. Mean wall temperature
In A configurations, mean temperatures and mean heat transfer are higher than in all the other configurations. Moreover, the minimum and maximum temperatures for A are very close to
In addition, a feasibility window based on industrial steam reformers is indicated using the red (upper operating temperature) and black (lower operating temperature) dotted lines (Reimert et al., 2000). If the temperature is too low, the conversion is too low or no firing of the catalyst occurs. Vice versa, overheating and material degradation occur at high temperatures. It is thus desirable to attain the region bounded by these two lines on the far right where a high mean heat flux is achieved. For small tube radii (dark-shaded symbols) overheating may be encountered and for large tube radii (bright shaded symbols) temperatures are lower than the desired temperature except for line arrangements where the maximum mean heat flux is achieved. All flue gas mass flows are included in Figure 12 but not highlighted separately in order to maintain good readability of the figure. It is nevertheless visible that results of an arrangement type and radius seem to cluster: this is due to the flue gas mass flows where large mass flows are to be found on the upper right end and low mass flows toward the bottom left.
For the tube radius that is frequently found in industry (0.063 m) any of the four arrangements can be found in the optimal temperature interval. Yet, some configurations have strong deviations within the bundle; the line arrangement (A) is again superior over the other tube bundle arrangements.
The impact of the three decisive furnace parameters on the space-time yield of
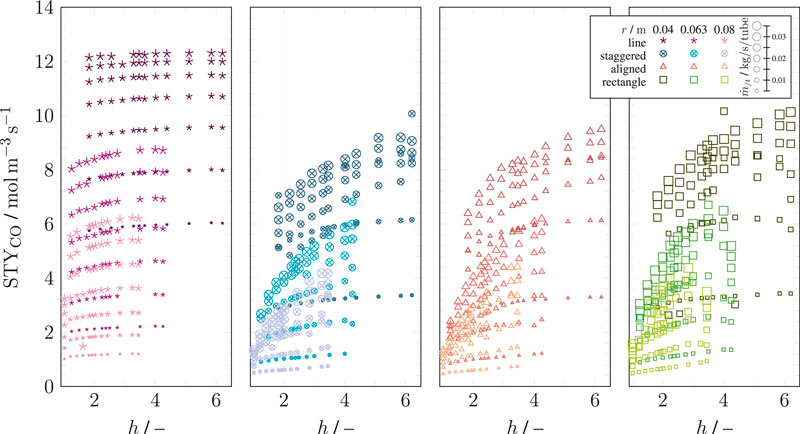
FIGURE 13. The space-time yield STYiCO as a function of the distance factor h—shown for each configuration individually. The symbol (and its color family) indicates the configuration of the data point. Shades of the respective color indicate the inner tube radius r. Symbol size indicates the mass flow rate
This graph shows that smaller tube radii combined with high flue gas mass flows perform better in terms of space-time yield than larger tubes. Secondly, the space-time yield increases with the distance factor until reaching a plateau. This effect is emphasized more strongly for configurations B, C and D. For the considered furnace geometry, the minimal distance between the tubes h is approximately three to reach the plateau. Thirdly, the line configuration A outperforms the other arrangements. In addition, STYCO decreases slightly above a distance factor of four for the inner tube radius of 0.063 m. This effect was explained above where the tubes obstruct the flue gas flow for large distance factors h. This effect is not visible for the smallest tube radius of 0.04 m.
One aspect remains to be analyzed: the energy efficiency of the furnace designs. For this purpose, the total heat flux from the flue gas into the reforming per mass of flue gas (
where
Accordingly,
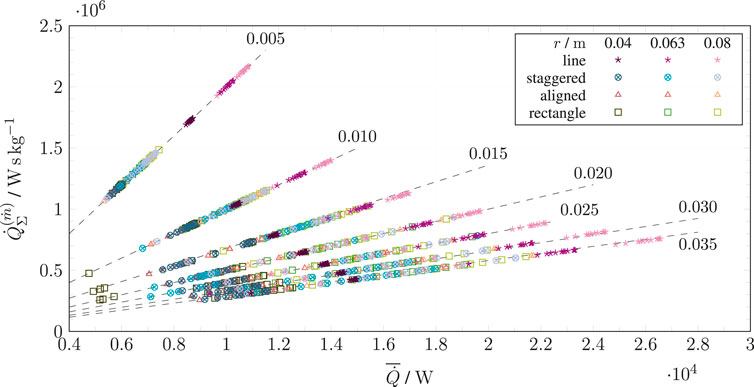
FIGURE 14. Total heat flux
Contrarily, a high flue gas inflow naturally has more transferable heat. The temperature of the flue gas decreases not as much for an equal amount of heat as in low flue gas mass flow scenarios. More heat and a higher temperature difference is left, which enables further heat to be transferred. Consequently, the flue gas exits the furnace at higher temperatures, which therefore reduces energy efficiency.
All design considerations of this section result in the following optimal tube bundle arrangement for the furnace under investigation. Line arrangements shall generally be preferred using a small tube radius of 0.04 m if the related pressure drop and coking are manageable. The inter-tube distance is of less importance for this line arrangement but a distance factor of
In summary, the targeted decoupling strategy for the simulation of the complex three-dimensional tube bundle furnace leads to the following results. Single reforming tube simulations for different tube radii and surface temperatures are made to obtain boundary conditions for furnace-scale simulations. Two models are proposed for the identification of optimal design on the furnace-scale—one based on radiative heat transfer only, and a CFD-based model. Modeling the furnace environment based entirely on radiative heat transfer is a good approximation and enables an effective comparison of tube bundle furnace arrangements, leading to a suitable tool for quick design comparison. Due to the abundance of industrial-scale steam reformers, however, the focus of future novel reactor developments lays in fine-tuned tube arrangements where standard deviation of wall temperatures in a bundle and fuel efficiency can be analyzed. Based on the furnace geometry and design space, the optimal design is to arrange the tubes in lines and to favor tube radii that are as small as possible for effective heat transfer and conversion inside of the tubes. Flue gas mass flows of
Using the radiation-based design tool and CFD simulations, existing designs can be evaluated as well as novel designs identified. In a follow-up study the furnace geometry should be varied to ensure that the furnace space per tube does not vary significantly in order to avoid any bias originating from flue gas residence times in the furnace. The impact of oxygen-enriched combustion is another aspect that may be of interest for furnaces because higher molar fractions of the emissive gases CO and HO would enhance radiative heat transfer. Both aspects, however, can hardly be optimized without a specific plant context.
The datasets presented in this study can be found in online repositories. The names of the repository/repositories and accession number(s) can be found below: https://doi.org/10.5281/zenodo.3944732.
SE and GL wrote this article. SE created the CFD models, performed the simulations and its analysis. GL created radiation-based modeling and simulations and its analysis. KS, GJ, and DT supervised the study and rigorously revised the manuscript. All authors contributed to the article and approved the submitted version.
This publication is supported by the EU-program ERDF (European Regional Development Fund) within the research center of dynamic systems (CDS).
The authors declare that the research was conducted in the absence of any commercial or financial relationships that could be construed as a potential conflict of interest.
The author Sebastian Engel is affiliated with the International Max Planck Research School (IMPRS) for Advanced Methods in Process Systems Engineering (Magdeburg). We thank our students Adrian Krummnow and Saketh Bharadwaj for their contributions to this study.
The Supplementary Material for this article can be found online at: https://www.frontiersin.org/articles/10.3389/fenrg.2020.583346/full#supplementary-material
Bazzanella, A. M., and Ausfelder, F. (2017). Technology study: low carbon energy and feedstock for the European chemical industry. Frankfurt a.M., Germany: DECHEMA Gesellschaft für Chemische Technik und Biotechnologie e.V.
Bremer, J., Rätze, K. H. G., and Sundmacher, K. (2017). CO2 methanation: optimal start-up control of a fixed-bed reactor for power-to-gas applications. AIChE J. 63, 23–31. doi:10.1002/aic.15496
Daróczy, L., Janiga, G., and Thévenin, D. (2014). Systematic analysis of the heat exchanger arrangement problem using multi-objective genetic optimization. Energy 65, 364–373. doi:10.1016/j.energy.2013.11.035
Davis, M. E., and Davis, R. J. (2012). Fundamentals of chemical reaction engineering. Boston, MA: Dover Publications Inc.
Dybkjaer, I. (1995). Tubular reforming and autothermal reforming of natural gas - an overview of available processes. Fuel Process. Technol. 42, 85–107. doi:10.1016/0378-3820(94)00099-f
Frauhammer, J., Eigenberger, G., Hippel, L. v., and Arntz, D. (1999). A new reactor concept for endothermic high-temperature reactions. Chem. Eng. Sci. 54, 3661–3670. doi:10.1016/s0009-2509(98)00454-0
Freund, H., and Sundmacher, K. (2000). “Process intensification, 1. Fundamentals and molecular level,” in Ullmann’s encyclopedia of industrial chemistry (Weinheim, Germany: Wiley VCH). doi:10.1002/14356007.o22_o02
Gail, E., Gos, S., Kulzer, R., Lorösch, J., Rubo, A., Sauer, M., et al. (2000). “Cyano compounds, inorganic,” in Ullmann’s encyclopedia of industrial chemistry (Weinheim, Germany: Wiley VCH). doi:10.1002/14356007.a08_159.pub3
Hilbert, R., Tap, F., El-Rabii, H., and Thévenin, D. (2004). Impact of detailed chemistry and transport models on turbulent combustion simulations. Prog. Energy Combust. Sci. 30, 61–117. doi:10.1016/j.pecs.2003.10.001
IPCC (2018). “Summary for policymakers,” in Global warming of 1.5C. An IPCC Special Report on the impacts of global warming of 1.5C above pre-industrial levels and related global greenhouse gas emission pathways, in The context of strengthening the global response to the threat of climate change, sustainable development, and efforts to eradicate poverty. Editors V. Masson-Delmotte, P. Zhai, H. O. Pörtner, D. Roberts, J. Skea, P. R. Shukla, et al. (Geneva, Switzerland: World Meteorological Organization), 45–64. doi:10.1553/aar14s45
Lao, L., Aguirre, A., Tran, A., Wu, Z., Durand, H., and Christofides, P. D. (2016). CFD modeling and control of a steam methane reforming reactor. Chem. Eng. Sci. 148, 78–92. doi:10.1016/j.ces.2016.03.038
Latham, D. A., McAuley, K. B., Peppley, B. A., and Raybold, T. M. (2011). Mathematical modeling of an industrial steam-methane reformer for on-line deployment. Fuel Process. Technol. 92, 1574–1586. doi:10.1016/j.fuproc.2011.04.001
Liesche, G., and Sundmacher, K. (2018a). Identification of key transport phenomena in high-temperature reactors: flow and heat transfer characteristics. Ind. Eng. Chem. Res. 57, 15884–15897. doi:10.1021/acs.iecr.8b03955
Liesche, G., and Sundmacher, K. (2018b). Productivity versus product quality: exploring the limits of autothermal microchannel reactors in methane steam reforming. Chem. Eng. J., 377, 120048 doi:10.1016/j.cej.2018.09.209
Liesche, G., and Sundmacher, K. (2019). Radiation-based model reduction for the optimization of high temperature tube bundle reactors: synthesis of hydrogen cyanide. Comput. Chem. Eng. 127, 186–199. doi:10.1016/j.compchemeng.2019.05.007
Olivieri, A., and Vegliò, F. (2008). Process simulation of natural gas steam reforming: fuel distribution optimisation in the Furnace. Fuel Process. Technol. 89, 622–632. doi:10.1016/j.fuproc.2007.12.001
Park, S., Na, J., Kim, M., and Lee, J. M. (2018). Multi-objective Bayesian optimization of chemical reactor design using computational fluid dynamics. Comput. Chem. Eng. 119, 25–37. doi:10.1016/j.compchemeng.2018.08.005
Piña, J., Schbib, N. S., Bucalá, V., and Borio, D. O. (2001). Influence of the heat-flux profiles on the operation of primary steam reformers. Ind. Eng. Chem. Res. 40, 5215–5221. doi:10.1021/ie001065d
Reimert, R., Marschner, F., Renner, H.-J., Boll, W., Supp, E., Brejc, M., et al. (2000). “Gas production, 2. Processes,” in Ullmann’s encyclopedia of industrial chemistry. (Weinheim, Germany: Wiley VCH), 423–482
Specht, E. (2017). Heat and mass transfer in thermoprocessing: fundamentals, calculations, processes. Essen, Germany: Vulkan.
Tonkovich, A. Y., Perry, S., Wang, Y., Qiu, D., LaPlante, T., and Rogers, W. A. (2004). Microchannel process technology for compact methane steam reforming). Chem. Eng. Sci. 59, 4819–4824. doi:10.1016/j.ces.2004.07.098
Tran, A., Aguirre, A., Durand, H., Crose, M., and Christofides, P. D. (2017). CFD modeling of a industrial-scale steam methane reforming Furnace. Chem. Eng. Sci. 171, 576–598. doi:10.1016/j.ces.2017.06.001
VDI-Gesellschaft Verfahrenstechnik und Chemieingenieurwesen (2013). VDI-wärmeatlas. 11th Edn, (Berlin, Germany: Springer).
Wesenberg, M. H., and Svendsen, H. F. (2007). Mass and heat transfer limitations in a heterogeneous model of a gas-heated steam reformer. Ind. Eng. Chem. Res. 46, 667–676. doi:10.1021/ie060324h
Xu, J., and Froment, G. F. (1989a). Methane steam reforming: II. Diffusional limitations and reactor simulation. AIChE J. 35, 97–103. doi:10.1002/aic.690350110
Xu, J., and Froment, G. F. (1989b). Methane steam reforming, methanation and water-gas shift: I. Intrinsic kinetics. AIChE J. 35, 88–96. doi:10.1002/aic.690350109
Yu, Z., Cao, E., Wang, Y., Zhou, Z., and Dai, Z. (2006). Simulation of natural gas steam reforming Furnace. Fuel Process. Technol. 87, 695–704. doi:10.1016/j.fuproc.2005.11.008
Zhang, H., and Modest, M. F. (2002). Evaluation of the Planck-mean absorption coefficients from HITRAN and HITEMP databases. J. Quant. Spectrosc. Radiat. Transf. 73, 649–653. doi:10.1016/S0022-4073(01)00178-9
Zhang, N., Smith, R., Bulatov, I., and Klemeš, J. J. (2013). Sustaining high energy efficiency in existing processes with advanced process integration technology. Appl. Energy. 101, 26–32. doi:10.1016/j.apenergy.2012.02.037
Zheng, D., Wu, B., Fleitz, J., Trajkovski, R., and Zhou, C. Q. (2010). “CFD simulation of a hydrogen reformer Furnace,” in 2010 14th International Heat Transfer Conference, Washington, DC, Vol. 3, (ASME), 233–244
Z’Graggen, A., and Steinfeld, A. (2008). Hydrogen production by steam-gasification of carbonaceous materials using concentrated solar energy – V. Reactor modeling, optimization, and scale-up. Int. J. Hydrogen Energy. 33, 5484–5492. doi:10.1016/j.ijhydene.2008.07.047
D Outer tube diameter of a reforming tube
h Distance factor
L Characteristic Length
N Number of tubes
n Refractive index of the fluid
p Pressure
ϕ Angular component of polar coordinate system
Q Heat
r Inner tube radius of a reforming tube
ρ Density
σ Stefan-Boltzmann constant
T Temperature
v Velocity
Keywords: steam reforming, simulation based optimization, computational fluid dynamics, radiation, reactor design
Citation: Engel S, Liesche G, Sundmacher K, Janiga G and Thévenin D (2020) Optimal Tube Bundle Arrangements in Side-Fired Methane Steam Reforming Furnaces. Front. Energy Res. 8:583346. doi: 10.3389/fenrg.2020.583346
Received: 29 July 2020; Accepted: 16 September 2020;
Published: 30 October 2020.
Edited by:
Enhua Wang, Beijing Institute of Technology, ChinaReviewed by:
Martin T. White, City University of London, United KingdomCopyright © 2020 Engel, Liesche, Sundmacher, Janiga and Thévenin. This is an open-access article distributed under the terms of the Creative Commons Attribution License (CC BY). The use, distribution or reproduction in other forums is permitted, provided the original author(s) and the copyright owner(s) are credited and that the original publication in this journal is cited, in accordance with accepted academic practice. No use, distribution or reproduction is permitted which does not comply with these terms.
*Correspondence: Sebastian Engel, c2ViYXN0aWFuLmVuZ2VsQG92Z3UuZGU=
Disclaimer: All claims expressed in this article are solely those of the authors and do not necessarily represent those of their affiliated organizations, or those of the publisher, the editors and the reviewers. Any product that may be evaluated in this article or claim that may be made by its manufacturer is not guaranteed or endorsed by the publisher.
Research integrity at Frontiers

Learn more about the work of our research integrity team to safeguard the quality of each article we publish.