 Udi Helman
 Ben Kaun2
 Joseph Stekli
- 1Helman Analytics, San Francisco, CA, United States
- 2Electric Power Research Institute (EPRI), Palo Alto, CA, United States
Energy storage is a topic of increasing interest for purposes of decarbonization of the electric power system, and in particular for addressing integration of increasing quantities of variable energy resources, such as wind and solar PV. A growing focus of such assessment is the need for new long-duration storage, in addition to existing pumped storage hydropower. A limitation of much of the analysis on this topic to date has been limited consideration of how the economic value of long-duration storage will be affected by the large deployments of short-duration energy storage, primarily lithium-ion batteries, which are currently receiving state policy support (through mandates or financial incentives), or otherwise expected to enter the markets. This article reviews the literature on this topic, updates some simulation results, and helps advance the methodological questions which need to be addressed in subsequent simulation studies. The article examines each of the major components of potential long-duration storage value, including energy time-shift, different ancillary services, and resource adequacy (RA) capacity. It also draws attention to how state policies, resource planning methods, and market structure and regulatory factors can influence selection of different types of energy storage, whether short or long duration.
Introduction and Overview
Energy storage is currently expected to play a significant role in future decarbonized electric power systems in the United States and other countries. State policies, utility procurement targets, and resource planning studies have begun to forecast large-scale additions of energy storage, with project sizes of larger power capacity (MW) also being planned around the country. At the same time, there is little consensus yet on which attributes of energy storage will be needed and valued over time, in particular the energy capacity (MWh) and/or “duration” of energy storage, measured as the minutes to hours of output at full power capacity, which could be cost-effective for particular services and applications, and in different future scenarios for the bulk power system. For purposes of this article, we categorize “short duration” as 4 h or less of duration, and “long duration” as any duration longer than 4 h. Until recently, short-duration energy storage installations were typically characterized by batteries and flywheels with duration of 15–60 min, but 4-h durations are now common in battery storage projects, including those being hybridized with solar and wind projects. Hence, the focus in this study is on comparing the current and future opportunities for energy storage in these two categories.
Most of the existing energy storage on the U.S. electric power system is long-duration pumped storage hydropower (PSH) with energy capacities from 8 h to several days. However, the focus of storage policy and development in recent years has shifted to short-duration energy storage installations, primarily batteries. The origin of this article is assessments by EPRI, national laboratories, and other entities pertaining to the market potential for PSH, the most mature long-duration energy storage technology, but one which faces many barriers to entry (e.g., EPRI, 2019b) and increasing competition from short-duration lithium-ion battery projects (including hybrids). Compressed air energy storage (CAES) is also a potentially promising long-duration energy storage technology, but with less commercial experience. Other long-duration storage technologies, such as lithium ion batteries, flow batteries, electromechanical storage, thermal energy storage, and chemical storage, are also under consideration.
The objective of this article is to focus on the factors which will affect the expansion of different storage types, with different durations. When comparing different types of long-duration storage technologies, there are both differences and similarities when evaluating market potential. The differences include comparative current costs and forecasts of any cost reductions; technology performance and reliability attributes; technology-specific siting restrictions and permitting requirements; ability to scale, hybridize, and/or modularize project sizes; and the set of eligible applications. The similarities include the impact of rapid commercialization and deployment of short-duration storage on market opportunities. To provide insights into this question, this study takes a “bottom-up” approach, examining the evidence on what types and attributes of energy storage can access market and utility benefits in different applications, but also reviewing the literature which evaluates different future scenarios. There have been a few studies comparing the benefits of energy storage of different durations against the same scenarios, which provide indicative results. Building on other recent surveys on aspects of this topic conducted by some of the authors (e.g., EPRI, 2019b), another objective of this study is to highlight that the state and federal policies, and differences in regional industry structure and regulation, are also important factors which will influence the selection of energy storage of different durations over the next few years.
The general conclusion in this article is that short-duration storage is now eligible to provide almost all market and utility services. Currently, lithium-ion batteries have lower installed costs and development risks than many large-scale, long-duration energy storage technologies. In the United States, this is due in large part to a focused effort in wholesale market design over the past decade to facilitate entry of smaller, short-duration storage devices, due to the high initial costs of these resources. These efforts have largely been successful. Hence, coupled with declining costs, these short-duration storage projects have a first-mover advantage. Unless there are unforeseen changes to the market, by the time new long-duration energy storage comes online, it may have less potential economic value (although this could be offset by continued renewable penetration) and it will need to be justified with fewer operational and reliability service opportunities and associated value streams. As will be discussed, short-duration energy storage will potentially capture most of the available energy time-shift value and will continue to expand into the ancillary service markets and possibly saturate them alongside other sources of flexibility. Most of the initial opportunities for storage as “peaking” capacity resources may also be taken by short-duration storage. The high-value potential for long-duration energy storage will thus probably come as regions moving into much higher renewable penetration and decarbonization scenarios with much more displacement of fossil energy resources. Analysis of those system conditions is more uncertain, but at the minimum should consider sensitivity analysis including significant quantities of short-duration energy storage in the baseline resource scenario prior to considering additions of long-duration storage.1 There are very few such analyses to date, but research has begun. While simulation studies can provide insights, there also needs to be attention to policy and market designs, including the appropriate types of financial incentives and long-term contracting, which can support entry of long-duration storage under these scenarios, as otherwise, other solutions which do have such support will be favored.
The article is organized as follows. The first section provides background information on the current distribution of energy storage around the United States and selected literature review relevant to this article. The next four sections focus on each primary category of storage service and examine the evidence on the potential for short- and long-duration storage, as well as on the expected penetration of these types of storage over the next decade. The sixth section briefly notes the other clean energy resources which provide flexibility that may compete with storage. The seventh section examines how different policies are driving the market for short- and long-duration storage, and including different types of long-duration storage. This is followed by conclusions and researchable topics.
Background and Literature Review
The starting point for considering opportunities for long-duration energy storage is to review the state of existing energy storage in the United States and then survey how current studies forecast the storage market evolution. Following this review, we turn to the specific elements of storage value. Table 1 shows the current distribution of energy storage resources which are registered as electric power resources by the United States region as of late 2019.2 Across the country, PSH remains the largest energy storage resource as measured by installed capacity (MW) by a significant margin and also provides much of the energy capacity (MWh) currently available. The EPRI (2019b) provides figures showing how the capacity factors on the PSH plants have varied over the past few years. Many of the existing PSH plants have substantial unutilized capability, about which there are further comments below. The table also shows that the United States now has over 1 GW of batteries in commercial operations as electric power resources, primarily lithium ion; about 75% of these have duration of less than 1 h, but the remaining 25% have duration of 4 h or slightly more, especially those located in California. The expansion in batteries began around 2010, with steady, but small, increases over the next decade.3 However, in California, several large projects are expected to come online over the next 2 years, which will change this trend. Among the other types of energy storage in operation are short-duration flywheels, one long-duration compressed air energy storage (CAES) plant, and a large concentrating solar power with thermal energy storage (CSP-TES) plant (another large CSP-TES plant shut down in 2019 and appears unlikely to restart). Figure 1 and Table 2 show how these resources map into the organized wholesale markets operated by U.S. independent system operators (ISOs) and regional transmission organizations (RTOs)4; this is relevant because most storage resources monetize wholesale market benefits to justify their project investment in ISO and RTO regions. It also illustrates what other types of energy storage are already available in those regions, notably PSH, as the resource mix changes.
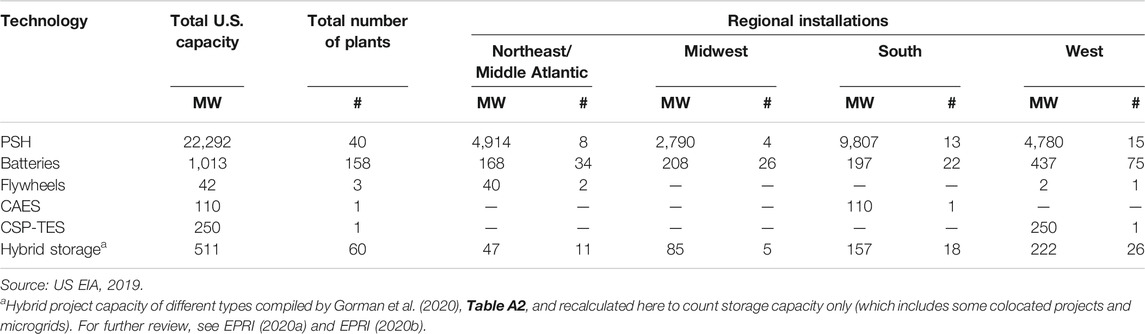
TABLE 1. Distribution of energy storage in operations as electric power resources by United States region, September 2019.
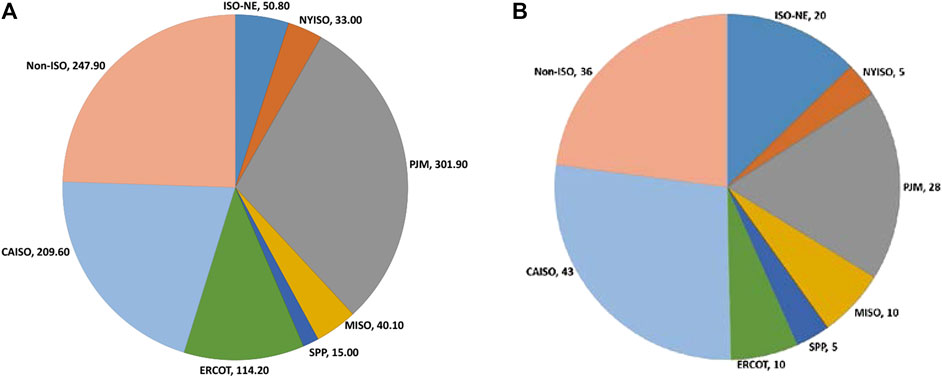
FIGURE 1. Cumulative battery energy storage systems operating as electric power resources by ISO in September 2019, categorized by (A) installed nameplate capacity (MW) and (B) number of installations.
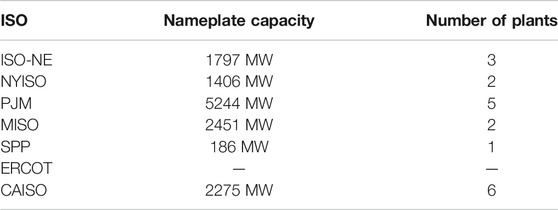
TABLE 2. Pumped storage hydro capacity (MW) operational by ISO, 2019.
To achieve the targets set by various states (as described below) and estimated in commercial forecasts, the rate of storage deployment will have to increase very rapidly over the next 5–10 years. When forecasting the future opportunities and sources of value of short- and long-duration storage, power system simulation is necessary because several relevant factors will be changing simultaneously on the power grid, including penetration of variable energy resources (wind and solar), retirement of conventional generation, utilization of existing storage and entry of new storage, demand side resources, and factors such as comparative fossil fuel prices and the design of greenhouse gas emissions reduction mechanisms (e.g., tradable permits and carbon taxes).
Future Scenarios
As will be discussed later in this article, new long-duration energy storage is not supported by the wholesale market prices or the operational or reliability conditions currently prevailing in the United States, but rather is primarily justified under future scenarios. There are an increasing number of high–renewable energy studies and decarbonization studies which either endogenously or exogenously evaluate large increases in different types of energy storage with different power and energy capacities over the coming decades (EPRI, 2020b). Endogenous planning models select new storage resources when the net costs are justified according to the parameters and constraints in the model. While many earlier studies of this kind used research models (e.g., Mills and Wiser, 2014), selection of storage with significant capacity is also beginning to be more common in capacity expansion modeling used for utility resource planning which utilize commercial tools (e.g., SCE 2018; CPUC 2020; survey in EPRI, 2020b). In contrast, most earlier studies of storage penetration and valuation added storage resources exogenously for analysis of costs and benefits, including to minimize renewable curtailment.
Within the baseline case of any wide-region simulation of future scenarios should be the utilization of the existing long-duration energy storage, which is mostly PSH. Most studies of future energy storage operations have not fully evaluated the latent capability of the existing PSH plants. There are a few exceptions. Bloom et al. (2016) modeled the entire Eastern Interconnection with 10–30% renewable penetration scenarios and found that the existing PSH did increase operations from a baseline and more so in the higher solar penetration scenarios. Hence, to the extent that there is a growing value of energy time-shift (as discussed below), we can expect the existing PSH to capture some of it. At the same time, the anticipated influx of higher roundtrip efficiency and faster responsive batteries will likely take some of the wholesale market opportunities currently fulfilled by PSH, notably frequency regulation and other ancillary services (Eichman et al., 2015).
A large number of early long-duration storage expansion studies evaluated additional PSH in different U.S. regions; while these typically illustrated some degree of resulting benefits, they also did not assume the entry of a large quantity of short-duration storage at the same time (e.g., Koritarov et al., 2014; Tuohy and O’Malley, 2011).
California has had the most studies of storage in the future resource mix. Mills and Wiser (2014) developed a type of capacity expansion model to examine high renewable penetration scenarios in California in 2030. With 3.5 GW of existing PSH in the baseline resource mix, the model endogenously builds between 3.3 and 9.8 GW of long-duration (10 h) energy storage at levelized capacity costs of $140/kW per year, depending on the renewable penetration scenario (up to 40%). Similarly, Southern California Edison (SCE) reported in its 2018 Integrated Resource Plan (IRP) (SCE 2018) that its modeling selected around 10 GW of additional energy storage by 2030 for its California-wide analysis of about 60% RPS. Denholm and Margolis (2018) modeled even higher storage selection, from 15 to 28 GW which was added exogenously, in California 2030 scenarios up to 50% of energy from solar generation to facilitate integration.
The recent 2020 IRP modeling by the California Public Utilities Commission (CPUC) (2020) finds a wide range of added energy storage across 2030 and 2045 scenarios, with an aim for very high renewable penetrations of up to 100% and with significant capacity of batteries added in tranches over this period with durations of up to 3–8 h. The later years elicit longer battery durations. There is also some limited selection of PSH with 12-h duration.
One of the research topics most relevant to this article is how different renewable portfolios affect the duration of energy storage which might be cost-effective. Denholm and Mai (2017) evaluated different portfolios of variable energy resources and energy storage using a dispatch model of ERCOT in 2050. These included three 55% renewable energy scenarios which varied the amount of wind and solar energy: “Wind Vision” (44% wind, 11% PV), “Minimum curtailment” (37% wind, 18% PV), and “Equal mix” (27.5% wind, 27.5% PV). They analyzed the effect of 4-h and 8-h storage in reducing curtailment in these scenarios and evaluated how economic value was affected depending on storage duration. Their results will be discussed further below, but a general finding is that adding storage of any duration had a greater effect on curtailment when there was more solar than wind in the portfolio.
These studies and others point to the potential for portfolios of short- and long-duration energy storage as renewable penetration increases but do not identify the commercial pathway for these storage additions.5 Further, few, if any, of the studies examine the timing of storage entry to fulfill different functions or examine how these resources would be valued on a merchant basis or justified in utility procurement. In actual resource planning and project development, these are critical questions which have a major effect on the actual storage resource mix that eventually emerges. This article does not provide such analysis directly but, in the following sections, examines the components of the storage market to evaluate whether they are more likely to be served through short- or long-duration resources.
Energy Time-Shift
Energy time-shift service (sometimes called arbitrage) may provide a substantial part of the economic benefits of a storage project. An energy storage resource will, in principle, shift energy as long as net wholesale market revenues (or net utility avoided production costs) are positive. Wholesale energy prices, or utility operational costs, vary across the day, reflecting changes in load or net load and the marginal cost of energy supply. This variation means that each hour of potential energy time-shift is not equal in value and that the incremental economic benefit to each additional hour of energy capacity declines, until it eventually trends to zero.
There are many articles on storage valuation which demonstrate this finding, and a few of the earlier published results are updated below using EPRI’s StorageVET™, a “price-taker” optimization model which is publicly available and open source (EPRI, 2018c). For purposes of this illustration, the “perfect foresight” solution is shown for a generic lithium-ion battery, which provides an upper bound on potential net market revenues, with 85% roundtrip efficiency.6 The optimization horizon was one week. The results show the annual energy time-shift revenues in $/kW per year across a range of durations, from 1 h to 20 h.
Historical Energy Time-Shift Value
This section first examines trends in energy time-shift value from 2014 to 2019 in CAISO and PJM, followed by a snapshot of all the ISO markets in 2019, and continuing with observations about forecasts. CAISO storage energy value in the day-ahead market has increased significantly in the last few years due to the effect of solar energy in suppressing midday prices, followed by the “net load” system ramps, which creates a large price spread. To illustrate, Figure 2 shows the changes in annual energy time-shift value from 2014 to 2019 the California ISO day-ahead aggregated prices for the Southern California Edison (SCE) utility transmission system zone.7 The expansion of solar energy is the primary driver improving the value of all energy storage in the CAISO energy market (although not linearly year by year). However, as can be seen in the figure, regardless of the year, the incremental benefit following the 4-h time-shift revenue estimate declines rapidly; if the 2019 results are used as an example, the 4-h result achieves 76% of the maximum potential as measured by the very long-duration result (20 h), while the 8-h result only adds another 15%.
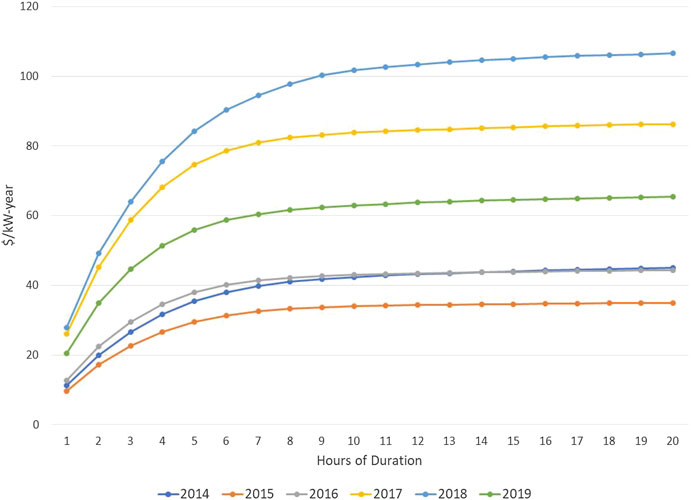
FIGURE 2. Energy time-shift value in the CAISO day-ahead market, Southern California Edison aggregated locational price, 2014–2019.
Figure 3 shows the same calculations using recent aggregated prices from PJM.8 As with the CAISO results, 4-h duration storage captures much of the potential value, with declining additional revenues as duration increases. In contrast to California, PJM’s highest energy storage time-shift value in recent years was experienced during the years with winter polar vortex weather conditions, particularly 2014 and to a lesser extent 2015 and 2018 (see also Salles et al., 2015, who evaluated 2014 PJM prices). In all these cases, most of the value took place during a few high-priced hours; in contrast, the increasing CAISO market price spreads are more consistent since they reflect a structural change in the resource mix, with the large increases in solar power. In 2019, low energy prices in PJM and milder winter conditions resulted in the lowest potential energy time-shift value in the recent years analyzed. Of note, compared to the similar assessment of earlier PJM prices by Sioshansi et al. (2009), recent years have not seen substantial changes. Because of the limited penetration of variable energy resources to date in PJM, there has been less analysis of future storage energy time-shift on a regional basis.
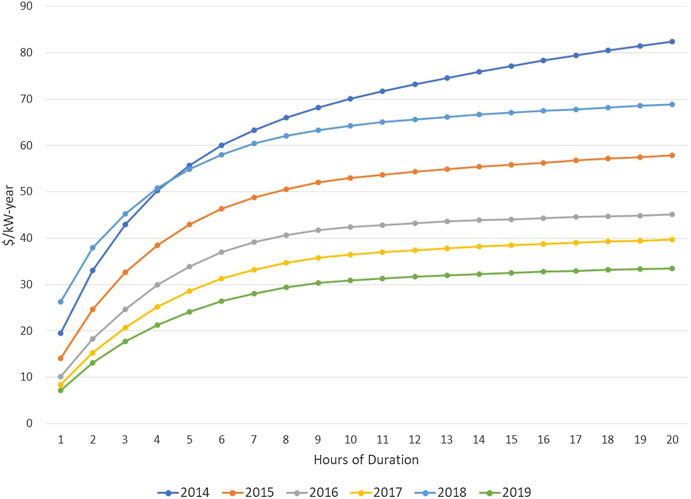
FIGURE 3. Energy time-shift value in the PJM day-ahead market, PJM-RTO aggregated locational price, 2014–2019.
Finally, Table 3 provides perspective across the seven different U.S. ISO markets (again using the same methods described above), illustrating that potential energy time-shift value for short-duration and long-duration storage in 2019 differed substantially by region due to the resource mix, supply–demand balance, and market design (the numbers for PJM and CAISO are the same as those in the figures above). In particular, the implementation of scarcity pricing in ERCOT resulted in a number of very high prices9 which resulted in the high energy time-shift valuation for storage in that year (these values were much higher than in the prior two years, and the first half of 2020 is much lower). These results suggest that in many regions, even those with substantial renewable expansion (e.g., the wind expansion in MISO and SPP), energy time-shift is not currently valuable (although not all locations in these regions were evaluated). Moreover, these results again confirm that 4 h of energy storage duration captures the majority of potential value, with some variation by region.
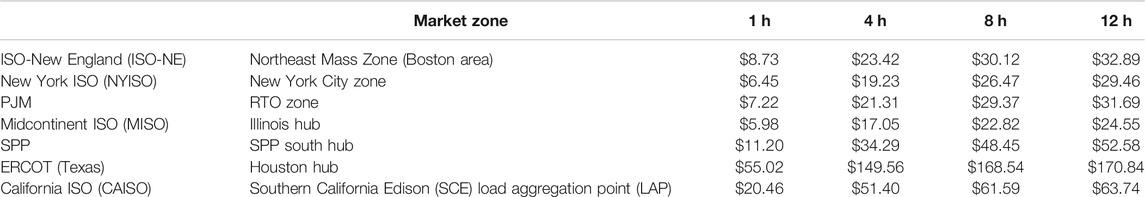
TABLE 3. Energy time-shift value ($/kW/year) in the U.S. wholesale markets in 2019, selected zones, multiple durations.
Future Energy Time-Shift Value
The general expectation based on an increasing series of simulation studies is that energy time-shift value will progressively increase over time, as a function of the portfolio of variable energy resources and other factors, such as natural gas prices and the implementation of carbon emissions policies. There is some empirical validation of such forecasts: because of the more rapid solar penetration in California than earlier anticipated, the current energy prices in the CAISO market are similar to those predicted in earlier simulation studies modeling increases in solar production in 33% RPS and 40% RPS scenarios, and, as shown in Figure 2, confirm the forecast of increased storage time-shift value in those studies (e.g., Edmunds et al., 2017; Eichman et al., 2015).
However, at least in California, there has not yet been evidence of substantially increased energy time-shift benefits for long-duration storage until even very high renewable scenarios. Eichman et al. (2015) found that added duration did not result in significantly higher energy time-shift value to energy storage assets.10CAISO (2017, 2019b) evaluated the addition of new long-duration PSH in 50% RPS scenarios, with 1.325 GW of battery storage under the state’s energy storage mandate in the baseline when measuring benefits. They found a range of outcomes for potential production cost reductions11 and retention of curtailed renewable energy with long-duration energy storage additions. However, they did not measure the benefits already captured by the 1.325 GW of other shorter duration storage. In other words, they did not evaluate how much greater the value of the PSH would have been if shorter duration storage had not been deployed. Overall, they did not conclude that the PSH was justified under a cost–benefit analysis, even when capacity benefits are considered (as discussed further below).
While we reviewed recent PJM energy time-shift results above, there has been less long-term analysis of the region which can be used to assess how energy storage of different durations will benefit as system conditions change. Bloom et al. (2016) measured the change in operations to the existing PSH in the region in 10–30% renewable energy scenarios and found increased utilization but did not consider types of new storage with other durations.
As noted above, there has been some other useful preliminary analyses of how the energy time-shift value of storage of different durations will be altered in higher penetration scenarios in other regions (e.g., Denholm and Mai, 2017; survey in EPRI, 2020b). Across these studies, the basic finding is that in most future scenarios, additional hours of duration add diminishing benefit to the energy time-shift value, while the added storage duration generally results in higher installed costs. It should be noted that most projects will provide multiple services, including, as discussed below, resource adequacy capacity, so the additional value of provision of these services should be considered when optimizing storage system duration. But to date, there is only limited analysis which can be used to investigate the timing of entry by storage technologies of different durations.
Ancillary Services
Ancillary services encompass several categories, including the contingency reserves and frequency regulation, now procured through bid-based markets by ISOs. They also include primary frequency response, which until recently was an inherent property of committed synchronous generation but is now being procured as specific reserves in many regions, and the two classes of services typically procured through cost-based rate formulas or other solicitations—voltage control and black start. A recent review of these ancillary services and trends in market prices can be found in EPRI (2019a). This section does not delve into the technical details of these services and the various market designs, but rather aims to identify the specific factors which may affect entry of short-duration relative to long-duration energy storage.
Each of these ancillary services have been supplied by PSH for decades (and in some cases, these plants have been major regional suppliers), while lithium-ion batteries and flywheels have been participating in frequency regulation markets more recently. Ancillary services are often indicated as a significant future source of economic value for energy storage as energy storage.
The question of which types of energy storage will prove most successful as providers of ancillary services over time has several factors. These include the size of the potential market in each region, the minimum size requirements for eligible storage resources, the minimum continuous energy they are required to provide, rate of response, and other factors which may advantage certain technologies over others, such as performance payments and control signals which facilitate utilization of shorter duration devices. FERC Order 841 (FERC, 2018) has established several new requirements for energy storage participation in the ancillary service markets which will advantage smaller, short-duration resources. Most notable among these is the requirement that the markets allow participation by resources as small as 100 kW. In addition, other types of supply and demand resources will compete with energy storage generally, as discussed further below.
Table 4 summarizes the current average hourly procurement quantities (MW) of the key ancillary services in the U.S. ISOs which are provided by energy storage, presented to give a sense of the scope of the market. Where there is a range, it means that the ISO procurement varies by hour. The table also shows the average prices ($/MW/hr) for selected market-based ancillary services in 2019.12 There are other features of these markets which are not shown in the table, for example, contingency reserves typically have a minimum locational reserve requirement for spinning reserves and procurement of reserves may have a locational requirement. As discussed further below, primary frequency response is not currently a specified reserve market in any region, except ERCOT; instead, it is mostly provided as uncompensated headroom on committed synchronous generation. Readers should refer to EPRI (2019a) for more details.
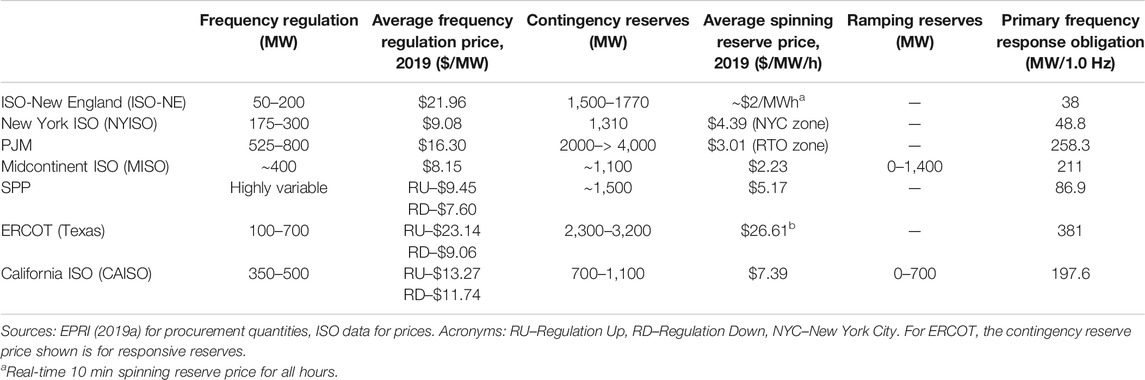
TABLE 4. Ancillary service procurement quantities (MW) and selected prices ($/MW) and other obligations in U.S. ISOs, recent years.
Frequency Regulation
Frequency regulation (called simply regulation in most U.S. markets) is generally the ancillary service with the highest market prices (see Table 4) and also with some compensation for performance measured as mileage. As such, frequency regulation has been the first market supplied by batteries and flywheels in the United States, due to fast response and high roundtrip efficiency. Several of the existing PSH are also suppliers of frequency regulation and, in some cases, could provide much of the market requirements during their generation hours if so utilized.13
We anticipate that within a few years, most of the frequency regulations in the United States will be provided by lithium-ion batteries. The PJM market has experienced the most battery entry to date, experiencing as high as 40% market share in some years, before a slight subsequent decline due to a number of factors.14Table 5 summarizes some of these details. In addition to PJM, there are batteries participating in most of the frequency regulation markets around the country, and significant entry into this service is beginning in CAISO (CAISO, 2019a). Based on results not shown here, we estimate that when batteries provide both energy and frequency regulation in CAISO from 2017 to 2019, their market revenues would have been 2–3 times the energy-only revenues, as shown in Figure 2. Since the frequency regulation markets have limited quantities (see Table 4), lower prices may be expected over the coming decade as more battery storage resources enter and displace conventional resources. In summary, short-duration energy storage has near-term advantages in frequency regulation markets, and any new long-duration storage, while eligible, should anticipate that there will be rapid declines in the value of this service over the coming years.
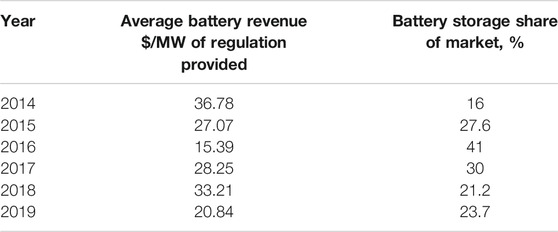
TABLE 5. Battery revenues and market shares in the PJM regulation market, 2014–2019.
Contingency Reserves
Contingency reserves are currently supplied by many of the existing PSH, both in pumping and generation mode, and could also be provided by both new short-duration and long-duration energy storage.15 The primary feature of contingency reserves that differentiates storage resources is the minimum continuous energy required of each resource. When the predominant suppliers were conventional generation and hydropower (including PSH), this energy requirement was formerly one or more hours; however, in recent years, this has been reduced to 30 min in several regions (EPRI, 2019a, Section 2.1). Hence, there are few remaining barriers to short-duration energy storage providing these services aside from low market prices (or utility value) (see Table 3). For example, when we calculated the added value of spinning reserves to a 4-h storage project in the CAISO markets from 2017 to 2019, it only adds between 10% and 90% additional value to the energy time-shift value shown in Figure 2 (much lower than frequency regulation). In addition, most contingency reserves are procured over large zones, and eligible resources may typically be located anywhere in the zone (where there are not deliverability restrictions). Therefore, there is no specific differentiation in these services for storage resources with greater hours of energy duration, and the growing penetration of short-duration energy storage is expected to provide increasing amounts of this service (as well as other types of clean energy resources discussed further below).
Primary Frequency Response and Inertial Response
Primary frequency response is a quantitative obligation for each ISO and for large utilities in the United States (NERC, 2017). The purpose of this service is to arrest frequency deviations and sustain response until other reserves can be dispatched to restore frequency (see, e.g., EPRI, 2019a), typically for several minutes. Requirements for eligible resources are very short duration with the ability for an autonomous response, within milliseconds to seconds. The responsive range associated with these requirements are summarized in Table 4 and, to date, are fairly low on a regional basis with the exception of ERCOT. Until recently, this requirement was met mostly from committed synchronous generation and in some regions, demand response; FERC Order 841 requires that rules are established for energy storage participation. Only ERCOT has developed a wholesale market product to fulfill this requirement; in the other ISOs, there is still sufficient inherent capability in actual operations to meet these needs.
With respect to energy storage attributes for primary frequency response, it is well suited to short-duration battery storage with advanced inverters that have autonomous frequency-watt response functions. At the same time, large synchronized storage resources such as PSH or CAES also provide this service. In addition, there many other potential suppliers. Hence, these services are unlikely to be a major source of economic benefits for future new long-duration energy storage.
Ramping Reserves
Ramping reserves—also called flexibility reserves (EPRI, 2019a)—are reserves held in system operations to address forecast uncertainty relating to real-time intra-hourly system ramps, which are primarily due to increasing production variability. To date, these reserves have been implemented by CAISO and MISO and are largely supplied by conventional thermal generation and hydropower and, to a lesser extent, demand response. In both ISOs, the time duration for these reserves is dispatch intervals which range from five to 15 min, with no additional continuous energy requirement yet established apart from the scheduled energy schedule. Hence, this service, as currently defined, can be equally supplied by short-duration and long-duration energy storage. However, due to the active charging and discharging required, state-of-charge management is more important for this service than others. Short-duration energy storage, by definition, has less total energy stored, and state-of-charge management is thus affected more by uncertainty about future dispatch opportunities. As a result, there may be an economic and operational benefit to having long-duration storage for such reserves, but the long-term value is not clear.
Voltage Control
Voltage control is provided by injection and absorption of reactive power at specific locations on the transmission network. The ISOs procure this service using formulas which can combine cost-of-service and energy opportunity costs (EPRI, 2019a). Voltage control can require different response rates depending on whether the application is static (more or less continuous) or dynamic (in response to contingency events). Depending on the transmission system circumstances, this service may be provided by volt-VAr or volt-watt functions. This means that the service may require minimal or even no real power, and therefore, there is no apparent advantage for long-duration energy storage. Further, voltage control can be provided by advanced inverters, meaning a wide range of new resource types such as wind, solar, stand-alone batteries, and hybrid resources will be capable of providing this service, in addition to the remaining conventional generation and even some transmission technologies. Hence, there is unlikely to be of substantial value to future long-duration energy storage in voltage control.
Black Start
Black start is a site-specific ancillary service to support restoration of generation and transmission resources after a blackout. Black start requires sustained response of minutes to hours to allow for the start-up and resynchronization of generators with the power system. Black start is currently being provided by some existing PSH, and a few short-duration batteries have been developed on the premise that they can help black start conventional generation. There is the expectation that as thermal generation is retired, this service may need new types of resources able to provide long-duration supply and possibly new types of compensation mechanisms (FERC/NERC/Regional entities, 2018). However, it will take years to reach this point, and even in regions such as California, with rapid decarbonization policy objectives, there is interest in maintaining substantial natural gas resources to provide reliability for an extended period of time which could inhibit the development of other new black start resources. Hence, this service is a promising opportunity for future long-duration energy storage but is not likely to be a major source of economic benefits for some time.
Resource Adequacy Capacity
Resource adequacy (RA) refers to the capability of the set of grid-connected resources and demand response in any utility or larger region to meet peak loads while maintaining reserves within a reliability standard, the most common of which is one outage every ten years (see, e.g., Pfeifenberger et al., 2013). All U.S. regions, with the exception of Texas, maintain an RA requirement established by state regulators or regional reliability bodies. Currently, these requirements are commonly aimed at the four or five contiguous hours when peak loads are likely to be experienced, but in some regions, this duration may be greater. In the United States, the general approach is that each load-serving entity must provide a demonstration that it has sufficient capacity to meet these requirements. In some regions, this capacity is procured through a centralized capacity market with transparent prices, whereas in others, it is primarily self-provided or procured through bilateral contracts which are reviewed by the relevant regulatory entity.16 As a general rule, the market price for capacity is a function of the demand–supply balance in the zone being considered. For example, in PJM, capacity procured for delivery in the 2021/2022 compliance period on average cost $56.25/kW per year (Monitoring Analytics, 2020), but with substantial variation by zone. As another example, in NYISO, the capacity price in 2019 in the New York City zone was $103.68/kW per year, while in other parts of the state, it was around $30/kW per year (Patton et al. 2020). In both these cases (and in any other region), the capacity payment would be additional to the energy revenues shown in Figure 3 or Table 3, as well as any revenues for ancillary services. Where capacity prices are zonal, the capability to site projects in higher capacity value locations is thus an important differentiator between storage technologies. The exception to this in the United States is Texas, where the state regulators have determined that resource adequacy should be maintained instead through the energy markets, by allowing energy prices to rise sufficiently to support new entry of capacity (sometimes called an “energy-only” market).
Current Rules for Energy Storage Capacity Ratings
Similar to energy time-shift, RA capacity is a service for which the energy duration requirement required to qualify energy storage as capacity resources is in part a function of the power system load or net load shape and the resource scenario being evaluated. Each eligible capacity resource (whether generation, demand response, storage, or hybrids/aggregations) is given a rating or credit (sometimes called capacity value) which determines the amount of the unit’s installed capacity or seasonal capacity rating17 which can be counted toward resource adequacy requirements. For conventional generation, these ratings are a function of expected forced outage rates, ambient temperature–based derating, and any fuel limitations; for hydropower, they are based on a forecast of the period’s water availability; and for variable energy resources and energy storage, which have variable or limited energy, through a probabilistic calculation called the effective load carrying capability (ELCC) which is a function of forecast production profiles, load shapes, and resource penetration. With respect to storage, most existing PSH are capacity resources and are counted by the relevant regulatory entities toward the regional requirements. More recently, most regions have initially established the maximum production over 4 h as the capacity rating for new energy storage (see review in EPRI, 2020a).18
Forecasts of Energy Storage Capacity Ratings
As the power system is reshaped by renewable penetration over time, the need for capacity resources will be adjusted accordingly and longer duration energy storage may have the opportunity to substitute for retiring thermal generation with higher capacity factors. However, this degree to which this might occur, and its timing, is the subject of current research. For the determination of the duration of energy storage needed to meet the system requirements, the first step is to evaluate the load and resource scenario being analyzed. Denholm et al. (2019) survey the regional load shapes around the United States and evaluate the potential contribution of 4-, 6-, and 8-h storage durations. They demonstrate that the analysis of phased entry of storage with different durations and considering interactions with penetration of variable energy resources are necessary for improved policy and commercial decision-making. They find substantial opportunities around the country for an initial set of 4-h storage projects, but that 6- and 8-h projects are then required for storage to continue to provide RA capacity. Other recent studies have continued to clarify these findings using additional modeling methods, but they also point to the need for continued research. For example, Carden and Wintermantel (2019) similarly find that in high solar penetration 2030 scenarios in California, energy storage with 4-h duration can obtain over 90% capacity rating with storage comprising about 20% of peak load capacity; however, capacity rating of new 4-h storage additions drops to 0% when storage comprises close to 80% of peak load. Other studies reviewed in their study suggest even more rapid declines in the ELCC of 4-h duration storage.
The general takeaway from these emerging studies is that most power systems can support fairly large penetrations of 4-h storage as capacity resources prior to a substantial reduction in capacity ratings. However, if the transformation of the U.S. power system continues primarily through expansion of renewable generation, then longer duration energy storage will be needed to qualify as capacity resources. The timing of this transition will be difficult to forecast. For example, in California, there has recently been additional consideration of maintaining substantial capacity of natural gas–fired generation for a longer period, even at very low capacity factors, as capacity resources; these types of decisions postpone the need for new long-duration storage. There is also a revived interest in hydrogen fuel to address long-duration grid applications. This analytical task has only begun in recent years and will determine whether and when long-duration storage becomes an integral component of the capacity mix.
Other Applications
There are a number of other applications for energy storage which will influence the opportunities for storage of different durations. Transmission and distribution (T and D) deferral is a growing application for energy storage, whether stand-alone or aggregated with distributed energy resources as “non-wires alternatives.” These types of projects can either be developed as T and D only (e.g., to provide peak shaving on a transformer) or as multiple-use applications in which any otherwise unutilized capacity on the storage or aggregated DER installation is also used to provide other services. The duration of storage required will thus be project- and location-specific. While some PSH and CAES projects have been evaluated for their transmission deferral and congestion relief benefits (e.g., Koritarov et al., 2014), these applications are likely to have limited opportunities, given these technologies’ siting limitations, compared to batteries which can be sited in any location identified as having such a need. Additionally, transportability of battery technologies may also add viability to this application, so that a single project may support multiple T and D deferrals over the course of the project life.
In the first round of analysis of “non-wires alternatives” by utilities and ISOs in the United States, conventional T and D upgrades are still typically predominating as the lowest cost solution, although a few battery storage projects have moved forward in California and New York. Hence, while these types of projects are not generally suited to site-specific long-duration storage such as PSH and CAES, at present, they also appear unlikely to provide another point for major battery storage entry in the near term.
Finally, another type of application for energy storage and microgrids which may incorporate storage recently obtaining greater attention in the United States is to support power system resilience and outage restoration. Such projects have been advanced in California, in response to electric power outages due to wildfires, and on the Atlantic coast to maintain power to critical infrastructure following large storms. In all these instances, the duration of storage which is required and cost-effective is a function of the project being evaluated.
Competition from Other Clean Energy Resources
One of the unique features of energy storage is that unlike generation and transmission, it has not historically been necessary to the operations or reliability of power systems; rather, it has been utilized only where economically justifiable. In principle, many clean energy supply and flexible demand will compete with energy storage to provide the services described above. For example, with advanced inverters, wind and solar plants can provide all the ancillary services listed above, with the exception of black start and, indeed, are already providing these services in certain markets. Further, as the cost of renewable energy continues to decline, it will cost less to hold some reserves on these projects to provide ancillary services. Moreover, if renewable energy is subject to curtailment on a persistent basis (as is already the case in some regions during certain times of year), those reserves may have no opportunity cost and prices will be low or zero.
The development of renewable energy portfolios themselves will have a major impact on storage energy benefits. Generally, the higher the future curtailment rates, the more potential benefit there will be to energy storage. However, for any target level of aggregate renewable energy, there can be a range of different portfolios of renewable generation technologies which affect the resulting curtailment. Hence, how these portfolios evolve will itself have a major impact on the value of short- and long-duration storage (e.g., Mills and Wiser, 2014; Denholm and Mai, 2017).
On the demand side, demand response with or without storage can shift consumption and provide operating reserves and capacity. In some ISO regions, demand response already provides around 10% of capacity needs, and in one case in ERCOT (Texas), it provides 60% of the primary frequency response requirement (Helman, 2020).19 There are many technical studies which identify significant further potential for responsive load (e.g., LBNL, 2017). If retail rate reforms encourage more dynamic real-time pricing, then shifts in consumption to better align with system conditions and market prices will also provide substantial energy time-shift. There are only a few research studies to date which explicitly examine how these other solutions may compete with energy storage (e.g., Mills and Wiser, 2014), but we can expect more attention to these options as clean energy targets increase. These will further impact storage value over time.
Policy, Regulatory, and Planning Drivers
One of the aspects of the evolving market for energy storage around the United States is the impact of different federal, state, and (in a few cases) regional policies and regulations which are driving specific storage technologies and applications. The issue of storage technology eligibility to receive different types of policy support—in the form of mandated storage procurement, direct financial incentives, adaptation of other policies, and other factors—is obviously analyzed closely by the relevant regulators and market stakeholders, but the collective impact on different technology types has not been fully evaluated. As discussed below, the most obvious impact of these policies to date has been to create additional barriers in the near term to PSH; other impacts on long-duration storage generally are also reviewed.
State Storage Policies
As of this writing, six U.S. states have established policies with targets to specifically advance development and procurement of energy storage.20 Most of these policies specifically exclude PSH because it is a mature technology and also because the large size of most viable projects would take up most of the policy target.21 In addition, when utilities are the designated buyers, they are generally required to demonstrate cost-effectiveness, which, at least initially, drives procurement to lower cost, shorter duration resources, unless otherwise allowed by regulators. As a result, the vast majority of resources procured to date around the country have been lithium-ion batteries with durations of 4 h or under (this observation is based on the projects already online as well as those known to have approved contracts). In California, where the first tranche of 4-h batteries were procured to meet regulatory requirements, this duration was specifically chosen so that these storage systems could be eligible as capacity resources. Hence, state storage policies have created biases toward procurement of certain storage technologies for compliance, and this has, at least initially, advantaged short-duration over long-duration energy storage. As state policies can change over time, this is a topic worth reviewing periodically.
State Clean Energy Standards
For many years, states have been driving clean energy investment through clean energy procurement standards, such as renewable portfolio standards (RPS). As these are being adapted to the declining cost of batteries and the changing value of certain renewable resources due to higher penetration (such as solar power in California and wind in Texas), the rules are being changed to facilitate installation of solar and/or wind plus storage resources (often referred to as hybrid resources). Most of these programs require that any energy storage is charged only from renewable generation, which specifically excludes stand-alone storage. In California, the majority of resources in the CAISO and utility interconnection queues are now hybrids of solar energy coupled with storage, though storage duration of these planned installations is difficult to determine as power capacity is typically the only data available. The storage components typically add 4-5 h of duration. It is anticipated that these hybrid projects are likely to continue their expansion as renewable energy is a better understood and established asset for procurement and financing than stand-alone storage, with significantly less risk from uncertain future market revenues. Depending on the configuration and evolution in the rules, these projects may be able to provide other services, such as ancillary services, further removing potential sources of value for long-duration storage from these markets. The impact of such projects on stand-alone storage value over time, whether short or long duration, has not yet been subject to extensive analysis.
State Policies to Advance Long-Duration Storage
A few states, including California, Montana, and Virginia, have sought in recent years to offset the barriers to types of long-duration storage by enacting legislation and other programs to specifically advance PSH and, potentially, other long-duration energy storage projects. In California, the recognition that large-scale long-duration storage (particularly PSH and CAES) was excluded by the state’s initial storage policies led to a “bulk storage initiative” by the state agencies which began in 2016 (Mathias et al., 2016). In parallel, legislation was introduced to mandate and finance new PSH (although this has not yet been passed) and the CPUC has recently recommended new PSH (or other long-duration energy storage) through its IRP process (CPUC, 2020). In Virginia, clean energy legislation which included storage targets has incorporated incentives for new PSH, justified in part on the basis of local economic development (Virginia State Legislature, 2020). While these targeted policy initiatives may facilitate development of PSH and other long-duration energy storage, to date, they are minimal when compared to the policy drivers supporting energy storage more broadly, as described above, and would still need to meet cost-effectiveness review.
Resource Planning
With the implementation of policies to advance clean energy technologies, many United States states have reinvigorated integrated resource planning and distribution system planning to facilitate adaptation to these changes and to provide additional levers for state regulators to direct utility procurement. The IRPs in many states are now a primary mechanism for formulating clean energy portfolios and, increasingly, developing energy storage policies of various types (for recent surveys, see EPRI, 2019b; Cooke et al., 2019). While integrated resource planning is not intended to be biased with respect to particular energy storage technologies, there are a number of factors which may create de facto biases (as reviewed in EPRI 2019b; Cooke, et al., 2019). First, most integrated resource planning makes assumptions about comparative storage technology costs which may not be up to date regarding long-duration technologies which are not yet commercially mature (such as flow batteries), or which require more complex cost analysis, such as new PSH or CAES. Second, most integrated resource planning exercises have a 10- to 15-year planning horizon, which allows current lithium-ion battery life cycles to fit into one such planning cycle without as much consideration of declining battery capacity due to degradation and/or the need for major system overhauls. Additionally, technologies such as PSH or CAES which can operate for 40–50 years, if not longer, do not necessarily realize the value of the additional life in the planning cost–benefit analysis. Third, integrated resouce planning has a geographic focus, typically centered on the utility itself while possibly extending to parts of the surrounding region, which may exclude the locations where large-scale long-duration storage technologies requiring specific siting needs, such as PSH or CAES, are most likely to be developed. Fourth, the modeling tools for resource selection, which are typically some form of capacity expansion model, have limited capability to address energy storage operational capabilities and may not precisely distinguish between grouping large amounts of short-duration storage and selecting long-duration storage. To counter these concerns, some utilities evaluate and plan for resources which are difficult to evaluate generically, such as PSH, outside the main resource planning process (EPRI, 2019b), but these processes are often ad hoc. Hence, despite the increasing attention to energy storage, as a general matter, PSH, CAES, and other long-duration energy storage technologies are not being selected in typical utility resource planning (unless there is a policy requirement, as discussed above).
Industry Structure and Regulation
For large-scale, long-duration energy storage in the United States, there are many other barriers to advancing projects, some of which may be a function of the prevailing industry structure and other aspects of regulation in each state or region. First, since the mid-1990s, each state has made determinations about whether and how to restructure vertically integrated utilities and create competitive wholesale markets and, in some cases, retail competition. In the restructured states (with some exceptions),22 storage projects largely have to be developed and financed on the basis of shorter term bilateral contracts and forecasts of spot market revenues over time, in addition to any available financial incentives. In some restructured states, notably Texas, there has been an emphasis on ensuring that new storage projects enter based on market revenues and that subsidies or rate recovery do not distort wholesale energy price formation.
Another recent factor is that in several states, but most notably California, there is further restructuring in that the electricity loads of the large investor-owned utilities are being allowed to be disaggregated (on a voluntary basis) into community choice aggregators (CCAs). In California, CCAs are only required by the state policies to procure energy storage as a percentage of their peak loads, which appears to be leading to smaller storage projects than if there had been a large utility making project choices. These factors make large-scale projects, which may also need multiple off-takers, more complicated to finance, which particularly impacts the cost-effectiveness of capital-intensive technologies such as PSH and CAES. Where states have remained largely comprising regulated vertically integrated utilities, the large utilities can develop such projects and obtain rate recovery from customers when approved by state regulators. In sum, it is not only state clean energy policies which are shaping the markets for energy storage of different types but also the evolving industry structure and the federal and state regulatory perspective on the roles of competitive markets. A full examination of these issues is beyond the scope of this study.
Conclusion
As of this publication, most of the energy storage on the U.S. electric power system is long-duration storage in the form of PSH. These plants are generally considered reliable and adaptable to the changing operational needs on power systems. However, for the reasons described in this article, and with some dependence on the technology, new long-duration energy storage may face policy and commercial disadvantages in the next 5–10 years when compared to new short-duration storage, which is currently being provided by the growing number of deployed and planned lithium-ion battery projects, including hybrid projects. While long-duration energy storage projects may be advanced in this time frame, in some cases, due to state policy decisions, any such projects may be the exceptions, unless new technologies emerge with significantly improved cost structure or new applications emerge. Due to this, an issue which must subsequently be faced once market or power system conditions arise, which can facilitate entry of long-duration storage, is the impact of all the short-duration energy storage which are currently forecast to have been constructed. The latter will have substantially reduced market or utility value of long-duration storage once it arrives (as well as some of the value of the existing PSH).
In particular, it can be expected that the most valuable energy time-shift (i.e., the top 4–5 h), almost all ancillary services, and a substantial amount of the peaking component of the capacity markets will have been significantly captured by short-duration energy storage (as well as affected by increasing quantities of solar power and other new types of flexibility resources). In some cases, hybrid resources will utilize short-duration storage aggregated with wind and solar generation to provide these services. This will mean that longer duration storage will need to derive more of its value from services where demand, and therefore potential market revenue (or utility economic benefits), is currently more difficult to predict. These services include black start, capacity requirements which require 8 h or more of duration, reduction of curtailment at very high renewable penetration, and very long-duration storage covering multiple days, weeks, or even seasons. Without major cost reductions, the cost of building massive amounts of long-duration storage to meet these needs is likely to be prohibitive. Forecasts of long-duration storage value which do not take these considerations into account are thus likely to be highly inaccurate.
Author Contributions
UH is the primary author of this publication, with BK and JS providing smaller contributions.
Funding
EPRI funded all research and application fees.
Conflict of Interest
UH is employed by Helman Analytics, LLC.
The remaining authors declare that the research was conducted in the absence of any commercial or financial relationships that could be construed as a potential conflict of interest.
Abbreviations
CAISO, California independent system operator; CPUC, California public utilities commission; ERCOT, electric reliability council of Texas; FERC, federal energy regulatory commission; IRP, integrated resource planning (or plan); ISO, independent system operator; MISO, midcontinent independent system operator; NERC, North American electric reliability corporation; NYISO, New York independent system operator; PJM, originally an acronym for Pennsylvania-New Jersey-Maryland power pool; RTO, regional transmission organization; SPP, originally an acronym for southwest power pool.
Footnotes
1There are examples of this methodology, particularly studies of California which assume storage portfolios in the baseline which meet existing state policies prior to adding new storage. Examples include CAISO (2017, 2019b).
2This does not include behind-the-meter battery storage. For further review of the regional distribution of energy storage in the United States, see also EPRI (2020a); EPRI (2020b).
3According the US EIA, 2019, from 2015 to late 2019, the annual deployment of these grid-connected batteries was about 170 MW on average. In addition these recent projects are still small, mostly 10 MW and under.
4A useful map of the United States ISOs and RTOs can be found here: https://isorto.org/.
5In California, these are presumed to be procurements by load-serving entities under continuing state mandates. However, in states like Texas entry of new resources will have to be in response to energy market value, at least under current regulations.
6A simple adjustment to the perfect foresight solution to reflect uncertainty about the day-ahead market prices when developing market bids or schedules is the so-called “persistence” calculation, pre-packaged in StorageVET, which assumes that prior weekday prices are the indicator of the lowest and highest prices for the next weekday and prior weekend days for the weekends. Many storage valuation papers have conducted this simple calculation, and using StorageVET to evaluate these CAISO prices we find that it reduces the perfect foresight solution by 5–10%.
7The aggregated CAISO price is the SCE Default Load Aggregation Point (DLAP) price. In addition, although not shown in the figure, the value for the first half of 2020 is similar to that for 2016.
8The aggregated PJM price is the PJM-RTO price.
9For the ERCOT zone evaluated in Table 3, in the day-ahead market there were 35 hourly intervals with prices between $1,000/MWh and $5,000/MWh, and 195 hourly intervals with prices between $100/MWh–$999/MWh.
10For example, Eichman et al. (2015) utilized a storage portfolio with 2 h, 4 h and 6 h durations to meet the CPUC’s 1.325 GW energy storage mandate by 2024. They then extended the durations of each component of this portfolio by an additional 1 h and an additional 4 h. In a 40% RPS scenario tested for 2024, the 4 h expansion of the energy storage portfolio resulted in a 10% further reduction in production costs.
11Production costs incorporate unit commitment costs as well as the costs of providing energy and ancillary services.
12Note that some ISO market prices for frequency regulation shown incorporate the payment for performance, whereas in others it is an additional payment. However, the performance payments are typically fairly small. In addition, as shown in the table, some ISOs procure Regulation as a combined upwards and downwards range, whereas others procure Regulation Up and Regulation Down separately.
13As the existing PSH plants have fixed speed pumps they do not provide frequency regulation in pumping mode, but can provide contingency reserves in that mode by being available to stop pumping on dispatch instructions (that is, as responsive load). For an EPRI study, the authors have reviewed the actual contribution of one large PSH plant to frequency regulation in a wholesale market and found that it varied substantially over the year, but could be a significant proportion of regulating requirements in certain hours.
14In 2012, PJM implemented the most favorable frequency regulation market designs to facilitate battery deployment and participation, including a “fast” Regulation signal, called “RegD.” The RegD signal initially featured a 15 min energy neutral control signal and a benefits function which provides additional economic credit in market selection to fast responding resources, depending on how many were offered. As a result, almost 300 MW of battery storage, mostly with 15–20 min duration, entered the Regulation market from 2013 to 2017. Beginning in early 2017, PJM adjusted the control signal to approximately 30 min signal neutrality and put some limits on further battery storage entry into the Regulation market. In addition, market prices declined. Since then, battery storage market share has decreased. However, continued reductions in energy storage cost and emergence of additional market service opportunities are starting to stimulate the renewed entry of new batteries into PJM.
15While there are few public statistics on the share of contingency reserves provided by PSH, in 2019 PSH provided 0.8% and 0.4% of PJM’s Tier one and Tier two Synchronized Reserve requirement and 0.2% of the nonsynchronized reserve requirement, as measured in MW contribution. This is a small contribution given the large PSH capability in PJM (see Table 2). See Monitoring Analytics (2020) for this PJM data as well as definitions of the services. The authors have seen confidential data that PSH in other regional markets currently provide higher percentages of these reserves.
16PJM, ISO-New England, NYISO and MISO all have centralized capacity markets. The other ISOs do not. In California, the CPUC implements the RA program, with the CAISO providing technical input and also procuring a small amount of backstop capacity.
17Seasonal capacity rating is the total capacity a resource is determined to have in differing seasons of the year. For example, due to lower available sunlight solar installations typically have a lower capacity rating in the winter relative to the summer. Seasonal capacity ratings typically varies more drastically for renewable resources, but thermal generation, especially gas, may have differing seasonal capacity ratings as well.
18Notably, this includes all the ISO regions with the exception of PJM, which has argued for a 10-h duration requirement, and which was still being reviewed at FERC at the time of this publication.
19The 60% contribution is the component of the requirement allowed to be fulfilled by Under Frequency Relay (UFR).
20These states with large procurement targets (with the dates of the primary legislation or policy) are California (2011, 2013), Massachusetts (2017, 2018), New York (2018, 2019), New Jersey (2019), and Virginia (2020), with smaller targets in Colorado (2017) and Oregon (2018). For more details see EPRI (2020a); EPRI (2020b).
21This was the explicit reasoning in California’s AB2514 (2011) policy as implemented by the CPUC, which only allowed small PSH of up to 50 MW. Note that the initial storage procurement targets have been met in California, which in principle allows PSH or other long-duration storage technologies to be considered for any energy storage subsequently procured.
22California restructured the investor-owned utilities in the 1990s but then re-regulated in the early 2000s and for the past 10 years has largely guided resource procurement through state policies and regulatory decisions. In California, long-term contracts for renewable energy and energy storage are approved by the state regulators or public utility boards.
References
Bloom, A., Townsend, A., Palchak, D., Novacheck, J., King, J., Barrows, C., et al. (2016). Eastern interconnection renewable generation integration study (ERGIS). National Renewable Energy Laboratory (NREL) Available at: https://www.nrel.gov/grid/ergis.html
California ISO (CAISO) (2017). Benefits analysis of large energy storage, Section 6.5 in 2016-2017 transmission plan. Available at: http://www.caiso.com/Documents/Board-Approved_2016-2017TransmissionPlan.pdf
California ISO (CAISO) (2019a). 2018 Annual report on market issues and performance. CAISO Department of Market Monitoring.
California ISO (CAISO) (2019b). 2018–2019 transmission plan, board approved-updated (Section 7.2 system capacity requirements and large storage system benefits). Available at: http://www.caiso.com/Documents/ISO_BoardApproved-2018-2019_Transmission_Plan.pdf
California Public Utilities Commission (CPUC) (2020). Results of IRP modeling available via webpage on “integrated resource plan and long term procurement plan (IRP-LTPP), 2019-2020 IRP events and materials”. Available at: https://www.cpuc.ca.gov/General.aspx?id=6442459770 (Accessed March 8, 2020).
Carden, K., and Wintermantel, N. (2019). Energy storage capacity value on the CAISO system. Astrape Consulting. Available at: https://www.cpuc.ca.gov/uploadedFiles/CPUCWebsite/Content/UtilitiesIndustries/Energy/EnergyPrograms/ElectPowerProcurementGeneration/irp/2018/2019-20%20IRP%20Astrape%20Battery%20ELCC%20Analysis.pdf
Cooke, A. L., Twitchelland, J. B., and O’Neil, R. S. (2019). Energy storage in integrated resource plans. Richland, WA: Pacific Northwest National Laboratory.
Denholm, P., Jacob, N., Gagnon, P., and Cole, W. (2019). The potential for battery energy storage to provide peaking capacity in the United States. Golden, CO: National Renewable Energy LaboratoryAvailable at: https://www.nrel.gov/docs/fy19osti/74184.pdf
Denholm, P., and Mai, T. (2017). NREL Technical Report No. TP-6A20-68960. Timescales of energy storage needed for reducing renewable energy curtailment. Available at: https://www.nrel.gov/docs/fy17osti/68960.pdf (Accessed September 8, 2017).
Denholm, P., and Margolis, R. (2018). The potential for energy storage to provide peaking capacity in California under increased penetration of solar photovoltaics. Golden, CO: National Renewable Energy Laboratory.
Edmunds, T., Lamont, A., Bulaevskaya, V., Meyers, C., Mirocha, J., Schmidt, A., et al. (2017). Publication number: CEC-500-2017-014. The value of energy storage and demand response for renewable integration in California. California Energy Commission. Available: http://www.energy.ca.gov/2017publications/CEC-500-2017-014/CEC-500-2017-014.pdf
Eichman, J., Denholm, P., Jorgenson, J., and Helman, U. (2015). (NREL), Technical Report NREL/TP-5400-65061. Operational benefits of meeting California’s energy storage targets. National Renewable Energy LaboratoryAvailable at: http://www.nrel.gov/docs/fy16osti/65061.pdf (Accessed December, 2015).
EPRI (2018c). StorageVETTM v.2. Available at: www.storagevet.com
EPRI (2019a). Ancillary services in the United States: technical requirements, market designs and price trends. Palo Alto, CA: EPRI.
EPRI (2019b). Pumped storage hydro in resource planning in the United States: a survey of recent results and methods. Palo Alto, CA: EPRI.
EPRI (2020a). Program on technology innovation: energy storage in resource planning and wholesale markets—2019 survey, Part I: trends in policies, markets, and technologies that affect planning and operations. Palo Alto, CA: EPRI.
EPRI (2020b). Program on technology innovation: energy storage in resource planning and wholesale markets—2019 survey, Part II: long-term economic valuation and research needs. Palo Alto, CA: EPRI.
FERC (2018). Order 841, electric storage participation in markets operated by regional transmission organizations and independent system operators. 162 Inside FERC 61,127, 18 CFR Part 35 [Docket nos. RM16-23–000; AD16-20–000].
FERC/NERC (2018). Report on the FERC-NERC-regional entity joint review of restoration and recovery plans. Recommended Study. Blackstart Resources Availability (BRAv). Available at: https://www.ferc.gov/legal/staff-reports/2018/bsr-report.pdf
Gorman, W., Mills, A., Bolinger, M., Wiser, R., Singhal, N., Ela, E., et al. (2020). Motivations and options for deploying hybrid generator-plus-battery projects within the bulk power system. Electricity J. 33 (5), 106739. doi:10.1016/j.tej.2020.106739
Helman, U. (2020). “Demand Response in the US wholesale markets: recent trends, new models, and forecasts,” in Variable generation, flexible demand. Editor F. Sioshansi, (Amsterdam, Netherlands: Academic Press).
Koritarov, V., Thomas, V. D., John, G., Brett, B. M., Audun, B., Jianhui, W., et al. (2014). Modeling and analysis of value of advanced pumped storage hydropower in the United States. Argonne National Laboratory, ANL/DIS-14/7, Energy Exemplar, LLC, National Renewable Energy Laboratory, MWH Americas, Inc., Siemens PTI, Inc., U.S. Department of Energy.
Lawrence Berkeley National Laboratory (LBNL) (2017). California demand response potential study, final report on phase 2 results, 2017. Available at: https://www.cpuc.ca.gov/General.aspx?id=10622
Loutan, C., Klauer, P., Chowdhury, S., Hall, S., Morjaria, M., Chadliev, V., et al. (2017). NREL: No. NREL/TP--5D00-67799. Demonstration of essential reliability services by a 300-MW solar photovoltaic power plant.
Mathias, J., Doughty, C., and Kelly, L. (2016). Bulk energy storage in California. California Energy CommissionAvailable: https://www.energy.ca.gov/2016publications/CEC-200-2016-006/CEC-200-2016-006.pdf
Mills, A., and Wiser, R. (2014). Strategies for mitigating the reduction in economic value of variable generation with increasing penetration levels. Lawrence Berkeley National Laboratory.
Monitoring Analytics. (2017). State of the market report for PJM, 2016, Vol. 2: Detailed Analysis. Available at: www.monitoringanalytics.com/home/index.shtml
Monitoring Analytics (2018). State of the market report for PJM, 2017, Vol. 2: Detailed Analysis. Available at: www.monitoringanalytics.com/home/index.shtml
Monitoring Analytics (2019). State of the market report for PJM, 2018, Vol. 2: Detailed Analysis. Available at: www.monitoringanalytics.com/home/index.shtml
Monitoring Analytics (2020). State of the market report for PJM, 2019, Vol. 2: Detailed Analysis. Available at: www.monitoringanalytics.com/home/index.shtml
North American Electric Reliability Corporation (NERC) (2017). BAL-003-1 frequency response obligation allocation for operation year 2017. North American Electric Reliability Corporation.
Patton, D., LeeVanSchaik, P., Chen, L., and Naga, R. P. (2020). 2019 state of the market report for the New York ISO markets. Potomac Economics. Available at: https://www.potomaceconomics.com/wp-content/uploads/2020/05/NYISO-2019-SOM-Report__Full-Report_5-19-2020-final.pdf.
Pfeifenberger, J. P., Spees, K., Carden, K., and Wintermantel, N. (2013). Resource adequacy requirements: reliability and economic implications. Available at: http://www.ferc.gov/legal/staff-reports/2014/02-07-14-consultant-report.pdf (Accessed September, 2013).
Salles, M., Aziz, M., and Hogan, W. (2015). “Potential arbitrage revenue of energy storage systems in PJM during 2014,” in 2016 IEEE power and energy society general meeting, Boston, MA, July 17–25, 2016 (Boston, MA: IEEE), Available at: https://www.hks.harvard.edu/fs/whogan/PES_paper_09_salles_final.pdf.
Sioshansi, R., Denholm, P., Jenkin, T., and Weiss, J. (2009). Estimating the value of electricity storage in PJM: arbitrage and some welfare effects. Energy Econ. 31 (2), 269–277. doi:10.1016/j.eneco.2008.10.005
Tuohy, A., and O’Malley, M. (2011). Pumped storage in systems with very high wind penetration. Energy Pol. 39 (4), 1965–1974. doi:10.1016/j.enpol.2011.01.026
US EIA (2019). Form EIA-860 detailed data. Available at: https://www.eia.gov/electricity/data/eia860/
Virginia State Legislature (2020). Virginia Clean Economy Act, SB 851. Available at: https://legiscan.com/VA/bill/SB851/2020
Keywords: electric power system, energy storage, energy storage market, pumped storage hydropower, ancillary service, resource adequacy, energy time shift
Citation: Helman U, Kaun B and Stekli J (2020) Development of Long-Duration Energy Storage Projects in Electric Power Systems in the United States: A Survey of Factors Which Are Shaping the Market. Front. Energy Res. 8:539752. doi: 10.3389/fenrg.2020.539752
Received: 02 March 2020; Accepted: 28 September 2020;
Published: 09 November 2020.
Edited by:
Joshua Dominic McTigue, National Renewable Energy Laboratory (DOE), United StatesReviewed by:
Arnaldo Walter, Campinas State University, BrazilAthanasios I. Papadopoulos, Centre for Research and Technology Hellas (CERTH), Greece
Copyright © 2020 Helman, Kaun and Stekli. This is an open-access article distributed under the terms of the Creative Commons Attribution License (CC BY). The use, distribution or reproduction in other forums is permitted, provided the original author(s) and the copyright owner(s) are credited and that the original publication in this journal is cited, in accordance with accepted academic practice. No use, distribution or reproduction is permitted which does not comply with these terms.
*Correspondence: Joseph Stekli, anN0ZWtsaUBlcHJpLmNvbQ==