 Xinxing Liu
 Zhaoming Meng
 Nan Zhang
 Zhongning Sun
- Fundamental Science on Nuclear Safety and Simulation Technology Laboratory, Harbin Engineering University, Harbin, China
Pressure suppression containment has been adopted extensively in boiling water reactor design due to its remarkable pressure suppression capacity. To study the pressure response characteristics of the containment in the initial stage of the loss-of-coolant accident, it is necessary to build a scaling facility to simulate the prototype. Analysis of the steam mass and energy that are released from the break as well as of the steam condensation that occurs in the suppression pool is conducted, respectively, for the prototype pressurized water reactor. The suppression pipe system resistance is also scaled with a certain ratio. The length and diameter of the main pipe and the branch pipe as well as the orifice diameter are calculated. At last, the prototype and the experimental facility are modeled by MELCOR to analyze the steam mass and energy release. The results show that the containment pressure evolution trends of the prototype and the scaled experimental facility are consistent. The pressure difference exists at some times, with a maximum relative error of 4%.
Introduction
Different from the traditional large pressurized water reactor (PWR) nuclear power plants, small PWRs have been paid more and more attention due to their diversity of application and flexibility in site selection. When the loss-of-coolant accident (LOCA) happens, a large amount of high temperature and pressure coolant will be released to the containment from the break, which will cause the containment pressure to increase in a short time. In order to deal with this overpressure problem, large PWR nuclear power plants usually adopt large volume containment to slow down the pressure rise rate, while in small PWRs the containment pressure increases rapidly and reaches the safety limit value in a short time due to the compact containment vessel design. Besides, the active spray system and the passive cooling system cannot operate in time. Therefore, effective containment overpressure control measures should be introduced into the small PWR design.
Learning from the boiling water reactor (BWR) design experience, pressure suppression containment has an excellent effect in suppressing the short-term containment pressure increasing rate. Thus, the pressure suppression containment system can be adopted by small PWRs to make sure that the containment peak pressure is under the design safety limit value during severe accidents.
Due to the complex thermal hydrodynamic phenomenon of the suppression pool system, containment pressure response is influenced by many factors. Experiments should be conducted to verify whether pressure suppression containment can meet the demand for containment peak pressure suppression in the early stage of the LOCA.
Many research teams have carried out a lot of investigation work on the pressure suppression containment (Varzaly et al., 1978; Gamble et al., 2001; Yan and Bolger, 2010; Sawant and Khatib-Rahbar, 2011; Chen et al., 2012). The Marviken power plant in Sweden was originally designed and built as a boiling heavy water reactor (EPRI-NP, 1982; Marviken Power Station, 1977). Instead of being operated, the Marviken pressure suppression containment was used in performing full-scale blow-down experiments to study the containment response. Although the full-scale experiment can predict the real pressure evolution with the most limited deviation, such experiments are both costly and hard to operate. Therefore, the most acceptable methods of predicting pressure response in containment are through small-scale experimental facilities, using scaling laws to extrapolate small-scale results to full-scale conditions.
JAERI built a test facility to study containment response during LOCAs (Kukita et al., 1983), of which the lower portion of the test containment is a full-scale replica of one of the 20° sectors in an annular wetwell of a typical MARK II containment. The test facility features seven full-size vent pipes. The drywell and the primary system are represented in the same volumetric scale ratio (1:18) as the wetwell. Although the scale of the experiment is much smaller than the full-scale experiment, the same high-temperature and high-pressure of water as the BWR operating pressure and temperature are still needed in the experiment to simulate accident steam and mass release. It is still a challenge to perform such high-temperature and high-pressure experiments in the laboratory conditions.
Lappeenranta University of Technology in Finland conducted a series of experiments using PPOOLEX program to investigate suppression pool–related thermal hydraulic phenomena (Laine et al., 2013; Patel et al., 2014; Patel et al., 2016). The PPOOLEX test facility is a scaled-down test facility of Nordic type BWR containment. The 31-m³ stainless steel containment consists of two main parts: the drywell compartment and the wetwell compartment, separated by an intermediate floor. The volume of the two parts and the diameter of the blow-down pipe were just simply scaled according to the Olkiluoto nuclear power plant prototype parameters, while more scaling parameters were not given in their reports. Therefore, it could not be concluded that the PPOOLEX facility is suitable for performing containment response experiments.
Anderson et al. (1978) conducted some fundamental experimental checks of the scaling laws originally put forward by Moody (1976), which mainly deal with small-scale modeling of the vent-clearing phase in which air flows into the suppression pool. The results showed that the dimensionless pressures were in excellent agreement if the four scaling parameters were held constant. Otherwise, the enthalpy flux must be scaled using an orifice to ensure that the pressure will scale. Although these scaling laws could give some guidance in scaling facility design analysis, the main assumptions of the derivation process were based on the vent-clearing phase, which is different from the steam blow-down experiments.
In a word, the current experimental research of pressure suppression containment usually depends on large-scale facilities and prototype parameter steam source, which leads to difficulties in conducting the study in laboratory conditions. Therefore, it is meaningful to put forward some scaling laws to design a small-scale experimental facility, which contributes to the pressure suppression containment design and related analysis software validation.
In this article, a small PWR with pressure suppression containment is studied as a prototype. The break steam mass and energy release and the direct contact condensation process in the suppression pool are analyzed to obtain some main parameters that are dominant in containment pressure response. The scaled facility’s geometrical dimensions are decided by these main parameters through overall consideration. The blow-down pipe resistance of the scaled facility is arranged to be the same as that of the prototype. At last, the prototype PWR and the scaled experimental facility are both simulated by using the severe accident analysis program MELCOR. The results are compared with each other to verify whether the scaling method put forward in this article is suitable for small-scale experimental facility design.
Pressure Response Process in the Containment
A hypothetical prototype small PWR pressure suppression containment is shown in Figure 1A. The reactor is located in the containment center, which is surrounded by the suppression pool. The containment and the suppression pool are connected by several large-diameter blow-down pipes (i.e., main pipes). Along the main pipe, there are several smaller diameter branch pipes, which are submerged in water.
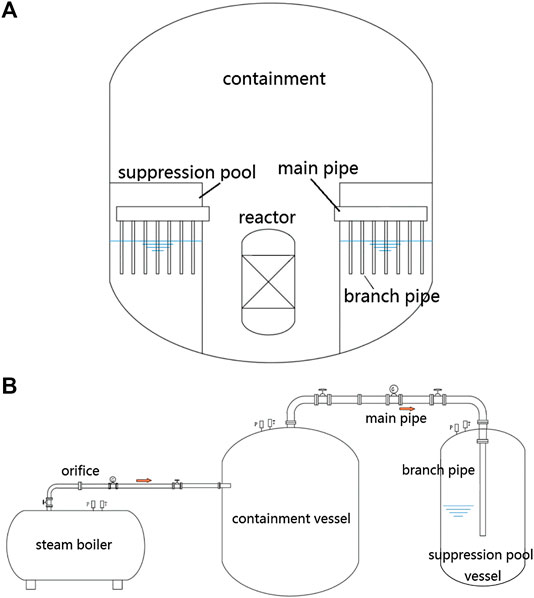
FIGURE 1. Prototype and experimental facility. (A) Hypothetical small pressurized water reactor (PWR) containment and (B) schematic diagram of the scaling experimental facility.
For the scaling experimental facility, two stainless steel pressure vessels are used to simulate the containment and the suppression pool, respectively. The containment and the suppression pool are connected by one main pipe and one branch pipe. The steam mass and energy released from the break site during the LOCA is simulated by an electric steam boiler. A schematic diagram of the scaling experimental facility can be seen in Figure 1B. The main parameters of the prototype and some predetermined parameters of the scaling experimental facility before the scaling analysis are shown in Table 1.

TABLE 1. Main parameters of the prototype and scaling experimental facility.
Taking the free volume inside the containment as the control body, the heat absorption by the containment wall and the structure is ignored temporarily, which will be compensated in the scaling steam mass and energy release (see “Simulation Results and Discussion” section below). The only two primary items that affect containment pressure are considered, which are the energy from the break and the energy transported to the suppression pool. Therefore, the rate of pressure change equation is derived as (Brown, 1999)
where V refers to the containment free volume, γ is the specific heat ratio, p is the pressure of the containment,
By normalizing with appropriate reference values (i.e.,
The following two process-specific frequencies can be obtained from the coefficients of the above equation:
Comparing the coefficients of both the prototype and the experiment, the scale ratio can be obtained as
If the pressure and the temperature response of the prototype and the experiment containment are ensured to be similar, which means
If the volume scaling ratio of the prototype and the experimental containment is [V]R = 1:200, then
Steam Condensation Process in the Suppression Pool
In the early stage of the LOCA, the water in the suppression pool is subcooled. The steam from the containment is supposed to be condensed completely in the suppression pool. For the direct contact condensation process in the suppression pool, the energy transfer process can be expressed as follows:
where Q is the total heat transferred to the condensation pool water through condensation, N is the total branch pipe number,
The branch pipe number in the prototype and in the scaled experiment is 200 (N1 × N2 = 200) and 1, respectively, which means [N]R = 200. According to the relation between the bubble radius Rb and the bubble surface area Ai, Eq. 10 can be gained:
According to the research work of Gallego-Marcos et al. (2019),
Thus,
Pipe Resistance in the Blow-Down Pipe
The pressure difference between the containment and the suppression pool can be expressed as follows:
where
In order to ensure the pressure evolution similarity between the prototype and the scaled experiment, the total pressure drop inside the blow-down pipe should be kept equal. Thus,
Because the diameter of the main pipe is much larger than that of the branch pipe, the loss due to frictional resistance of the main pipe in the prototype can be neglected. The mass flow rate in each branch pipe is assumed to be equal. Therefore, Eq. 13 can be transferred to the following form:
where f is the frictional resistance coefficient, l is the length of the pipe, and d is the diameter of the pipe. Because the Re number in the blow-down pipe of the prototype and the scaled experiment is usually large (Re > 105), the frictional resistance coefficient can be calculated as follows:
For the flat orifice, when the fluid Re number is larger than 105, the orifice resistance coefficient can be calculated by Eq. 17 (Idelchik, 1986):
where τ is only related to orifice thickness S and orifice bore diameter Dh. When S/Dh = 0.2, τ is equal to 1.22. Therefore, the orifice bore diameter Dh = 0.123 m and the orifice thickness S = 24.6 mm.
Simulation Results and Discussion
The prototype and the scaled experiment are simulated by using MELCOR, considering the heat absorption by the containment wall and the structure. The containment vessel and the suppression pool in the experiment are assumed to be well mixed due to the small volume compared to the volume of the prototype. Thus, both these parts are modeled with only one control volume. The MELCOR model nodalization of the experimental facility is shown in Figure 2. The steam boiler (CV200) and the containment vessel (CV100) are connected by a horizontal flow path (FL201). The suppression pipe (FL103) connects the containment vessel and the suppression pool vessel (CV300) and submerges below the water surface, with the bubble physics model activated to simulate the steam condensing process in the subcooled water. The main geometrical parameters and initial conditions of the FLs and CVs are listed in Table 1. The steam boiler operating parameters (water inventory and pressure) and the orifice bore diameter in the blow-down pipeline are adjusted to make the containment pressure evolution in the scaled experiment similar to that in the prototype. It turns out that the steam boiler operating pressure and the water inventory are 1 MPa and 2 m³, respectively, according to the MELCOR simulation. Besides, according to Eq. 17, the blow-down rate is controlled by an orifice installed in the main pipe, of which the bore diameter is 67 mm and the thickness is 13.4 mm. The frictional pressure drops due to material flows contain contributions from both form loss and wall friction. The form loss contribution is based on user input coefficients. In this study, the form loss coefficient is set as 8.64, which consists of the effects of bends, orifice, and sudden area change near the connections between the pipe and the vessel. The wall friction terms are computed within MELCOR, based on segment lengths and roughness input by the user.
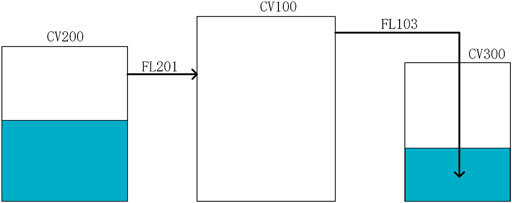
FIGURE 2. MELCOR model nodalization of the experimental facility.
Figure 3 shows the containment pressure response in the prototype and the scaled experiment. The containment pressure increases rapidly at first due to large amount of the coolant blow-down process. Then, the pressure increase rate gradually decreases after the suppression pool works. At last, the pressure maintains a stable value. The simulation result shows that the containment pressure in the scaled experiment matches well the pressure in the prototype to some extent. There is a safety injection system in the prototype, which is absent in the experimental facility. The operation of the safety injection cools the primary loop coolant and decreases steam release, resulting in a lower containment pressure in the prototype than in the experiment. Besides, the prototype blow-down process is accompanied by the core decay heat release. The continuous heat transferred to the primary coolant will change its thermal properties, such as pressure and temperature, which has an influence on the steam mass and energy release. However, these complex opposite effects cannot be simulated in the experiment. These are supposed to be the main reasons for the pressure difference between the simulation results of the prototype and the scaled experiment.
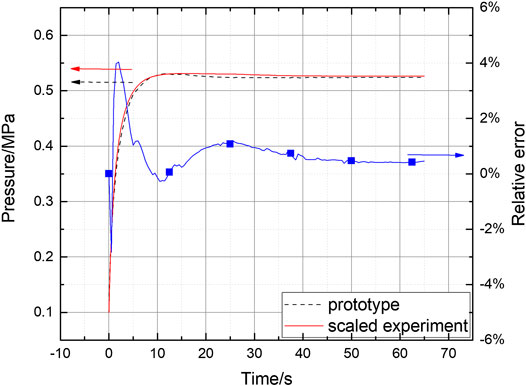
FIGURE 3. Simulation results of containment pressure.
Conclusions
In this study, a scaling analysis of the pressure response of the experimental facility for the pressure suppression containment was conducted. Three aspects including the pressure response process in the containment, the steam condensation process in the suppression pool, and the resistance of the blow-down pipe were considered to obtain the main parameters for the scaled containment pressure response experimental facility. The main conclusions could be summarized as follows:
1) Compared to the full-scale or large-scale pressure response experiment of the pressure suppression containment, the small-scale experiment, which is mainly scaled by reasonable scaling laws, is much economically feasible. The results show that the containment pressure evolution trends of the prototype and the scaled experimental facility are consistent. The pressure difference exists at some times with a maximum relative error of 4%.
2) Because the pressure response in the containment and the steam condensation in the suppression pool are influenced by many different factors, it turns out to be impossible or impractical to achieve exact dynamic similarity between a small-scale system and a full-scale one.
3) The analytical method put forward in this article can guide the pressure suppression containment pressure response experiment design. But in the actual implementation process, the main reason that leads to the deviation should be considered and relevant measures should be adopted.
Data Availability Statement
The datasets generated for this study are available on request to the corresponding author.
Author Contributions
XL and ZM contributed to the entire scaling analysis process. NZ and ZS contributed to the background information. All authors contributed to the article and approved the submitted version.
Funding
The financial supports of Heilongjiang Province Postdoctoral Fund (002150830605) and Fundamental Research Funds for Central University of Ministry of Education of China (3072020CF1503) are gratefully acknowledged.
Conflict of Interest
The authors declare that the research was conducted in the absence of any commercial or financial relationships that could be construed as a potential conflict of interest.
Abbreviations
LOCA, loss-of-coolant accident; PWR, pressurized water reactor; BWR, boiling water reactor; LUT, Lappeenranta University of Technology; RPC, rate of pressure change.
References
Anderson, W. G., Hober, P. W., and Sonin, A. A. (1978). Final Report. Small scale modeling of hydrodynamic forces in pressure suppression systems.
Brown, W. L. (1999). “Scaling of the AP600 containment large scale test facility,” in ICONE-7: Proceedings of the 7th international conference on nuclear engineering, Tokyo, Japan, April 19–23, 1999. Japan: Japan Society of Mechanical Engineers, 4252.
Chen, Y.-S., Yuann, Y.-R., and Dai, L.-C. (2012). Lungmen ABWR containment analyses during short-term main steam line break LOCA using Gothic. Nucl. Eng. Des. 247, 106–115. doi:10.1016/j.nucengdes.2012.02.012
Gallego-Marcos, I., Kudinov, P., Villanueva, W., Puustinen, M., Räsänen, A., Tielinen, K., et al. (2019). Effective momentum induced by steam condensation in the oscillatory bubble regime. Nucl. Eng. Des. 350, 259–274. doi:10.1016/j.nucengdes.2019.05.011
Gamble, R. E., Nguyen, T. T., and Shiralkar, B. S. (2001). Pressure suppression pool mixing in passive advanced BWR plants. Nucl. Eng. Des. 204 (1–3), 321–336. doi:10.1016/s0029-5493(00)00363-0
Idelchik, I. E. (1986). Handbook of hydraulic resistance. 2nd Edn. Washington, DC: Hemisphere Publishing Corporation, translation.
Kukita, Y., Namatame, K., Takeshita, I., and Shiba, M. (1983). The noncondensable gas effects on loss-of-coolant accident steam condensation loads in boiling water reactor pressure suppression pool. Nucl. Technol. 63 (2), 337–346. doi:10.13182/nt83-a33292
Laine, J., Puustinen, M., and Raesaenen, A. (2013). PPOOLEX experiments on the dynamics of free water surface in the blowdown pipe. Finland: Nordisk Kernesikkerhedsforskning Roskilde.
Lu, F., Luo, Y.-h., and Yang, S.-m. (2008). Analytical and experimental investigation of flow distribution in manifolds for heat exchangers. J. Hydrodyn. 20 (2), 179–185. doi:10.1016/s1001-6058(08)60044-x
Marviken Power Station (1977). Report MXA-1-301. Sweden the Marviken full scale containment experiments. Containment response to a loss of coolant accident: summary report.
Moody, F. J. (1976). A systematic procedure for scale-modeling problems in unsteady fluid mechanics. General Electric Company, unpublished report.
Patel, G., Tanskanen, V., and Hujala, E. (2016). Direct contact condensation modeling in pressure suppression pool system. Nucl. Eng. Des. 321, 328–342. doi:10.1016/j.nucengdes.2016.08.026
Patel, G., Tanskanen, V., and Kyrki-Rajamäki, R. (2014). Numerical modelling of low-Reynolds number direct contact condensation in a suppression pool test facility. Ann. Nucl. Energy 71, 376–387. doi:10.1016/j.anucene.2014.04.009
Sawant, P., and Khatib-Rahbar, M. (2011). Modeling pressure suppression pool hydrodynamics in the ABWR containment. Nucl. Eng. Des. 241 (9), 3824–3838. doi:10.1016/j.nucengdes.2011.07.002
Varzaly, A. M., Grafton, W. A., and Seely, D. S. (1978). Confirmatory test program, full scale condensation and stratification phenomena-test series 5707 NEDE-21853-P. General Electric Report.
Keywords: pressure suppression containment, scaling experiment, pressure response, MELCOR, pipe resistance
Citation: Liu X, Meng Z, Zhang N and Sun Z (2020) Scaling Design of the Pressure Response Experimental Facility for Pressure Suppression Containment. Front. Energy Res. 8:524445. doi: 10.3389/fenrg.2020.524445
Received: 04 January 2020; Accepted: 27 August 2020;
Published: 30 September 2020.
Edited by:
Jinsuo Zhang, Virginia Tech, United StatesReviewed by:
Khalil Ur Rahman, Pakistan Nuclear Regulatory Authority, PakistanZhitong Bai, University of Michigan, United States
Copyright © 2020 Liu, Meng, Zhang and Sun. This is an open-access article distributed under the terms of the Creative Commons Attribution License (CC BY). The use, distribution or reproduction in other forums is permitted, provided the original author(s) and the copyright owner(s) are credited and that the original publication in this journal is cited, in accordance with accepted academic practice. No use, distribution or reproduction is permitted which does not comply with these terms.
*Correspondence: Zhaoming Meng, bWVuZ3poYW9taW5nQGhyYmV1LmVkdS5jbg==