 Federico d'Amore
 Fabrizio Bezzo
94% of researchers rate our articles as excellent or good
Learn more about the work of our research integrity team to safeguard the quality of each article we publish.
Find out more
ORIGINAL RESEARCH article
Front. Energy Res., 30 September 2020
Sec. Process and Energy Systems Engineering
Volume 8 - 2020 | https://doi.org/10.3389/fenrg.2020.00190
This article is part of the Research TopicEnergy and Chemical Engineering - Outcomes from the EFCE Energy Section in the 12th European Congress on Chemical Engineering (ECCE12)View all 15 articles
Carbon capture and storage represents a key technology for reducing the anthropogenic emissions of greenhouse gases. In addition to this, carbon utilization has often been considered as a viable option for increasing the environmental benefits, while decreasing costs of the mere capture and storage system. This contribution proposes an optimization framework for the design of carbon capture, transport, utilization, and storage supply chains in the European context. Based on literature data, technologies converting CO2 into methanol and polyether carbonate polyols were selected as the most promising and incorporated into the optimization framework. The goal is to reduce 50% of European emissions from large stationary sources by 2030. Results highlight that, under our assumptions, the significance of carbon utilization in terms of a reduction of the environmental impact is likely to be a minor one: considering the current state of technologies only about 2.4% of the overall CO2 emitted from large stationary sources can be removed by chemical utilization. However, significant benefits can be obtained in terms of overall cost reduction thanks to revenues deriving from the chemicals being produced.
The anthropogenic generation of greenhouse gases (GHGs) has led to an increment of the average surface temperature, with dramatic consequences for the natural environment. The target of limiting the rise in average temperature to +1.5°C by 2050 was indicated (IPCC, 2018). In the European Union (EU), in order to comply with the Paris Agreement, it has been proposed to reduce GHGs and particularly CO2 emissions by 43% by 2030 with respect to 2005 values. Carbon capture and storage (CCS) technologies represent a promising candidate for attaining sustainable development (Li et al., 2019), i.e., an economic growth that aims at tackling major environmental issues (global warming), in an era when power and industry still massively rely on carbon and, more in general, fossil fuels.
Overall, CCS is employed to dispose the CO2 emitted by the operation of carbon intensive facilities into appropriate geological basins (CCS), in opposition to the possibility of converting it into useful products (CCU), or exploiting a combination of both sequestration and utilization (CCUS). The typical CCS scheme is composed of three echelons: capture, transport, and sequestration (IPCC, 2005). Three main technologies are currently available for capturing CO2 from the use of fossil fuels: post-combustion capture, oxy-fuel combustion capture, and pre-combustion capture (Bui et al., 2018). The concentrated CO2 flow is then purified and compressed to be transported in a cost-effective way. Finally, the third step is the injection of CO2 below the Earth's surface and its consequent sequestration. As an alternative to geological sequestration into appropriate basins, CO2 could be diverted for the use of processes traditionally fed by fossil fuels, with the aim of producing commodities while pursuing a negative carbon footprint (Smit et al., 2014). Regarding utilization pathways, different options have been highlighted as promising in attaining a reduction of the costs of CCS through either CCU or CCUS, and have been gathered into groups of mineral carbonation, chemical conversion, and biological utilization (US National Academy of Sciences, 2019). Several studies have considered the technological feasibility of different routes, among which chemical conversion has emerged as the most appropriate option (at least in techno-economic terms) for an early-stage implementation of CCU (Lehtonen et al., 2019). For instance, Alper and Yuksel Orhan (2017) recently reviewed the possible chemical conversion options for CO2 and from their analysis a broad variety of families of both pathways and products, attractive for CCUS, emerged (e.g., C1-chemicals, catalytic processes, polymers, inorganics, fine chemicals). Sternberg et al. (2017) analyzed the CO2-based production of some C1-chemicals by assessing the potential benefits in terms of lowering global warming and fossil depletion; Barbera et al. (2020) assessed the technical performance of conversion paths into C1-chemicals. Armstrong and Styring (2015) highlighted the environmental benefits achievable in treating CO2 as a commodity chemical rather than a waste product. On the other hand, other studies questioned the actual effectiveness of the chemical conversion of CO2 and indicated that only minor environmental benefits could be obtained (Mac Dowell et al., 2017).
Recently, a noteworthy research effort has laid the foundations for several studies on CCS and CCUS, which have provided a large increase in the techno-economic knowledge of each single stage of the supply chain (SC). Moreover, the necessity of investigating the design, cost, and integration of the CCS/CCUS stages for different geographic contexts and applicative frameworks has emerged (Bui et al., 2018). Several contributions analyzed, mostly through mixed integer linear programming (MILP) techniques, the design and optimization of CCS systems for different geographic contexts and scales (Table 1). Han and Lee (2012) optimized a CCS SC for North Korea through a MILP formulation under uncertainty in market prices while, again for North Korea, a subsequent contribution considered preference on risk as a measure of data uncertainty (Lee et al., 2017). Middleton et al. (2012) proposed a MILP model for CCS located in Texas that also took into account uncertainty in storage physics. Again, the response toward uncertainty in storage physics was investigated by Middleton and Yaw (2018) for the case of a CCS SC in Alberta, Canada. Another MILP CCS optimization was published for the United Kingdom by Elahi et al. (2014), which has subsequently been updated by also including uncertainty in carbon prices (Elahi et al., 2017). Again, for the United Kingdom, another MILP optimization under uncertainty in market prices and subsidies was developed by Nie et al. (2017). Similarly, Kalyanarengan Ravi et al. (2016) proposed a CCS SC modeling framework for the context of the Netherlands. d'Amore and Bezzo (2017) optimized a European CCS SC, also considering the risk of leakage related to the pipeline transport (d'Amore et al., 2018), and aspects of social acceptance and risk perception (d'Amore et al., 2020). Zhang et al. (2018) proposed a theoretical MILP modeling tool for the optimization of CCS systems under both storage physics and cost uncertainties.
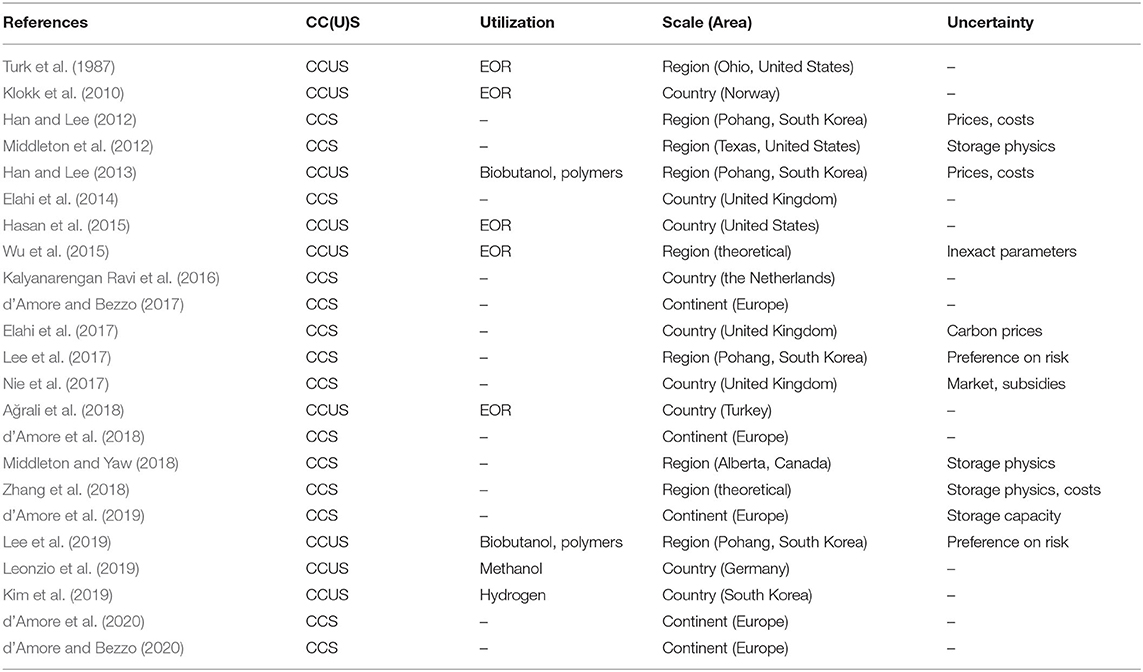
Table 1. Literature review on published contributions on SC optimization for CCS/CCUS.
The first model on CCUS SC optimization was proposed by Turk et al. (1987) and included the possibility of employing CO2 for enhanced oil recovery (EOR) in Ohio (United States). Klokk et al. (2010) adopted a similar approach for an infrastructure located in Norway. Hasan et al. (2015) in their US-wise optimization framework took again into account EOR as the only possible utilization option. A theoretical modeling framework for EOR was proposed by Wu et al. (2015), too. Ağrali et al. (2018) proposed an optimization model for CCUS located in Turkey, where again, only EOR was adopted as a carbon utilization sink. An even more limited number of scientific contributions optimize CCUS systems by considering the conversion and utilization of CO2 to generate valuable products. For South Korea, Han and Lee (2013) and Lee et al. (2019) considered the conversion of CO2 into either biobutanol or green polymers as an alternative to geological storage within a comprehensive CCUS modeling framework. For Germany Leonzio et al. (2019) optimized a CCUS SC through a MILP modeling tool that included the possibility to produce methanol as an alternative to geological storage. Finally, Kim et al. (2019) produced a MILP formulation for the integration of a hydrogen/CCUS SC in the context of South Korea.
Overall, considering the framework of modeling, simulation, and optimization of CO2 SCs, very few contributions optimized comprehensive CCUS superstructures (i.e., continent-wide) and, in particular, most of these considered only EOR as a unique utilization pathway, given its well-known practice and capability of generating profits. However, although there is great potential with EOR, it is not recognized as a viable and large-scale solution in Europe (Geske et al., 2015). On the other hand, those very few articles including other routes (such as methanol, bio-butanol, and polymers) are focused on a regional-to-countrywide level, and never address the problem of CO2 conversion and utilization at the European scale. This contribution aims at filling this gap by proposing a large-scale European CCUS SC optimization, with the main goal of addressing the echelon of CO2 conversion into useful products through a tailored design stage. Regarding the possible CO2 conversion options, major research issues remain open and need to be tackled, such as scalability and costs, especially for mineral carbonation and biological pathways (US National Academy of Sciences, 2019). This study will only take into account chemical conversion as a potential utilization route, in opposition to the mere geological sequestration into appropriate basins. The resulting MILP modeling tool will provide insights into the optimal design of comprehensive CCUS systems at a noteworthy geographic scale, to provide researchers, investors, and policy makers with a methodological framework for quantitative and strategic analysis of a range of possible alternatives for a significant decrease in European CO2 emissions.
The article is organized as follows. The modeling framework and its main assumptions will be characterized within the next section, after which the description of the MILP model will follow. Further input parameters and the complete mathematical formulation are reported in the Supplementary Material. Subsequently, the case studies and results will be presented, and the main limitations of the study will be critically analyzed and discussed. Some final remarks will conclude the work.
This contribution proposes a MILP model for the economic optimization of European CCUS SCs. Although based on a time-static architecture (to reduce the computational burden), the model is conceived to capture a fixed quota of the CO2 emissions that it is forecasted to be produced from large-stationary sources throughout the next decade (i.e., from 2020 to 2030). In particular, the SC takes into account (Figure 1):
• the location and emission of large stationary sources of CO2 in Europe, according to data provided by the EDGAR Database (JRC, 2016) and reported in d'Amore and Bezzo (2017);
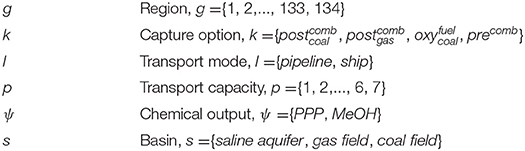
• the spatially-explicit features of the European territory, discretized through a grid g = {1,…, 134} of cells as retrieved from d'Amore et al. (2018);
• the techno-economic description through set k = {, , , precomb} of carbon capture options, that include post-combustion from coal-fired power plants, post-combustion from gas-fired power plants, pre-combustion from gas-fired power plants, and oxy-fuel combustion (d'Amore and Bezzo, 2017);
• the implementation of techno-economic parameters through set l = {pipeline, ship} of transport modes, that include both pipelines (onshore and offshore) and ships; transported flowrates are discretized through a set p = {1,…, 7} which ranges from 1 to 30 Mt/year (d'Amore and Bezzo, 2017).
• the location of onshore and offshore basins s = {saline aquifer, gas field, coal field} that are able to efficiently trap the CO2 for long term geological sequestration, according to data provided by the EU GeoCapacity Project (2009) and mapped in d'Amore et al. (2019);
• the techno-economic features of the CO2 utilization stage through set ψ of chemical outputs, which will be described subsequently.
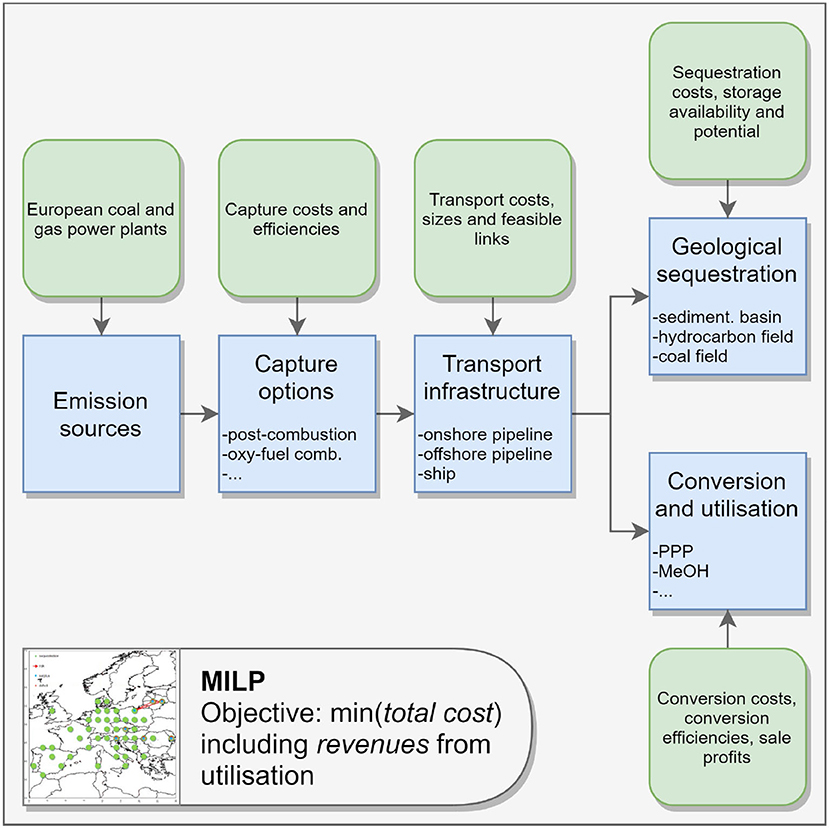
Figure 1. Overview of the proposed framework for the CCUS SC optimization.
Overall, this European CCUS model is capable of providing:
• the selection, location, scale, and cost of capture nodes;
• the definition, scale, and cost of the transport infrastructure between geographic nodes;
• the location, scale, and cost of geological sequestration nodes;
• the selection, location, scale, and profit of chemical conversion nodes;
• the final CCUS SC configuration according to the chosen European carbon reduction target;
• the differences in SC behavior according to the rates of chemical production;
• the differences in SC behavior according to national regulations on onshore storage.
This study, given the high number of potential reaction mechanisms for CO2 conversion (Aresta et al., 2013), proposes a screening of the processes according to the following principles:
• (i) minimum production threshold: a conversion path is taken into account only if the European demand for the chemical output is a relevant one; the reason for this relies on the large flowrates of CO2 (i.e., ≥ 1 Mt/year) deriving from stationary sources and consequently on the necessity of exploiting these carbon streams at scale for producing chemicals. Therefore, this model assumes that at least 1 Mt/year of CO2 should be converted in order to satisfy the market demand;
• (ii) techno-economic data availability: the maturity of the technology should be at least such that basic technical (productivity) and economic (production cost) information is available. This means that the current state of research and/or industrial application must be capable of providing complete techno-economic information on the specific conversion process;
• (iii) environmentally promising: the conversion process must produce in general less CO2 than that employed to feed it, thus, the process CO2 net balance should be negative (i.e., CO2 emissions are lower than CO2 consumption); regarding energy requirements, as detailed in the next sections, a first scenario will optimistically assume to exploit only low carbon emission sources (e.g., renewable energy, nuclear energy) to generate the additional electricity required to operate the conversion processes, while a subsequent analysis will take into account the different carbon intensities which are countrywide specific and depend on the local energy mix;
• (iv) economically promising: in order to be sustainable from an economic standpoint, the conversion process should be capable of providing a profit from the sale of the chemical output.
As a result, after excluding those products from the CCUS framework, whose processes do not meet the requirements listed above according to information found in the scientific literature (Table 2), two chemical products, i.e., polyether carbonate polyols (PPP) and methanol (MeOH), were selected and included as options for CO2 utilization in set ψ = {PPP, MeOH}. Regarding the compliance with both the minimum production threshold and the availability of techno-economic data, PPP are bulk chemicals generally employed in the production of polyurethanes and are one of the most commonly produced polymers, with a yearly world production of 9.4 Mt, of which 2.4 Mt is produced just in Europe (Covestro, 2017), whereas MeOH is one of the most versatile and produced chemicals, with a world plant capacity of 125 Mt/year and a European demand of 12 Mt/year (IHS, 2017). When studying the compliance with the environmental requirements, the chemical conversion of CO2 into PPP (with 20% weight of CO2) generates 2.65–2.86 kg CO2-eq per kg of product, leading to a GHG emission reduction of about 11% with respect to traditional production technologies (von der Assen and Bardow, 2014). Similarly, the conversion of CO2 into MeOH allows saving about 1.2 kg of CO2 per kg of MeOH with respect to its traditional production through steam reforming of natural gas (Roh et al., 2016). According to the literature, the two selected processes for CO2 chemical conversion are also promising from an economic standpoint. Regarding the conversion of CO2 into PPP, this process can be specifically designed to generate profits (Fernández-Dacosta et al., 2017), while concerning the production of MeOH, several options have been demonstrated to be economically feasible (e.g., Mondal et al., 2016; Pérez-Fortes et al., 2016; Rivera-Tinoco et al., 2016; Bellotti et al., 2017). It should be noted that the conversion into dimethylcarbonate (DMC), despite looking attractive from both an environmental and an economic point of view (Table 1), does not comply with the minimum production threshold that is imposed here (Covestro, 2017).
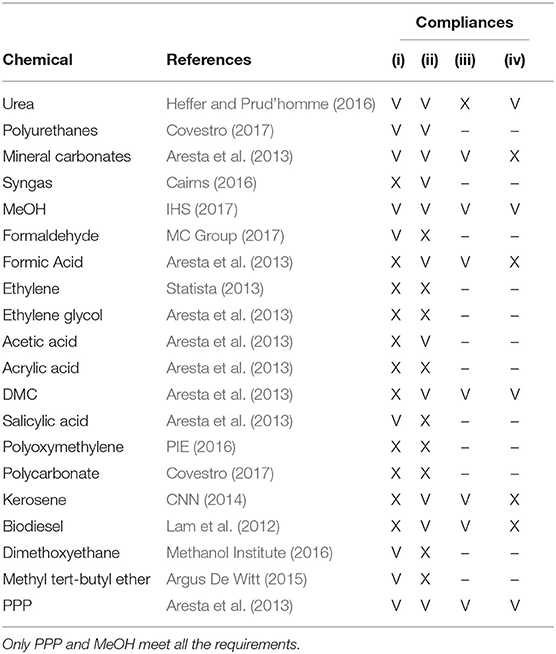
Table 2. List of chemicals that can be produced from CO2 and their effective compliance with the design requirements: (i) minimum production threshold, (ii) techno-economic data availability, (iii) environmentally promising, and (iv) economically promising.
The objective is to minimize the total cost TC [€] to install and operate the entire European CCUS network, including the expenditures related to capture facilities TCC [€], transport infrastructure TTC [€], and injection of the CO2 into geological basins TSC [€], and also considers the profit [€] from the utilization stage:
The capture problem model entails a set of equations needed to set the optimal captured amounts of CO2 in regions g through the most appropriate capture technologies k, to calculate the value of capture costs TCC. The transport problem model defines the mass balances among regions g and g′, to determine the optimal size and routing of the CO2 flowrates through the different transport means l, in order to evaluate transport costs TTC. The sequestration problem model describes the optimal positioning of properly sized injection wells in regions g, to determine costs for storage TSC. These SC echelons are defined on the basis of techno-economic characteristics of capture options k, transport modes l, and sequestration wells, which are all extensively described in d'Amore and Bezzo (2017). In particular, the capture problem model, the transport problem model, and the sequestration problem model have already been discussed in d'Amore and Bezzo (2017) and d'Amore et al. (2018), and their main characteristics are briefly summarized in the Supplementary Material. On the other hand, to highlight the key challenge of this contribution, the utilization problem model will be entirely described below, on the basis of the conversion processes modeled for producing either PPP (Figure 2A) or MeOH (Figure 2B).
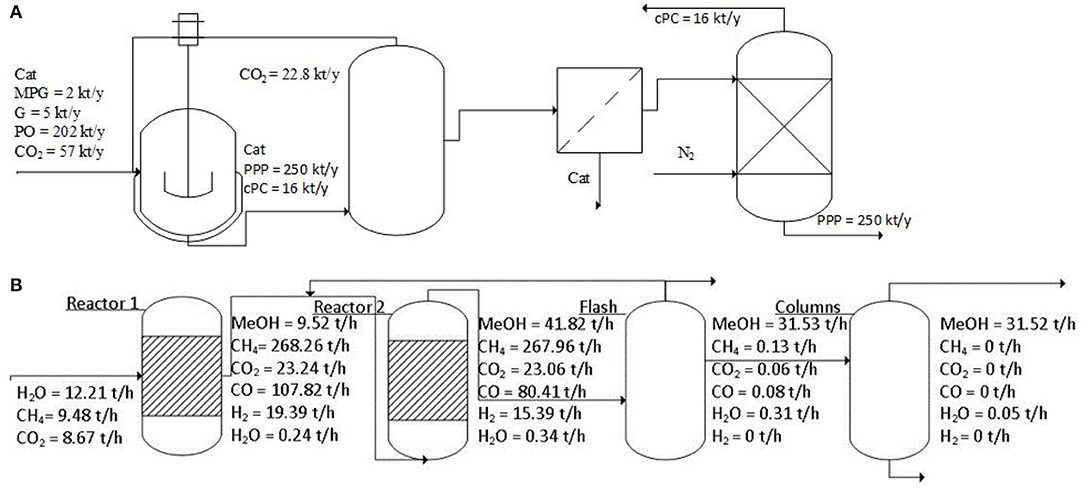
Figure 2. Principal flowrates and conversion schemes for producing: (A) PPP (Fernández-Dacosta et al., 2017), or (B) MeOH (Wiesberg et al., 2016).
The total profit of Equation (1) obtained from the conversion of CO2 is calculated according to the cash flow CFψ, g [€] that can be generated by the production and sale of chemical ψ in region g:
In particular, CFψ, g of Equation (2) is defined as:
The revenue Rψ, g [€] is calculated assuming the sale of both the main product and by-products derived from the production of chemical ψ in region g, whereas COMψ, g [€] represents the manufacturing cost of chemical ψ in region g. Furthermore, taxg [%] (Supplementary Table 1 reported in the Supplementary Material) is a country-based parameter that describes the corporate tax rates in each region g, while dψ, g [€] accounts for the depreciation of chemical ψ in region g.
As regards the revenue Rψ, g of Equation (3) of chemical ψ in region g, it is given by:
where [t] is the amount of chemical ψ that is produced in region g as a result of the model solution, whereas [€/t] is a parameter representing the unitary revenues that can be earned from chemical ψ in region g. In particular, of Equation (4) is calculated according to the unitary price Pζ, g [€/t] set on output products ζ in region g, and to the mass flowrates ṁζ, ψ [t/year] of output commodities ζ that are generated along with chemical ψ:
The parameter [set equal to 250 kt/year], representing the reference plant output capacity, the output flowrates ṁζ, ψ, and the unitary prices Pζ, ψ set for the production, are retrieved from Souza et al. (2014), Wiesberg et al. (2016), and Fernández-Dacosta et al. (2017), and finally differentiated among the European countries c according to the different costs of natural gas and electricity (Supplementary Table 1 reported in the Supplementary Material).
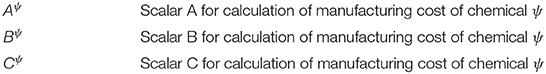
The manufacturing cost COMψ, g of Equation (3) is calculated according to the formulation proposed by Turton et al. (2015):
Accordingly, the manufacturing cost depends on the amount of chemical of Equation (6), which is multiplied by a scalar Aψ = 1.23, that conversely weights the sum of rawψ, g [€/t] (Supplementary Table 2 reported in the Supplementary Material) and utilψ, g [€/t] (Supplementary Table 3 reported in the Supplementary Material), these representing the unitary costs of raw materials and utilities for chemical ψ in region g, respectively. Furthermore, COMψ, g also depends on the fixed capital investment FCIψ, g [€] for producing chemical ψ in region g (weighted by Bψ = 0.28) and on the labor cost labψ, g [€/t] (the latter, reported in Supplementary Table 1, is weighted by Cψ = 2.73). The binary variable determines whether the productivity of chemical ψ in region g falls to a null value, and in that case the contribution of labor costs is also consequently nullified. In fact, is a decision variable determining whether there is production of chemical ψ in region g, or not, according to the productivity upper bound [t of chemical] (retrieved from IHS, 2017 and Covestro, 2017) of chemical ψ in region g:
Regarding the term FCIψ, g of Equation (6), it has been evaluated following the non-linear formulation provided by Sinnot and Towler (2009). Then, given the MILP mathematical architecture of this optimization problem, that formulation has been linearized and eventually the following equation has been implemented to calculate FCIψ, g, given a non-null amount of chemical ψ in region g, and according to the binary decision variable :
where [€/t of chemical] and [€] (Table 3) are respectively the arrays of slope and the intercept coefficients of the linearized facility capital costs for producing each chemical ψ, and are calculated from the results provided by Aasberg-Petersen et al. (2008).
Having defined FCIψ, g through Equation (8), it is then possible to evaluate the depreciation dψ, g of Equation (3) of chemical ψ in region g as a fixed percentage (set equal to 10% according to d'Amore and Bezzo, 2016) over facility capital cost:
As seen before in Equations (4), (6), represents the optimal amount of chemical ψ to be produced in region g according to the model solution.
It is possible to link the chemical output with the actual CO2 exploited for utilization, according to the total quantity of CO2 sent to the conversion process Uψ, g [t of CO2] for producing ψ in region g:
In particular, [t of input CO2 to the conversion stage] represents the actual quantity of CO2 that is exploited for conversion and utilization in chemical ψ in region g, while [t of emitted CO2 from the conversion stage] takes into account the direct CO2 emissions generated by the process when producing chemical ψ in region g:
The parameter [t of input CO2 to the conversion stage/t of chemical ψ] (Table 3) of Equation (11) represents the amount of CO2 that is needed to produce a unitary amount of chemical ψ. Conversely, the parameter [t of captured CO2/t of input CO2 to the conversion stage] (Table 3) of Equation (12) is introduced to take into account the CO2 conversion efficiency of the process that generates chemical ψ (Sakakura and Kohno, 2009; Langanke et al., 2014; Roh et al., 2016; Barbera et al., 2020). Given the actually converted CO2 quantity , it is also possible to evaluate the indirect CO2 emissions [t of indirect CO2 from conversion processes]:
where CIg [t of indirect CO2/GJ] is the carbon intensity for electricity generation in region g (Supplementary Table 4 reported in the Supplementary Material) (EEA, 2019; ElectricityMap, 2019; IEA, 2019), whereas EECψ [GJ/t of input CO2] (Table 3) is the specific electric energy consumption for producing chemical ψ (Fernández-Dacosta et al., 2017; Barbera et al., 2020). Note that in case of exploiting only low carbon energy sources (e.g., renewables, nuclear energy) it will be here assumed that CIg = 0 thus, the contribution of indirect CO2 emissions generated from conversion processes is completely neglected.
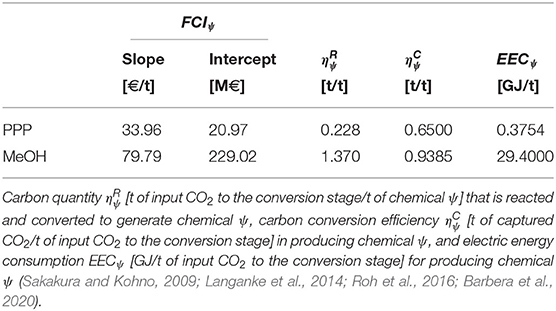
Table 3. Arrays of slopes [€/t of chemical] and intercepts [€] coefficients for the calculation of the facility capital costs of producing chemical ψ (Aasberg-Petersen et al., 2008).
Finally, the total amount of CO2 converted into chemicals (i.e., ) is constrained to be larger than that generated by both direct (i.e., ) and indirect (i.e., ) emissions produced by the utilization stage:
The time-static CCUS model was optimized using the GAMS CPLEX solver for MILP problems on a 32 GB RAM computer in about 2 h (an optimality gap always lower than 0.5% was reached). Results from the optimal CCS network (hence, without utilization stage) are reported as a matter of comparison (Scenario 0). The CCUS network is here optimized according to the selection of a minimum European reduction target α = 50% of overall European CO2 emissions from large stationary sources, therefore consistent with the recent directives (EC, 2017). Three scenarios have been investigated here (Table 4). In Scenario AD1 it is assumed that the production of PPP and MeOH cannot be higher than the current European production and that all the electricity needed to perform the conversion and utilization processes comes from zero-carbon energy sources, thus, indirect CO2 emissions are neglected from the carbon balance and consequently, the constraint imposed through Equation (14) is excluded from the model optimization. Then, Scenario A is also tested on hypothetical higher demands of the two chemicals, i.e., Scenario AD2 and Scenario AD3 considering demands that are two and three times, respectively, higher than the current one. A case-study subsequently described, still assuming that no contribution from indirect emissions is accounted for, investigated the fact that some European countries do not allow onshore CO2 sequestration (Scenario B). Finally, Scenario C analyzes the response of the model to the nation-wide characteristics in terms of electricity carbon intensity to determine the optimal CCUS SC while limiting the generation of indirect emissions from conversion and utilization processes therefore, the constraint set by the aim of Equation (14) is included within the model optimization.
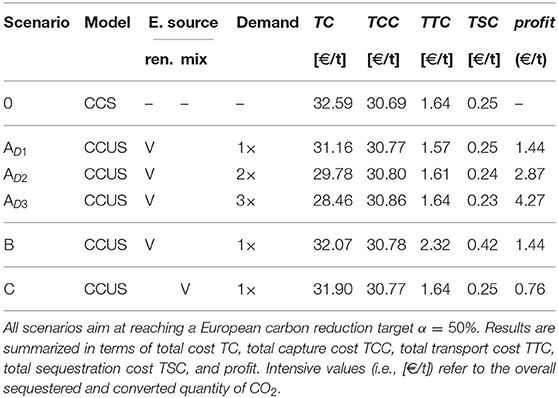
Table 4. Main assumptions and results for Scenario 0, Scenario A, Scenario B, and Scenario C.
Scenario AD1 entails a total cost TC for installing and operating the CCUS SC that is 4.4% lower than that obtained for Scenario 0 (Table 4). This is due to the fact that the introduction of chemical conversion brings in some revenues (the profit in Scenario AD1 is equal to 1.44 €/t). In particular, the possibility of chemical conversion of CO2 entails an almost identical capture cost TCC, which slightly increases from 30.69 €/t (Scenario 0) to 30.77 €/t (Scenario AD1). On the other hand, Scenario AD1 exhibits a nearly unchanged transport infrastructure with respect to Scenario 0, despite the necessity of transporting not only the CO2 that is destined to sequestration, but also the CO2 fed to the conversion plants (the latter quantity is so small that does not affect the overall structure of the transport network). This result is not surprising if we consider that the same total quantity of CO2 is imposed to be captured from stationary sources in all scenarios, and therefore the same total flowrate must be shipped between the nodes (independently of the choice of either sequestration or utilization). As a result, the total transport cost TTC just slightly varies from 1.64 €/t (Scenario 0) to 1.57 €/t (Scenario AD1). The exploitation of geological storage slightly diminishes with respect to Scenario 0 (i.e., −2.43%) (Table 5). Total sequestration costs TSC are unchanged between Scenario 0 and Scenario AD1 (0.25 €/t). The net impact of utilization amounts to 2.43% of the overall captured CO2 therefore, the result is comparable with the 1% upper bound for chemical conversion estimated by Mac Dowell et al. (2017).

Table 5. Main assumptions and results for Scenario 0, Scenario A, Scenario B, and Scenario C.
Scenario AD2 and Scenario AD3 focus on investigating how the cost of a CO2 SC would vary if the production of chemicals was increased progressively from the current European values (i.e., with respect to Scenario AD1) to three times that (Tables 4, 5). Accordingly, tripling the production of both chemicals corresponds to an increase of the European production quota from 25.5%PPP and 9.6%MeOH (Scenario AD1) to 76.6%PPP and 28.8%MeOH (Scenario AD3) of actual world capacity. Under these assumptions, the results from the optimal CCUS configuration show that overproduction of the two chemicals mainly affects the total cost of the SC, which could be reduced by about 12.67% in case the production of both chemicals was tripled with respect to current values. On the other hand, the contribution of CO2 utilization over capture would go from 2.43% (Scenario AD1) to a maximum of about 7.29% (Scenario AD3) (Figure 3A). This means that, in order to completely avoid the necessity of CO2 sequestration, a massive increase to over 38 times the current European production of PPP and MeOH would be required. In terms of GHGs savings, Scenario AD3 would allow a net CO2 yearly decrease due to utilization equal to 50.96 Mt/year, against just 16.99 Mt/year for Scenario AD1 (Figure 3B).
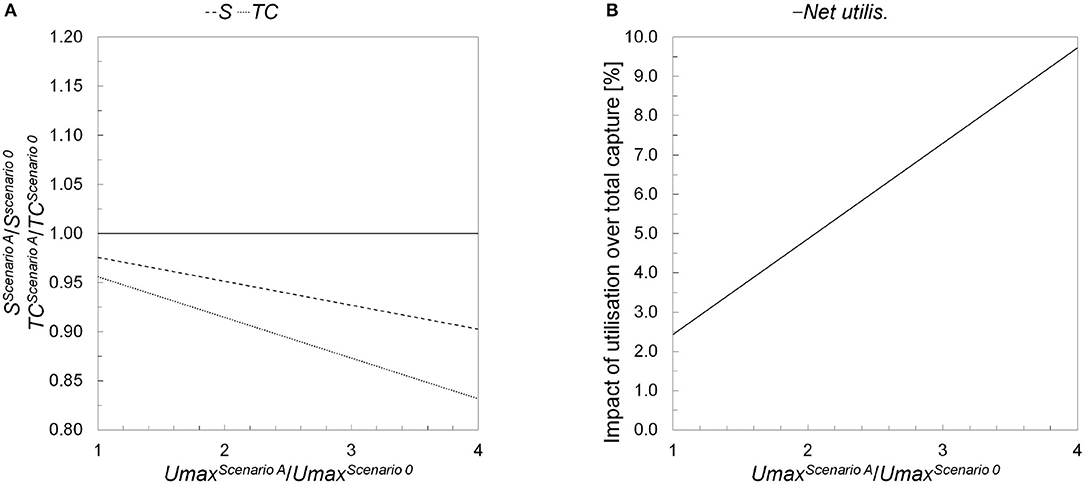
Figure 3. Comparison between Scenario 0 and Scenario A in terms of: (A) relative variations in total cost (TC) and exploitation of geological sequestration (S); and (B) effective net CO2 utilization (Net utilis.), with respect to the change in the productions of the chemical being considered (Umax).
The final SC configuration is reported in Figure 4 for both Scenario 0 (Figure 4A) and Scenario AD1 (Figure 4B). Note that for the cases of Scenario AD2−D3 the SC design is unchanged with respect to Scenario AD1, since varying the demands of the two chemicals only determines the installation of larger conversion facilities, while their location and infrastructure is not affected. Figure 4 highlights that the resulting networks are almost identical between Scenario 0 and Scenario AD1. Capture nodes do not change and, consequently, the main driver in establishing the transportation arcs is the location of the sequestration sites. Regarding the utilization stage, the conversion facilities are located in regions allowing for a reduction of production costs, i.e., Hungary (PPP) and Turkey (MeOH). In fact, it was verified that the key parameters affecting the selection of the plant sites are corporate tax rate, cost of materials, and energy price. Regarding corporate tax rates, there is a large variability across Europe (Supplementary Table 1 reported in the Supplementary Material), from a minimum of 9% (Hungary) up to a maximum of 34% (Belgium). The corporate tax rate of Macedonia is just slightly higher than that of Hungary, while the one of Turkey is close to the European mean (i.e., 20%). As a consequence, the construction of plants in Hungary is mainly justified by their competitiveness in corporate tax rates. On the other hand, Turkey is characterized by low costs of raw materials (Supplementary Table 2 reported in the Supplementary Material) and utilities (Supplementary Table 3 reported in the Supplementary Material). In particular, Turkey has the cheapest electricity price among the analyzed countries (0.0187 €/kWh) (Supplementary Table 1 reported in the Supplementary Material). Accordingly, the presence of a plant for producing MeOH in Turkey is quite justifiable despite the high energy intensity required by its production process. Summarizing, the location of plants for CO2 conversion into PPP is mainly driven by low taxation, since this process is less energy intensive. Conversely, regarding the production of MeOH, its optimal positioning is mainly determined by the cost of raw materials and utilities (and, in particular, of electricity). Labor costs do not seem to have a relevant impact for choosing the locations of CO2 conversion facilities.
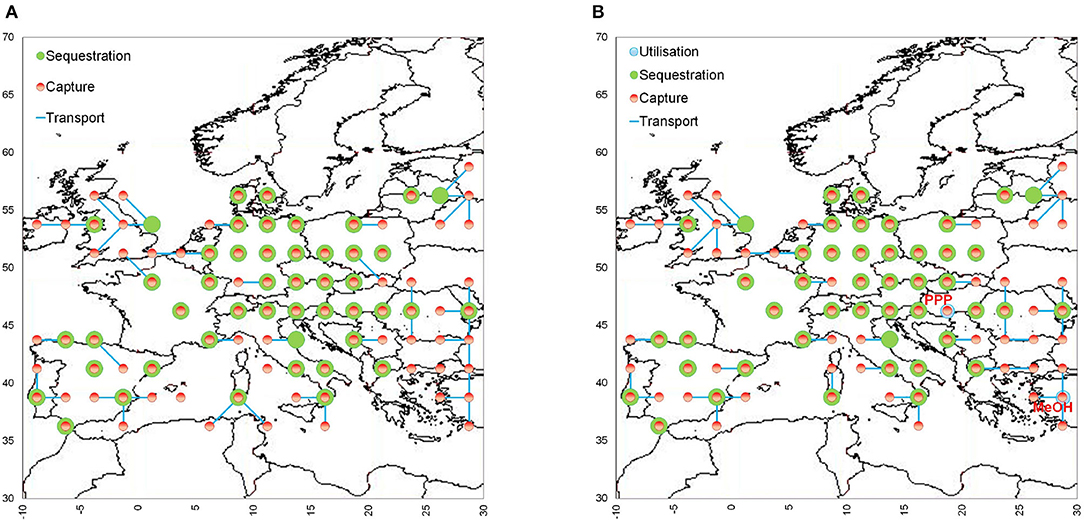
Figure 4. Final SC configurations for (A) Scenario 0 and (B) Scenario AD1.
Scenario B considers the fact that some countries restrict (Czech Republic, Germany, Poland, Sweden, the Netherlands, and the United Kingdom) or forbid (Austria, Croatia, Estonia, Ireland, Latvia, Finland, and Belgium) onshore sequestration (EC, 2017). Even though the United Kingdom, Poland, and the Netherlands are in the process of authorizing it (EC, 2017), Scenario B prudently optimizes the CCUS SC while excluding all the aforementioned states from those in which onshore storage is allowed. Results show that the total cost TC does not change significantly (about 3% more expensive with respect to Scenario AD1), while capture costs TCC and profit are also unchanged between the two analyzed case studies (Table 4). On the other hand, analogously to that observed in d'Amore and Bezzo (2017) for CCS SCs, the optimal CCUS network entails a more complex and expensive transport infrastructure (+48% in terms of TTC) and sequestration stage (+68% in terms of TSC). These additional expenditures are a consequence of the necessity of routing CO2 flowrates toward those sequestration basins that are still available once countrywide legal frameworks are taken into account (Figure 4A). Regarding the CO2 exploited for conversion and utilization purposes, the restrictive legal framework for onshore storage produces the same identical results obtained in Scenario AD1.
The previously discussed scenarios A-B investigated the design of optimal European CCUS SCs while neglecting the indirect CO2 emissions that may be generated by the energy requirements of conversion processes. As shown in Table 5, if these network considered the contribution of the local energy mixes toward indirect emissions from chemicals production, the overall amount of CO2 generated (directly and indirectly from its conversion) would be higher than that captured. To overcome this simplification, which may lead to unrealistic results, Scenario C optimizes the European CCUS network while taking into account the country-specific electricity carbon intensities. As a result, most of the production of MeOH is now located in Austria, which is a country characterized by a particularly attractive compromise between a low electricity carbon intensity (i.e., 0.024 t of CO2/GJ) and production cost parameters (Figure 5B). As in Scenario AD1, a residual production of MeOH is still located in Turkey and a PPP plant is installed in Hungary. The drawback of keeping net CO2 emissions negative lays on the slight increase in total costs TC (+2.4% with respect to Scenario AD1), which is due to a drop in total profit earned from the sale of chemical outputs (−47.2% with respect to Scenario AD1) (Table 4). Overall, Scenario C demonstrates that indirect CO2 emissions generated from CO2 conversion processes (i.e., Uind) might play a key role in determining the economics and design of a European CCUS network, but that in general, a satisfactory solution entailing negative CO2 emissions can be obtained while still generating some profit from both PPP and MeOH. Moreover, the contribution of direct additional CO2 emissions from utilization (i.e., Ulost) was always negligible in all analyzed scenarios.
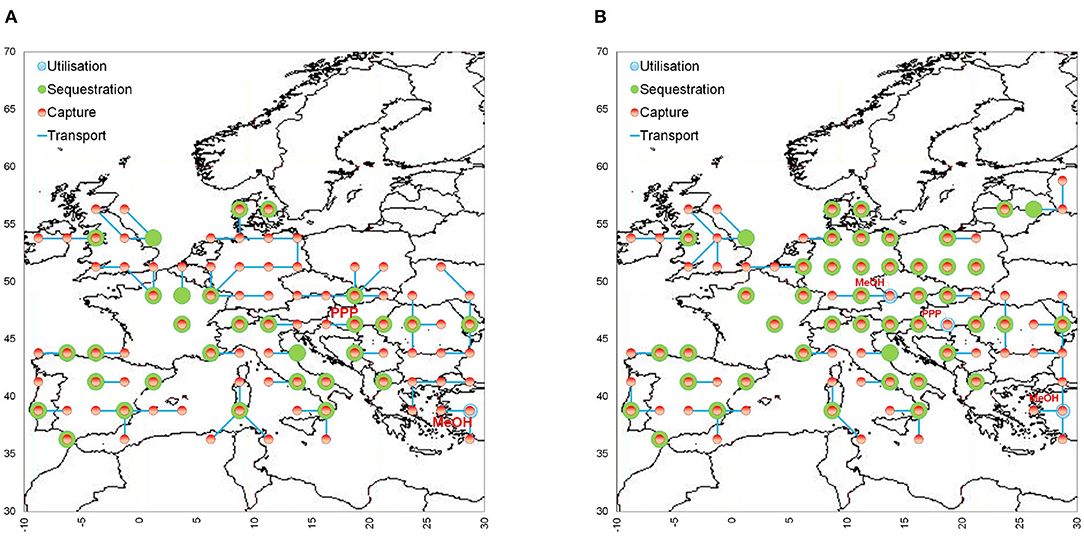
Figure 5. Final SC configurations for (A) Scenario B and (B) Scenario C.
Results of the optimization show that for the case study being considered, CO2 utilization may have a non-negligible economic impact (overall costs decrease by 4.4%); however, as suggested by other studies (e.g., Mac Dowell et al., 2017), its environmental impact is a minor one (in our case study, the contribution amounts to 2.4% reduction in GHGs emissions). Thus, the major benefit of CO2 utilization seems to be that of a slight reduction in taxpayer costs in establishing a CCS infrastructure.
Having stated that, we need to highlight the limitations, too, of this study. First, the focus was on the very few chemical technologies that are currently demonstrated to be sufficiently mature to provide a reduction in CO2 emissions, and to guarantee some profitability. Although material balances (Mac Dowell et al., 2017) and thermodynamics (Stevenson, 2019) still limit the potential of the chemical industry in terms of CO2 utilization, alternative pathways may nonetheless disclose wider and more positive scenarios. For instance the application of CCU technologies in the cement industry could foster the routing toward an “ideally carbon-free” market in which construction materials are generated from the same CO2 captured within the plant itself or from large stationary sources (US National Academy of Sciences, 2019). Furthermore, this study does not consider the possibility that the unsatisfactory environmental performance of a technology could be balanced by negative emissions in a different location, thanks to some sort of carbon trading mechanisms or cooperative actions. Similarly we did not consider the possibility of favorable local situations (e.g., a conversion facility fed by renewable power plant producing electricity at a cheap price), which could change the economic and/or environmental sustainability of some technologies in some specific cases. The energy sector, too, may provide a huge market for CO2-derived fuels. As a matter of fact, methanol is currently envisioned for a wide range of applications beyond its current use, e.g., as fuel for transport, in energy sectors, or for the synthesis of hydrocarbons, including several major large-volume chemicals (Pérez-Fortes et al., 2016). Hence, imposing the current production volumes as an upper bound for the calculation of utilization potential may neglect a wide range of additional options. Furthermore, focusing on large stationary sources may neglect the fact that more effective conversion routes could be established at an industrial level, e.g., by integrating conversion technologies within a petrochemical plant. Governmental subsidies, too, may help support some technologies and accelerate the transition toward a CO2 derived chemical industry. However, the definition of the most suitable mechanisms and their effect on the deployment of alternative technologies is beyond the scope of this work. We need to recognize, though, that currently, many potential routes are just possibilities and that their practical implementation is far from being demonstrated at a large scale (US National Academy of Sciences, 2019): the degree of uncertainty in terms of costs, productivity, GHGs emissions is so high that any modeling and optimization framework may simply result in a speculative exercise with questionable practical benefits. This is why we decided to exclude such routes in the current analysis.
On the other hand, even our “conservative” approach could be alleged by someone to be over-optimistic. In fact, it is assumed that traditional routes for the chemicals being considered would move to alternative technologies based on CO2 conversion so that all European production would rely on CO2 as a feedstock. In the current situation, such a scenario does not appear to be very plausible unless significant incentives are introduced or whole world production follows a similar path.
To sum up, even if there are limitations, we believe that the proposed analysis may represent a sound preliminary assessment of current potential of CCUS in Europe, when CO2 emissions from large stationary sources are taken into account.
This article assessed the potential impact of a European carbon capture, transport, utilization, and storage supply chain. Results suggested that CO2 utilization can contribute only marginally to achieve the European climate target set for 2030 in terms of emissions reduction. The positive effect is that it can generate some profits and consequently help to decrease costs related to the overall carbon capture and sequestration infrastructure. Moreover, this analysis demonstrated the key role played by national energy mixes (thus, energy carbon intensities) in determining the optimal positioning of conversion plants as a consequence of accounting for both direct and indirect CO2 emissions from the conversion stage; furthermore, the study was able to show the response in terms of a network design to countrywide legal frameworks on onshore geological storage.
This work sets the basis for future research on the strategic optimization of carbon capture, transport, utilization, and sequestration supply chains at a wide continent-level scale. The proposed methodology is general, since it could be applied to different geographic contexts, and could be improved by adding more CO2 conversion and utilization pathways, in order to achieve a more comprehensive modeling framework.
All datasets generated for this study are either included in the article/Supplementary Material, or available upon request to the corresponding author.
FB conceived and led this study. Fd'A developed the model formulation and implementation, carried out the analyses, and wrote the paper. Fd'A and FB contributed to the text and edited the paper. All authors contributed to the article and approved the submitted version.
This research was supported by the Department of Industrial Engineering, University of Padova (Grant 2019DII126): Optimising supply chains for carbon capture, transport, utilisation, and sequestration, including emission points from industrial clusters.
Frontiers Media SA remains neutral with regard to jurisdictional claims in published maps and institutional affiliations.
The authors declare that the research was conducted in the absence of any commercial or financial relationships that could be construed as a potential conflict of interest.
The authors would like to thank Mr. Victor Baldo for some preliminary simulation work.
The Supplementary Material for this article can be found online at: https://www.frontiersin.org/articles/10.3389/fenrg.2020.00190/full#supplementary-material
Aasberg-Petersen, K., Nielsen, C. S., Dybkjær, I., and Perregaard, J. (2008). Large Scale Methanol Production From Natural Gas. Haldor Topsoe, 22. Available online at: http://www.topsoe.com/sites/default/files/topsoe_large_scale_methanol_prod_paper.ashx_.pdf (accessed March 29, 2018).
Ağrali, S., Üçtuğ, F. G., and Türkmen, B. A. (2018). An optimization model for carbon capture and storage/utilization vs. carbon trading: a case study of fossil-fired power plants in Turkey. J. Environ. Manage. 215, 305–315. doi: 10.1016/j.jenvman.2018.03.054
Alper, E., and Yuksel Orhan, O. (2017). CO2 utilization: developments in conversion processes. Petroleum 3, 109–126. doi: 10.1016/j.petlm.2016.11.003
Aresta, M., Dibenedetto, A., and Angelini, A. (2013). The changing paradigm in CO2 utilization. J. CO2 Util. 3–4, 65–73. doi: 10.1016/j.jcou.2013.08.001
Argus De Witt, A. (2015). Argus DeWitt 2015 Fuels and Oxygenates Annual. Available online at: https://www.argusmedia.com/~/media/files/pdfs/petchems/mtbe-2015-annual-flyer.pdf?la=en (accessed March 29, 2018).
Armstrong, K., and Styring, P. (2015). Assessing the potential of utilization and storage strategies for post-combustion CO2 emissions reduction. Front. Energy Res. 3, 1–9. doi: 10.3389/fenrg.2015.00008
Barbera, E., Mantoan, F., Bertucco, A., and Bezzo, F. (2020). Hydrogenation to convert CO2 to C1 chemicals: technical comparison of different alternatives by process simulation. Can. J. Chem. Eng. 98, 1893–1906. doi: 10.1002/cjce.23755
Bellotti, D., Rivarolo, M., Magistri, L., and Massardo, A. F. (2017). Feasibility study of methanol production plant from hydrogen and captured carbon dioxide. J. CO2 Util. 21, 132–138. doi: 10.1016/j.jcou.2017.07.001
Bui, M., Adjiman, C. S., Bardow, A., Anthony, E. J., Boston, A., Brown, S., et al. (2018). Carbon capture and storage (CCS): the way forward. Energy Environ. Sci. 11, 1062–1176. doi: 10.1039/c7ee02342a
Cairns, H. (2016). Global Trends in Syngas, Technical report. Stratas Advisors. Available online at: https://stratasadvisors.com/Insights/072216-Global-Sybgas-Trends (accessed September 15, 2020).
CNN (2014). Desert Plants and Green Diesel: Meet the Jet Fuels of the Future. Available online at: http://edition.cnn.com/travel/article/boeing-biofuel/index.html (accessed September 15, 2020)
Covestro (2017). Investor Presentation Technical Report. Available online at: http://investor.covestro.com/en/presentations/presentations/ (accessed September 15, 2020)
d'Amore, F., and Bezzo, F. (2016). Strategic optimisation of biomass-based energy supply chains for sustainable mobility. Comput. Chem. Eng. 87, 68–81. doi: 10.1016/j.compchemeng.2016.01.003
d'Amore, F., and Bezzo, F. (2017). Economic optimisation of European supply chains for CO2 capture, transport and sequestration. Int. J. Greenh. Gas Control 65, 99–116. doi: 10.1016/j.ijggc.2017.08.015
d'Amore, F., and Bezzo, F. (2020). Optimal design of European cooperative supply chains for carbon capture, transport and sequestration with costs share policies. AIChE J. 66:e16872. doi: 10.1002/AIC.16872
d'Amore, F., Lovisotto, L., and Bezzo, F. (2020). Introducing social acceptance into the design of CCS supply chains: a case study at a European level. J. Clean. Prod. 249:119337. doi: 10.1016/j.jclepro.2019.119337
d'Amore, F., Mocellin, P., Vianello, C., Maschio, G., and Bezzo, F. (2018). Economic optimisation of European supply chains for CO2 capture, transport and sequestration, including societal risk analysis and risk mitigation measures. Appl. Energy 223, 401–415. doi: 10.1016/j.apenergy.2018.04.043
d'Amore, F., Sunny, N., Iruretagoyena, D., Bezzo, F., and Shah, N. (2019). European supply chains for carbon capture, transport and sequestration, with uncertainties in geological storage capacity: insights from economic optimisation. Comput. Chem. Eng. 129:106521. doi: 10.1016/j.compchemeng.2019.106521
EC (2017). Report From the Commission to the European Parliament and the Council on Implementation of Directive 2009/31/ECon the Geological Storage of Carbon Dioxide. Available online at: https://ec.europa.eu/commission/sites/beta-political/files/report-carbon-capture-storage_en.pdf (accessed September 15, 2020)
EEA (2019). CO2 Emission Intensity. Available online at: https://www.eea.europa.eu/data-and-maps (accessed September 15, 2020)
Elahi, N., Shah, N., Korre, A., and Durucan, S. (2014). Multi-period least cost optimisation model of an integrated carbon dioxide capture transportation and storage infrastructure in the UK. Energy Procedia 63, 2655–2662. doi: 10.1016/j.egypro.2014.11.288
Elahi, N., Shah, N., Korre, A., and Durucan, S. (2017). Multi-stage stochastic optimisation of a CO2 transport and geological storage in the UK. Energy Procedia 114, 6514–6525. doi: 10.1016/j.egypro.2017.03.1787
ElectricityMap (2019). Climate Impact by Area: Ranked by Carbon Intensity of Electricity Consumed. Available online at: https://www.electricitymap.org/ (accessed September 15, 2020)
EU GeoCapacity Project (2009). Assessing European Capacity for Geological Storage of Carbon Dioxide. Available online at: www.geology.cz/geocapacity/publications (accessed September 15, 2020)
Eurostat (2017a). Energy Price Statistics. Available online at: http://ec.europa.eu/eurostat/statistics-explained/index.php/Energy_price_statistics (accessed September 15, 2020)
Eurostat (2017b). Labour Costs Database. Available online at: http://ec.europa.eu/eurostat/web/labour-market/labour-costs/database (accessed September 15, 2020)
Eurostat (2017c). Natural Gas Price Statistics. Available online at: http://ec.europa.eu/eurostat/statistics-explained/index.php/Natural_gas_price_statistics (accessed September 15, 2020)
Fernández-Dacosta, C., Van Der Spek, M., Hung, C. R., Oregionni, G. D., Skagestad, R., Parihar, P., et al. (2017). Prospective techno-economic and environmental assessment of carbon capture at a refinery and CO2 utilisation in polyol synthesis. J. CO2 Util. 21, 405–422. doi: 10.1016/j.jcou.2017.08.005
Geske, J., Berghout, N., and van den Broek, M. (2015). Cost-effective balance between CO2 vessel and pipeline transport: part II–design of multimodal CO2 transport: the case of the West Mediterranean region. Int. J. Greenh. Gas Control 33, 122–134. doi: 10.1016/j.ijggc.2014.12.005
Han, J. H., and Lee, I. B. (2012). Multiperiod stochastic optimization model for carbon capture and storage infrastructure under uncertainty in CO2 emissions, product prices, and operating costs. Ind. Eng. Chem. Res. 51, 11445–11457. doi: 10.1021/Ie3004754
Han, J. H., and Lee, I. B. (2013). A comprehensive infrastructure assessment model for carbon capture and storage responding to climate change under uncertainty. Ind. Eng. Chem. Res. 52, 3805–3815. doi: 10.1021/ie301451e
Hasan, M. M. F., First, E. L., Boukouvala, F., and Floudas, C. A. (2015). A multi-scale framework for CO2 capture, utilization, and sequestration: CCUS and CCU. Comput. Chem. Eng. 81, 2–21. doi: 10.1016/j.compchemeng.2015.04.034
Heffer, P., and Prud'homme, M. (2016). “Fertilizer outlook 2016–2020,” in 84th IFA Annual Conference, Moscow, 30 May–1 June 2016 (Moscow: International Fertilizer Industry Association (IFA)).
IEA (2019). Data and Statistics: Explore Energy Data by Category, Indicator, Country or Region. Available online at: https://www.iea.org/data-and-statistics (accessed September 15, 2020)
IHS (2017). Global Methanol Demand Growth Driven by Methanol to Olefins as Chinese Thirst for Chemical Supply Grows. IHS Markit Says. Available online at: http://news.ihsmarkit.com/press-release/country-industry-forecasting-media/global-methanol-demand-growth-driven-methanol-olefi (accessed September 15, 2020)
IPCC (2005). IPCC Special Report on Carbon Dioxide Capture and Storage. Prepared by Working Group III of the Intergovernmental Panel on Climate Change. Cambridge University Press, 442. Available online at: https://www.ipcc.ch/pdf/special-reports/srccs/srccs_wholereport.pdf (accessed September 15, 2020)
IPCC (2018). Global Warming of 1.5°C. An IPCC Special Report on the Impacts of Global Warming of 1.5°C Above Pre-industrial Levels and Related Global Greenhouse Gas Emission Pathways, in the Context of Strengthening the Global Response to the Threat of Climate Change. Available online at: http://report.ipcc.ch/sr15/pdf/sr15_spm_final.pdf (accessed September 15, 2020)
JRC (2016). Emission Database for Global Atmospheric Research (EDGAR). Available online at: edgar.jrc.ec.europa.eu/index.php (accessed September 15, 2020)
Kalyanarengan Ravi, N., Van Sint Annaland, M., Fransoo, J. C., Grievink, J., and Zondervan, E. (2016). Development and implementation of supply chain optimization framework for CO2 capture and storage in the Netherlands. Comput. Chem. Eng. 102, 40–51. doi: 10.1016/j.compchemeng.2016.08.011
Kim, M., Kim, K., Kim, T. H., and Kim, J. (2019). Economic and environmental benefit analysis of a renewable energy supply system integrated with carbon capture and utilization framework. Chem. Eng. Res. Des. 147, 200–213. doi: 10.1016/j.cherd.2019.05.008
Klokk, Ø, Schreiner, P. F., Pagès-Bernaus, A., and Tomasgard, A. (2010). Optimizing a CO2 value chain for the Norwegian continental shelf. Energy Policy 38, 6604–6614. doi: 10.1016/j.enpol.2010.06.031
Lam, M. K., Lee, K. T., and Mohamed, A. R. (2012). Current status and challenges on microalgae-based carbon capture. Int. J. Greenh. Gas Control 10, 456–469. doi: 10.1016/J.IJGGC.2012.07.010
Langanke, J., Wolf, A., Hofmann, J., Böhm, K., Subhani, M. A., Müller, T. E., et al. (2014). Carbon dioxide (CO2) as sustainable feedstock for polyurethane production. Green Chem. 16, 1865–1870. doi: 10.1039/C3GC41788C
Lee, S. Y., Lee, I. B., and Han, J. (2019). Design under uncertainty of carbon capture, utilization and storage infrastructure considering profit, environmental impact, and risk preference. Appl. Energy 238, 34–44. doi: 10.1016/j.apenergy.2019.01.058
Lee, S. Y., Lee, J. U., Lee, I. B., and Han, J. (2017). Design under uncertainty of carbon capture and storage infrastructure considering cost, environmental impact, and preference on risk. Appl. Energy 189, 725–738. doi: 10.1016/j.apenergy.2016.12.066
Lehtonen, J., Järnefelt, V., Alakurtti, S., Arasto, A., Hannula, I., Harlin, A., et al. (2019). The Carbon Reuse Economy: Transforming CO2 From a Pollutant Into a Resource. Espoo: VTT Technical Research Centre of Finland.
Leonzio, G., Foscolo, P. U., and Zondervan, E. (2019). An outlook towards 2030: optimization and design of a CCUS supply chain in Germany. Comput. Chem. Eng. 125, 499–513. doi: 10.1016/j.compchemeng.2019.04.001
Li, H., Jiang, H. D., Yang, B., and Liao, H. (2019). An analysis of research hotspots and modeling techniques on carbon capture and storage. Sci. Total Environ. 687, 687–701. doi: 10.1016/j.scitotenv.2019.06.013
Mac Dowell, N., Fennell, P. S., Shah, N., and Maitland, G. C. (2017). The role of CO2 capture and utilization in mitigating climate change. Nat. Clim. Change 7, 243–249. doi: 10.1038/nclimate3231
MC Group (2017). World Formaldehyde Production to Exceed 52 Mln Tonnes in 2017. Available online at: https://mcgroup.co.uk/news/20140627/formaldehyde-production-exceed-52-mln-tonnes.html (accessed September 15, 2020)
Methanol Institute (2016). DME: An Emerging Global Fuel, Technical report. Available online at: http://www.methanol.org/wp-content/uploads/2016/06/DME-An-Emerging-Global-Guel-FS.pdf
Middleton, R. S., Keating, G. N., Viswanathan, H. S., Stauffer, P. H., and Pawar, R. J. (2012). Effects of geologic reservoir uncertainty on CO2 transport and storage infrastructure. Int. J. Greenh. Gas Control 8, 132–142. doi: 10.1016/j.ijggc.2012.02.005
Middleton, R. S., and Yaw, S. (2018). The cost of getting CCS wrong: uncertainty, infrastructure design, and stranded CO2. Int. J. Greenh. Gas Control 70, 1–11. doi: 10.1016/j.ijggc.2017.12.011
Mondal, K., Sasmal, S., Badgandi, S., Chowdhury, D. R., and Nair, V. (2016). Dry reforming of methane to syngas: a potential alternative process for value added chemicals–a techno-economic perspective. Environ. Sci. Pollut. Res. 23, 22267–22273. doi: 10.1007/s11356-016-6310-4
Nie, Z., Korre, A., Elahi, N., and Durucan, S. (2017). Real options analysis of CO2 transport and storage in the UK continental shelf under geological and market uncertainties and the viability of subsidies for market development. Energy Procedia 114, 6612–6622. doi: 10.1016/j.egypro.2017.03.1815
Pérez-Fortes, M., Schöneberger, J. C., Boulamanti, A., and Tzimas, E. (2016). Methanol synthesis using captured CO2 as raw material: techno-economic and environmental assessment. Appl. Energy 161, 718–732. doi: 10.1016/j.apenergy.2015.07.067
PIE (2016). POM Technical Report. Available online at: https://pieweb.plasteurope.com/Default.aspx?pageid=302&node=100212 (accessed September 15, 2020)
Rivera-Tinoco, R., Farran, M., Bouallou, C., Auprêtre, F., Valentin, S., Millet, P., et al. (2016). Investigation of power-to-methanol processes coupling electrolytic hydrogen production and catalytic CO2 reduction. Int. J. Hydrogen Energy 41, 4546–4559. doi: 10.1016/j.ijhydene.2016.01.059
Roh, K., Frauzem, R., Nguyen, T. B. H., Gani, R., and Lee, J. H. (2016). A methodology for the sustainable design and implementation strategy of CO2 utilization processes. Comput. Chem. Eng. 91, 407–421. doi: 10.1016/j.compchemeng.2016.01.019
Sakakura, T., and Kohno, K. (2009). The synthesis of organic carbonates from carbon dioxide. Chem. Commun. 11, 1312–1330. doi: 10.1039/b819997c
Sinnot, R., and Towler, G. (2009). Chemical Engineering Design. 5th Edn (Oxford: Butterworth-Heinemann).
Smit, B., Park, A. H. A., and Gadikota, G. (2014). The grand challenges in carbon capture, utilization, and storage. Front. Energy Res. 2, 2013–2015. doi: 10.3389/fenrg.2014.00055
Souza, L. F. S., Ferreira, P. R. R., Medeiros, J. L., De Alves, R. M. B., and Arau, Q. F. (2014). Production of DMC from CO2 via indirect route: technical–economical–environmental assessment and analysis. ACS Sustain. Chem. Eng. 2, 62–69. doi: 10.1021/sc400279n
Statista (2013). Ethylene Production Capacity Worldwide in 2013 by Region. Available online at: https://www.statista.com/statistics/270007/capacity-of-ethylene-by-region/ (accessed September 15, 2020)
Sternberg, A., Jens, C. M., and Bardow, A. (2017). Life cycle assessment of CO2-based C1-chemicals. Green Chem. 19, 2244–2259. doi: 10.1039/c6gc02852g
Stevenson, S. A. (2019). Thermodynamic considerations in CO2 utilization. AIChE J. 65, 1–15. doi: 10.1002/aic.16695
Turk, G. A., Cobb, T. B., Jankowski, D. J., Wolsky, A. M., and Sparrow, F. T. (1987). CO2 transport: a new application of the assignment problem. Energy 12, 123–130. doi: 10.1016/0360-5442(87)90116-2
Turton, R., Baile, R. C., Whiting, W. B., Shaeiwitz, J. A., and Bhattacharyya, D. (2015). Analysis, Synthesis, and Design of Chemical Processes. 4th Edn. Upper Saddle River, NJ: Pearson Education, Inc.
US National Academy of Sciences (2019). Gaseous Carbon Waste Streams Utilization: Status and Research Needs. Washington, DC: The National Academies Press.
von der Assen, N., and Bardow, A. (2014). Life cycle assessment of polyols for polyurethane production using CO2 as feedstock: insights from an industrial case study. Green Chem. 16, 3272–3280. doi: 10.1039/C4GC00513A
Wiesberg, I. L., de Medeiros, J. L., Alves, R. M. B., Coutinho, P. L. A., and Araújo, O. Q. F. (2016). Carbon dioxide management by chemical conversion to methanol: hydrogenation and bi-reforming. Energy Convers. Manage. 125, 320–335. doi: 10.1016/j.enconman.2016.04.041
Wu, Q., Lin, Q. G., Wang, X. Z., and Zhai, M. Y. (2015). An inexact optimization model for planning regional carbon capture, transportation and storage systems under uncertainty. Int. J. Greenh. Gas Control 42, 615–628. doi: 10.1016/j.ijggc.2015.09.017
Zhang, S., Liu, L., Zhang, L., Meng, Q., and Du, J. (2018). Optimal planning for regional carbon capture and storage systems under uncertainty. Chem. Eng. Trans. 70, 1207–1212. doi: 10.3303/CET1870202


Keywords: carbon capture utilization and storage, supply chain optimization, mixed integer linear programming, European framework, CO2 chemical conversion and utilization
Citation: d'Amore F and Bezzo F (2020) Optimizing the Design of Supply Chains for Carbon Capture, Utilization, and Sequestration in Europe: A Preliminary Assessment. Front. Energy Res. 8:190. doi: 10.3389/fenrg.2020.00190
Received: 26 February 2020; Accepted: 17 July 2020;
Published: 30 September 2020.
Edited by:
Antonio Espuña, Universitat Politecnica de Catalunya, SpainReviewed by:
Athanasios I. Papadopoulos, Centre for Research and Technology Hellas (CERTH), GreeceCopyright © 2020 d'Amore and Bezzo. This is an open-access article distributed under the terms of the Creative Commons Attribution License (CC BY). The use, distribution or reproduction in other forums is permitted, provided the original author(s) and the copyright owner(s) are credited and that the original publication in this journal is cited, in accordance with accepted academic practice. No use, distribution or reproduction is permitted which does not comply with these terms.
*Correspondence: Fabrizio Bezzo, ZmFicml6aW8uYmV6em9AdW5pcGQuaXQ=
Disclaimer: All claims expressed in this article are solely those of the authors and do not necessarily represent those of their affiliated organizations, or those of the publisher, the editors and the reviewers. Any product that may be evaluated in this article or claim that may be made by its manufacturer is not guaranteed or endorsed by the publisher.
Research integrity at Frontiers
Learn more about the work of our research integrity team to safeguard the quality of each article we publish.