 Dabin Sun
 Zhijian Zhang*
 Xinyu Li
- Fundamental Science on Nuclear Safety and Simulation Technology Laboratory, Harbin Engineering University, Harbin, China
Best estimate plus uncertainty (BEPU) analysis method has been widely used to analyze various transient accidents of pressurized water reactor (PWR). However, the traditional BEPU method has some limitations: (1) The input parameters are not clearly defined, resulting in inaccurate conclusions in the sensitivity analysis. (2) The uncertainty quantification and sensitivity analysis usually share the same set of samples, but they have different requirements for the sample size. In this work, an improved BEPU method is proposed, which can alleviate the above defects. The improved BEPU method possesses the following two characteristics: (1) The sensitivity analysis is performed for the steady-state and transient calculation, respectively. It provides more comprehensive results than does the traditional BEPU method. (2) The sensitivity analysis is performed before the uncertainty analysis to reduce the number of uncertainty analysis inputs. A small-break loss-of-coolant accident (SBLOCA) is simulated by Reactor Excursion and Leak Analysis Program (RELAP) 5 to verify the accuracy and applicability of the improved BEPU method. By the sensitivity analysis, the coolant pump inlet roughness, main flow rate, core heat channel temperature, break area, and PRZ pressure have moderate or higher relationships with the peak core outlet temperature. The fission product yield factor has a moderate positive relationship with the peak cladding temperature (PCT). The sensitivity analysis by the improved BEPU method shows that the peak core outlet temperature has strong relationships with main flow rate, core heat channel temperature, and PRZ pressure, which is not captured by the traditional BEPU method. As a result, it is more reasonable to take steady-state parameters as inputs in the sensitivity analysis of transient. Only those parameters with high correlation coefficients are sampled for uncertainty analysis. Meanwhile, the results of the uncertainty analysis obtained by the improved BEPU are consistent with the results of the traditional method. Neither the PCT nor the peak core outlet temperature will exceed their limits. The results illustrate that the improved BEPU method can reduce the size of samples but maintains the desired accuracy.
Introduction
Effective safety analysis of nuclear power plant (NPP) operations and accident scenarios are usually performed by the best estimate (BE) system codes, such as Reactor Excursion and Leak Analysis Program (RELAP) 5 (Martin, 1995; Rockville, 2001), CATHARE (Barre and Bernard, 1990), and TRACE (NR Commisson, 2010; Berar et al., 2013). To ensure sufficient safety margin for the design and operation of NPPs, conservative hypothesis is widely used in this field. However, overconservatism will make the analysis results and safety standard deviate from the actual operating conditions, which seriously impacts the benefits of NPPs (Jamali, 2015). Therefore, in 1988, the US Nuclear Regulatory Commission (NRC) revised the Emergency Core Coolant System (ECCS) guidelines in 10CFR50.46 to allow the use of the “best estimate plus uncertainty” (BEPU) method for safety analysis of NPPs (Ibarra, 1988; Gupta et al., 2013). According to the definition of BEPU given by the International Atomic Energy Agency (IAEA), there are three principles that should be observed (IAEA, 2002). (1) No pessimism is imported into the accident for the selected acceptance criteria; (2) use the best estimation procedure; and (3) perform uncertainty analysis on the calculation results. Following these principles, the BEPU method can obtain results that are very significant for the design and operation of NPPs. The comparison of uncertainty analysis to assess safety margins (Luo, 2012) with other traditional methods is shown in Figure 1. The upper limit values of BEPU method can be lower than the results of Appendix K (Wang et al., 2017) and conservative method, which is of benefit to the economics of nuclear power plants.
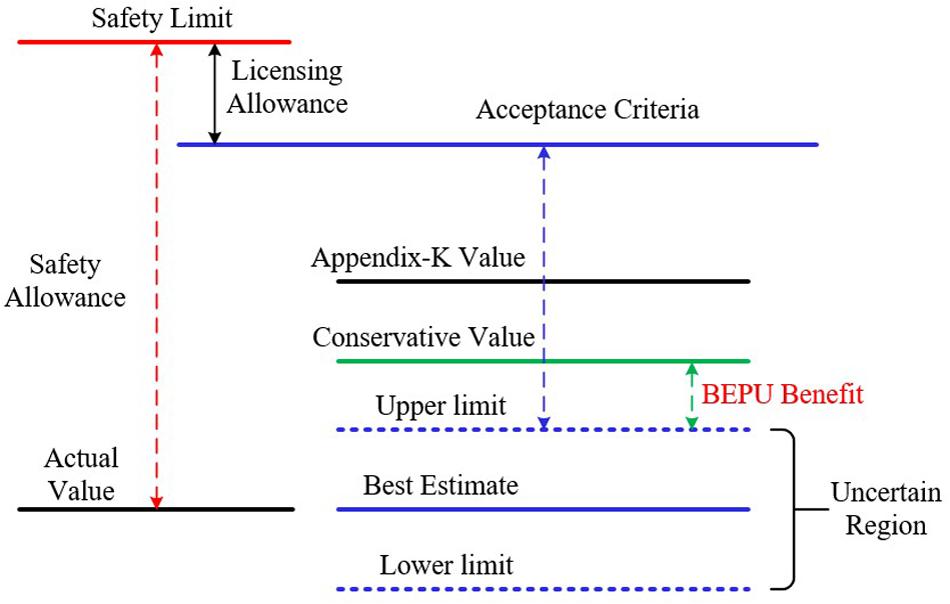
Figure 1. Comparison of safety margins in evaluating different methods.
For the BEPU method, there are many theoretical systems for typical input uncertainty parameters, such as CSAU (Boyack et al., 1990) in the United States, GRS (Glaeser, 2008) in Germany, and KINS-REM (KINS, 2005) in South Korea. The CSAU evaluation method developed by the NRC in 1989 is a systematic and integrated method that integrates accidents, tests, procedures, and power plants. Moreover, it can be used to quantify the uncertainty of complex systems. It provides a complete and logical analysis framework for the BEPU method and establishes an important foundation for the subsequent uncertainty analysis methods. The common process of BEPU is as follows (Helton and Davis, 2003): (1) Latin hypercube sampling (LHS) or other sampling methods are used to generate a set of samples. (2) The system simulations are performed with the above samples to the results. (3) Uncertainty analysis of the results is then performed to obtain the range of the parameters. (4) The relevance between input parameters and output parameters is conducted by the sensitivity study. In procedures (1) and (4), non-parametric sampling and testing based on the Wilks (Wilks, 1941) formula are commonly used, and sensitivity is evaluated with some correlation coefficients such as Pearson’s coefficient (Coefficient, 1996) or Spearman’s coefficient (Sedgwick, 2014).
Owing to the complexity and particularly serious consequences of the loss-of-coolant accident (LOCA) in pressurized water reactor (PWR), it is necessary to perform a more accurate analysis of the LOCA on the basis of the BEPU method. Ni C (CN, 2011) found that the peak cladding temperature (PCT) in the large-break LOCA (LBLOCA) of the AP1000 was still under the safety limit even with uncertainty. Zhikang et al. (2016) analyzed the LBLOCA of CPR1000, and he showed that although the input uncertainty will make the PCT higher than the best estimate, there is still a large margin to the safety limit. However, it was noted in the classic probabilistic safety assessment (PSA) analysis report WASH-1400 (Rasmussen, 1975) that small-break LOCA (SBLOCA), not LBLOCA, was the main factor resulting in the core melt accident. Many researchers used the BEPU method to analyze SBLOCA. Sanchez-Saez et al. (2017) presented a methodology and the application to G7.1 experiment. They performed uncertainty analysis of PKL SBLOCA G7.1 test simulation using TRACE with Wilks’ and GAM surrogate methods and found that for larger sample sizes, GAMPE and Wilks’ results present similar performance. Deng et al. (2019) accomplished an uncertainty analysis on the scaled passive system SBLOCA and found that key parameters such as the lowest core level of the reactor core remained above the safety limit.
Although some progress has been made on the SBLOCA uncertainty analysis of NPPs, the previous research still has some imperfections. In the process of researching the uncertainties and sensitivities of the input parameters, many scholars usually first studied the uncertainties and then carried out a sensitivity analysis (Perez et al., 2011; Gupta et al., 2013; Ghione et al., 2017; Sanchez-Saez et al., 2017; Wang et al., 2017, 2019; Sanchez-Saez et al., 2018). This order can share the same set of sampling parameters, which saves the sampling cost. However, there are some disadvantages in terms of computational efficiency and correlation analysis results.
1. The process of debugging in steady-state calculation is complicated, and the fluctuation of parameters may lead to the failure of convergence. The more parameters are changed, the more likely the system simulation program (e.g., RELAP5) will not to converge. This may produce a part number of invalid outputs that will be culled in uncertainty analysis, which wastes the samples and interferes with their statistical properties. Besides, it is difficult to know the distribution and probability density functions (PDFs) of various parameters accurately.
2. The definition of input parameters is not clear in the transient calculation. The “input” parameters of transient calculation are derived from the output of steady state, not directly from the input file. There is a significant difference in the calculation process between the system simulation program (e.g., RELAP5 and SAS-DIF3DK) (Dunn, 1999) and numerical calculation software [e.g., the particle transport code (MCNP) (Briesmeister, 1993)] and the computational fluid dynamics (CFD) software (FLUENT; ANSYS Inc, 2013, etc.). The input parameters, such as boundary conditions (wall temperature, wall heat flux, etc.) in the CFD will not change during the whole calculation process (Dunn et al., 2010; Cutrono Rakhimov et al., 2019; Dubois et al., 2019; Rakhimov et al., 2020). Therefore, CFD-based uncertainty analysis need not consider the change of input parameters. However, the system simulation program will modify the initial parameters to achieve steady-state operating conditions before performing transient calculations. The output of steady state may be introduced into the relationship even if the initial values are independent of each other. Some work only analyzed the initial parameters and the transient output and obtain the relevance between them (Ghione et al., 2017; Deng et al., 2019). Such conclusions only reflect the relevance between inputs and outputs from “user-input” to “transient computations,” rather than the relevance between the actual physical process.
3. Relationships between input parameters may be overlooked during sampling. For example, core power and coolant temperature are related in the physical process, but simple random sampling treats them as an independent. However, it should be noticed that the Wilks formula can only be applied to an independent random sample (Porter, 2019).
In summary, the traditional BEPU method, in which uncertainty analysis was followed by the sensitivity analysis, results in lower analysis efficiency. Excessive numbers of samples may increase the number of failed processes in RELAP, which will interfere with the distribution of output. Besides, the definition of input parameters is not clear in the transient calculation, which leads to a misunderstanding of the relationship between input and output parameters.
In this work, the process in steady state and the SBLOCA transient of PWR are analyzed based on an improved BEPU method. To improve the efficiency of the analysis, the sensitivity analysis with small sample size based on Wilks’ formula and LHS method is firstly adopted to find the key parameters with strong relationships, Afterward, uncertainty analysis is carried out, and the propagation law of uncertainty in the transient calculation process is illustrated. Furthermore, the traditional BEPU method is used to analyze and compare the results to show the rationality of the improved BEPU method. In this paper, section “Methodologies” establishes the RELAP5 code for a PWR (Yangyu, 2000). Section “Description and Modeling of the Pressurized Water Reactor” accomplishes the analysis of sensitivity and uncertainty with the improved BEPU method. Conclusions and discussions are illustrated in section “Sensitivity Analysis and Uncertainty Analysis.”
Methodologies
Improved Best Estimate Plus Uncertainty Method
Figure 2 shows the main process of the improved BEPU method, which partly referred to Sanchez’s work (Sanchez-Saez et al., 2018). The improved BEPU framework consists of 11 steps, in which the order of the sensitivity analysis and uncertainty quantification is swapped.
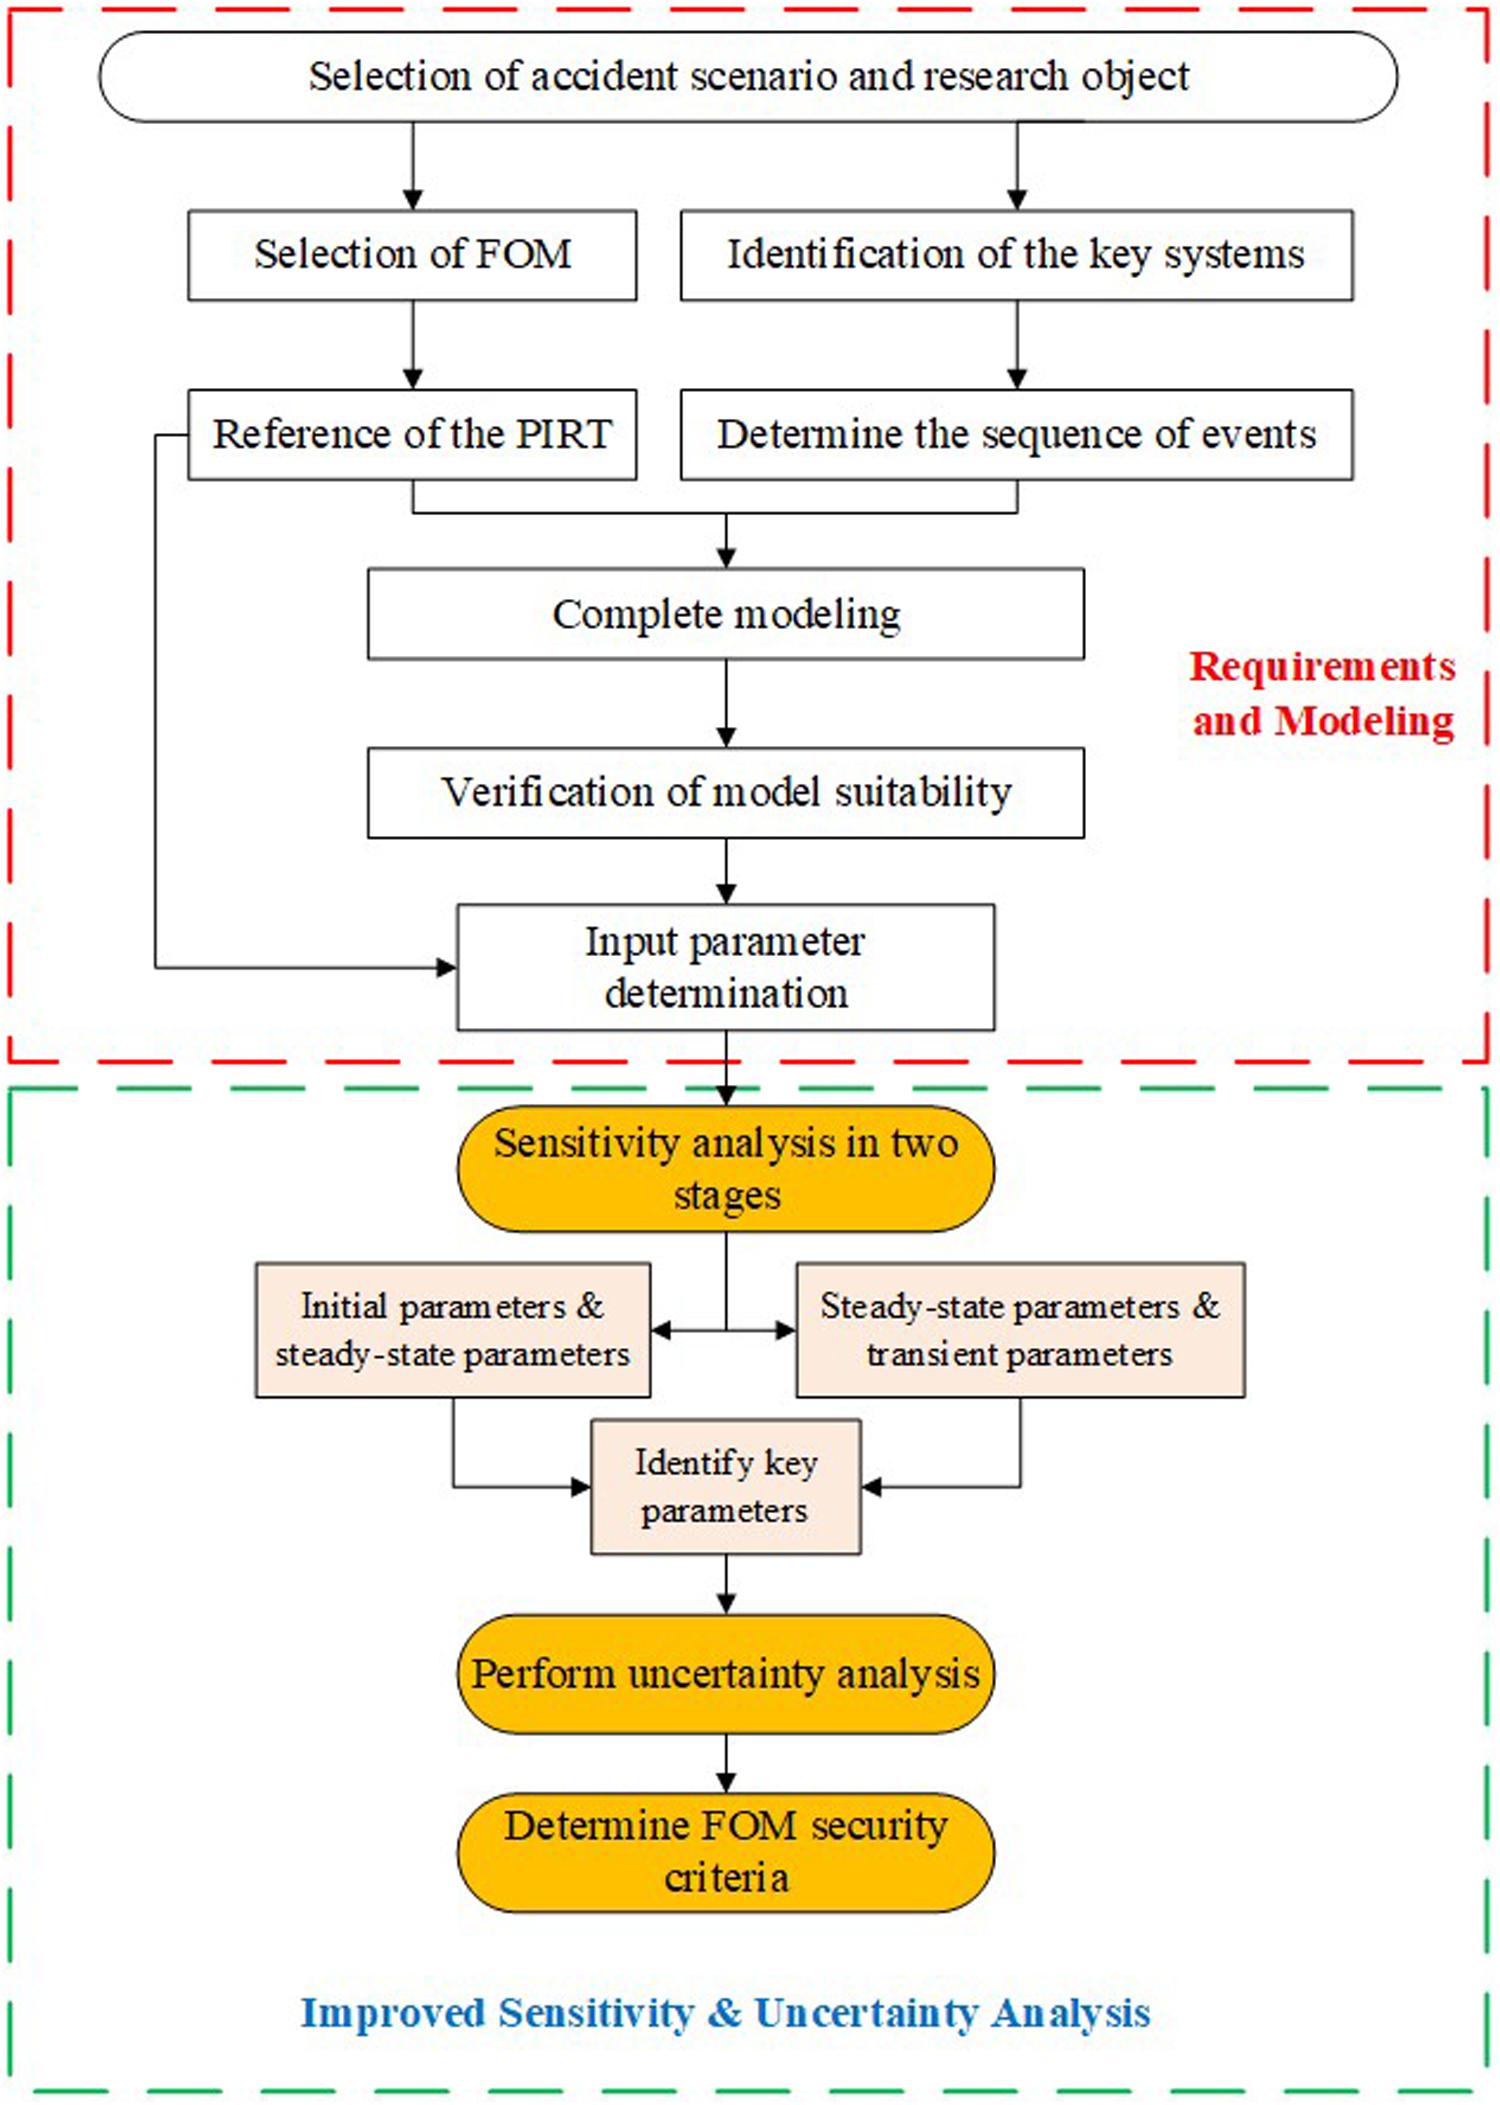
Figure 2. The framework of the improved best estimate plus uncertainty analysis (BEPU) method.
1. Select the accident scenario and research objects. There are different event sequences and key safety parameters in diverse accidents, which are closely related to a specific power plant system. Therefore, identifying accident scenarios and research objects is a prerequisite for the analysis.
2. Select the figure of merit (FOM). Important output parameters are usually selected as the indicators to evaluate the safety of NPP. The PCT and the peak core outlet temperature are selected as the FOMs.
3. Reference the Phenomena Identification and Ranking Table (PIRT) (Wilson and Boyack, 1998). In the PIRT, the important phenomena and parameters in accident analysis are mainly based on some selective calculations and judgments of experts, which is important guidance for the input parameters in the BEPU method.
4. Identify the key systems. Diverse systems are involved in different accident processes. The key systems under specific accident processes are identified to improve the modeling efficiency and ensure the accuracy of the calculation.
5. Determine the sequence of events. It ensures that the accident process of the model is consistent with that of the nuclear power plant.
6. Complete modeling. A model of NPP that meets the requirements of the simulations is established.
7. Verify the applicability of modeling. To ensure the accuracy of the calculation, the model needs to be analyzed in steady-state and transient-state calculations. The results are supposed to be consistent with some nominal values (Zhujian and Shoulv, 1992; Jizhou et al., 2004) to prove that the model is appropriate.
8. Determine the input parameters with uncertainties. This work mainly researches the uncertainty of input parameters, and their distributions are determined through PIRT and related literature research (Zhujian and Shoulv, 1992; Gupta et al., 2013; Sanchez-Saez et al., 2017).
9. Perform the sensitivity analysis to identify the key parameters. There are two stages involved during the sensitivity study in the improved BEPU method: (1) the sensitivity analysis between initial parameters and steady-state parameters and (2) the sensitivity analysis between steady-state parameters and transient parameters. The sensitivity analysis is firstly performed to reduce the number of inputs. Hence, only the key input parameters that have a significant impact on the calculation results are identified.
10. Perform uncertainty analysis. The range and propagation laws of uncertainties are obtained by analyzing the results.
11. Determine FOM security criteria. The confidence interval of the parameter is generated. The output parameters are verified whether they conform to the FOM.
Sampling and Statistical Methods
An important part of analyzing the propagation of uncertainty is the application of LHS. LHS is more stable than random sampling to produce distribution in a smaller sample space, which saves costs of computing (Helton and Davis, 2003). The rationality of LHS can be realized when the sample space is greater than 4/3 times the number of inputs (Helton and Davis, 2003; CN, 2011). In this work, 15 input parameters introduced uncertainties. As a result, in the sensitivity analysis, it is only necessary to ensure that the sample space of each parameter is greater than 20(15 ∗ 4/3). The specific numbers of the sample are given in detail below.
However, in the uncertainty analysis, because the non-parametric statistical method based on Wilks’ formula is adopted, a certain number of samples must be satisfied (Zhikang et al., 2016). Because this work outputs multiple parameters at the same time, the improved version of Wilks’ formula (Guba et al., 2003) is applied as shown in Eq. (1). The formula can be described as follows. For all values of any variable, at least a portion γ of them is within the confidence interval, with the probability of β. “p” represents the number of variables and “N” represents the size of samples.
The output parameters used to analyze the uncertainty include two parameters: the peak core outlet temperature and the lowest core level. Hence, p is equal to 2, and N is equal to 93. The sample space must be at least 93 to make reasonable uncertainty analysis of these two variables. According to Wilks’ theory in non-parametric test, 93 samples of output are enough to satisfy the upper boundary at the 95% confidence level with 95% probability, and vice versa.
Spearman’s coefficient is used to evaluate the sensitivity as shown in Eq. (2). It evaluates the relationships by rank rather than the original data. N is the number of samples (Sedgwick, 2014),
The closer the correlation coefficient corr(xi,yi) is to +1, the greater the positive relationship between the parameters, and vice versa. There are some guidelines for the relationship classification (Pawel and Mesina, 2011).
(1) |corr(xi,yi)| ∈ [0.7, 1.0] illustrates that the parameters (xi,yi) have a strong relationship.
(2) |corr(xi,yi)| ∈ [0.3, 0.69] illustrates that the parameters (xi,yi) have a medium relationship.
(3) |corr(xi,yi)| ∈ [0.0, 0.29] illustrates that the parameters (xi,yi) have a weak relationship.
Description and Modeling of the Pressurized Water Reactor
Based on RELAP5, this work establishes a model for a typical PWR as illustrated in Figure 3. The model is composed of the primary loop system, the necessary secondary equipment, and the dedicated safety facilities involved in SBLOCA. The primary loop system adopts a two-inlet–two-outlet layout structure, and each loop consists of one hot leg, one cold leg, one steam generator, and one pump. The high-pressure injection system (HPIS), accumulator (ACC) injection system, low-pressure injection system (LPIS), and reactor containment spray system (RCSS) are installed to perform SBLOCA.

Figure 3. The RELAP5 model nodalization.
Best Estimate Calculation of the Steady State
The specific goal of steady-state verification is to ensure that the steady-state value calculated by the simulation is sufficiently close to the nominal operating value of the NPP (Rockville, 2001). To ensure that the deviation between the main steady-state operating values and the target values is small enough, certain parameters (e.g., drag coefficients) are adjusted before the accident simulation. The comparison of the values obtained by RELAP5 in steady state and the nominal value of the NPP is listed in Table 1. The results illustrate that the calculated values are anastomotic with the nominal values of the key parameters of NPP operation.
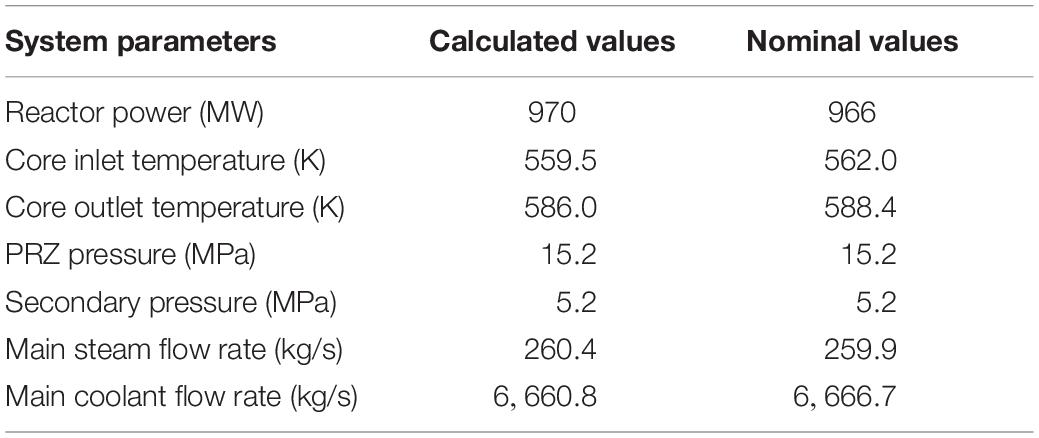
Table 1. Comparison of calculated and nominal values of the key parameters during the nuclear power plant (NPP) operation.
Best Estimate Calculation of the Small-Break Loss-of-Coolant Accident Transient
For this model, the nominal value of the break area is 0.0085 m2, which is an example to represent a small size break in SBLOCA (Murray, 1987; Jinhan and Fei, 1998). Pressure drop can be limited by isolating the steam generator, isolating the break, or increasing the flow of HPIS. The break is simulated by adding a time-controlled trip valve and a time-dependent control volume connected to the cold leg with the pressurizer.
The transient calculation is performed based on the converged steady-state calculation. Table 2 shows the sequence of events for the SBLOCA transient simulated by RELAP5. At 0 s, a break appears in the cold leg and an “S” signal is issued simultaneously. After 3 s, the reactor control rods drop. Three more seconds later, the main steam is isolated, and the main feedwater system stopped at the same time. To ensure that the core can be cooled, the HPIS starts when the pressure of the primary loop system drops to 12.25 MPa. The ACC injection is triggered after getting a lower pressure signal. To maintain the integrity of the reactor vessel, when the internal pressure of the vessel rises to 0.147 MPa, the RCSS starts to reduce the pressure. With the consumption of the security system of the cooling water, when the level of the refueling water tank drops to 2.26 m, the water source of the HPIS and the RCSS will be converted into pit water to realize the recycling of cooling water. When the level of the refueling water tank drops to 2.26 m, the water source of the HPIS and RCSS is converted into pit water.
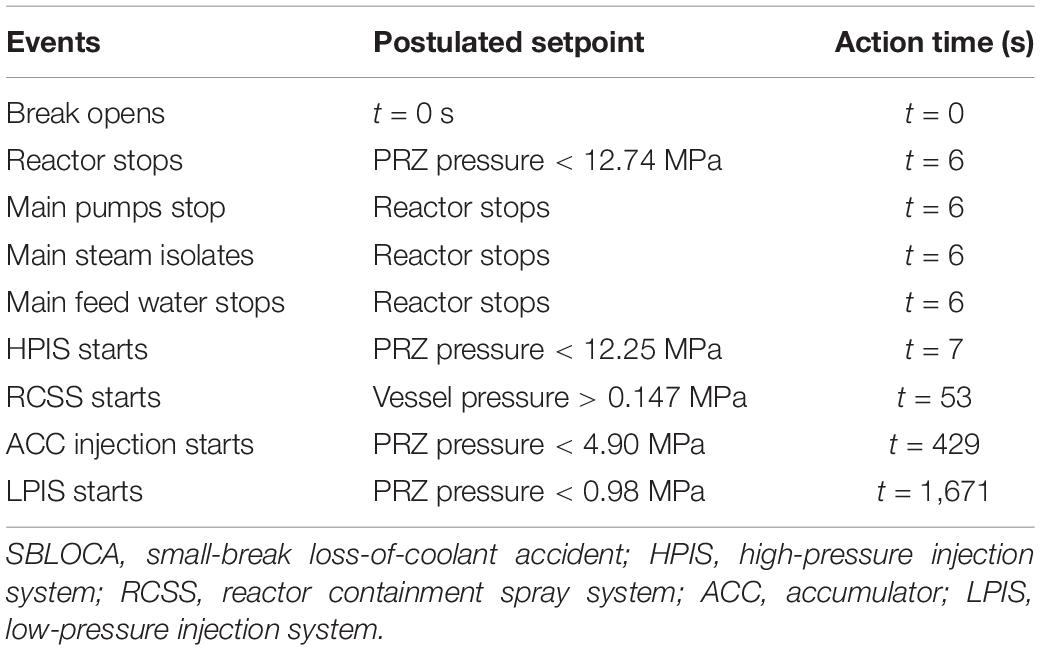
Table 2. Event sequence of SBLOCA transient.
The pressure of the system obtained during the transient simulation is compared with some nominal values (Zhujian and Shoulv, 1992; Jizhou et al., 2004). As illustrated in Figure 4, during the transient analysis of SBLOCA simulated by RELAP5 with different sizes of the breaks, the overall trend of pressure drop of the primary loop system is similar for all cases.
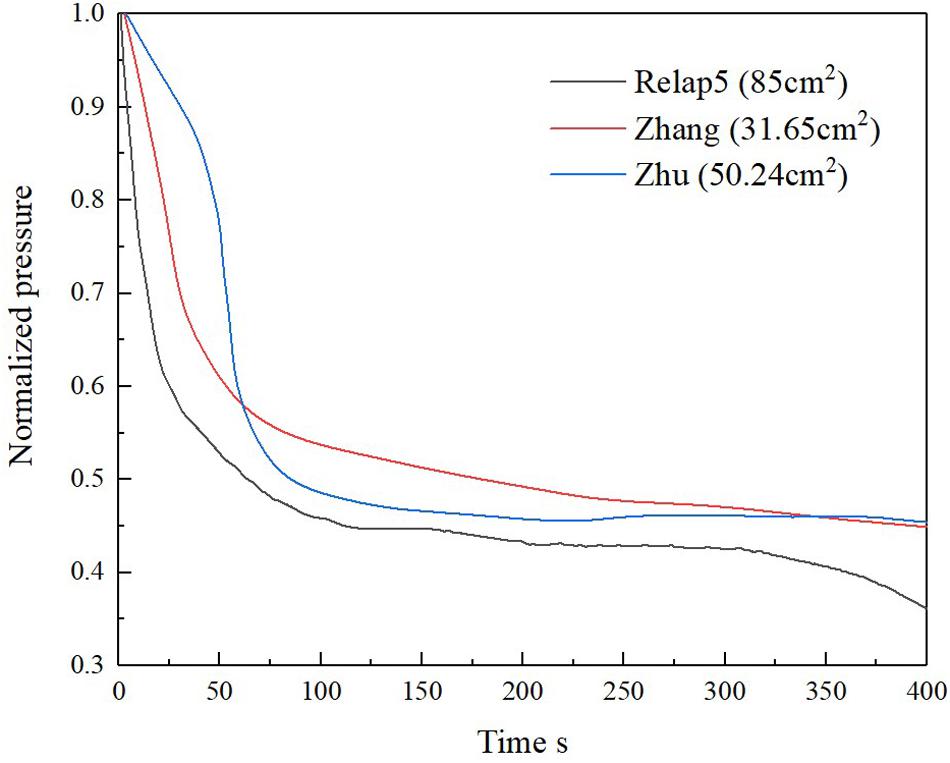
Figure 4. PRZ pressure in small-break loss-of-coolant accident (SBLOCA).
The different sizes of the breaks lead to the variation in the pressure drop rate. In the initial stage, the primary loop system pressure drops rapidly owing to the rapid leakage of coolant. The HPIS starts to inject coolant into the primary circuit after a period, which offsets the depressurization. Besides, the increasing pressure inside the containment vessel makes a pressure balance between the inside and outside of the coolant loop.
In this work, the process of SBLOCA is divided into four stages as illustrated in Figure 5, which are separated by vertical dashed lines, and the core height is indicated by the horizontal dashed line. They are spray stage, natural cycle stage, coolant seal stage, and long-term cooling stage.
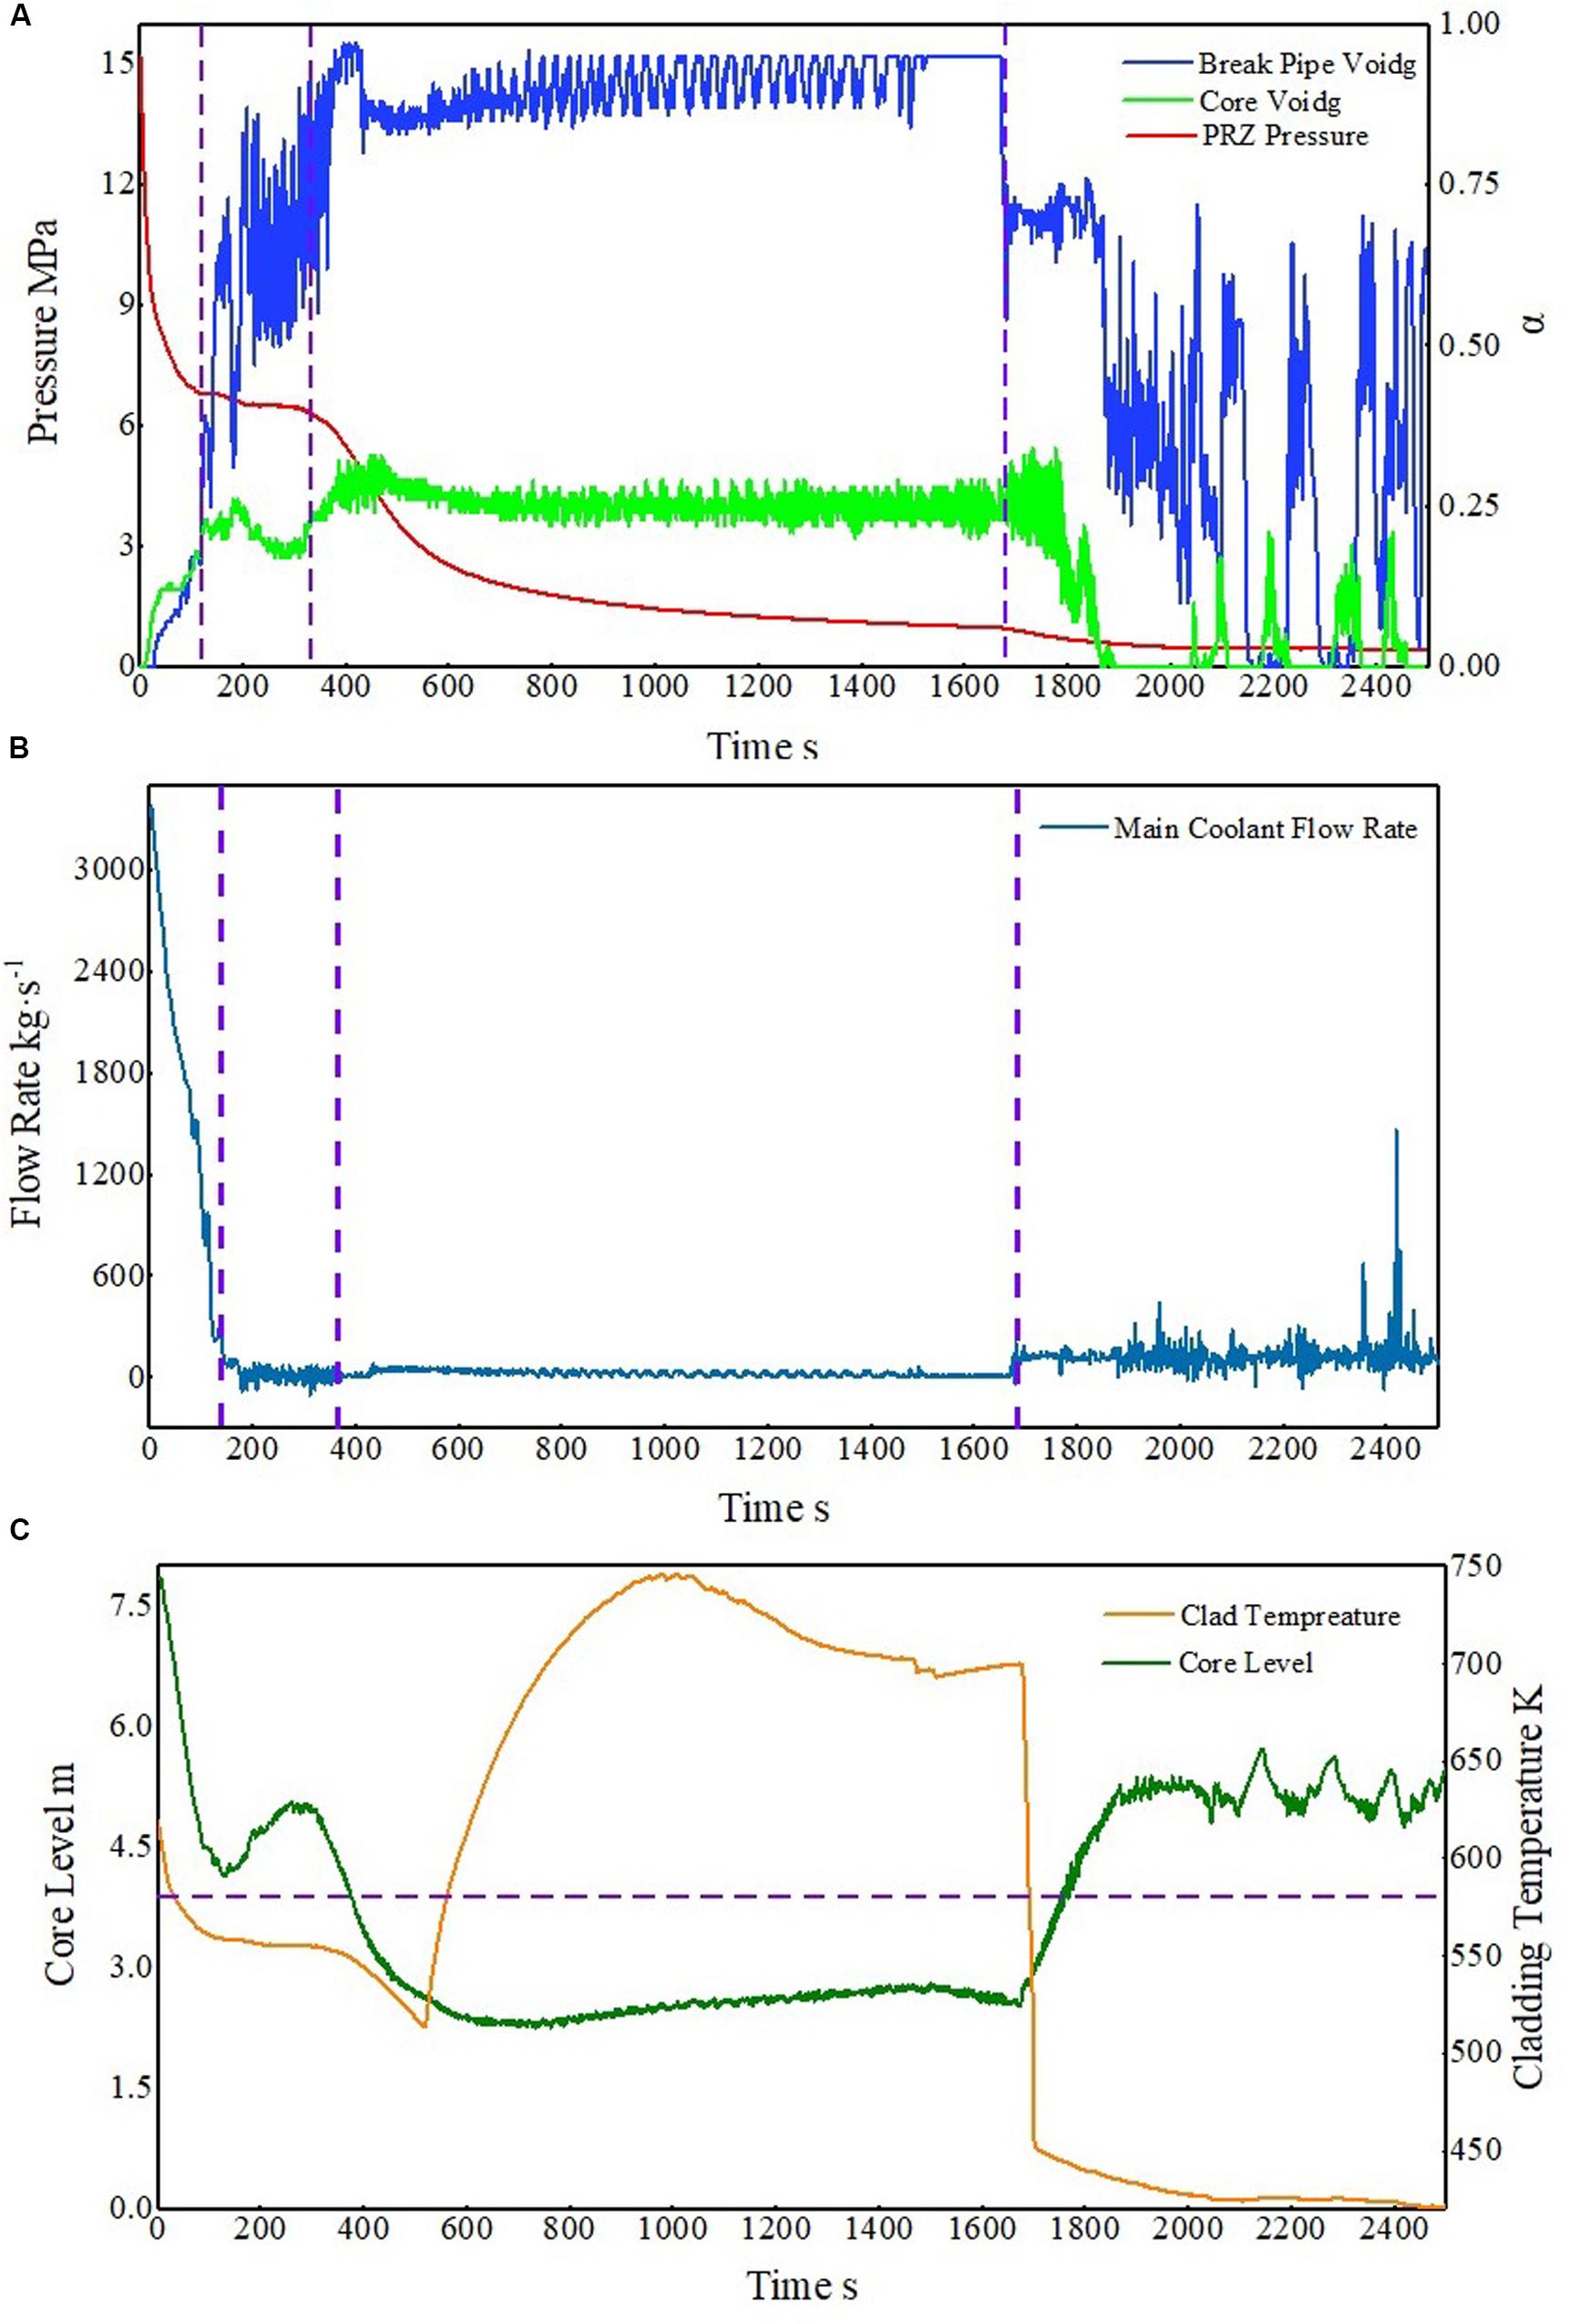
Figure 5. The process of small-break loss-of-coolant accident (SBLOCA). (A) Trends in pressure and quality of gas mixture. (B) Trends in main flow rate. (C) Trends in core level and clad temperature.
Spray Stage
At the initial stage of the break, the primary loop pressure drops rapidly owing to the loss of the coolant. This is because the break area is close to 90 cm2, which has reached between the medium-size small break and the large-size small break (Pingan et al., 2002). The effect of underheat pressure relief is more obvious, so the pressure decreases faster but not fast enough for ACC to start in time. As the pressure drops in the primary loop, the reactor and main pump shut down. Owing to the supercooling of the coolant, even if the pressure of the primary loop drops rapidly, the subcooled spray sustains for 26 s. After that, the process enters the saturation spray stage. At this stage, the break flow is so large that the primary loop pressure constantly decreases. Because the break is located between the core and IS, it is difficult for the coolant to be injected into the core. Because of the loss of the injection coolant from the break, the void fraction of the core keeps rising and the water level of the core constantly drops.
Natural Cycle Stage
The natural cycle stage comes after the spray stage. At this stage, the primary coolant pressure tends to be stable, which is called “pressure platform” (Jizhou et al., 2004), and the break flow decreases. Because of that, a small part of injection coolant can enter the core. The void fraction of the core decreases, and the water level rises caused by the cooling effect of this part of injection coolant.
Coolant Seal Stage
At this stage, only a small part of the coolant flows into the break loop. The “pressure platform” disappears, and the pressure begins to drop rapidly. At the beginning of this stage, the HPIS flow is less than the break flow, and there is no effective injection coolant entering the core. Nucleate boiling in the core heat channel can effectively discharge the decay heat, which makes the cladding temperature and the core water level decrease simultaneously. Then, owing to the large flow resistance, the steam cannot be discharged from the reactor core in time, which makes the boiling condition change and the deterioration of heat transfer. Because of this process, the cladding temperature rises. With the decrease of the primary loop pressure, the ACC injection system operates. More injection flows into the core, which leads to the core water level gradually stabilizing and increasing. After the lowest core water level, the thermal channel PCT appears, and then it decreases with the injection of the coolant. Because the flow of the ACC injection is driven by differential pressure, after about 1,500 s, the flow rate of the ACC decreases, and the temperature of the cladding begins to rise. After about 1,700 s, the primary loop pressure decreases to 0.98 MPa. Meanwhile, the LPIS operates. A large amount of coolant is injected into the core, and the cladding temperature plunges.
Long-Term Cooling Stage
A large amount of coolant is injected into the core by LPIS, which quickly submerges the reactor core.
Sensitivity Analysis and Uncertainty Analysis
Sensitivity Analysis
There are generally two main stages for accident analysis in RELAP5. Firstly, the steady-state calculation is performed based on the initial parameters to obtain the steady-state parameters. Then, the transient calculation is simulated based on the aforementioned steady-state results. The traditional BEPU method usually combines the above two stages to analyze the sensitivity between the initial parameters and the transient results. However, for a more comprehensive analysis of sensitivity, the steady-state and transient analyses is performed individually. As a result, the following two stages are involved during the sensitivity study in the improved BEPU method.
(1) The sensitivity analysis between initial parameters and steady-state parameters.
(2) The sensitivity analysis between steady-state parameters and transient parameters.
In the first stage, the combined effects from RELAP5 and the initial parameters on the steady-state parameters can be researched. Afterward, the relationships between steady-state parameters and transient output parameters can be found in the second stage. Eventually, the third stage is used to study the relationship between initial parameters and the transient parameters.
The safety facilities are put into operation after the accident occurred so that the accident-related parameters listed in Table 3 do not participate in the first stage, while the hydraulic constants and properties of the materials have been participating in all stages of calculation and analysis.
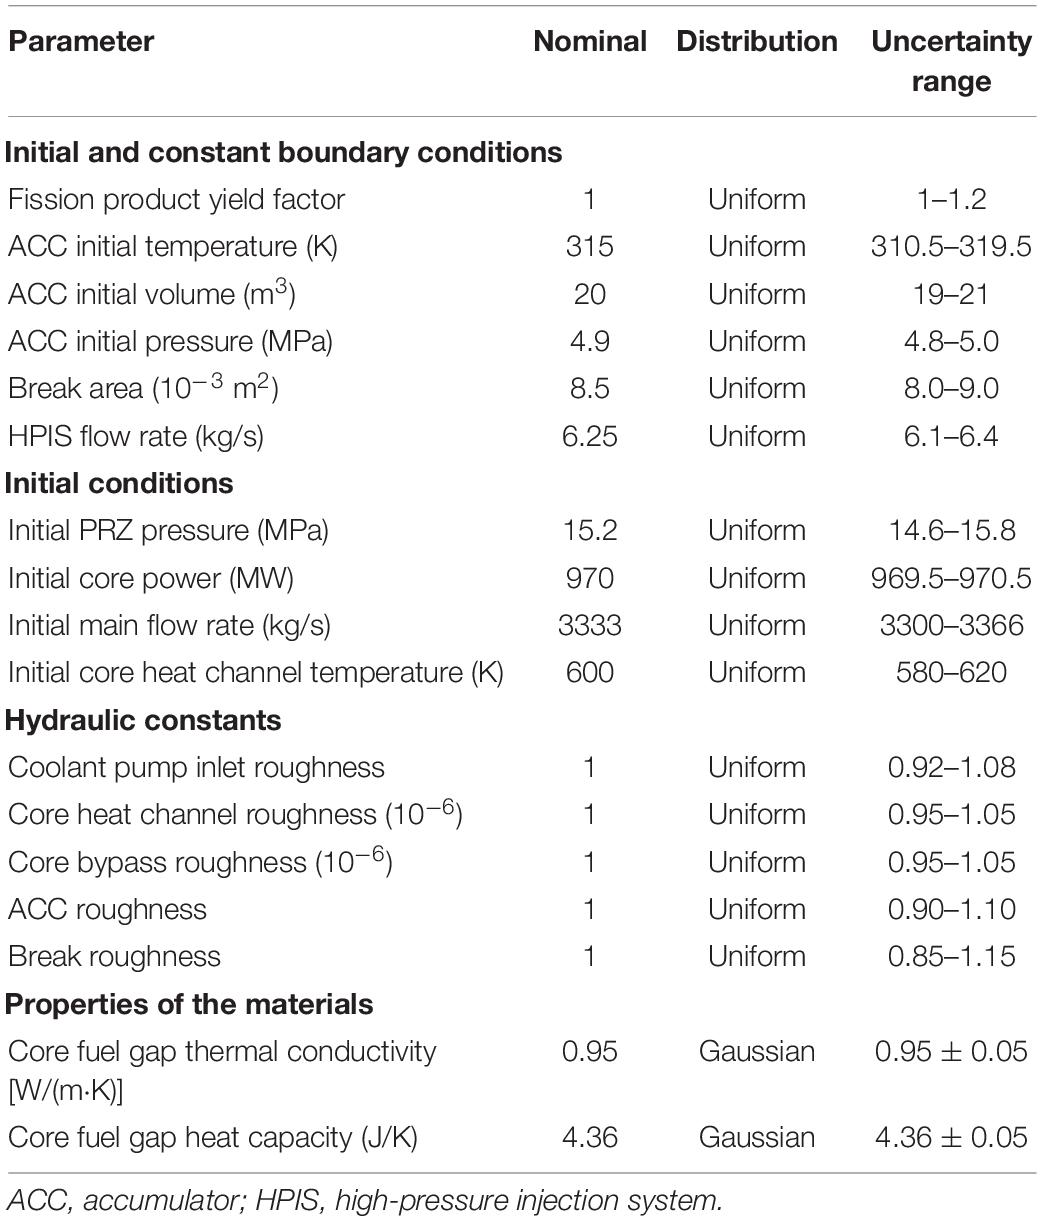
Table 3. Input parameters for sensitivity analysis.
For the sensitivity analysis, 15 input parameters are adopted and summarized in Table 3. For undisclosed parameters, such as configurations of ACC, HPIS, and pump, common values are used and corresponding uncertainties and PDFs are introduced. For the roughness that has been adjusted many times, it is adopted as the expectation, and corresponding uncertainty is introduced. The value of this roughness can make the steady-state parameters conform to the design parameters. Considering fluctuations in actual operation, uncertainties and corresponding PDFs are also introduced for important thermal parameters of the reactor, such as PRZ pressure, core power, main flow rate, and core heat channel temperature.
Generally, the thermal physical properties of the material, such as core fuel gap thermal conductivity and its heat capacity, can be obtained from the manufacturers. They are usually specified as the Gaussian distributions with mean values and standard deviations (Wang et al., 2017).
As for thermal and hydraulic parameters, there is no definitive uncertainty information existing owing to the fluctuation in actual operation, so a uniform PDF can be adopted without certain mean values.
In theory, the sample size of 4/3 as the number of parameters is enough for the sensitivity analysis, but the comparison in Figures 5–7 shows that expanding the sample space on the basis of requirement “4/3” can effectively reduce the analysis accuracy caused by insufficient data (CN, 2011). Considering that the sensitivity analysis of large sample space is more accurate, 91 samples are adopted rather than 26 samples.
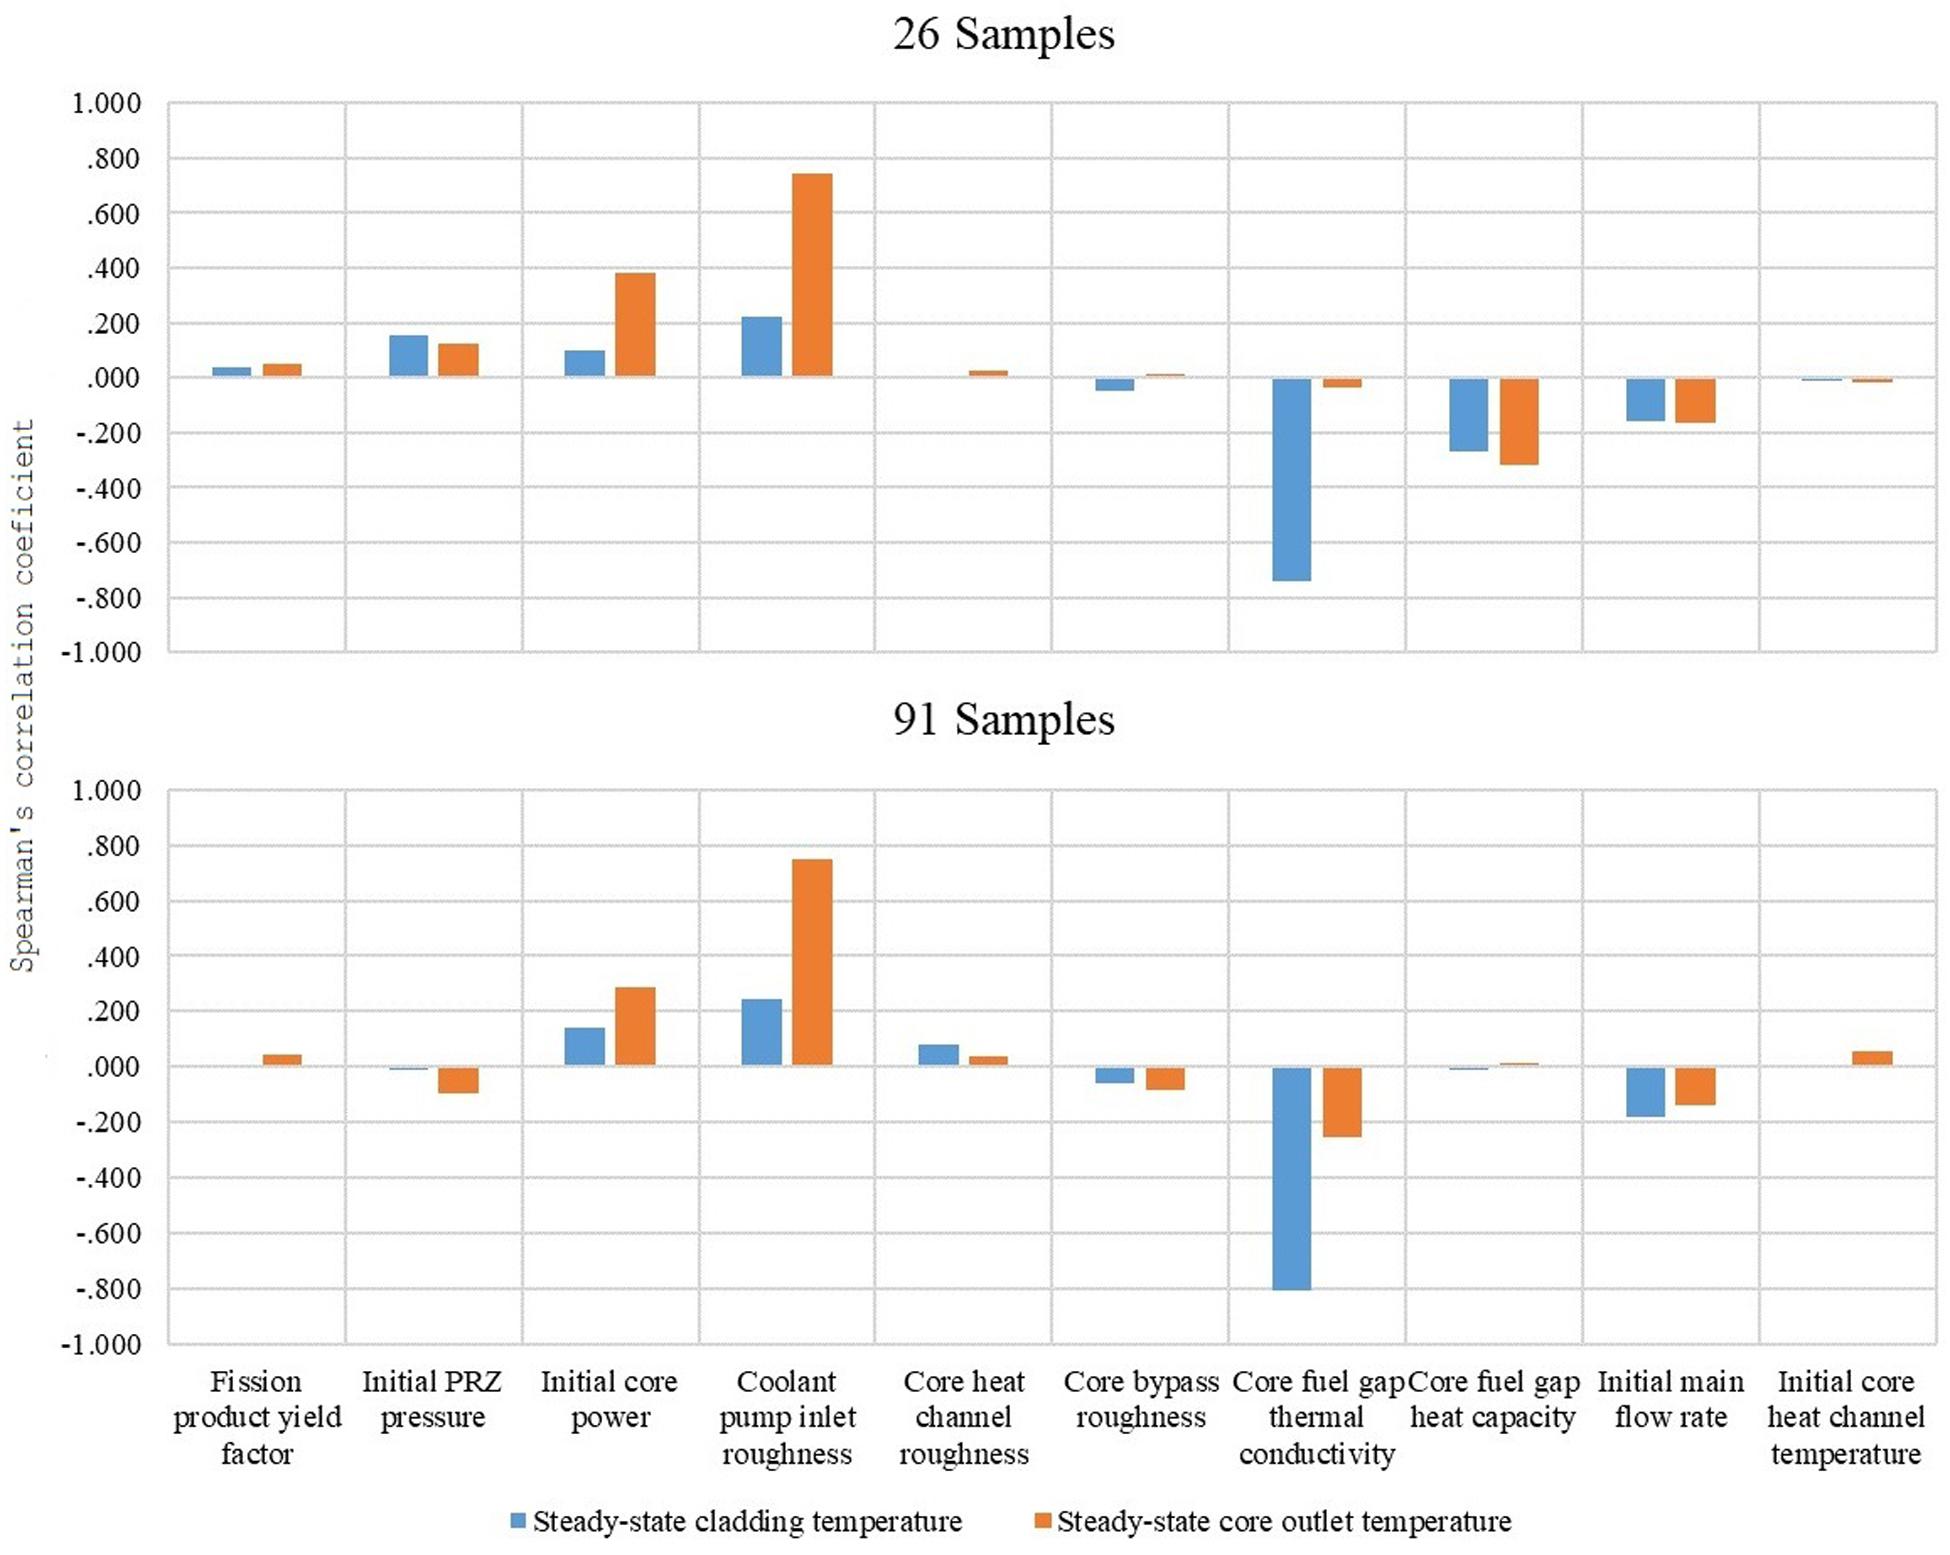
Figure 6. Sensitivity between initialization parameters and steady-state core outlet temperature.
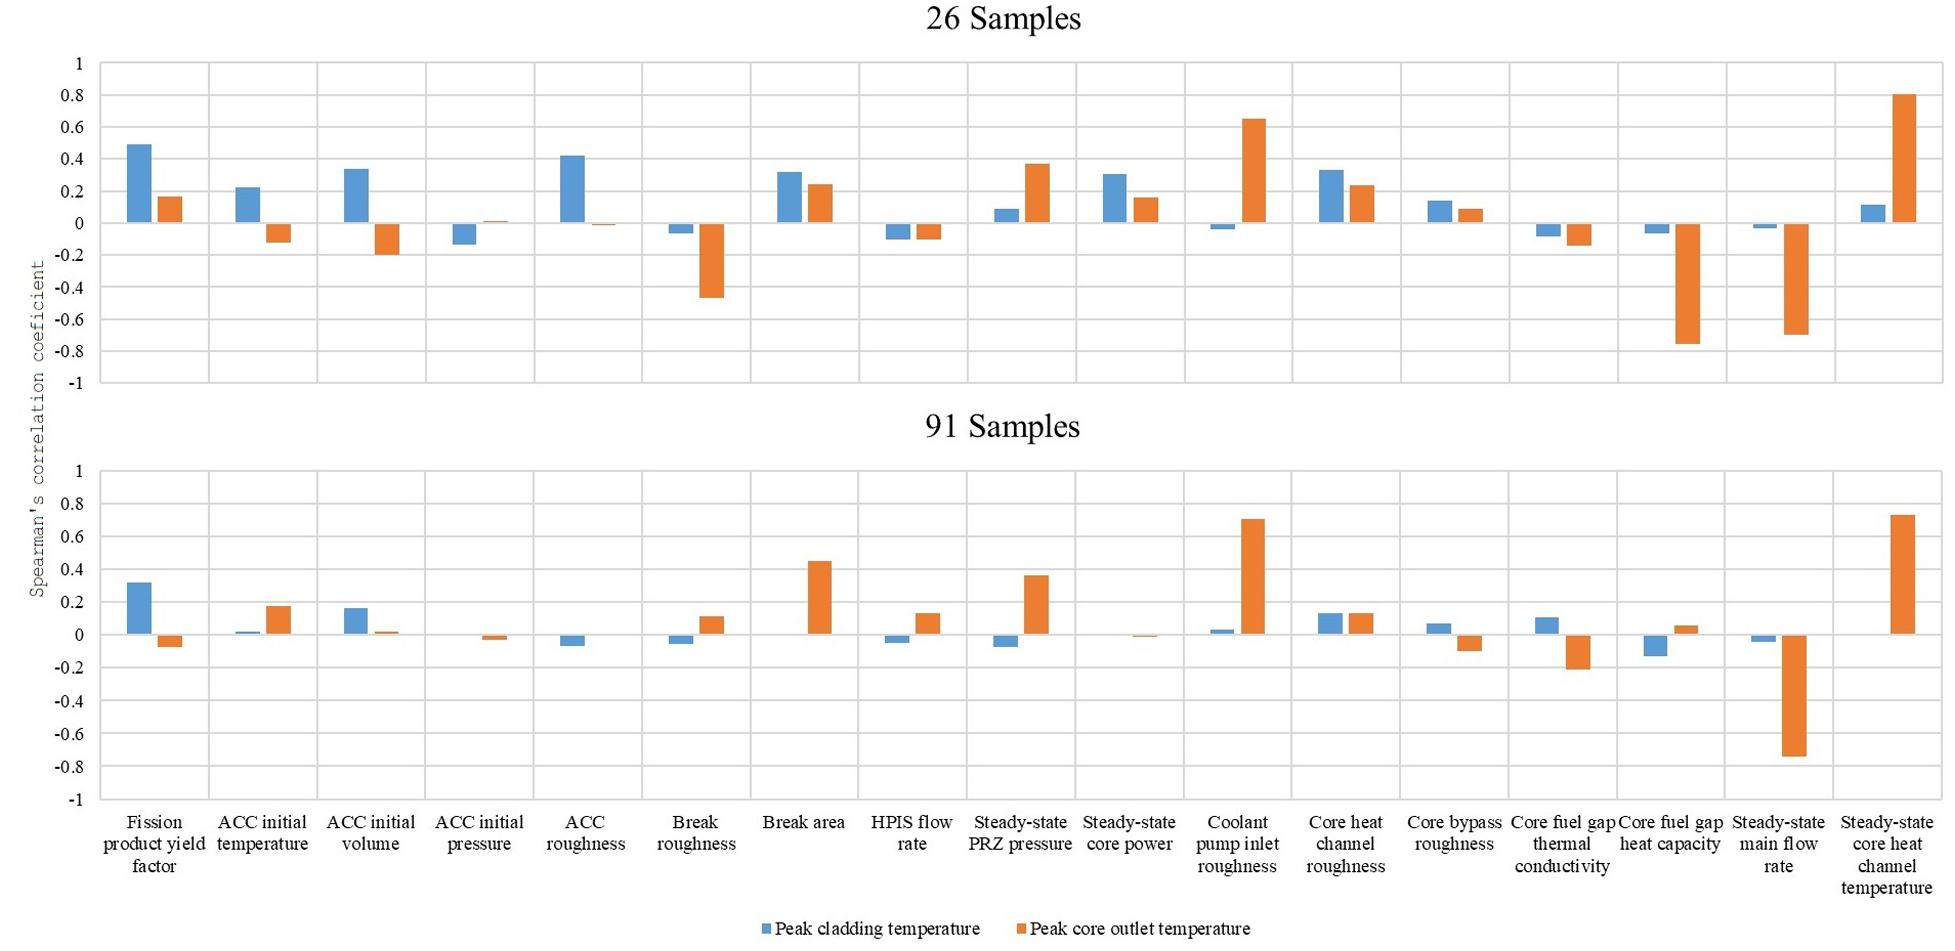
Figure 7. Sensitivity between steady-state parameters and figures of merit (FOMs).
The number of input parameters selected in this work is 15, so 20 samples are enough for the sensitivity analysis (Helton and Davis, 2003; CN, 2011). Owing to the complex modeling structure of the reactor, the calculations of the remaining four samples failed and were abandoned. After testing, the input parameters of the 26 samples are consistent with those of the original PDF, and the same is true of the 91 selected after testing.
Comparing the two sensitivity analyses as shown in Figures 6–8, it can be seen that there are certain differences. Finally, 91 samples are selected for the sensitivity analysis, which has higher accuracy.
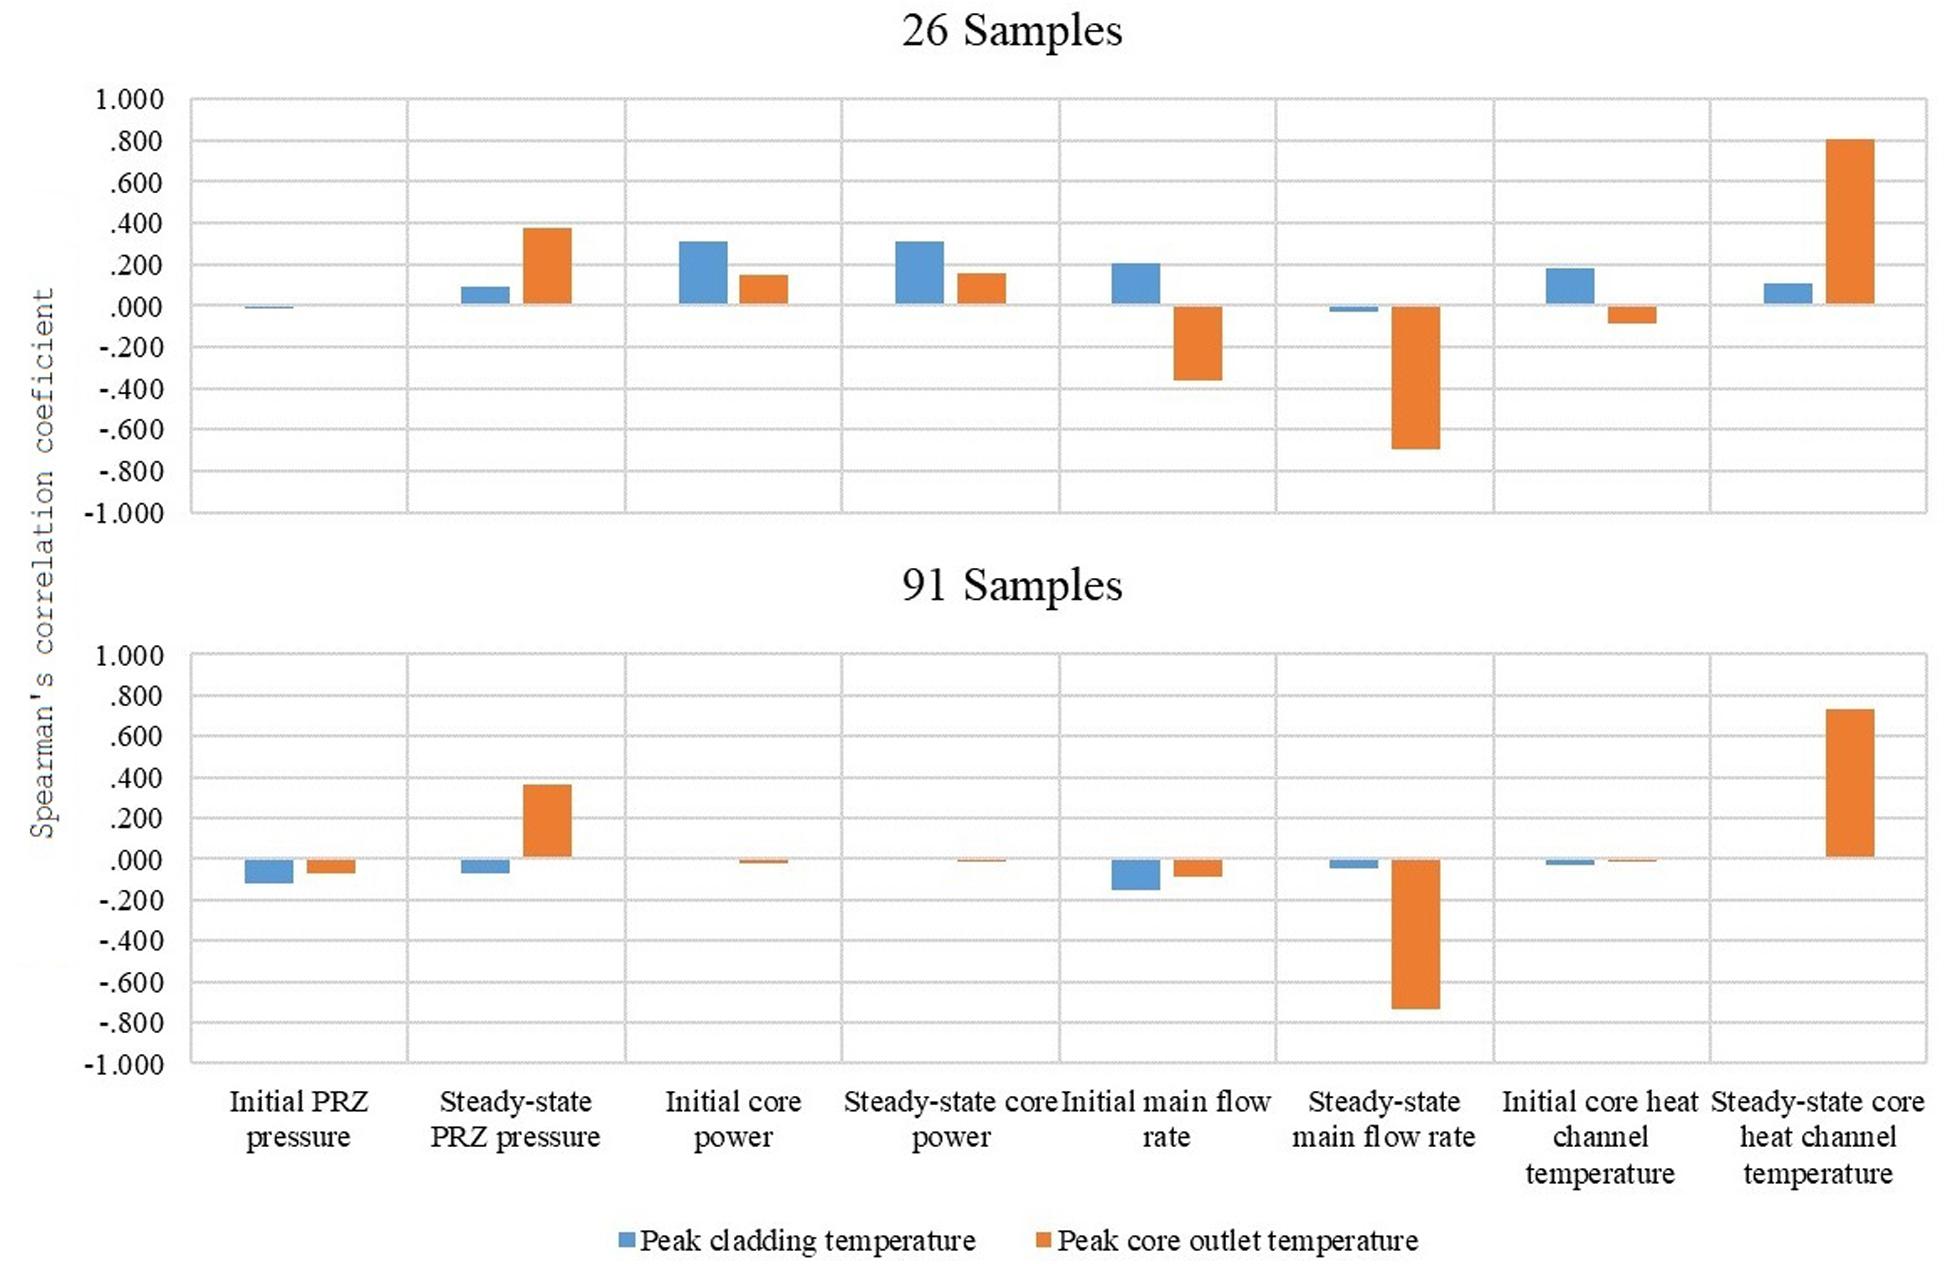
Figure 8. The comparison between the initial parameters and the steady-state parameters with the output figures of merit (FOMs).
Figure 6 illustrates the sensitivity between initial parameters and steady-state core outlet temperature.
In the first stage, core fuel gap thermal conductivity is significantly negatively correlated with steady-state cladding temperature. This is because the higher thermal conductivity makes the overall thermal resistance of gap and cladding lower, so that heat can be removed in time, which will eventually result in a lower cladding temperature.
Coolant pump inlet roughness and steady-state core outlet temperature are significantly positively related. This is because higher friction results in the decrease of flow in pump, which reduces the heat transport capacity of the coolant and makes its temperature higher.
Core power and steady-state core outlet temperature are medium positively related. That high power results in high coolant temperatures is reasonable. However, the correlation is not very obvious owing to the feedback of the reaction.
The other correlations with steady-state cladding temperature and steady-state core outlet temperature are weak.
The sensitivity analysis in the second stage is shown in Figure 7. This stage strictly reflects the sensitivity between the input parameters and the FOMs.
For PCT, the fission product yield factor is moderately related to it. This is because the high fission product yield factor leads to higher decay power. In the process of calculation, as the source of heat increases (higher decay power), the thermal resistance from the pellet to coolant decreases slightly. This eventually makes their temperatures increase but decreases the positive correlation owing to changes in thermal conductivity. However, owing to the decrease in thermal conductivity, the correlation is not very strong.
For peak core outlet temperature, there are three factors of significant relationship – coolant pump inlet roughness, steady-state main flow rate, and steady-state core heat channel temperature. The decrease in flow due to high pump inlet roughness increases the coolant temperature both in the core heat channel and at the core outlet. Both the break area and steady-state PRZ pressure have medium positive relationships with the peak core outlet temperature. This is because high steady-state pressure and larger size of small break can make coolant main flow reduce faster, which raises the core outlet temperature.
The sensitivity results of the traditional BEPU method are shown in Figure 8. Meanwhile, the related results of stage (2) are also given as a comparison. As illustrated in Figure 7, both the steady-state main flow rate and the steady-state core heat channel temperature have strong relationships with peak core outlet temperature, whereas the relationship with their initial values is very weak. Meanwhile, the steady-state PRZ pressure has a medium relationship with the peak core outlet temperature, which cannot be found in the initial PRZ pressure. To analyze the difference in sensitivity results, the relationship between PRZ pressure, main flow rate, and core heat channel temperature is analyzed in the initial situation and steady state, as shown in Figure 9. It illustrates that the PRZ pressure, main flow rate, and core heat channel temperature are tightly related when the reactor is operating in a steady state. However, the traditional sensitivity analysis ignores the relationship by independent sampling, which probably ignores the key factors that affect FOMs. Hence, it is more reasonable to take steady-state parameters as inputs in the sensitivity analysis of transient.
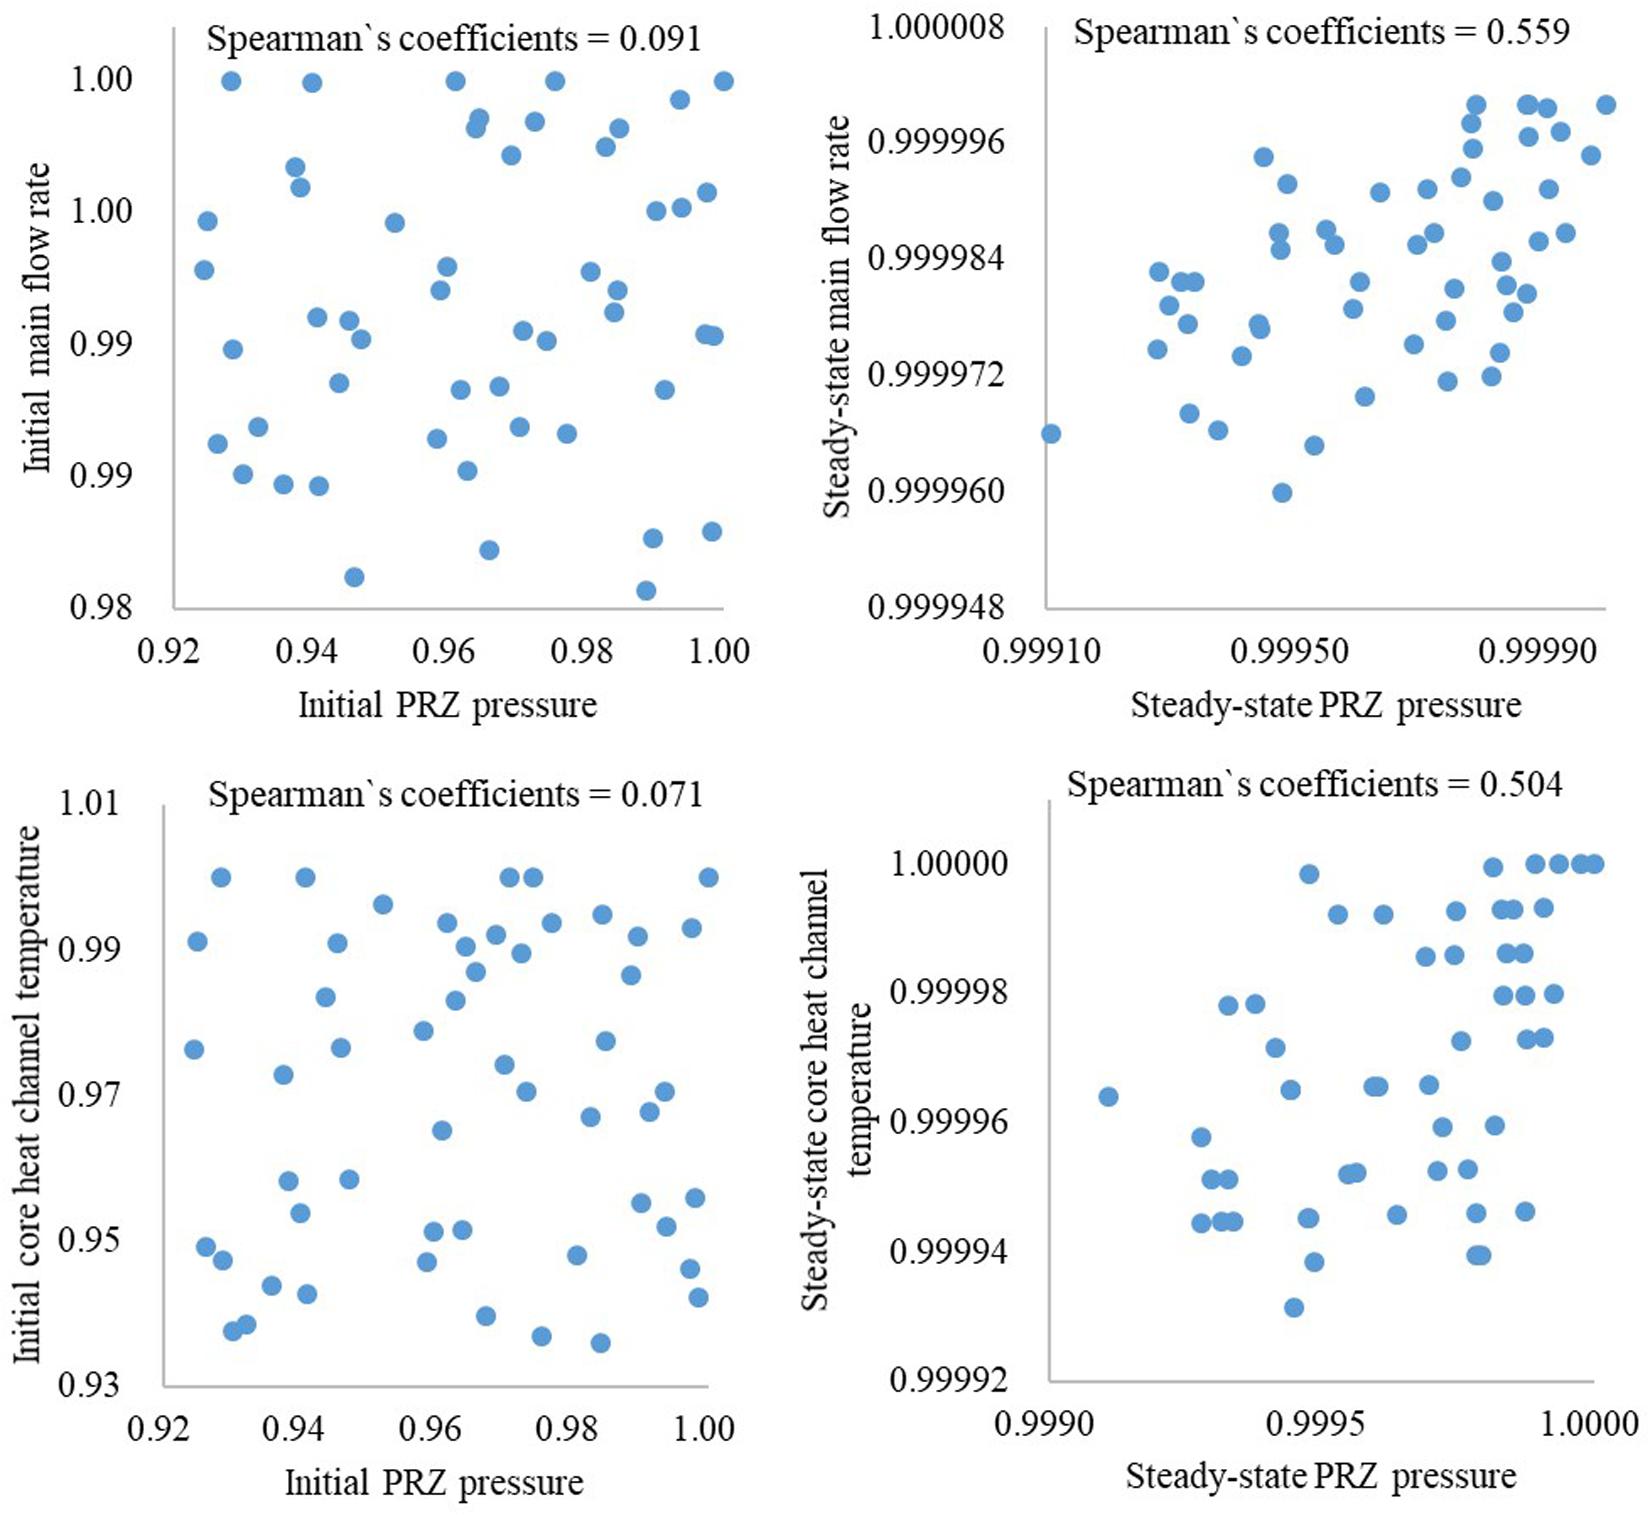
Figure 9. The relationship between initial and steady-state input parameters.
The sensitivity analysis framework of the improved BEPU method is summarized in Figure 10. PRZ pressure and main flow rate are selected as inputs for an example. The initial parameters are sampled independently according to the distributions and uncertainty ranges in Table 3. However, during the calculation process in RELAP5, all parameters are adjusted to obey the physical laws. Because of that, after the steady-state calculation, the PRZ pressure and main flow rate become highly correlated (illustrated in Figure 9). This process can also be considered as a correlative sampling of irrelevant parameters.
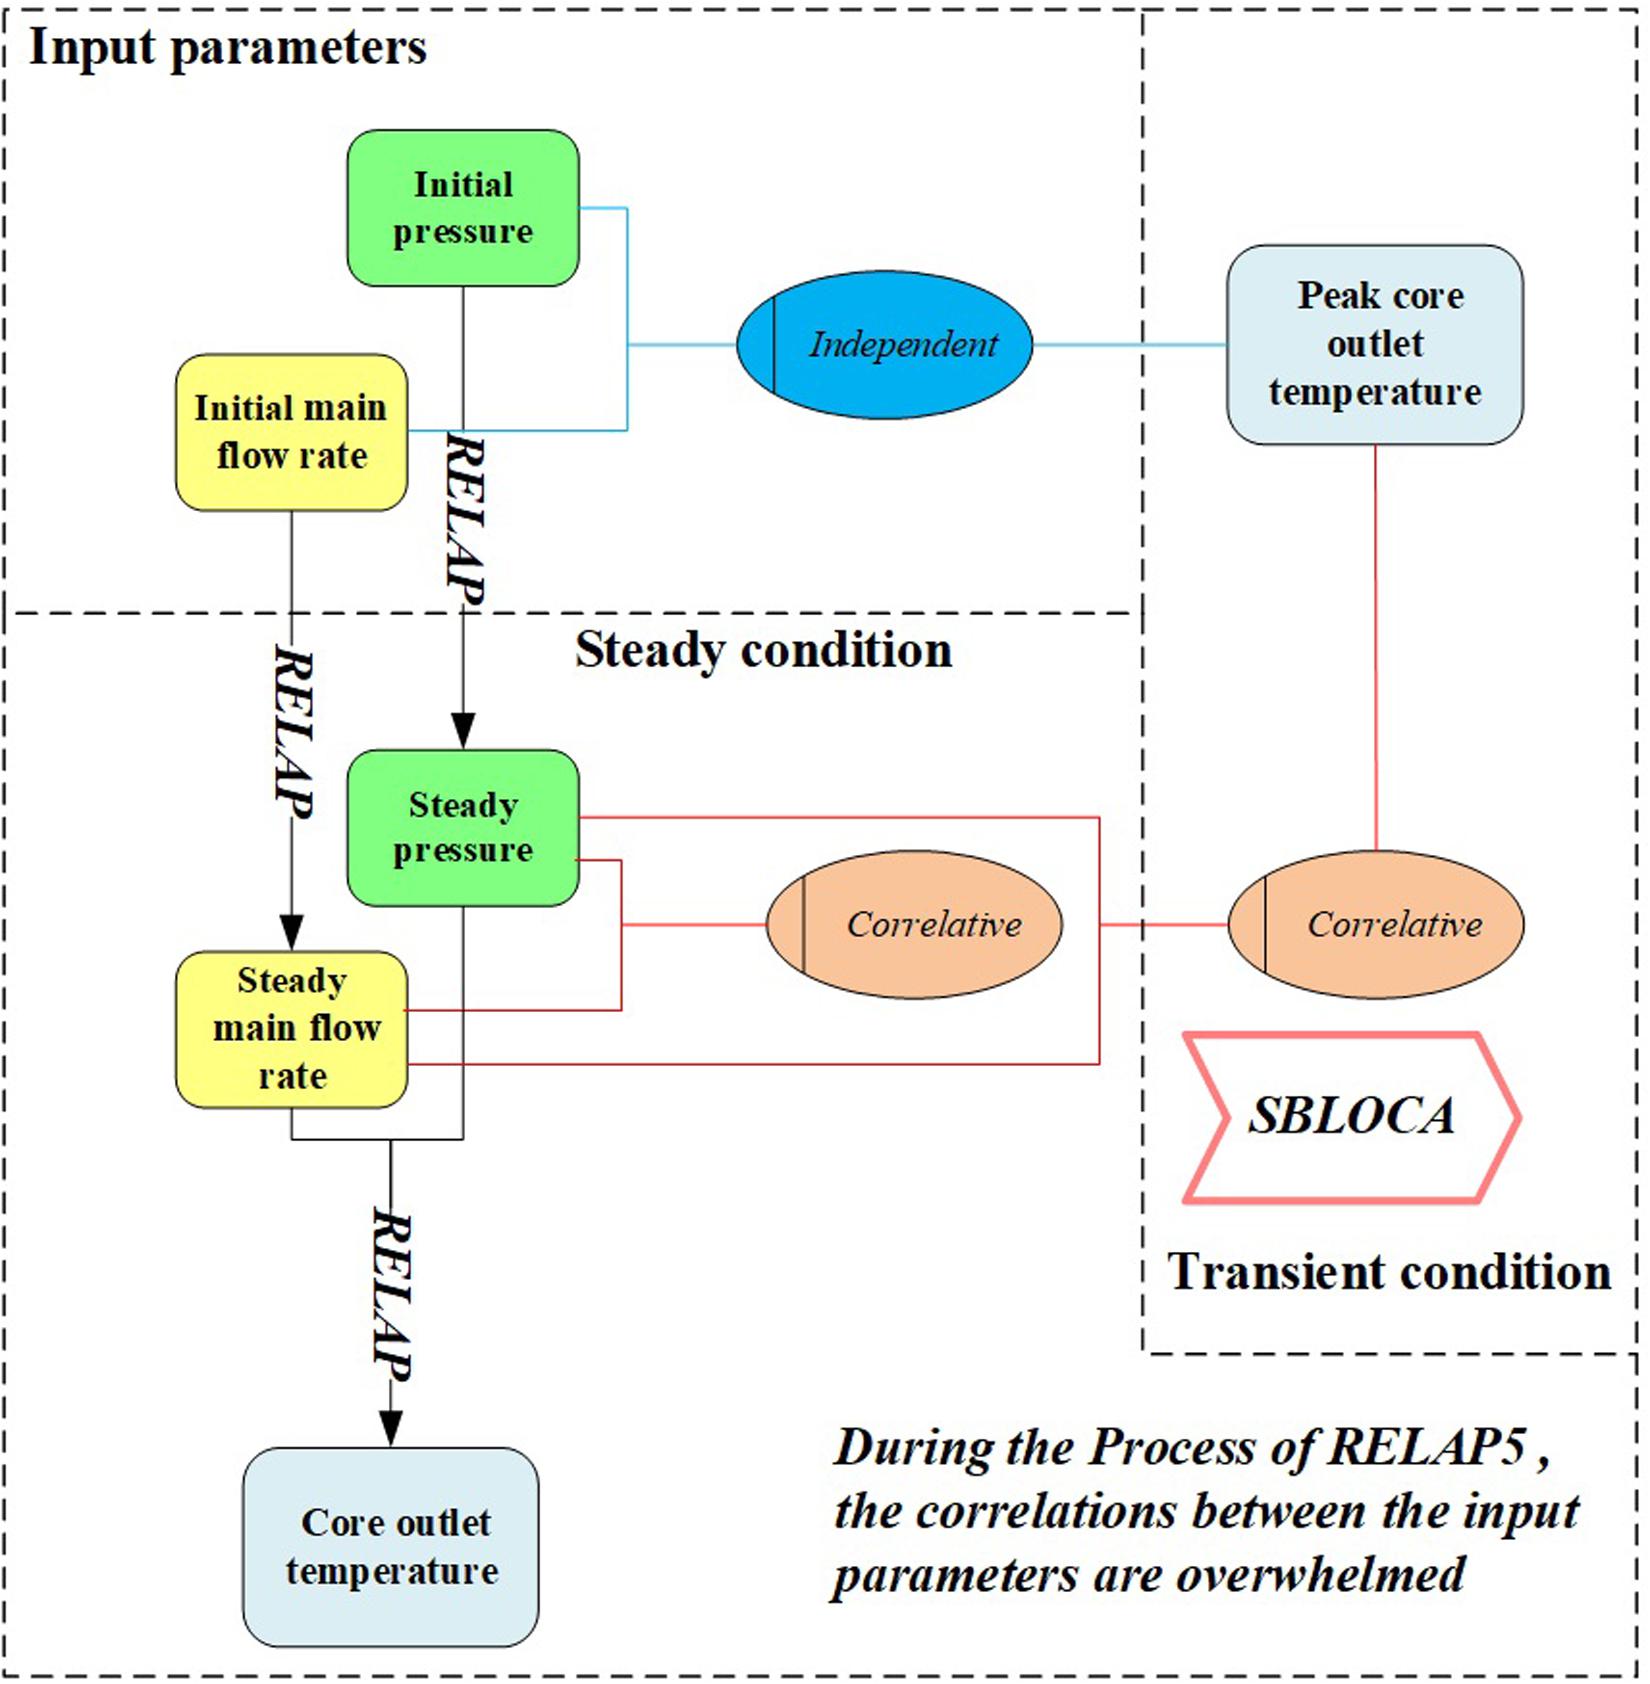
Figure 10. The improved sensitivity analysis process.
Uncertainty Analysis
Uncertainty analysis is performed for peak core outlet temperature and the PCT of SBLOCA. The parameters with strong relationships are sampled in Table 4. Some of the coefficients go to 0, and the others go up to 1 when the sample size goes from 26 to 91. The principle of sampling is to choose the parameters with a correlation coefficient greater than 0.3. Six parameters are selected to perform uncertainty analysis. The results of the improved BEPU method are shown in Figure 11. For comparison, Figure 12 shows the result of the traditional BEPU method.
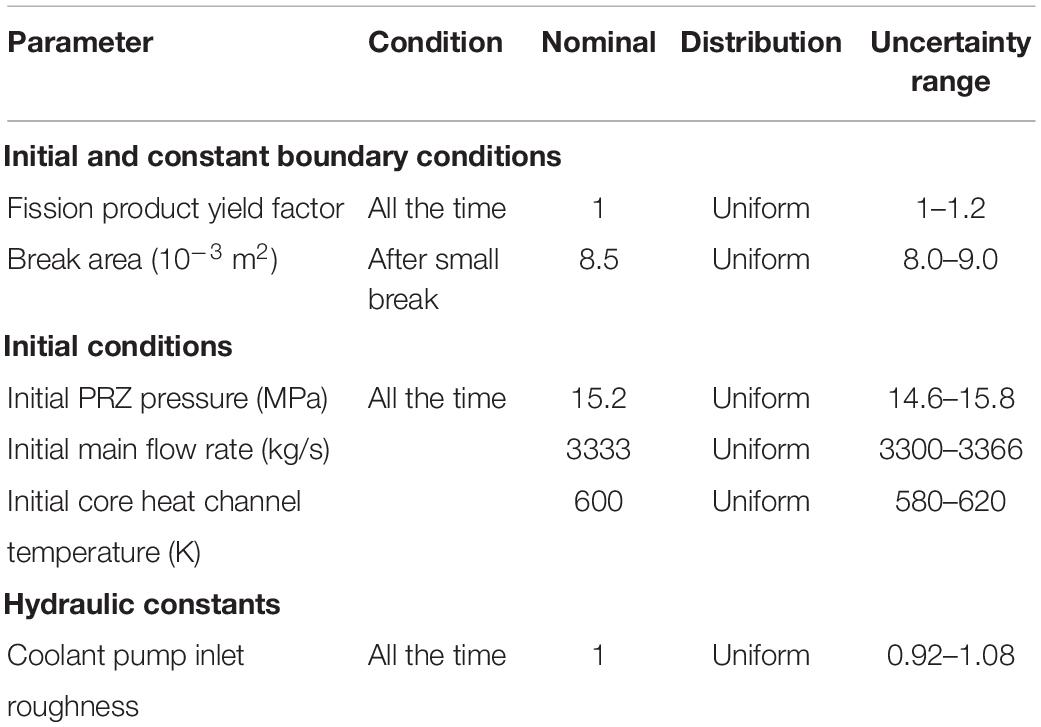
Table 4. Input parameters for uncertainty analysis of the improved BEPU method.
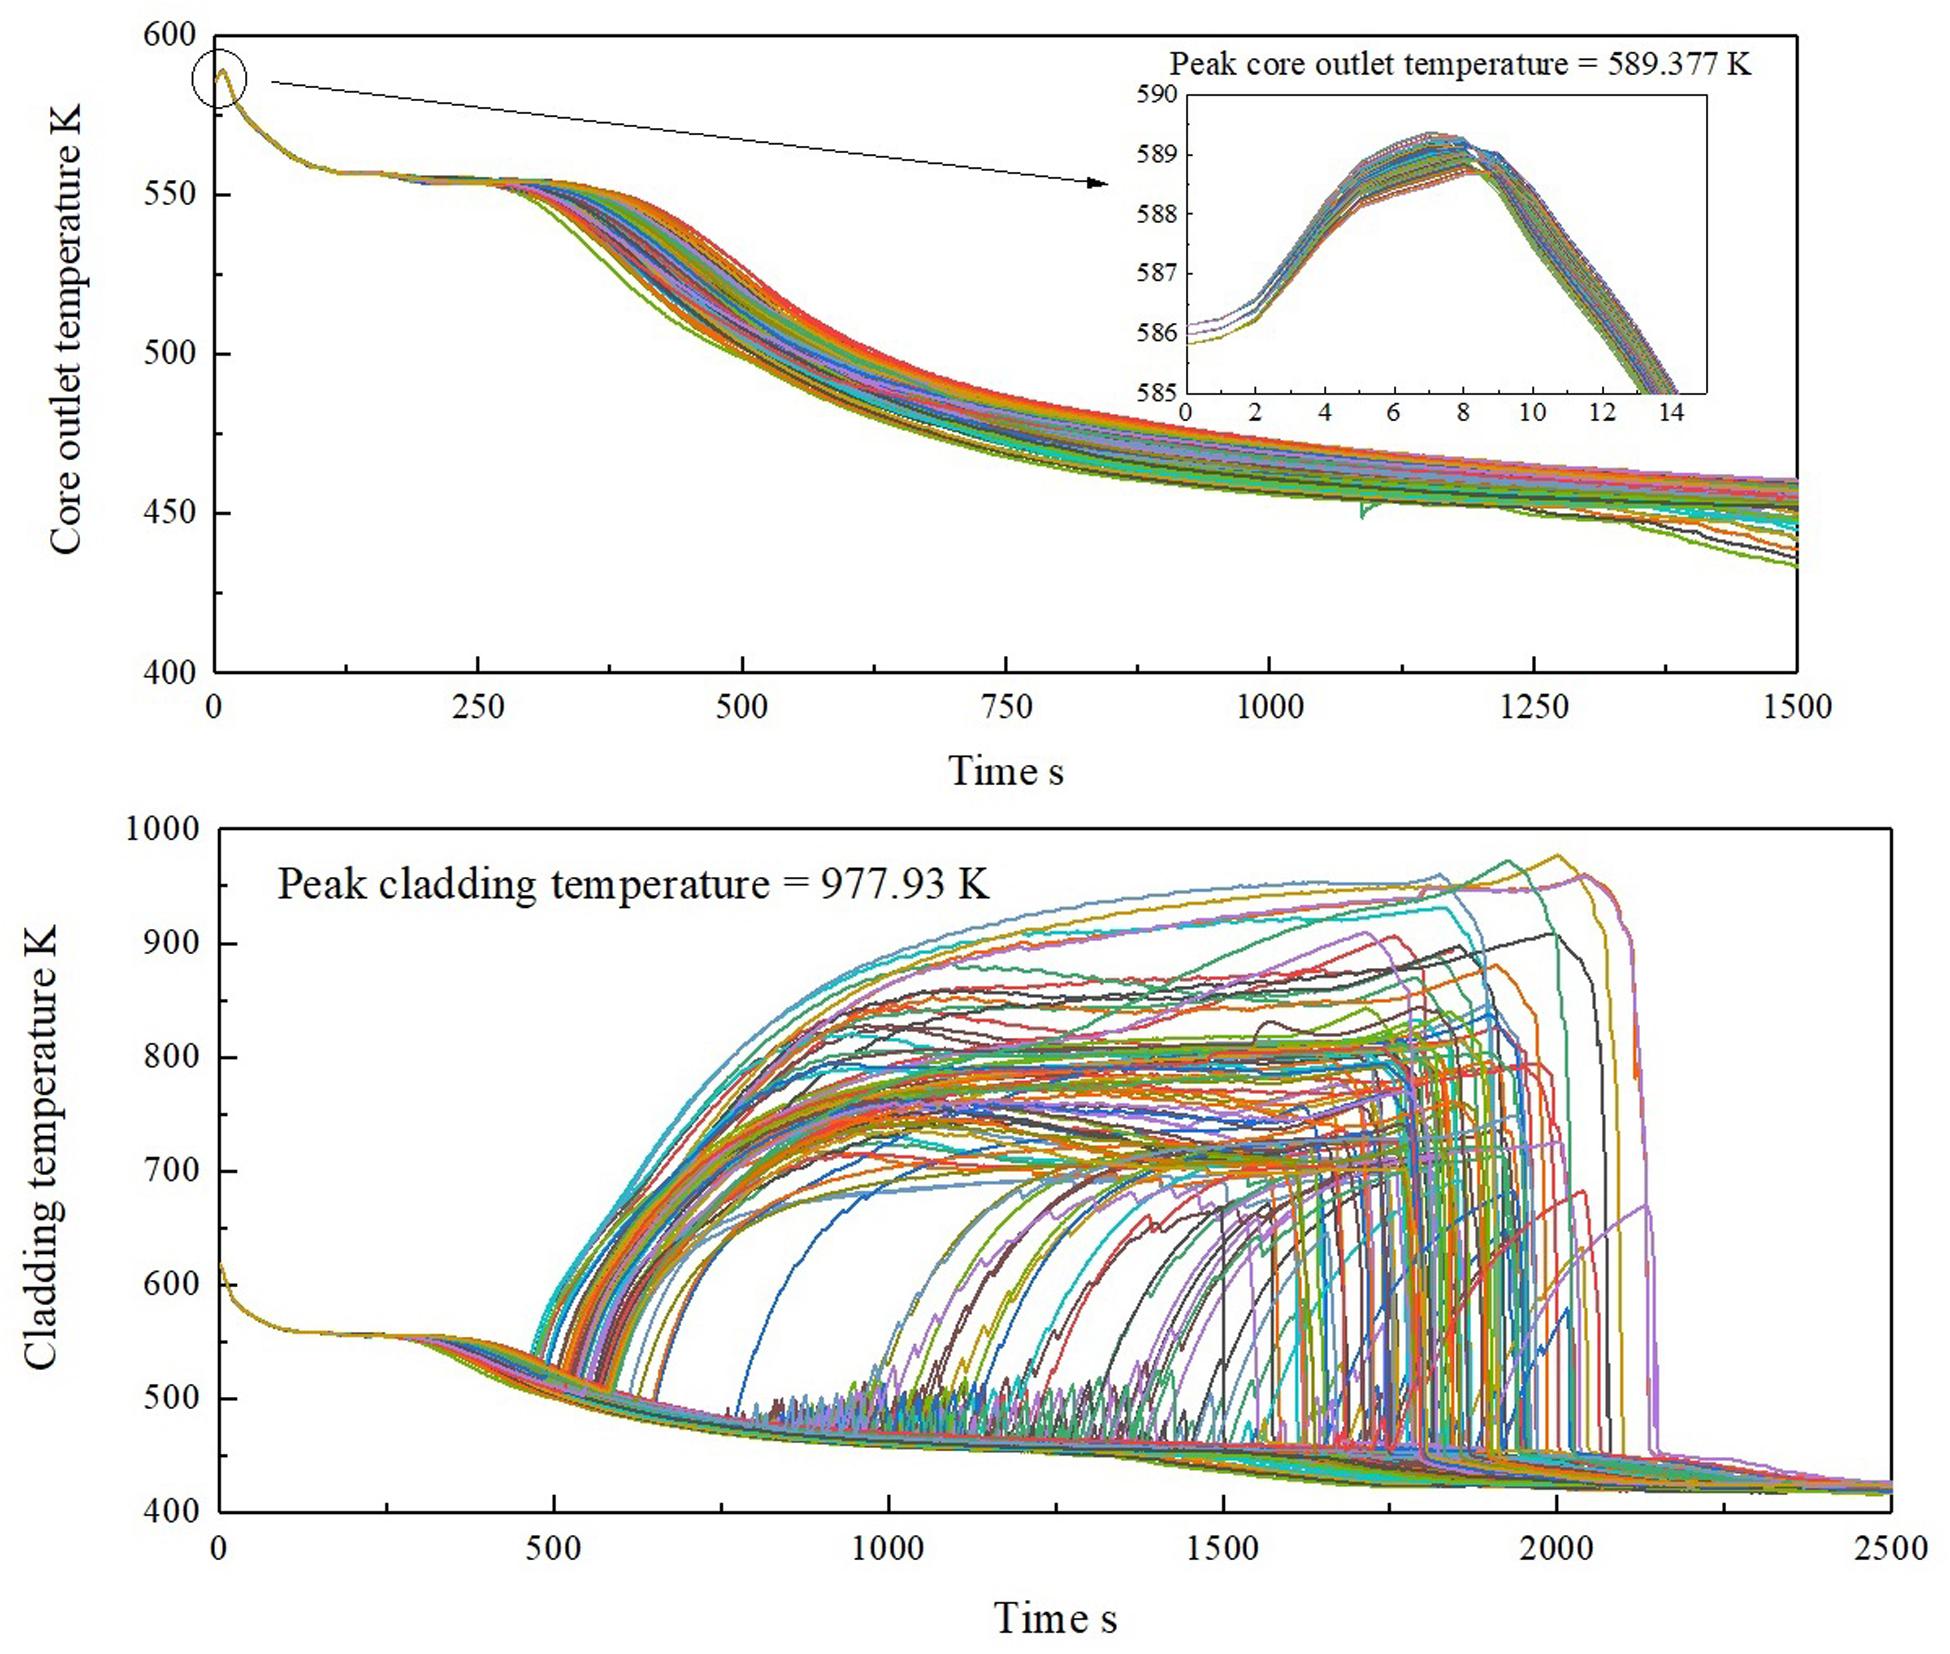
Figure 11. Uncertainty results of figures of merit (FOMs) with improved best estimate plus uncertainty (BEPU) method. (A) Results of the peak core outlet temperature. (B) Results of the peak cladding temperature (PCT).
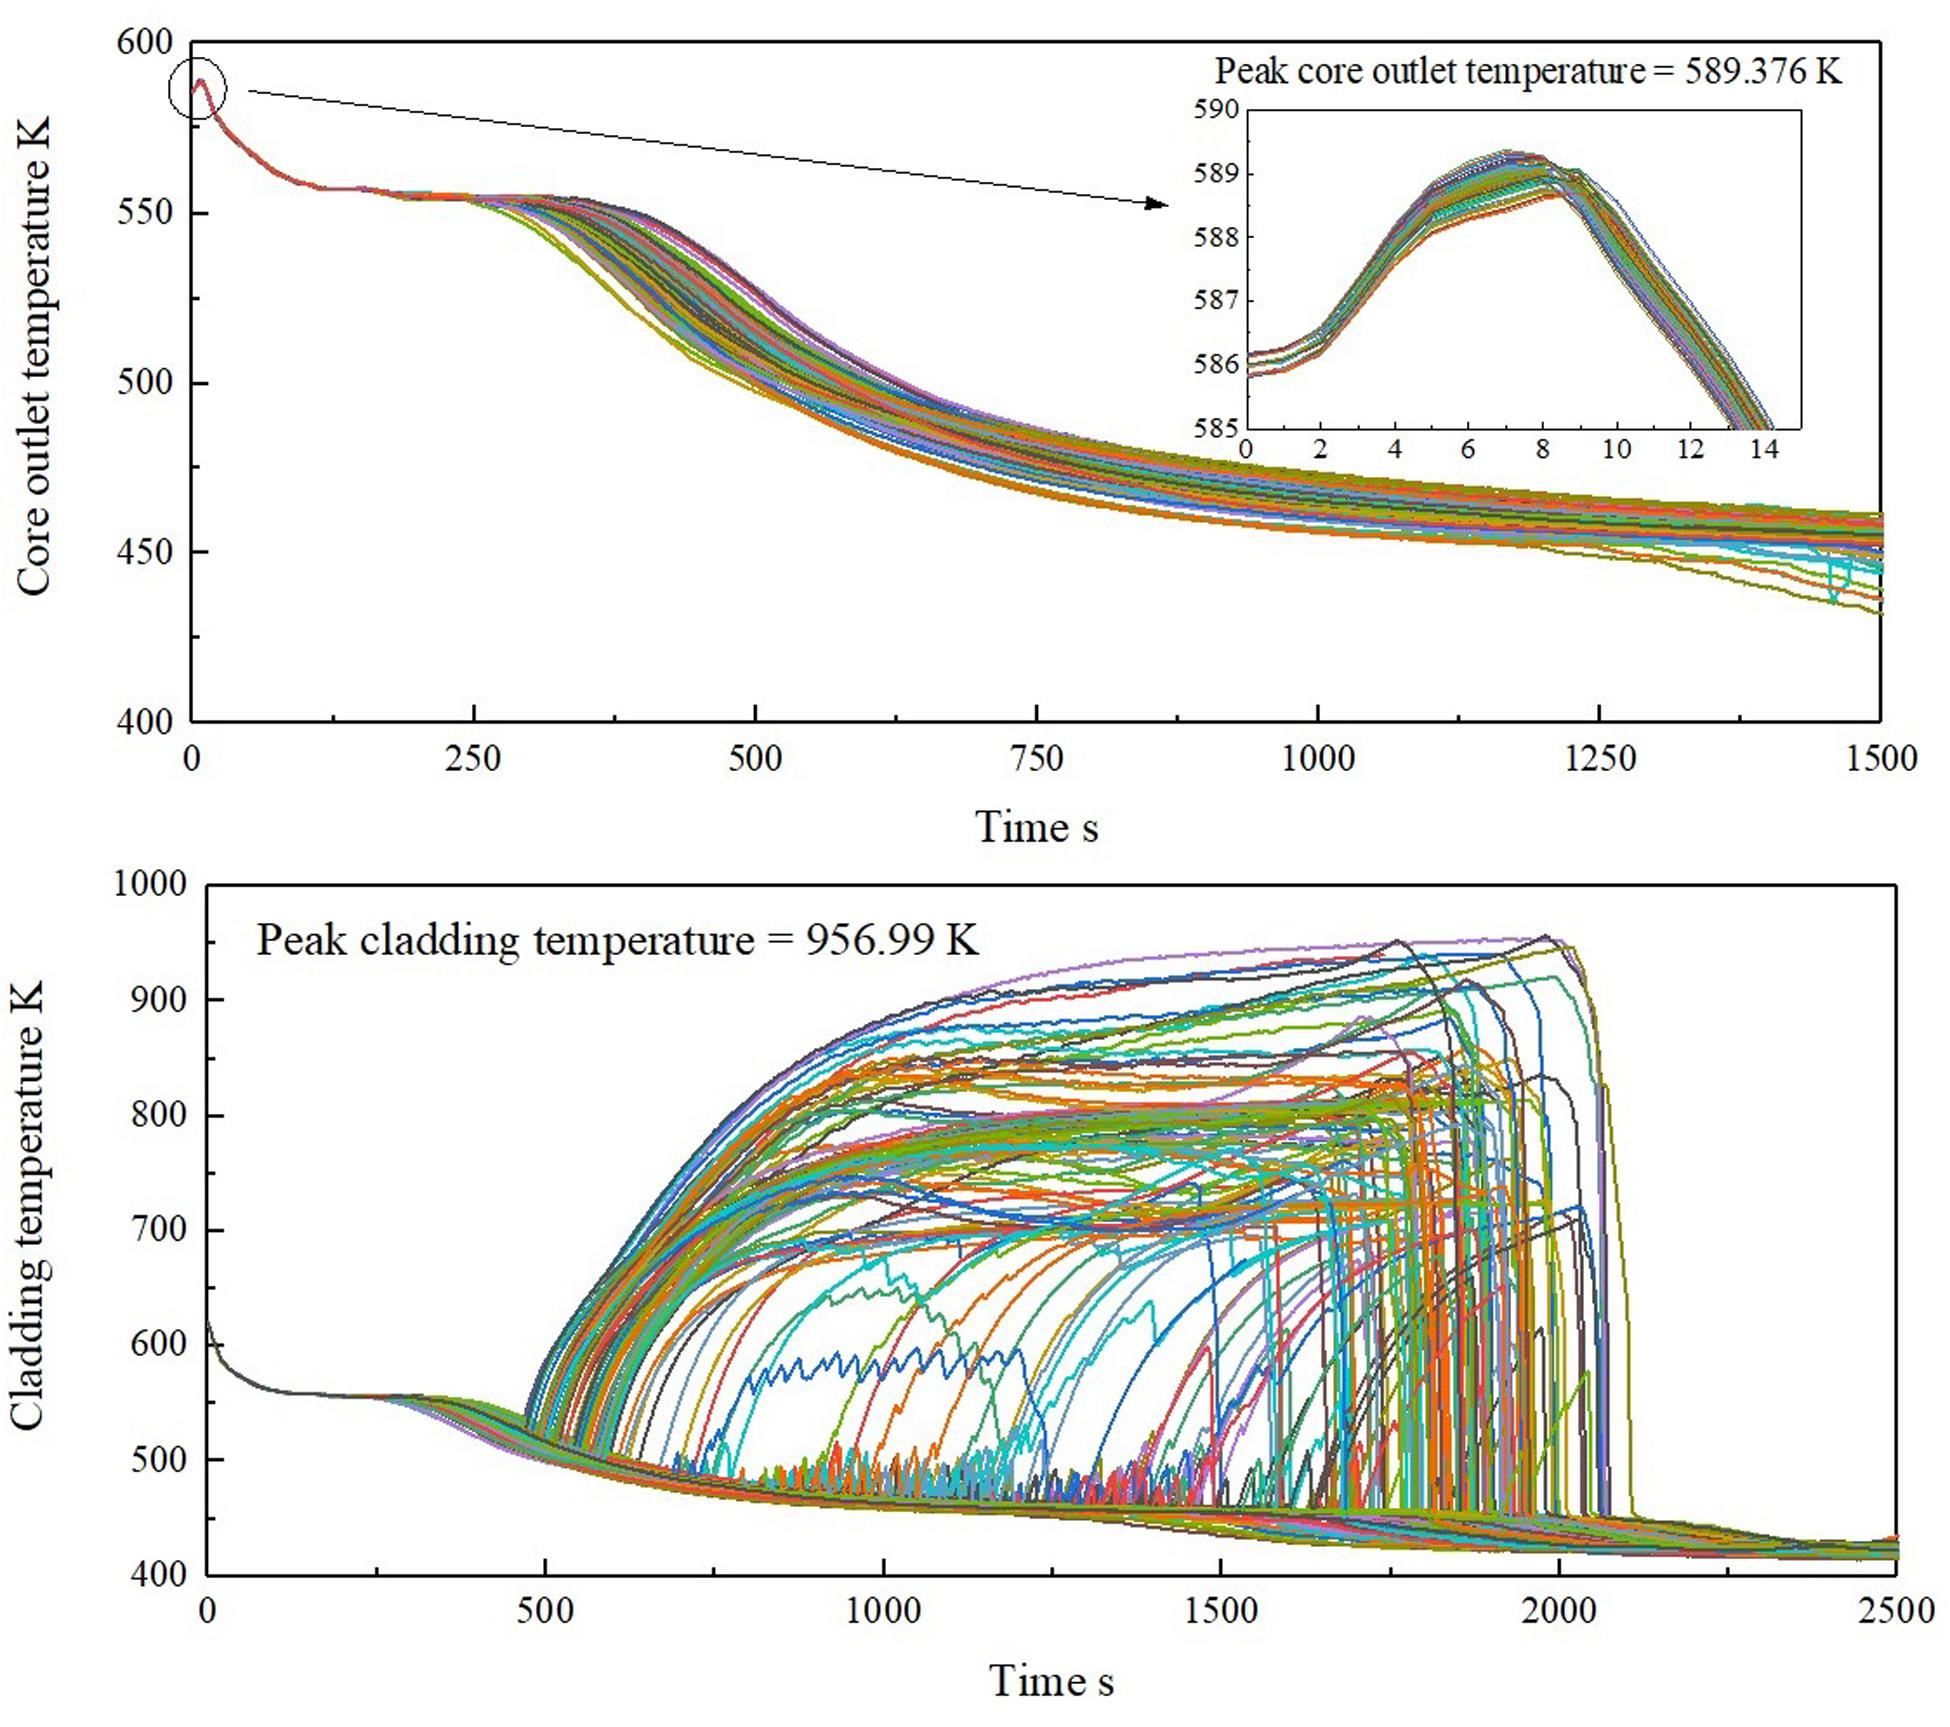
Figure 12. Uncertainty results of figures of merit (FOMs) with traditional best estimate plus uncertainty (BEPU) method. (A) Results of the peak core outlet temperature. (B) Results of the peak cladding temperature (PCT).
The power of the reactor does not immediately drop when the break occurs at 0 s. Meanwhile, the coolant leaks rapidly. The decrease in flow causes the core outlet temperature to rise to a peak value of 589.377 K. As the reactor stops and safety facilities start, the temperature reduces. As illustrated in Figure 11A, the uncertainty of the core outlet temperature increased with time. The PCT goes up at about 500 s, and the maximum value is 977.93 K at about 2,000 s. As shown in Figure 11B, the LPIS is started in time so that the temperature does not exceed the limit at 1,447.15 K.
The uncertainty results of the traditional BEPU method are given in Figure 12 and Table 5 as a comparison. In the traditional BEPU method, all input parameters are directly sampled for uncertainty analysis. By comparing Figures 11, 12, it is evident that the improved BEPU method shows similar results with the traditional BEPU method. The number of inputs of the improved BEPU method is significantly reduced from 17 to 6, as listed in Tables 3, 4. Meanwhile, as listed in Table 5, the deviation of the two FOMs is less than 5%, which indicates that the improved BEPU method maintains the desired accuracy with the smaller size of samples.
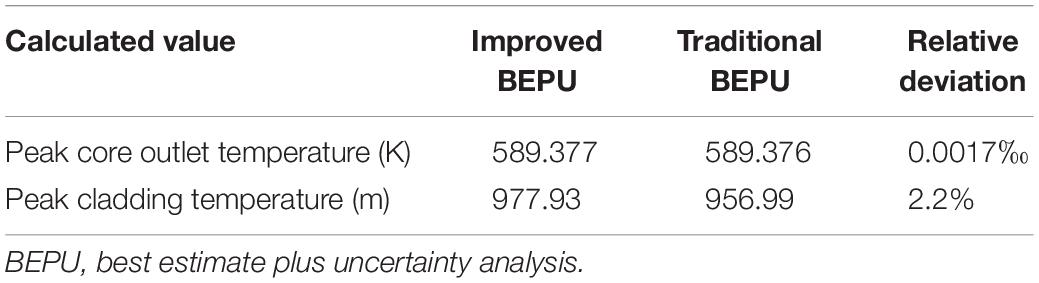
Table 5. Comparison with improved BEPU and traditional BEPU method.
Conclusion
In this work, RELAP5 is used to model the PWR and stimulate the steady-state condition and SBLOCA. And the improved BEPU method is proposed to perform the sensitivity and the uncertainty analysis of the FOMs. Compared with the traditional BEPU method, the improved BEPU method possesses the following two characteristics:
(1) Two main stages, that is, steady-state calculation and transient calculation, are usually considered for accident analysis in RELAP5. The sensitivity analysis is performed for both stages in the improved BEPU method to provide more comprehensive results. However, the traditional BEPU method usually combines the above two stages to analyze the sensitivity between the initial parameters and the transient results.
(2) The sensitivity analysis is firstly performed to reduce the number of uncertainty analysis inputs. Only the key input parameters that have a significant impact on the uncertainty analysis are identified.
In this work, a PWR SBLOCA is simulated by RELAP5 to verify the accuracy and applicability of the improved BEPU method. And three main conclusions are drawn as follows:
(1) The sensitivity analysis by the improved BEPU method shows that the peak core outlet temperature has strong relationships with main flow rate, core heat channel temperature, and PRZ pressure, whereas the traditional BEPU method cannot identify the strong relationship among them. Hence, it is more reasonable to take steady-state parameters as inputs in the sensitivity analysis of transient.
(2) By the sensitivity analysis, the coolant pump inlet roughness, main flow rate, and core heat channel temperature have a strong relationship with the peak core outlet temperature. Meanwhile, both the break area and PRZ pressure are medium positive relationships with the peak core outlet temperature. For the PCT, the fission product yield factor is moderately related to it. There are only these parameters sampled for uncertainty analysis.
(3) The results of the uncertainty analysis obtained by the improved BEPU are consistent with the results of the traditional method. Neither the PCT nor the peak core outlet temperature will exceed their limits. The results illustrate that the improved BEPU method can reduce the size of samples and maintains the desired accuracy.
In this work, the improved BEPU method is proposed and tested to capture the detailed features during sensitivity and uncertainty analysis. Because the size of the samples in uncertainty analysis is reduced, it is supposed to reduce the failure rate of the simulation. And the related test will be performed in the future. Moreover, the improved BEPU method will be used to analyze other accidents such as LBLOCA.
Data Availability Statement
The original contributions presented in the study are included in the article/supplementary material, further inquiries can be directed to the corresponding author.
Author Contributions
DS completed the main content of the work. ZZ directed the important direction of the work. XL completed some relevant data processing of the work. LL and HW assisted some of the technical guidance for the work. AX and SC provided technical guidance for traditional BEPU methods. All authors contributed to the article and approved the submitted version.
Funding
This study was supported by National Key R&D Program of China on Risk-informed Safety Margin Characterization Technology (2018YFB1900302).
Conflict of Interest
The authors declare that the research was conducted in the absence of any commercial or financial relationships that could be construed as a potential conflict of interest.
Abbreviations
ACC, Accumulator; BE, Best Estimate; BEPU, Best estimate plus uncertainty; CSAU, Code scaling, applicability, and uncertainty; ECCS, Emergency core cooling system; FOM, Figure of merit; GRS, Gesselschaft für Anlagen und ReaktorsicherheitmbH; HPIS, High-pressure injection system; IAEA, International Atomic Energy Agency; IRWST, In-containment Refueling Water Storage Tank; KINS, Korea Institute of Nuclear Safety; KINS-REM, KINS-realistic evaluation methodology; LBLOCA, Large-break loss-of-coolant accident; LHS, Latin hypercube sampling; LOCA, Loss-of-coolant accident; LPIS, Low-pressure injection system; NPP, Nuclear power plant; NRC, Nuclear Regulatory Commission; PCT, Peak cladding temperature; PIRT, Phenomena Identification and Ranking Table; PWR, Pressurized water reactor; RCS, Reactor coolant system; RCSS, Reactor containment spray system; RELAP, Reactor Excursion and Leak Analysis Program; SBLOCA, Small-break loss-of-coolant accident; SI, Safety injection.
References
Barre, F., and Bernard, M. (1990). The CATHARE code strategy and assessment. Nuclear Eng. Design 124, 257–284. doi: 10.1016/0029-5493(90)90296-a
Berar, O.-A., Prošek, A., and Mavko, B. (2013). RELAP5 and TRACE assessment of the Achilles natural reflood experiment. Nuclear Eng. Design 261, 306–316. doi: 10.1016/j.nucengdes.2013.05.007
Boyack, B. E., Catton, I., Duffey, R. B., Griffith, P., Katsma, K. R., Lellouche, G. S., et al. (1990). Quantifying reactor safety margins part 1: an overview of the code scaling, applicability, and uncertainty evaluation methodology. Nuclear Eng. Design 119, 1–15. doi: 10.1016/0029-5493(90)90071-5
Briesmeister, J. F. (1993). MCNP-A General Monte Carlo N-Particle Transport Code. LA-12625. Available online at: https://permalink.lanl.gov/object/tr?what=info:lanl-repo/lareport/LA-13709-M
CN (2011). Reaserch on Modeling and Uncertainty of Optimal Estimation and Analysis of Water Loss Accident in AP1000 Nuclear Power Plant. Shanghai: Shanghai Jiao Tong University.
Cutrono Rakhimov, A., Visser, D. C., and Komen, E. M. J. (2019). Uncertainty Quantification method for CFD applied to the turbulent mixing of two water layers – II: deterministic Sampling for input uncertainty. Nuclear Eng. Design 348, 146–158. doi: 10.1016/j.nucengdes.2019.04.016
Deng, C., Chen, L., Yang, J., and Wu, Q. (2019). Best-estimate calculation plus uncertainty analysis of SBLOCA transient for the scale-down passive test facility. Progr. Nuclear Energy 112, 191–201. doi: 10.1016/j.pnucene.2018.12.018
Dubois, A., Leong, Z. Q., Nguyen, H. D., and Binns, J. R. (2019). Uncertainty estimation of a CFD-methodology for the performance analysis of a collective and cyclic pitch propeller. Appl. Ocean Res. 85, 73–87. doi: 10.1016/j.apor.2019.01.028
Dunn, F. E. (1999). Comparisons of Steady-State and Transient Thermal Hydraulic Results from SAS-DIF3DK and RELAP5 mod 3.2 for an RBMK reactor. Oak Ridge: Office of Scientific & Technical Information.
Dunn, M. C., Shotorban, B., and Frendi, A. (2010). “Uncertainty quantification of turbulence model coefficients via latin hypercube sampling method,” in Proceedings of the ASME 2010 3rd Joint US-European Fluids Engineering Summer Meeting: Volume 1, Symposia – Parts A, B, and C2010, Montreal, 2913–2921.
Ghione, A., Noel, B., Vinai, P., and Demazière, C. (2017). Uncertainty and sensitivity analysis for the simulation of a station blackout scenario in the Jules Horowitz Reactor. Ann. Nuclear Energy 104, 28–41. doi: 10.1016/j.anucene.2017.02.008
Glaeser, H. (2008). GRS Method for uncertainty and sensitivity evaluation of code results and applications. Sci. Technol. Nuclear Instal. 2008:798901.
Guba, A., Makai, M., and Pál, L. (2003). Statistical aspects of best estimate method—I. Reliabil Eng. Syst. Safety 80, 217–232. doi: 10.1016/s0951-8320(03)00022-x
Gupta, S. K., Dubey, S. K., and Rao, R. S. (2013). Uncertainty Evaluation in Best Estimate Accident Analysis of NPPs. New Delhi: Springer India.
Helton, J. C., and Davis, F. J. (2003). Latin hypercube sampling and the propagation of uncertainty in analyses of complex systems. Reliabil. Eng. Syst. Safety 81, 23–69. doi: 10.1016/s0951-8320(03)00058-9
Ibarra, J. G. (1988). Editor Non-Plant Referenced Simulator Methodology to Meet New 10 CFR 55.45 rule. Piscataway: IEEE.
Jamali, K. (2015). Achieving reasonable conservatism in nuclear safety analyses. Reliabil. Eng. Syst. Safety 137, 112–119. doi: 10.1016/j.ress.2015.01.008
Jinhan, B., and Fei, W. (1998). Review of the research on small break loss of coolant accident. Chin. J. Nuclear Sci. Eng. 18, 172–179.
Jizhou, Z., Shuren, X., Jianqiang, S., and Bin, Z. (2004). Nuclear Reactor Safety Analysis. Shaanxi: Xi’an Jiaotong University Press.
KINS (2005). Improvement of the ECCS Best Estimate Methodology and Assessment of LOFT L2-5 Experiment. KINS/RR-279. Daejeon: Korea Institute of Nuclear Safety.
Luo, H. (2012). Quantified PIRT and Uncertainty Quantification for Computer Code Validation. Oregon: Oregon State University.
Murray, R. L. (1987). Guidebook to Light Water Reactor Safety Analysis. Nuclear Technol. 76, 309–310. doi: 10.13182/nt87-a33887
Pawel, A. J., and Mesina, G. L. (2011). Uncertainty Analysis for RELAP5-3D Idaho National Laboratory, INL/EXT-12-26182. Idaho: Idaho National Laboratory.
Perez, M., Reventos, F., Batet, L., Guba, A., Tóth, I., Mieusset, T., et al. (2011). Uncertainty and sensitivity analysis of a LBLOCA in a PWR Nuclear Power Plant: results of the Phase V of the BEMUSE programme. Nuclear Eng. Design 241, 4206–4222. doi: 10.1016/j.nucengdes.2011.08.019
Pingan, Y., Ruian, Z., Zhenwan, Y., and Xiuzhong, S. (2002). Thermal Analysis of Nuclear Reactors. Shanghai: Shanghai Jiao Tong University Press.
Porter, N. W. (2019). Wilks’ formula applied to computational tools: a practical discussion and verification. Ann. Nuclear Energy 133, 129–137. doi: 10.1016/j.anucene.2019.05.012
Rakhimov, A. C., Visser, D. C., and Komen, E. M. J. (2020). Uncertainty Quantification method for CFD validated for turbulent mixing experiments from GEMIX. Nuclear Eng. Design 358:110444. doi: 10.1016/j.nucengdes.2019.110444
Sanchez-Saez, F., Carlos, S., Villanueva, J. F., Sanchez, A. I., and Martorell, S. (2017). Uncertainty analysis of PKL SBLOCA G7.1 test simulation using TRACE with Wilks and GAM surrogate methods. Nuclear Eng. Design 319, 61–72. doi: 10.1016/j.nucengdes.2017.04.037
Sanchez-Saez, F., Sánchez, A. I., Villanueva, J. F., Carlos, S., and Martorell, S. (2018). Uncertainty analysis of a large break loss of coolant accident in a pressurized water reactor using non-parametric methods. Reliabil. Eng. Syst. Safety 174, 19–28. doi: 10.1016/j.ress.2018.02.005
Wang, C., Peng, M., Cong, T., and Xia, G. (2019). Uncertainty analysis on natural circulation characteristics under ocean conditions. Ann. Nuclear Energy 128, 300–308. doi: 10.1016/j.anucene.2019.01.027
Wang, C., Sun, K., Zhang, D., Tian, W., Qiu, S., and Su, G. H. (2017). Uncertainty analysis of Transportable Fluoride-salt-cooled High-temperature Reactor (TFHR) using coupled DAKOTA with RELAP-3D method. Nuclear Eng. Design 324, 269–279. doi: 10.1016/j.nucengdes.2017.08.021
Wilks, S. S. (1941). Determination of sample sizes for setting tolerance limits. Ann. Math. Stat. 12, 91–96. doi: 10.1214/aoms/1177731788
Wilson, G. E., and Boyack, B. E. (1998). The role of the PIRT process in experiments, code development and code applications associated with reactor safety analysis. Nuclear Eng. Design 186, 23–37. doi: 10.1016/s0029-5493(98)00216-7
Zhikang, L., Ting, W., Jianshu, L., Ren, L., and Xianghui, L. (2016). Research on quantitative analysis method of uncertainty in real LOCA analysis. Nuclear Power Eng. 37, 75–79.
Keywords: best estimation, sensitivity analysis, uncertainty analysis, small-break loss-of-coolant accident, pressurized water reactor, Reactor Excursion and Leak Analysis Program 5
Citation: Sun D, Zhang Z, Li X, Li L, Wang H, Xu A and Chen S (2020) An Improved Best Estimate Plus Uncertainty Method for Small-Break Loss-of-Coolant Accident in Pressurized Water Reactor. Front. Energy Res. 8:188. doi: 10.3389/fenrg.2020.00188
Received: 29 May 2020; Accepted: 15 July 2020;
Published: 19 August 2020.
Edited by:
Jun Wang, University of Wisconsin-Madison, United StatesReviewed by:
Muhammad Saeed, East China University of Technology, ChinaJiankai Yu, Massachusetts Institute of Technology, United States
Copyright © 2020 Sun, Zhang, Li, Li, Wang, Xu and Chen. This is an open-access article distributed under the terms of the Creative Commons Attribution License (CC BY). The use, distribution or reproduction in other forums is permitted, provided the original author(s) and the copyright owner(s) are credited and that the original publication in this journal is cited, in accordance with accepted academic practice. No use, distribution or reproduction is permitted which does not comply with these terms.
*Correspondence: Zhijian Zhang, emhhbmd6aGlqaWFuX2hldUBocmJldS5lZHUuY24=