 Kengne Signe Elie Bertrand
 Kanmogne Abraham2
95% of researchers rate our articles as excellent or good
Learn more about the work of our research integrity team to safeguard the quality of each article we publish.
Find out more
ORIGINAL RESEARCH article
Front. Energy Res. , 04 September 2020
Sec. Sustainable Energy Systems
Volume 8 - 2020 | https://doi.org/10.3389/fenrg.2020.00176
This article is part of the Research Topic Energy Economics and Energy Finance in Developing and Emerging Countries View all 9 articles
Sustainable development and the fight against climate change are now priorities in majority of countries. The contribution of renewable energies to these two ambitions has been proven. Wind being a renewable energy source, several works was carried out in this field for an effective exploitation of this resource. Thus, wind modeling using the Weibull distribution was of paramount importance. The objective of this study is to model the wind speed at Ntem, South Region of Cameroon, for good decision making on possible projects of electricity production from the wind and toward contribution to the sustainable development of rural areas in this locality. For this purpose, the average hourly wind speed data for the period of November 2012 to October 2014 provided by a station located at a height of 10 m in Ambam were used. The modeling of this wind speed by the Weibull distribution for determining the two function parameters k and C was carried out with four numerical methods: graphical method (GM), empirical method (EM), method of factor energy, and the moment method (MM). The EM presented a better performance than the other techniques. Moreover, the average density of wind energy based on the average cubic root of the cubes was estimated at 93.7628 kW/m2/year in 2013. This result presents Ambam as an unfavorable zone for wind power generation with fair wind characteristics. But it is very important to mention that, for a height of 10 m, this potential is not negligible in the Cameroonian context where domestic energy (lighting, telephone recharging, radio, television, etc.) is not yet available for most villages, located far from the national power grid.
All developed countries rely on renewable energy for the efficiency of their energy systems due to the disadvantages of fossil fuels. Since it has been shown that the use of fossil fuels has a negative impact on the environment, causing an increase in pollution rate and degradation of the ecosystem, among others, energy sources (such as wind, solar, geothermal, hydropower, biomass, and thermal energy from the oceans) have become highly sought renewables for large-scale application [non-polluting and almost inexhaustible characteristics (Antoine et al., 2020)].
In majority of African countries, the access rate to electricity is relatively poor. Singularly, in Cameroon, the access rate to electricity was 48% overall and around 23% in rural areas in 2014 (Africa Renewable Energy Access Programm and Public Private Infrastructure Advisory Facility, 2012; Parajuli, 2016; Kengne Signe et al., 2017a,2019b). On the other side, the national energy balance is dominated by the consumption of wood as a combustible for meal cooking, which represents 77%, followed by fossil energy with 17.3% and by hydropower with 4.9%. Electricity is mainly produced from hydroelectricity with a rate of 96% and the rest from petroleum (4%) (Nkongo et al., 2016; Kengne Signe et al., 2017c). In fact, the State of Cameroon actually promotes the production of electricity from renewable sources. Then, studying and making available the results necessary to improve the production of electricity from renewable sources have become very relevant (Kengne Signe et al., 2015, 2016, 2017b; Antoine et al., 2020). One of these important sources of electricity in the world is wind power.
There are several methods for the analysis of wind energy parameters, one of the most used of which is based on the modeling of wind speed by the Weibull distribution, where the wind speed can be represented by the probability density function of the wind speed. From this modeling, it is then possible to evaluate the wind energy potential by summing the energy of wind speeds over a certain period of time. The Weibull distribution has two function parameters which are k (shape factor) and C (scale parameter) (Paulo Alexandre et al., 2012; Nkongo et al., 2016; Kengne Signe et al., 2019b). To estimate these parameters, certain numerical methods can be used.
The objective of this work is to model the wind speed using the Weibull distribution, in order to estimate the wind energy potential at Ambam located in the Vallée-du-Ntem Division, South Region of Cameroon, where in the meteorological station of the Ministry of Transport with the collaboration of the Geological and Mining Research Institute, the hourly wind data were collected from November 2012 to October 2014. For the determination of Weibull parameters k and C, the graphical method (GM), empirical method (EM), energy pattern factor method (EPFM), and moment method (MM) will be used, and a comparison of their performances will be done to determine which method gives the parameters better efficiency.
This article is organized in main sections as follows. Section “Introduction” presents the background of the methods used to determine the Weibull distribution parameters. Section “Materials and Methods” discusses the materials and method used, including the site location and data collection and wind speed probability distribution, which includes the numerical methods used for determining Weibull distributions, wind power density (WPD), and useful wind speeds. Section “Results” presents the results. Section “Discussion” presents the discussion. Finally, Section “Conclusion” gives the conclusion.
The data provided for the study are monthly mean wind speeds, recorded over the period from November 2012 to October 2014 at 10-m height above ground level (AGL). These data were obtained from meteorological station located in Ambam at 11°16′00′′E, 2°19′00′′N (UCCC, 2014). Figure 1 shows the map of Ambam in the Vallée-du-Ntem Division, South Region of Cameroon.
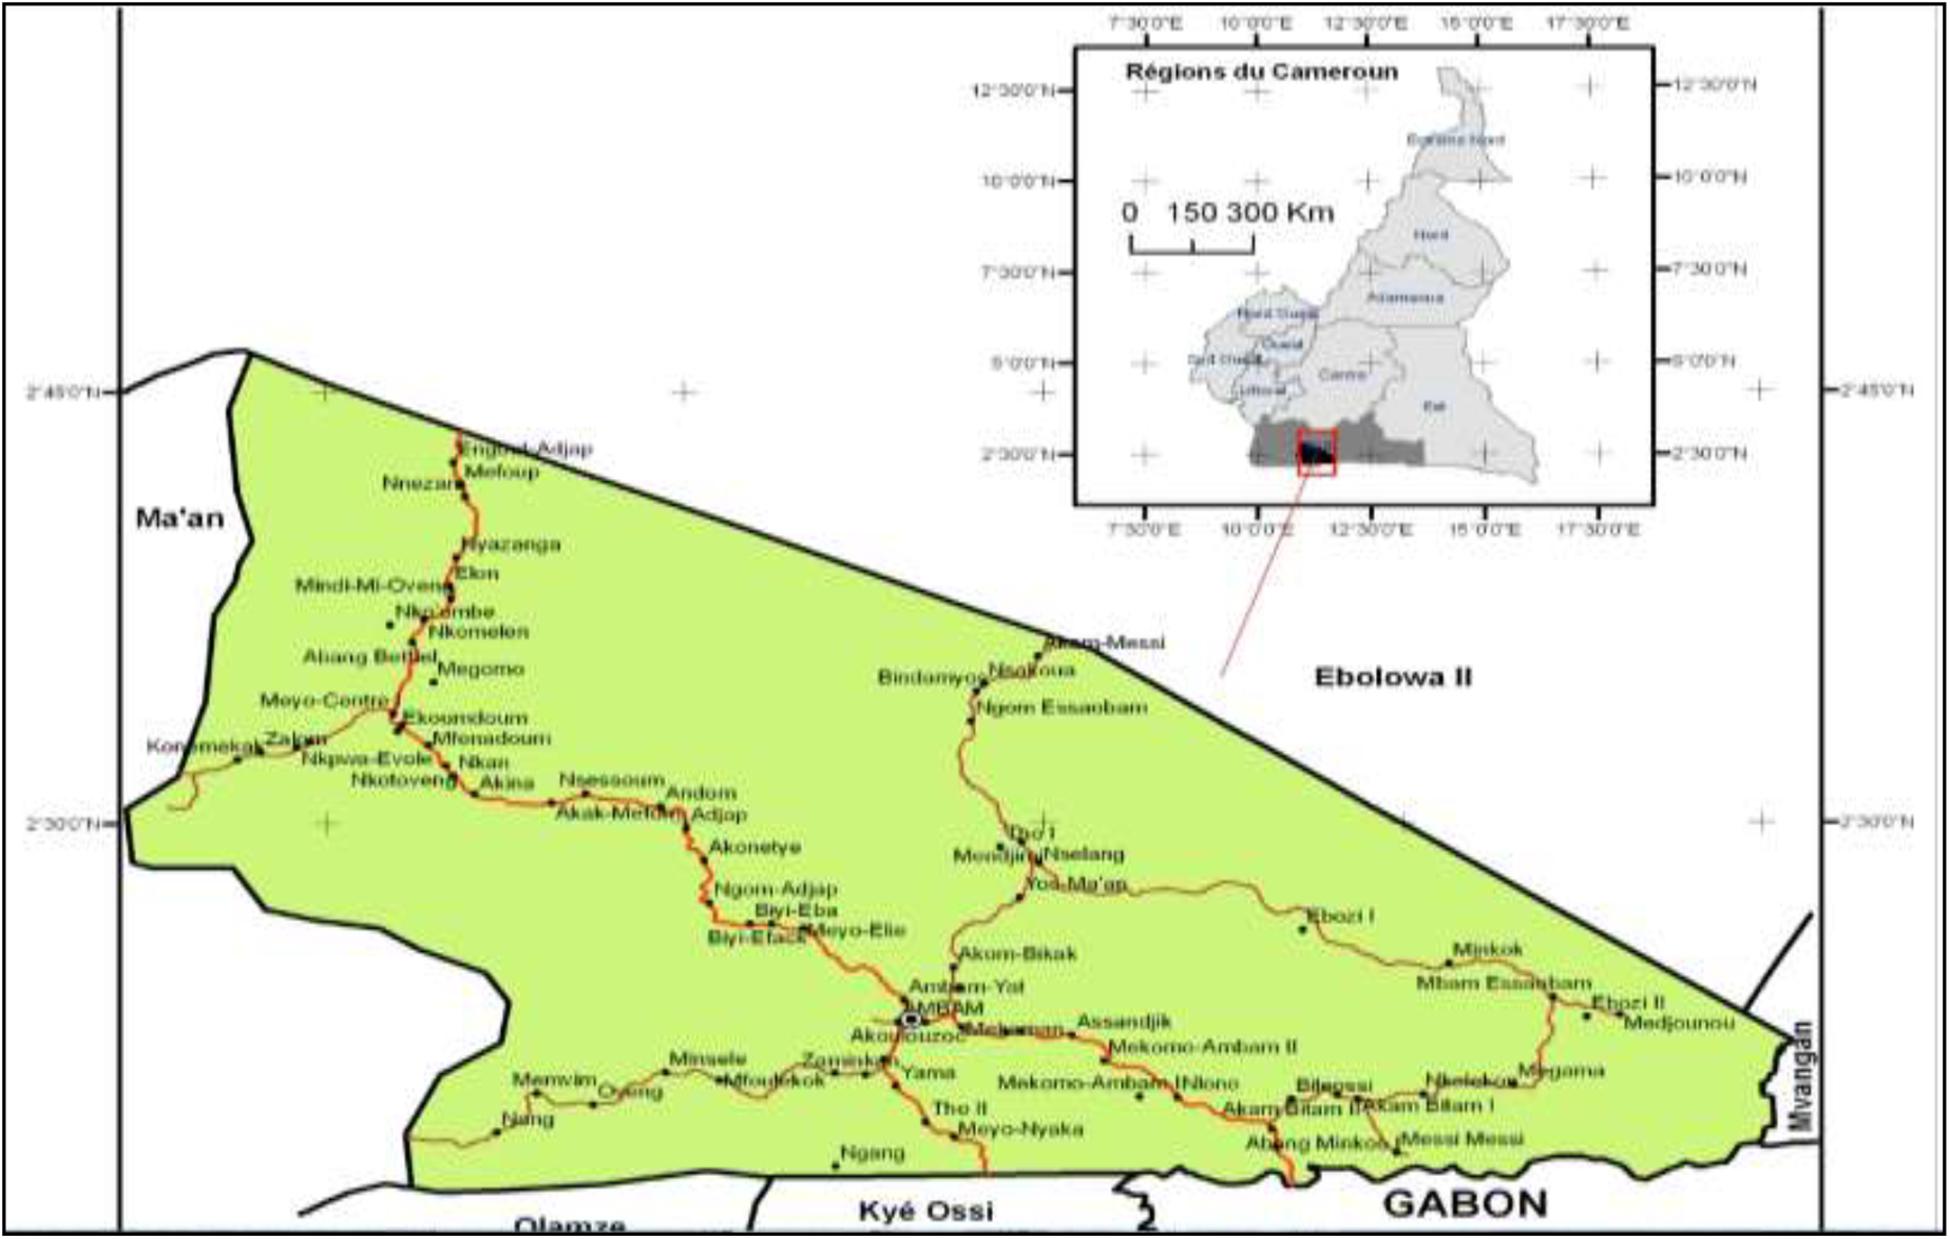
Figure 1. The map of the location of Ambam.
Measured wind speed data are commonly available in time series format, in which each data point represents either an instantaneous sample wind speed or an average wind speed over a specific time period. An example of such data (giving hourly averages over a 24-h period) is given in Table 1.
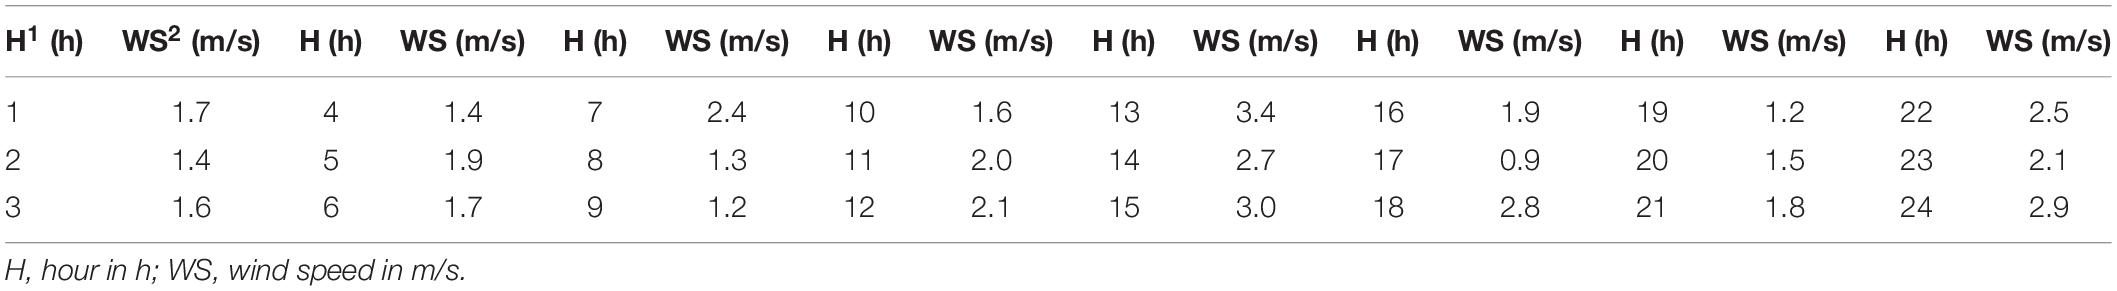
Table 1. Wind speed measured daily.
An installed weather vane and anemometer, a sensor station and data recovery console, and a computer and the WeatherLink software are some of the materials used. The MATLAB software is also used for some numerical equation resolutions.
The WPD (W/m2) is often used as a quick way to generalize the wind resource, but it is never the best practice. A second method is to determine the WPD through some function such as Weibull, normal two-variable Rayleigh, chi-square, inverse Gaussian, generalized normal, log-normal, three-parameter log-normal, gamma, and kappa distributions (Parajuli, 2016). In this work, the Weibull distribution is used to fit the time series data. It is necessary to use statistical analysis for the calculation of the wind potential in a region. The Weibull distribution can be described as a probability density function f(υ) and a cumulative distribution function F(υ), determined by equations (1) and (2) using the wind speed data measured (Kengne Signe et al., 2019b). With the wind speed data collected, it is not easy to find the exact probability density function. The Weibull distribution has two parameter functions k and C. The density probability function of a certain wind speed is given by Paulo Alexandre et al. (2012), Kidmo et al. (2015), Nkongo et al. (2016), Kengne Signe et al. (2017c), and Isa et al. (2018).
Then, the average wind speed for a regime can be given by
Let us be reminded that the standard gamma function is (). The substitution in equation (1) leads to the average wind speed (Kengne Signe et al., 2016; Parajuli, 2016; Hicham et al., 2019).
Four numerical methods are used for determining Weibull parameters, namely, GM, EM, EPFM, and MM.
The concept of least squares is used to interpolate the wind speed data by a straight line. The equation of this method is represented by a double logarithmic transformation as follows.
Plotting ln[−ln(1 − F(υ))] against ln(υ) gives a straight line with k as the slope and (− k×lnC) as the intercept along the vertical axis (Akpinar and Akpinar, 2004; Kidmo et al., 2015; Hicham et al., 2019).
In this method, the parameters k and C are defined by using the average wind speed and standard deviation. If is the mean wind speed and σ the standard deviation of the observed data, these parameters can be calculated using the following equations (Kengne Signe et al., 2016; Nkongo et al., 2016; Olaofe, 2017):
This method is related to the averaged data of the wind speed and is defined by the following equations:
Equation (9) can be solved numerically or approximately by a power density technique using equation (11) (Hicham et al., 2019; Kengne Signe et al., 2019b).
In MM, k and c can be obtained using the following equations:
where is the mean wind speed and σ is the standard deviation of the observed data (Afungchui and Aban, 2014; Olaofe, 2015; Fawzan et al., 2019).
In order to evaluate the performance of the different models obtained from the probability density function from the data collected, as judgment criterion, three types of error functions are used.
Root mean square error (RMSE) parameter, the chi-square test (χ2), and efficiency of the method (R2) are also evaluated (Ucar and Balo, 2009; Kengne Signe et al., 2017c; Mekalathur et al., 2019). The following equations can help to define these tests.
with xi as the predicted data of Weibull, N the number of observations, yi the actual data, z the mean wind speed, and n the number of constants used (Zahid et al., 2017b; Fawzan et al., 2019).
The WPD gives the capacity of wind resources in a given site. It can be obtained using many methods. Let us be reminded that wind power that flows at v increases as the cube of its velocity and is given by Ucar and Balo (2009), Zahid et al. (2017a), and Mekalathur et al. (2019).
where Pw is the wind power, υ is the windspeed, ρ is the air density, and A is the swept area of the wind turbine blade. But considering the fact that through a blade swept area (A = 1), equation (17) becomes
it is possible to use mean speed to calculate wind power as follows.
The best result can be obtained with the root mean cube of wind speed which is defined as follows (Kengne Signe et al., 2016):
Using the Weibull distribution, it is possible to obtain WPD by
where WPD is the wind power density (W/m2) and ρ is the density of the air (kg/m3) in the region. The corresponding air density ρ could be also calculated using equation (22) (Olaofe, 2015; Parajuli, 2016):
where Hm is the site height (m). The value of the air density at sea level is ρ0 = 1.225 kg/m3. Let us be reminded that Ambam is at an altitude of 347 m. Then according to equation (22), the density of air in that region is ρ = 1.225 × 1.194 × 10–4 × 347 = 1.1836 kg/m3 (Afungchui and Aban, 2014; Olaofe, 2015).
Wind speeds vary with different months and seasons. Table 2 shows the yearly mean wind speed.
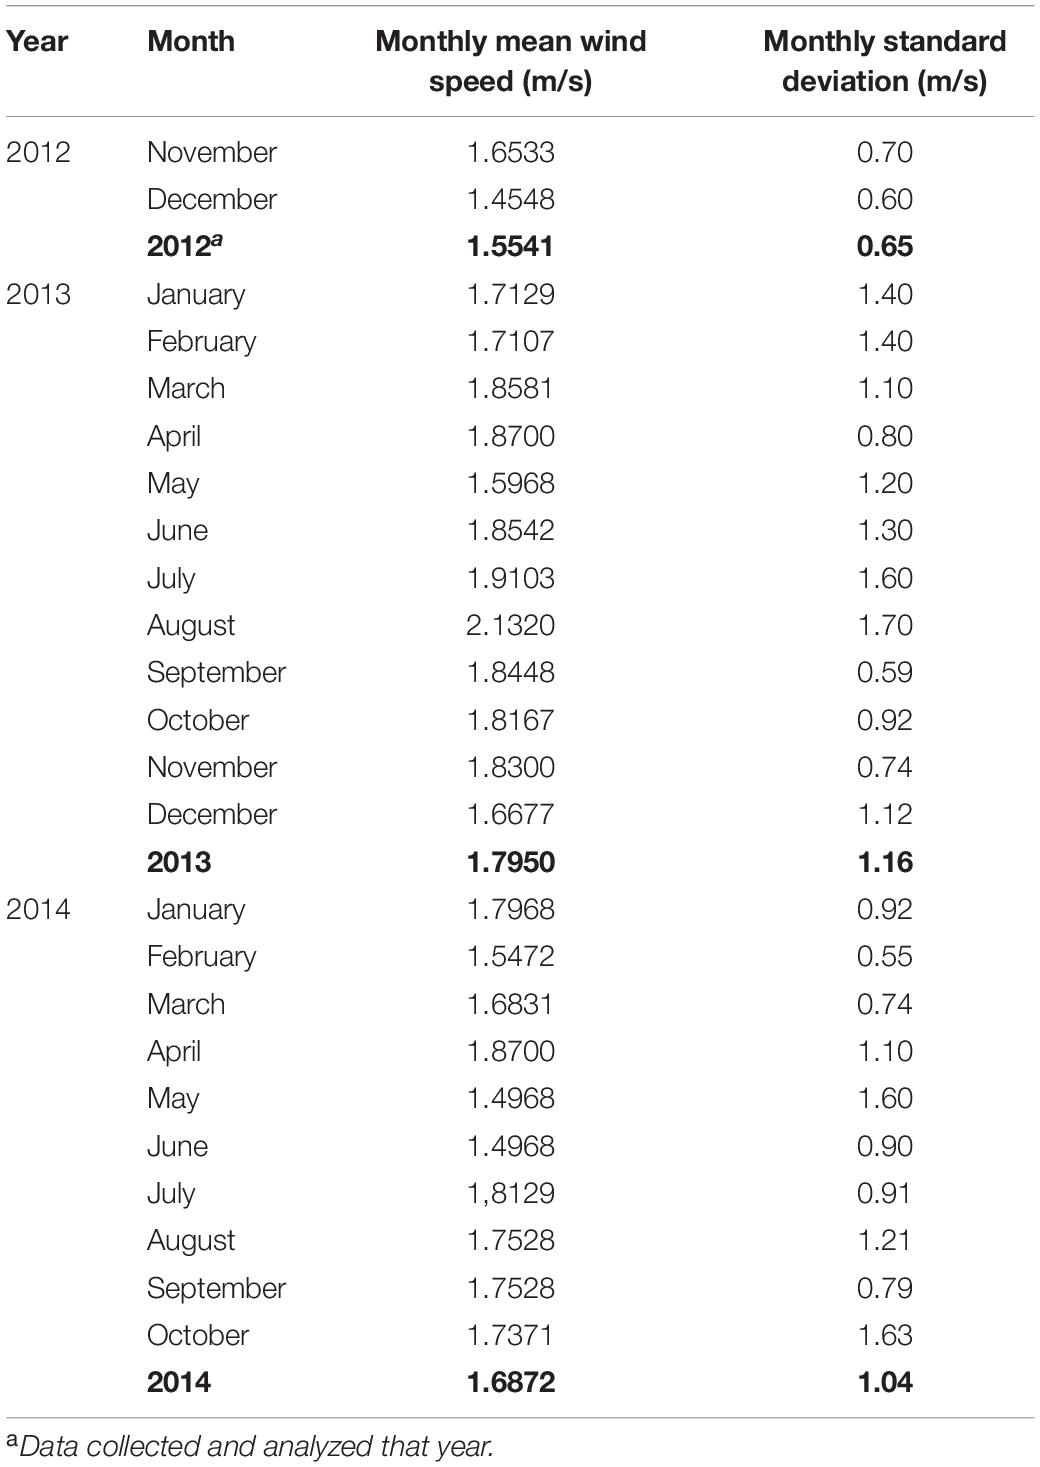
Table 2. Mean wind speed.
Figures 1–4 show the Weibull distribution, described by f(υ), for the data collected over a year from November 2012 to October 2014 using the four numerical methods previously presented.
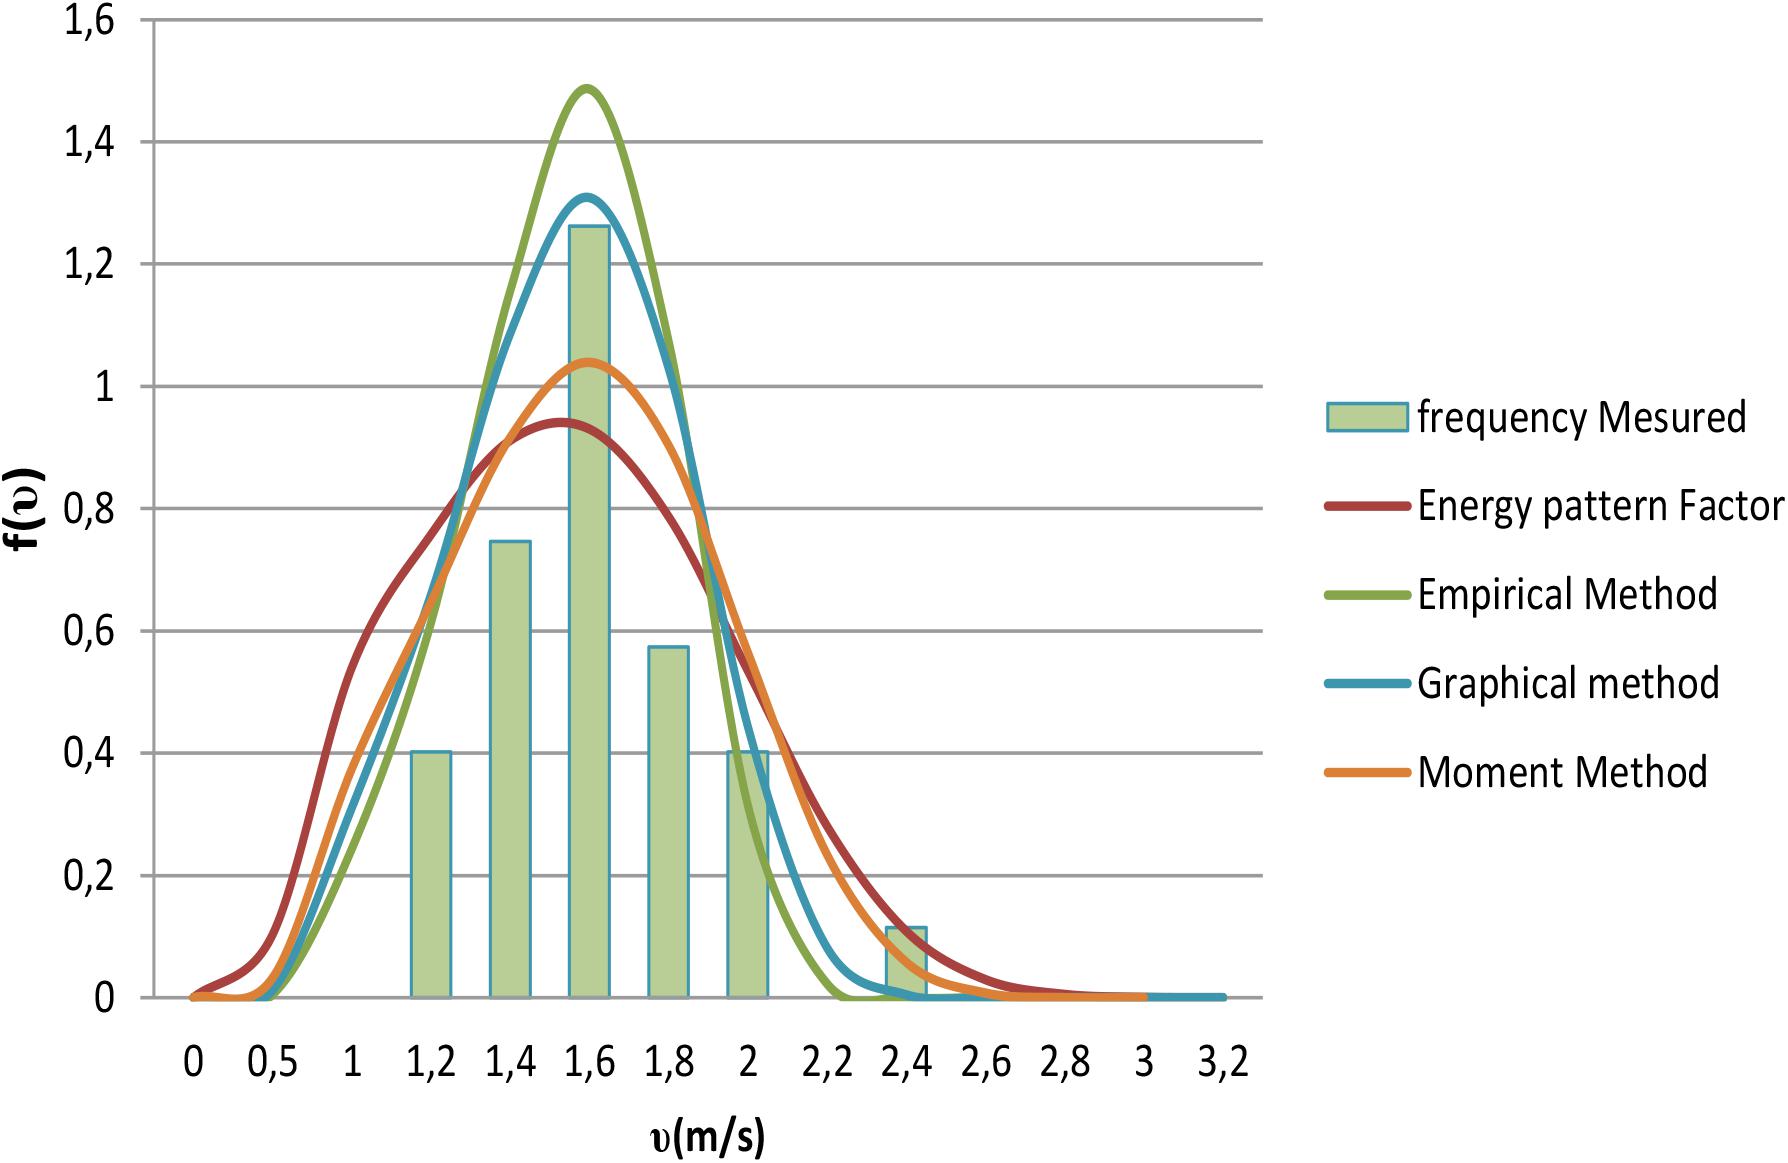
Figure 2. Distribution of Weibull and frequency measured in 2012.
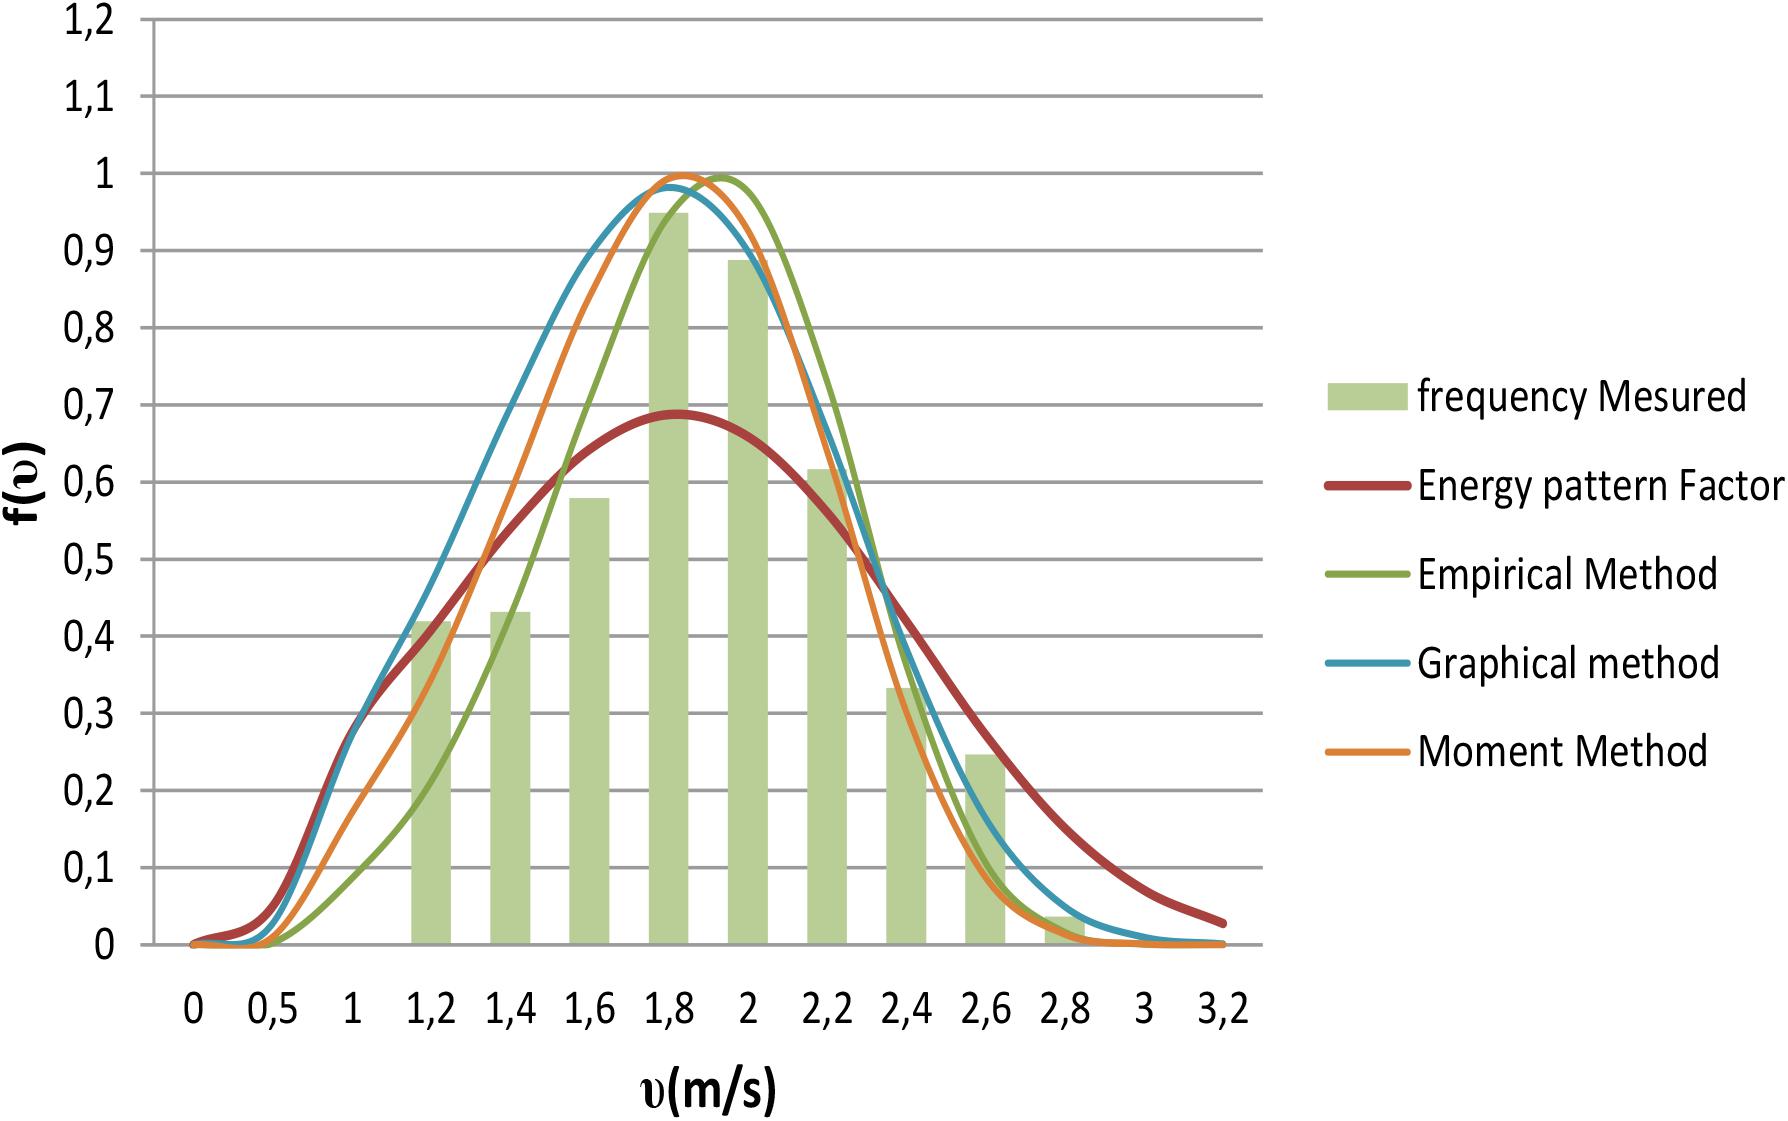
Figure 3. Distribution of Weibull function and frequency measured, year 2013.
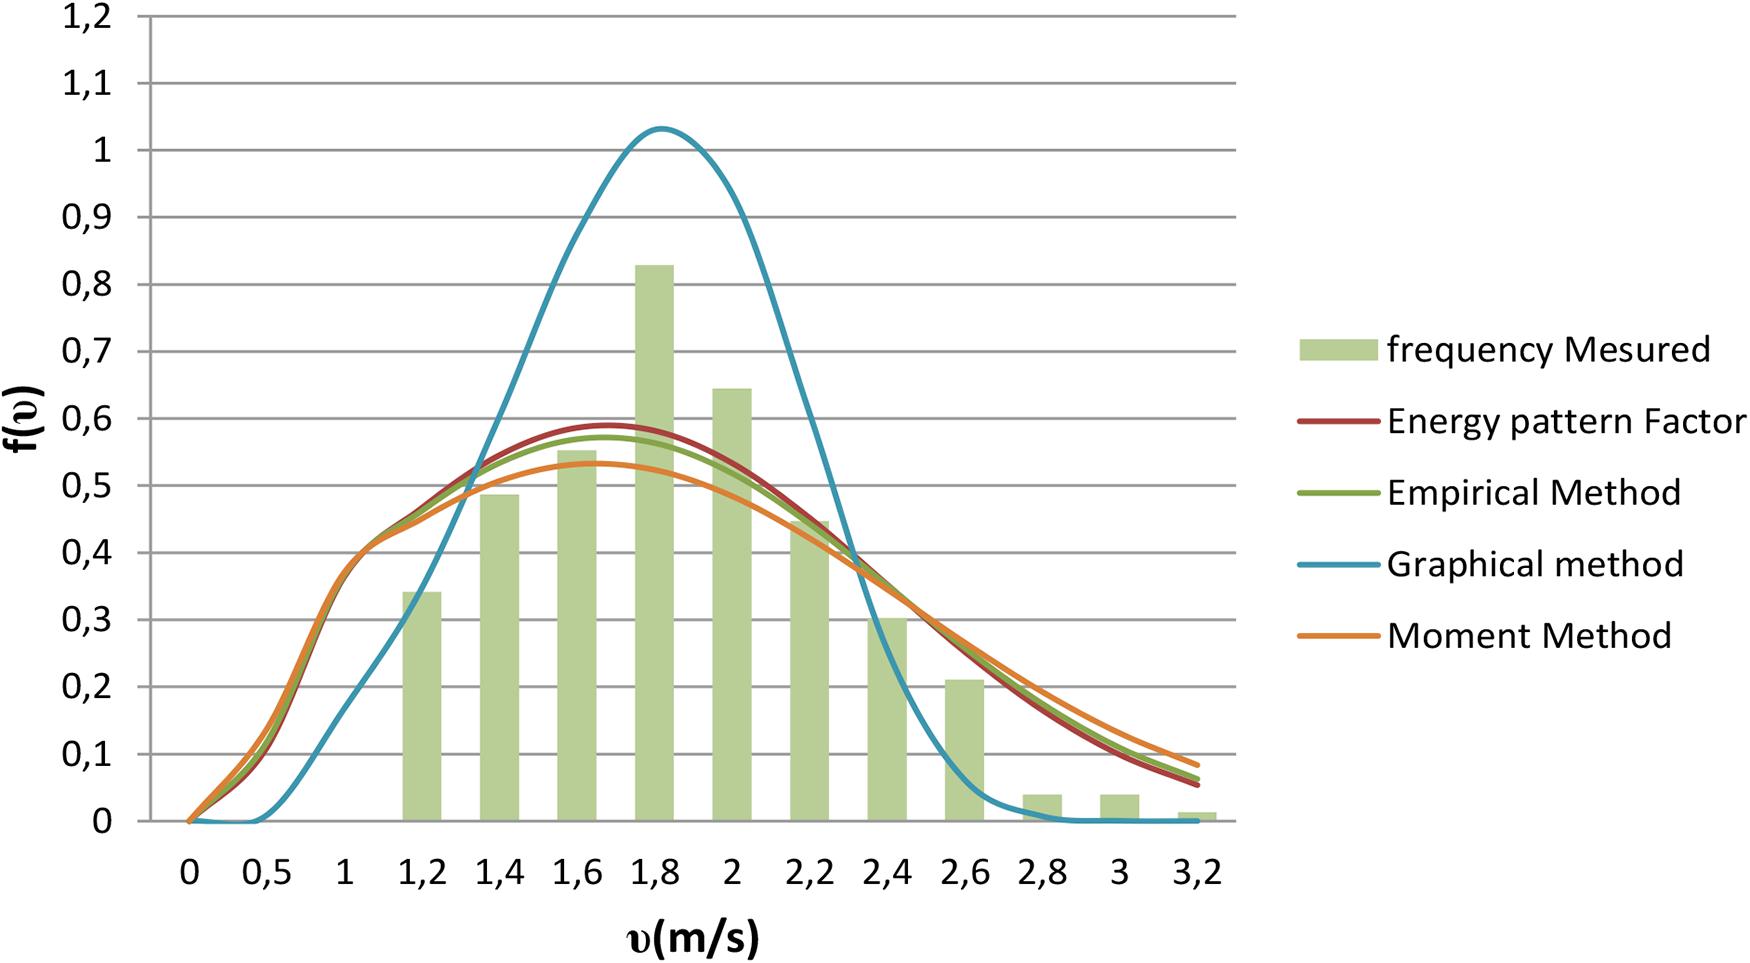
Figure 4. Distribution of Weibull function and frequency measured, year 2014.
Then, for each of these four numerical methods used, match the histograms of frequency measured, giving an idea of which method yields the best fit to the data of wind velocity measured. Tables 3–5 present the results of this analysis.
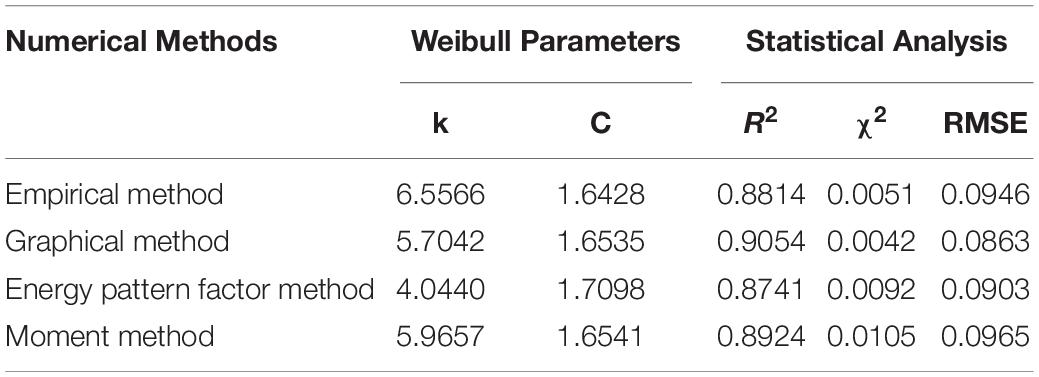
Table 3. Weibull parameters and statistical test, year 2012.
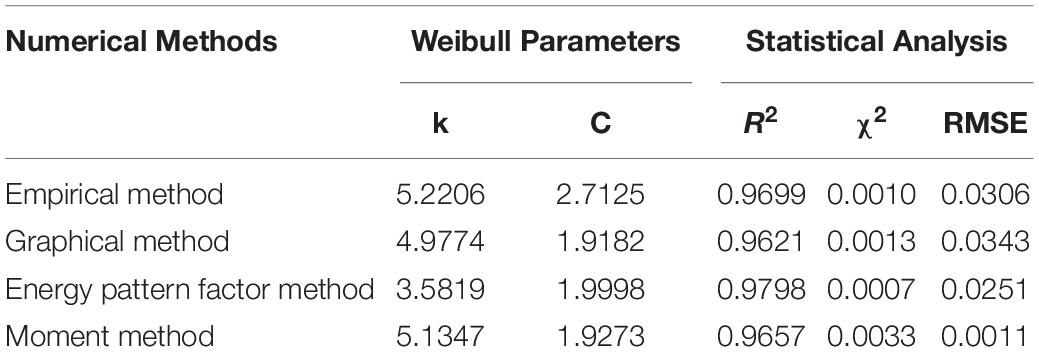
Table 4. Weibull parameters and statistical test, year 2013.
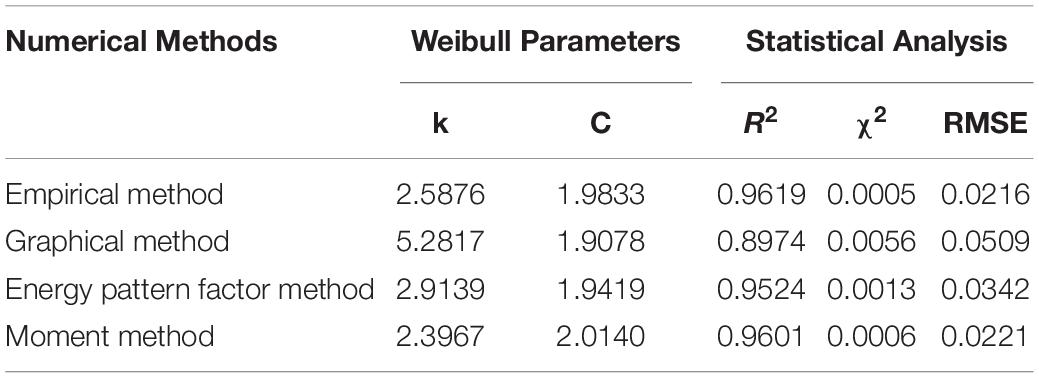
Table 5. Weibull parameters and statistical test, year 2014.
Performances of numerical methods ranked through the three criteria (RMSE, χ2, and R2) are shown in Table 6.
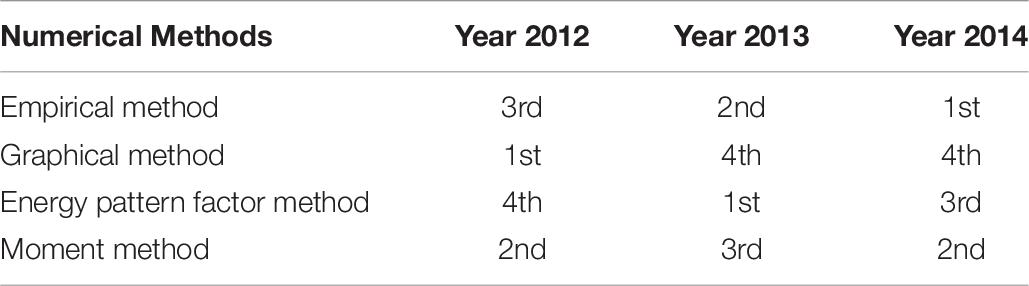
Table 6. Rank of performance of numerical methods.
As can be seen in Table 6, GM, EPFM, and EM, respectively, had the best performance in 2012, 2013, and 2014. Then the Weibull parameters obtained with these methods will be considered for each corresponding year. In Table 7 are summarized the characteristics of wind energy potential.
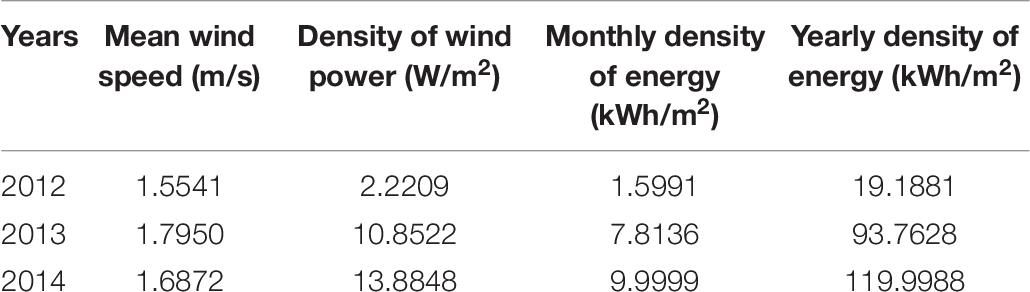
Table 7. Density of wind energy.
To obtain models with the Weibull distribution parameters, four numerical methods have been used: GM, EM, EPFM, and MM. The statistical test shows that R2, RMSE, and χ2 have interesting values, so all these numerical methods were used. However, some of them, such as GM for 2012, EPFM for 2013, and EM for 2014, present a better curve fit with the histogram of the wind speed. It can be observed that EM has the best performance, since it appears between the first, second, and third for the 3 years of analysis. Then, parameters of shape (k) and scale (C) have been better estimated by EM than the others. Finally, using EM, the mean values of the parameters obtained are k = 4.7883 and C = 2.1129.
Moreover, referring to Table 7, with an annual mean wind speed of around 1.8 m/s in 2013, the yearly potential of wind energy, for a site elevation of 10 m, has been evaluated to 93.7828 kWh/m2.
Let us be reminded that in another recent article concerning an assessment of the offshore wind speed at 10-m height in the southwest coast of Nigeria, the annual mean wind speed was not that different from some data collected in Cameroon. The convergence across Cameroon as well as small cities of Nigeria was a result of a low-pressure system with the surface wind moving inwardly from high-pressure areas (Olaofe, 2017). In another work about the identification of potential wind sites in the same neighbor country Nigeria, in some cities not far from Ambam in Cameroon, the wind observations available for each station on a 10-m height AGL show that the annual mean wind speeds in 10 years are as follows: 1.58–2.57 m/s in Calabar, 1.61–2.00 m/s in Bida, 1.18–193 m/s in Lokoja, 0.87–1.73 m/s in Bauchi, and 0.45–2.46 m/s in Nguru (Olaofe, 2015, 2017). These results allow us to confirm that as these cities in Nigeria (with wind speeds between 0.45 and 2.57 m/s), Ambam (with a monthly mean wind speed around 1.79 m/s) cannot be considered interesting for an effective wind speed energy generation system. But for that height, the potential is not negligible for a contribution to rural electrification, particularly in Cameroon and also considering the fact that domestically, energy is not yet available for the majority of localities located far from the national electrical network (Kengne Signe et al., 2019a).
This work presents a discussion and analysis whose objective was evaluating the potential of wind energy resource in Ambam. For this purpose, hourly wind speed data of the Ambam station belonging to IRGM were studied over 3 years from November 2012 to October 2014. The probability density function and WPD were derived from time series data collected. The Weibull probability density function has been fitted to the measured frequency of wind speed. The WPD has been estimated. The most interesting outcomes and results of this work can be summarized as follows:
– EM gave a better Weibull distribution than did MM, GM, and EPFM.
– Considering the mean monthly and yearly wind speed and WPD, Ambam is shown as an unfavorable site for wind energy production, and the region wind characteristics are not interesting.
Since Ambam is not favorable for an effective energy generation system, it is very important to mention that these results’ potential, for a height of 10 m, is not negligible in the Cameroon context where, domestically, energy (lighting, phone charge, radio, television, etc.) is not yet available for the majority of localities located far from the national electrical network.
The datasets generated for this study are available on request to the corresponding author.
All authors listed have made a substantial, direct and intellectual contribution to the work, and approved it for publication.
The authors declare that the research was conducted in the absence of any commercial or financial relationships that could be construed as a potential conflict of interest.
Africa Renewable Energy Access Programm and Public Private Infrastructure Advisory Facility (2012). Lighting Africa Policy Report Note—Cameroon, Lighting Africa. Available online at: https://www.lightingafrica.org/wp-content/uploads/2016/07/28_Cameroon-FINAL-August-2012_LM.pdf
Afungchui, D., and Aban, C. E. (2014). Analysis of wind regimes for energy estimation in Bamenda, of the North West Region of Cameroon, based on the Weibull distribution. Rev. Energ. Renouvel. 17, 137–147.
Akpinar, E. K., and Akpinar, S. (2004). Determination of the wind energy potential for Maden-Elazig. Energy Convers. Manag. 45, 2901–2914. doi: 10.1016/j.enconman.2003.12.016
Antoine, F. N. A., Bertrand, G. T. C., Bertrand, K. S. E., and Blanco, C. J. C. (2020). Sustainable development around small scale mining areas by the development of micro hydro power: application cases in cameroon. J. Power Energy Eng. 8, 36–48. doi: 10.4236/jpee.2020.83003
Fawzan, A., James, E. A., and Chris, R. R. (2019). Wind energy assessment for NEOM city, Saudi Arabia. Energy Sci. Eng. 8, 755–767. doi: 10.1002/ese3.548
Hicham, B., Ikram, E. A., Abdelmajid, E. B., and Abdelmoumen, D. (2019). Wind speed data analysis using weibull and rayleigh distribution functions, case study: five cities northern morocco. Proc. Manufact. 33, 783–793.
Isa, D., Sean, R., Arvind, S., and Craig, J. R. (2018). Evaluating wind speed probability distribution models with a novel goodness of fit metric: a Trinidad and Tobago case study. Intern. J. Energy Environ. Eng. 9, 323–339. doi: 10.1007/s40095-018-0271-y
Kengne Signe, E. B., Hamandjoda, L., Oumarou, H., and Nganhou, J. (2017a). Methodology of feasibility studies of micro-hydro power plants in cameroon: case of the micro-hydro of KEMKEN. Energy Proc. 119, 17–28. doi: 10.1016/j.egypro.2017.07.042
Kengne Signe, E. B., Hamandjoda, O., Nganhou, J., and Wegang, L. (2017b). Technical and economic feasibility studies of a micro hydropower plant in cameroon for a sustainable development. J. Power Energy Eng. 5, 64–73. doi: 10.4236/jpee.2017.59006
Kengne Signe, E. B., Ooumarou, H., Gubong, T. C., and Fanyep, N. A. (2017c). Modeling of rainfall-runoff by artificial neural network for micro hydro power plant: a case study in cameroon. IJIRSET 6, 15511–15519.
Kengne Signe, E. B., Hamandjoda, L., Oumarou, H., and Nganhou, J. (2019a). Performance in feasibility studies of micro hydro power plants. new software development and application cases in cameroon. Energy Proc. 157, 1391–1403. doi: 10.1016/j.egypro.2018.11.304
Kengne Signe, E. B., Kanmogne, A., Emmanuel, G. D., and Meva’a, L. (2019b). Comparison of seven numerical methods for determining Weibull parameters of wind for sustainable energy in Douala, Cameroon. Intern. J. Energy Sector Manag. 13, 903–915. doi: 10.1108/IJESM-07-2018-0014
Kengne Signe, E. B., Ooumarou, H., and Nganhou, J. (2016). Modeling of characteristics of wind by weibull distribution and estimation of wind energy in douala. Littoral Region of Cameroon. IJIRSET 5, 6601–6608. doi: 10.15680/IJIRSET.2016.0505001
Kengne Signe, E. B., Tekounegning, O., Hamandjoda, O., and Nganhou, J. (2015). Local blacksmith’s activity in the west region of cameroon and their contribution to the development of micro hydroelectric power plants in that region. Afric. J. Environ. Sci. Technol. 9, 428–437. doi: 10.5897/AJEST2014.1798
Kidmo, D. K., Danwe, R., and Doka, S. Y. (2015). Djongyang statistical analysis of wind speed distribution based on six weibull methods for wind power evaluation in Garoua, Cameroon. Rev. Energ. Renouvel. 18, 105–125.
Mekalathur, B. H. K., Saravanan, B., Padmanaban, S., and Jens, B. H.-N. (2019). Wind energy potential assessment by weibull parameter estimation using multiverse optimization method: a case study of tirumala region in India. Eergies 12, 1–21.
Nkongo, A. A., Ebobenow, J., and Afungchui, D. (2016). Wind energy potential assessment of Cameron’s coastal regions for the installation of an onshorewind farm. Heliyon 2, 1–19.
Olaofe, Z. O. (2015). On the remapping and identification of potential wind sites in nigeria. Energy Power Eng. 7, 477–499. doi: 10.4236/epe.2015.710046
Olaofe, Z. O. (2017). Assessment of the offshore wind speed distributions at selected stations in the South-West of Nigeria. Intern. J. Renew. Energy Res. 7, 565–577.
Parajuli, A. (2016). A statistical analysis of wind speed and power density based on weibull and rayleigh models of Jumla, Nepal. Energy Power Eng. 8, 271–282. doi: 10.4236/epe.2016.87026
Paulo Alexandre, C. R., Ricardo, C. S., Carla, F. A., and Maria Eugênia, V. S. (2012). Comparison of seven numerical methods for determining Weibull parameters for wind energy generation in the northeast region of Brazil. Appl. Energy 89, 395–400. doi: 10.1016/j.apenergy.2011.08.003
UCCC (2014). United Councils And Cities Of Cameroon: National Office. Available online at: http://cvuc.cm/national/index.php/fr/carte-communale/region-du-sud/90-association/carte-administrative/306-ambam (accessed February, 2020).
Ucar, A., and Balo, F. (2009). Evaluation of wind energy potential and electricity generation at six locations in Turkey. Appl. Energy 86, 64–72.
Zahid, H. H., Wei, J., and Rehman, S. (2017a). Energy, sustainability and society. BMC 7:35. doi: 10.1186/s13705-017-0137-9
Zahid, H. H., Wei, J., and Rehman, S. (2017b). Technical and economic assessment of wind power potential of Nooriabad, Pakistan. Energy Sustain. Soc. 7, 1–14.
k = shape Weibull parameter dimensionless;
C = scale Weibull parameter (m/s);
Epf = energy pattern factor;
f(υ) = probability density function;
F(υ) = cumulative distribution function;
n = number of observations performed;
T = time period (s);
υ = wind speed (m/s);
υm = mean wind speed (m/s);
υ3 = mean of wind speed cubes (m3/s3);
U = gamma function;
ρ = air density (kg/m3); and
σ = standard deviation of wind speed (m/s).
Keywords: mean wind speed, Weibull distribution, wind power density, rural area, sustainable energy
Citation: Elie Bertrand KS, Abraham K and Lucien M (2020) Sustainable Energy Through Wind Speed and Power Density Analysis in Ambam, South Region of Cameroon. Front. Energy Res. 8:176. doi: 10.3389/fenrg.2020.00176
Received: 13 February 2020; Accepted: 07 July 2020;
Published: 04 September 2020.
Edited by:
Chien-Chiang Lee, Nanchang University, ChinaReviewed by:
Yu Hao, Beijing Institute of Technology, ChinaCopyright © 2020 Elie Bertrand, Abraham and Lucien. This is an open-access article distributed under the terms of the Creative Commons Attribution License (CC BY). The use, distribution or reproduction in other forums is permitted, provided the original author(s) and the copyright owner(s) are credited and that the original publication in this journal is cited, in accordance with accepted academic practice. No use, distribution or reproduction is permitted which does not comply with these terms.
*Correspondence: Kengne Signe Elie Bertrand, a2VuZ25lODJAeWFob28uZnI=
Disclaimer: All claims expressed in this article are solely those of the authors and do not necessarily represent those of their affiliated organizations, or those of the publisher, the editors and the reviewers. Any product that may be evaluated in this article or claim that may be made by its manufacturer is not guaranteed or endorsed by the publisher.
Research integrity at Frontiers
Learn more about the work of our research integrity team to safeguard the quality of each article we publish.