 Jongrok Kim
 Byoung-Uhn Bae
- Innovative System Safety Research Division, Korea Atomic Energy Research Institute, Daejeon, South Korea
An experimental simulation for a loss of coolant accident with a 4-in cold leg top-slot break was performed using ATLAS, an integral effect test facility at the Korea Atomic Energy Research Institute (KAERI), South Korea. The aims of this test are to resolve a safety issue and to validate the thermal hydraulic safety analysis codes for the activity of the 4th ATLAS-Domestic Standard Problem. The related safety issue for this test is that a loop seal clearing and loop seal reformation of APR1400 can lead to a core temperature excursion because of the characteristics of the loop seal geometry. In the experimental results, the core heater temperature slowly increased after loop seal reformation. This increase is attributed to the accumulated steam at the upper head. The accumulated steam increased the pressure and saturated the temperature in the core. The core heater temperature then increased due to the increased saturated temperature. This temperature increase, therefore, was not a core temperature excursion. Sensitivity analysis results using Multidimensional Analysis of Reactor Safety KINS Standard (MARS-KS), which is a best-estimate thermal hydraulic system analysis code, are also presented in this study. In the 4th ATLAS-Domestic Standard Problem, 15 participants performed calculations and sensitivity analyses using various thermal hydraulic safety analysis codes (MARS-KS, SPACE, RELAP5, and TRACE). From this exercise, several parameters that affect the calculation results are brought out. The sensitivity analysis results using MARS-KS with some of these parameters are also presented. The MARS-KS calculation results are similar to the experimental data. The effects of critical flow model, break line modeling, and fine node modeling are also discussed.
Introduction
An issue of the APR1400 loop seal and its impact on long-term cooling during a postulated loss-of-coolant accident (LOCA) was raised (Lu, 2014). In particular, a top-slot break at a cold leg (CL) with a medium- or small-size break was concerned. A possible scenario is as follows:
i. Top-slot break at CL (medium/small break size maybe the concern)
ii. Loop seal clearing (LSC) and empty intermediate leg (IL)
iii. Primary steam condensation by steam generator (SG) heat transfer or safety injection water flooding (reverse flow to loop seal)
iv. Loop seal reformation (LSR)
v. Pressure increase at the top core region due to the steam released from core
vi. Core water level decrease
vii. Partial core uncovery and core temperature excursion may occur.
Figure 1 shows a schematic diagram of a pressurized water reactor. The height of the loop seal in Figure 1 indicates the depth of the loop seal, and the APR1400 has 0.608 m depth while the US EPR has 0.030 m depth (Wells, 2009). The APR1400 has a deeper loop seal, and the impact of the loop seal can be more serious than in other pressurized water reactors (PWRs) because the deeper loop seal necessitates longer time to clear the loop seal and partial core uncovery can occur during this time.
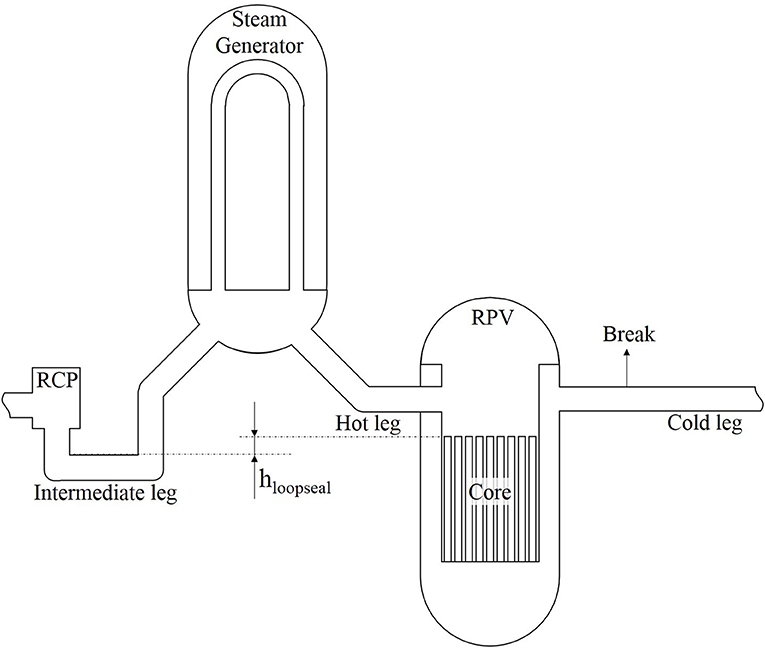
Figure 1. Geometry of pressurized water reactors (PWRs).
Considering the importance of the loop seal of APR1400, experimental investigations for the top-slot break at a CL have been performed as a test item of the 4th ATLAS-Domestic Standard Problem (DSP) (Kang et al., 2018). A top-slot break scenario was simulated in ATLAS, an integral effect test facility. This experiment was aimed at investigating the thermal hydraulic transient in the top-slot break at the CL and analyzing the effect of the LSC and LSR on the APR1400. In the experiment, the break shape was assumed as a circular hole because simulation of a slot break is difficult. To simulate the top break, a break line was installed on the top side of the CL. From the experimental results, the effect of the loop seal during the long-term phase of a LOCA was evaluated.
Experimental Test Facility
ATLAS is an integral effect test facility designed to simulate transient scenarios for thermal hydraulics of a PWR (Baek et al., 2005). The reference reactor of ATLAS is APR1400. ATLAS was designed with the same component system as APR1400. The RCS system of ATLAS has simulation systems for primary, secondary, safety injection, containment, auxiliary, and break simulation. The primary system has a reactor pressure vessel (RPV), a pressurizer, two hot legs (HLs), four CLs, two SGs, and four reactor coolant pumps (RCPs). The three-level scaling methodology (Ishii and Kataoka, 1983) was applied for the ATLAS design to simulate accident scenarios realistically. ATLAS was scaled down to 1/2 for height and 1/288 for volume (Choi et al., 2014). To simulate an accident realistically, ATLAS was developed to be able to operate at the same pressure and temperature as APR1400 (Kim et al., 2008). To measure multidimensional thermal hydraulic behavior, ~1,500 measuring instruments were installed. The uncertainty level of each instrument is summarized in Table 1. ATLAS data can be used to analyze the thermal hydraulic behavior for a whole plant or the subcomponents during anticipated transients and postulated accidents. Detailed information of ATLAS facility is provided in the facility description report (Lee et al., 2018).
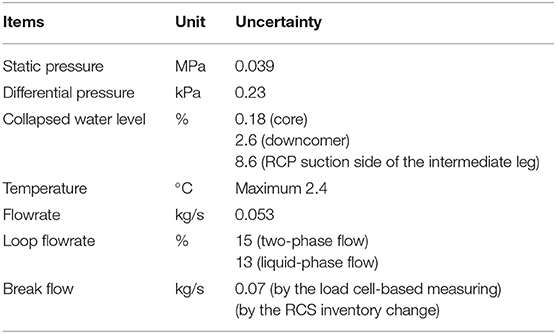
Table 1. Uncertainty level of instruments.
Figure 2 shows a schematic diagram of ATLAS and the position where a break line was installed. Figure 3 shows the break line that was installed on the top side of CL1A of ATLAS to simulate a top-slot break at a CL. The break nozzle, which has 7.12 mm inner diameter, was installed at the break line system to simulate a 4-in break of APR1400.
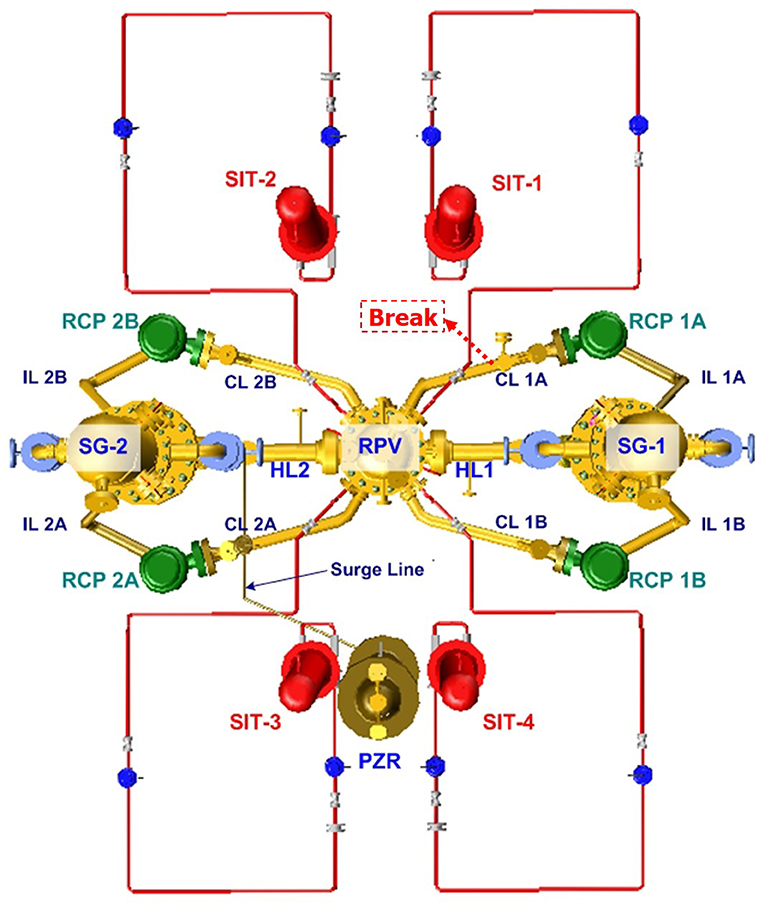
Figure 2. ATLAS bird eye view.
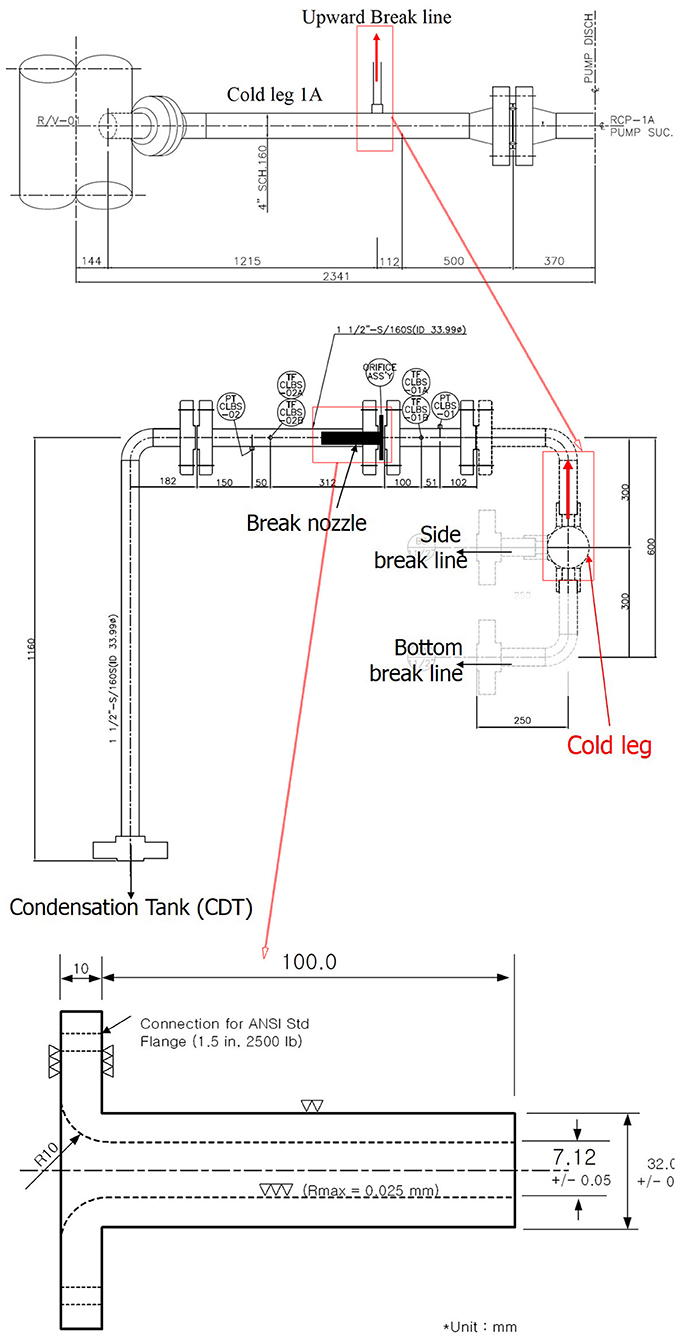
Figure 3. Break simulation system.
Test Condition
During the test, four safety injection tanks (SITs) and four safety injection pumps (SIPs) were utilized as a safety injection system during the test period, and operation of the main steam safety valves (MSSVs) and supply of the auxiliary feed water were available. The initial and boundary conditions were defined in compliance with the scaling ratios.
In the present test, the maximum SIP flowrate and relatively cold emergency core cooling (ECC) water temperature were assumed to promote repeatable LSC and LSR. The SIP flowrate was dependent on the pressure difference between the SIT and the primary system. ECC water (0.32 kg/s) was injected to the RPV through the direct vessel injection (DVI) nozzles. For the present experiment, the ECC water was stored in the RWT, and the temperature was around 10–17°C.
To simulate a conservative condition, a power table that was 1.2 times the ANS-73 decay curve of the decay heat was applied. The initial heater power was 1.64 MW, and then, the heater power was controlled to follow the power table after 31.7 s from the break valve opening. After the system parameters reached a steady-state condition, the systems were maintained for more than 30 min. The experiment then begun by the break valve opening.
Test Results and Discussion
Transient Results of Experiment
According to the agreement of the ATLAS-DSP, the test data should be confidential. All of the test results in this paper including the time frame were thus divided by an arbitrary value and plotted on a non-dimensional axis.
Table 2 summarizes the sequence of major events. After break valve opening, the sequence of experiment was controlled by control logic that defined the set value and related time for this scenario. When the pressure of the pressurizer (sensor ID: PT-PZR-01) dropped below a certain pressure, a low pressurizer pressure (LPP) signal was issued. After the LPP signal, the reactor, RCP, and pressurizer heater were tripped immediately. The main feed water isolation valves were closed with the LPP signal. The actuation of the SIPs was set to occur with a 28-s delay from the LPP signal.
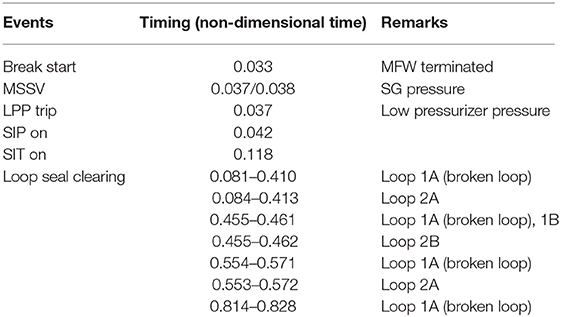
Table 2. Actual sequence of events of the experiment.
LSC and LSR are recognized with the water level of the IL of the primary loop. For an LSC, the water level at the vertical IL (sensor IDs: LT-ILj-03) becomes lower than the height of the horizontal IL. On the other hand, the water level at the vertical IL becomes higher than the height of the horizontal IL for the LSR. Figure 4 shows the water levels measured by LT-ILj-03, core, and downcomer. For the short-term phase, the duration of the LSC is long because a large amount of generated stream due to high heater power kept the steam flow path through the loop seal. For the long-term phase, the heater power decreased and the stream generation rate also decreased, and then, the force that drives the steam flow became weak and the loop seal was reformed easily. During the LSC, the coolant at the ILs flowed to the core, and the core water level increased. After the LSR, the steam that was produced by core decay heat was accumulated at the upper head of the RPV and increased the upper head pressure. The increased pressure pushed down the core water level.
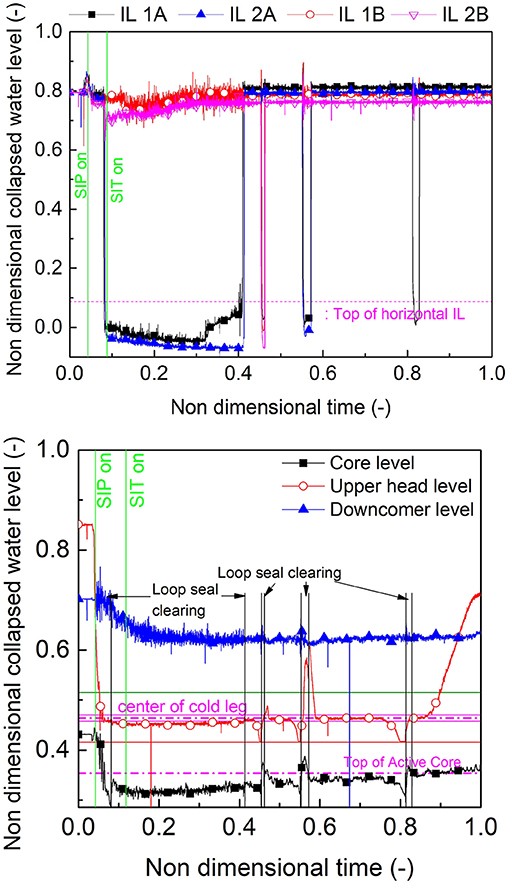
Figure 4. Water level at vertical intermediate leg, core, and downcomer.
Figure 5 shows the heater temperature and the pressure of the pressurizer and SGs. The primary pressure gradually decreased during the test, and some peaks were observed at the LSC and LSR. After the LSR, the heater temperatures slowly increased. This increase can be attributed to the accumulated steam at the upper head. It increased the pressure and saturated temperature in the core. The core heater temperature then increased due to the increased saturated temperature. Therefore, these temperature increases were not a core temperature excursion. In addition, the coolability of the reactor coolant system was available during the test. The pressure of the SGs increased after isolation of the feed and steam line. Furthermore, the MSSVs operated because of the increase in the SG pressure. The pressure of the SGs then gradually decreased by heat transfer from the secondary side to the primary side at the SGs because the temperature of the primary system was lower than that of the secondary system.
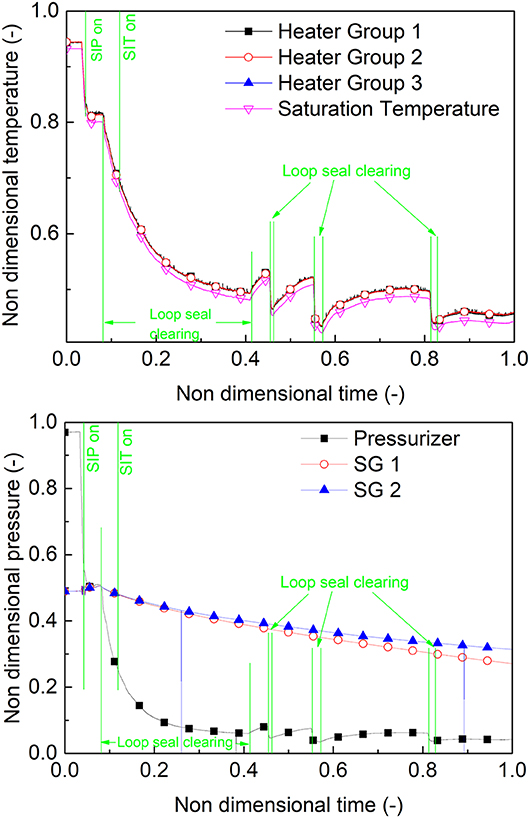
Figure 5. Heater temperature and system pressure.
Figure 6 shows the position of the flow meter at the CL1A and CL flowrates. The flowrate of the CL1A was negative after the break. For the normal condition, the coolant in the CL flows from the SG to the RPV. During the present test, however, the flow direction in CL1A was opposite because the coolant flew out through the break line from both the RPV and the SG. Therefore, the flow meter at CL1A indicated negative value.
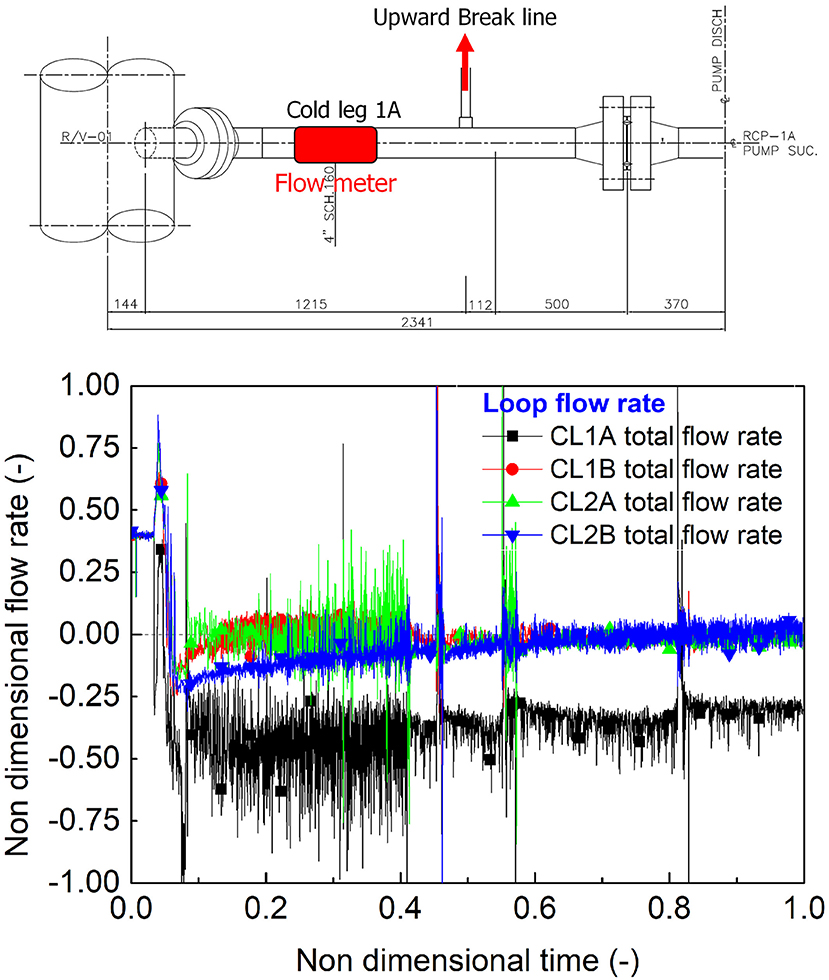
Figure 6. Position of cold leg flow meter and flowrate.
MARS-KS Code Calculation
Nodalization for ATLAS
The experiment shows that the LSC and LSR do not affect the coolability of the reactor cooling system. In the fourth DSP, 15 participants performed several sensitivity analyses using thermal hydraulic safety analysis codes (Kim et al., 2020). From this exercise, several parameters that affect the calculation results were brought out. In this section, sensitivity analysis results using Multidimensional Analysis of Reactor Safety KINS Standard (MARS-KS) with some major parameters of the brought parameters are described.
The MARS-KS code is a best-estimate thermal hydraulic system analysis code that treats the two-phase flow phenomena based on the two-fluid model with six transport equations for the mass, momentum, and energy of each phase (Jeong et al., 1999). KAERI has developed a standard input of MARS-KS for ATLAS. The calculation input for the present test was modified from the standard input for ATLAS. The nodalization for the standard input of the ATLAS facility is shown in Figure 7 (black blocks). In order to simulate a break system at a CL, a break line was added on the top of component 381, which is located between RPV and RCP of CL-1A. The nodalization of the break line is shown in Figure 7 (red blocks). In order to accurately predict the break flow, modeling of the break line should be similar to the test configuration. The developed 1-D break line consisted of the main break line, break nozzle, break valve (trip valve), and sink volume. During the test, choking occurs at the smallest area of the break line. The break line had a pipe with an inner diameter of 33.99 mm, and the break nozzle and break valve had inner diameter of 7.12 mm, which is the smallest diameter. Thus, critical flow is expected to occur at the valve or break nozzle. In the case of the valve, there was a diverging area, and it prevented chocking. Therefore, modeling of the break nozzle was the most important aspect in this simulation, and a choking option was applied only to the break nozzle with the Ransom–Trapp model (subcooled discharge coefficient = 0.8, two-phase discharge coefficient = 1.2, superheated discharge coefficient = 1.0). In addition, an upward facing break was applied with the off-take model for a junction from node C381 to break line. At the loop seal and break junction, the Wallis CCFL model was applied. A heat loss model was not applied for this simulation.
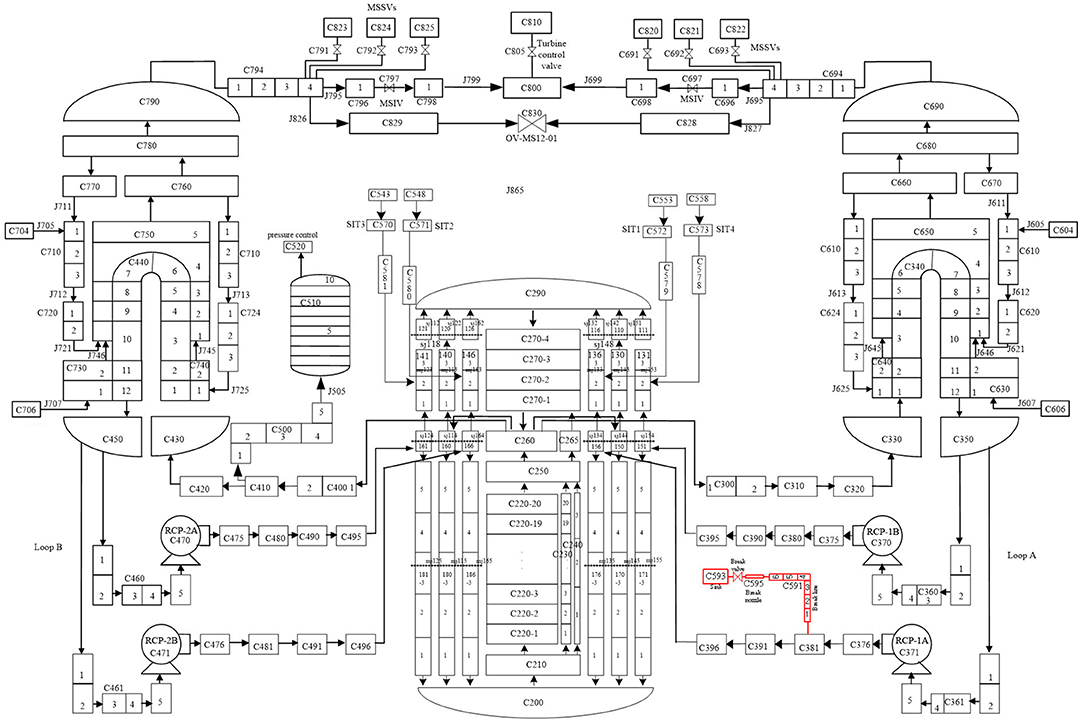
Figure 7. ATLAS nodalization.
Sensitivity Analysis
A sensitivity analysis was performed for the critical flow model, break line modeling, and loop seal node number. The analysis matrix is summarized in Table 3.
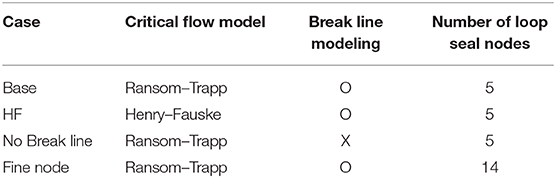
Table 3. Sensitivity analysis matrix.
The base case was compared with the experimental results. The MARS-KS calculation was comparable with the test results, as presented in Figure 8. The predicted times of the first and the second pressure drop were similar with the test data during the early stage. After the second pressure drop, MARS-KS calculated relatively higher pressure because the break flowrate of the calculation was lower than that of the experiment. The maximum core temperature for both data has peaks after LSRs. It could be found from the MARS-KS calculation that an LSR does not induce an excursion of the cladding temperature, which is also observed in the ATLAS test.
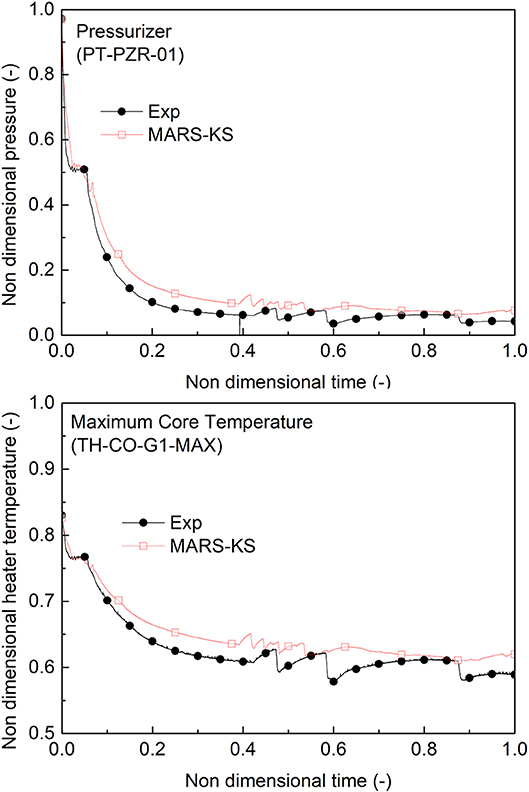
Figure 8. Base case results for primary pressure and maximum core temperature.
Figure 9 shows the effect of the critical flow model. Two Henry–Fauske models with Cd = 0.8/Cn = 0.14 and Cd = 1.0/Cn = 0.14 were applied. Cd = 1.0 is default coefficient in MARS-KS, and it predicted earlier first loop seal clearing and shorter plateau than experiment because break flowrate was larger for very short-term period. To predict similar first loop seal clearing time of experiment, Cd = 0.8 was applied. For the short-term period, the Henry–Fauske models calculated a smaller break flowrate, and the primary pressures were higher than those of the base case. For the long-term period, however, the calculations showed a similar trend.
Figure 9. Sensitivity analysis for critical flow model.
Figure 10 compares the base case and a No Break line case. In the case of the No Break line, the break line was simplified. The break line included only the break valve and the sink volume. The No Break line case shows a fast pressure decrease for the primary system because a simple break line has lower pressure resistance for a break flow, and this leads to a higher break flowrate and fast pressure drop.
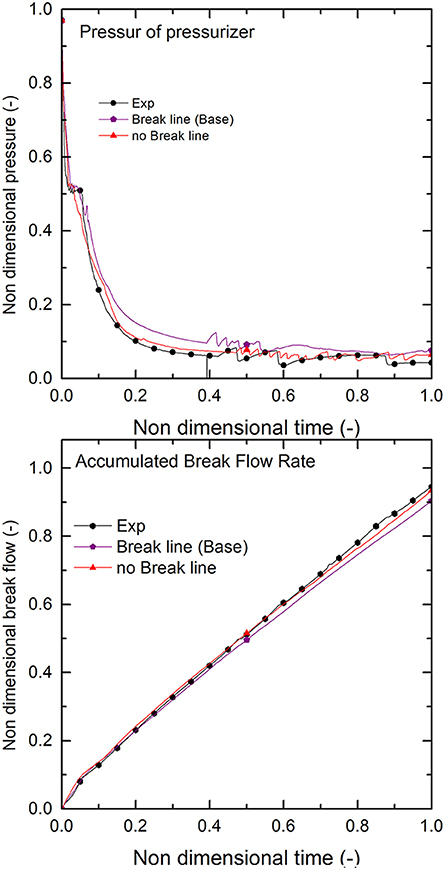
Figure 10. Sensitivity analysis for break line model.
For the fine node case, the node number at the loop seal was increased to 14, as presented in Figure 11. Figure 12 shows the difference between the base case and the fine node case. The fine node case calculated a smaller break flowrate during the break flow condition that was two phased. The primary pressure was thus higher than that of the base case. After the two-phase break flow condition, the break flowrate was almost the same, and the pressure trend was similar for the two cases.
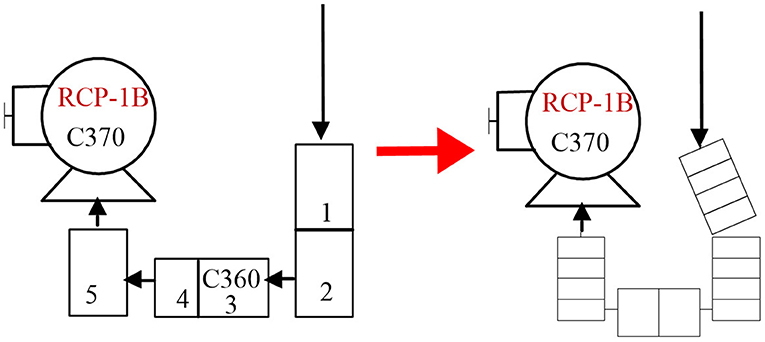
Figure 11. Nodalization for fine node.
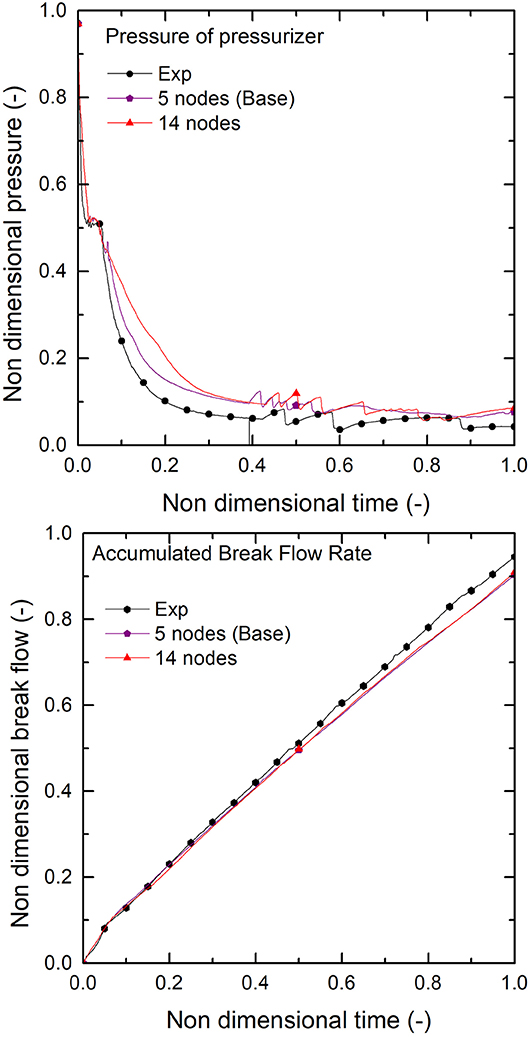
Figure 12. Sensitivity analysis for fine node.
Conclusion
An ATLAS test for a 4-in cold leg top-slot break LOCA was performed to resolve an issue that the LSC and LSR of APR1400 can lead to a core temperature excursion. In the experimental results, the core heater temperature slowly increased after the LSR. This increase is attributed to the accumulated steam at the upper head. This increased the primary pressure and saturated temperature. The core heater temperature then increased due to the saturated temperature. Therefore, this temperature behavior was not a core temperature excursion, and the coolability of the reactor coolant system was available during the transient.
The experimental results were compared with the MARS-KS 1.4 code calculation results. The MARS-KS calculation results show reasonable agreement with the ATLAS test data. The LSC and LSR also did not lead to excursion of the cladding temperature during the transient in the MARS-KS calculation. A sensitivity analysis was performed with the MARS-KS calculation. The effects of the critical flow model, break line modeling, and fine node modeling were discussed, and the results show that these parameters affected the break flowrate and thermal hydraulic behaviors in the system.
Data Availability Statement
The datasets generated for this study will not be made publicly available. These datasets are products for ATLAS-Domestic Standard Problem project. Distribution of datasets is prohibited by MOU for this project.
Author Contributions
JK analyzed experimental data, calculated sensitivity analysis and wrote the first draft. K-HK advised and managed direction of study. All authors contributed to conception and design of the experiment, performed experiment. All authors also contributed to manuscript revision, read, and approved the submitted version.
Funding
The National Research Foundation of Korea (NRF) grant funded by the Korea government (Ministry of Science and ICT) (NRF-2017M2A8A4015026).
Conflict of Interest
The authors declare that the research was conducted in the absence of any commercial or financial relationships that could be construed as a potential conflict of interest.
References
Baek, W. P., Song, C. H., Yun, B. J., Kwon, T. S., Moon, S. K., and Lee, S. J. (2005). KAERI integral effect test program and the ATLAS design. Nuclear Technol. 152, 183–195. doi: 10.13182/NT05-A3669
Choi, K. Y., Kang, K. H., Kwon, T. S., Kim, Y. S., Kim, J.-R., Moon, S. K., et al. (2014). Scaling Analysis Report of the ATLAS Facility, Kaeri Report, KAERI/TR-5465/2014. Daejeon: KAERI.
Ishii, M., and Kataoka, I. (1983). Similarity Analysis and Scaling Criteria for LWRs Under Single Phase and Two-Phase Natural Circulation. NUREG/CR-3267, ANL-83-32. Argonne: Argonne National Laboratory. doi: 10.2172/6312011
Jeong, J. J., Ha, K. S., Chung, B. D., and Lee, W. J. (1999). Development of a multi-dimensional thermal-hydraulic system code, MARS 1.3.1. Ann. Nuclear Energy 26, 1611–1642. doi: 10.1016/S0306-4549(99)00039-0
Kang, K. H., Park, Y., Bae, B. U., Kim, J. R., Choi, N. H., and Choi, K. Y. (2018). Code assessment of ATLAS integral effect test simulating main steam-line break accident of an advanced pressurized water reactor. J. Nuclear Sci. Technol. 55, 104–112. doi: 10.1080/00223131.2017.1383212
Kim, J., Kang, K. H., Bae, B. U., Park, Y. S., Yun, B. S., Lim, S. K., et al. (2020). Comparison Report of Calculations for ATLAS Domestic Standard Problem (DSP-04). KAERI Report, KAERI/TR-7335/2018. Daejeon: KAERI.
Kim, Y. S., Choi, K. Y., Park, H.-S., Cho, S., Kim, B. D., Choi, N. H., et al. (2008). Commissioning of the ATLAS thermal-hydraulic integral test facility. Ann. Nuclear Energy 35, 1791–1799. doi: 10.1016/j.anucene.2008.05.010
Lee, J. B., Bae, B. U., Park, Y., Kim, J., Kim, Y. S., Cho, S., et al. (2018). Description Report of ATLAS Facility and Instrumentation (Second Revision). KAERI Report, KAERI/TR-7218/2018. Daejeon: KAERI.
Keywords: ATLAS, thermal hydraulics, APR1400, top-slot break, cold leg break, loop seal clearing, loop seal reformation
Citation: Kim J, Bae B-U, Lee JB, Park Y, Cho S and Kang K-H (2020) Integral Effect Test on Top-Slot Break Scenario With 4 Inches Cold Leg Break LOCA in ATLAS Facility. Front. Energy Res. 8:57. doi: 10.3389/fenrg.2020.00057
Received: 05 November 2019; Accepted: 25 March 2020;
Published: 28 April 2020.
Edited by:
Jun Wang, University of Wisconsin-Madison, United StatesReviewed by:
Genglei Xia, Harbin Engineering University, ChinaVictor Petrov, University of Michigan, United States
Copyright © 2020 Kim, Bae, Lee, Park, Cho and Kang. This is an open-access article distributed under the terms of the Creative Commons Attribution License (CC BY). The use, distribution or reproduction in other forums is permitted, provided the original author(s) and the copyright owner(s) are credited and that the original publication in this journal is cited, in accordance with accepted academic practice. No use, distribution or reproduction is permitted which does not comply with these terms.
*Correspondence: Kyoung-Ho Kang, a2hrYW5nQGthZXJpLnJlLmty