 Xiaofei Yuan
 Lixin Yang
 Zihao Tian1,2
95% of researchers rate our articles as excellent or good
Learn more about the work of our research integrity team to safeguard the quality of each article we publish.
Find out more
ORIGINAL RESEARCH article
Front. Energy Res. , 10 January 2020
Sec. Nuclear Energy
Volume 7 - 2019 | https://doi.org/10.3389/fenrg.2019.00161
This article is part of the Research Topic Safety Analysis of Nuclear Reactor Thermal-Hydraulics View all 12 articles
The plate OTSG (once-through steam generator) with channel diameter of 1–3 mm has high volume-power ratio and powerful resistance to high temperature and high pressure. It can well satisfy the needs of high heat transfer performance and good security of integrated pressure vessel in nuclear power. Heat transfer characteristics of flow boiling in the channel have aroused increasing concerns from scholars in this field. In this paper, based on the experimental results achieved by the researcher in our team, the drift flux model is applied to simulate the flow boiling heat transfer coefficients in the rectangular channel with equivalent diameter of 1.7 mm to further explore the flow boiling mechanism in the channel. The drift velocities and the distribution parameters of drift flux model are obtained by the empirical correlations of the horizontal flow. The simulation boundary conditions comply to the experimental conditions, the simulation resolutions are obtained by using STAR-CCM+. The simulation results indicate that the heat transfer coefficients trends along the flow direction are consistent with the trends of the experimental data. The drift velocities and the distribution parameters have little effect on the heat transfer coefficients of the horizontal small channel. When the drift velocity is 0 and the distribution parameter is 1, compared with the experimental data, the heat transfer coefficients in the single-phase liquid convective heat transfer region of the flow at high pressure are well higher, while those in the region that from bobble flow to the slug flow of the flow increase, even though they are still lower in annular flow region. The error between the predicted and the experimental is from −50 to +50%. Similarly, the model predicted heat transfer coefficients during subcooled flow boiling at low pressure are generally lower than experimental data. And the error between the predicted and the experimental is from −60 to +10%.
After several severe accidents, the small modular reactor (SMR) design concepts are being developed for its good security and economic performance in recent years. The distinguishing feature of small modular reactor is that the pressurizer, the control rod drive mechanisms, all pumps and the steam generators are integrated into the reactor vessel. On the one hand, the small modular reactor can eliminate the coolant loss accident and enhance the safety in the process of accident. On the other hand, it can not only replace the traditional fossil fuel power plant, but also be used such as in underwater vehicle power system to increase the economy. Importantly, the small module reactor can realize the overall off-site manufacturing and transportation to the site for assembly, which greatly reduces the construction cycle and construction time of the power plant and reduces the cost (Rowinski et al., 2015; Sun et al., 2018; Yin et al., 2018). Furthermore, increasing power density of small modular reactor is a way to make it more attractive for future deployment. And that power density can be increased by using more compact steam generators in the integral reactor vessel design (Shirvan et al., 2012). When the heat load and pressure drop are the same with those of traditional shell and tube heat exchanger, the volume of plate OTSG is decreased by 75%, while the heat transfer area density of plate OTSG is up to about 2,500 m2/m3, which can well meet the requirements of high volume power ratio, high heat transfer efficiency, high temperature resistance, and high pressure proof (Chen et al., 2016). But high volume power ratio of the plate OTSG will result in safety and design implications. So the studying of heat transfer characteristics in small channel of plate OTSG is the focus of research in the field of nuclear energy. At present, many researches focus on verification of the criterion correlations of single-phase convective heat transfer of the plate OTSG with different channel structures, etc. (Khan et al., 2015; Aneesh et al., 2018; Chen et al., 2019). Due to the complexity of the two-phase flow mechanism and the limitation of the experimental measurement methods (Banowski et al., 2017; Li et al., 2017), the two-phase flow characteristics of the small channel with diameter of about 3 mm are different from those of conventional channel. Shin and No (2017) suggested that experimental mass flow of flow boiling in small channel fluctuated greatly at low flow rates because of bubble disturbance and flow changed steadily as pressure increased. Yan et al. (2018) found that the bubble size during sliding in narrow rectangular channel are mainly affect by the liquid subcooling and wall superheat. Huang (2018) and Huang et al. (2018) found that the throat-annular flow pattern just generated in the horizontal small rectangular channel at high pressure and the heat transfer coefficients along the channel were higher than those of lower pressure with experimental conditions same. Kwon et al. (2018) proposed that film boiling occurred in the small semicircular channel because of the large temperature difference between the hot side and the cold side. As for flow boiling model, a mechanistic model for the wall heat flux partitioning during subcooled flow boiling developed and validated by Basu et al. (2005a,b) showed that the transient conduction component were the dominant mode of heat transfer at very high superheats. And an subcooled flow boiling modeling framework for CFD presented by Gilman and Baglietto (2017) revealed that the sliding (transient) conduction and augmented forced convection were the highest modes of heat removal from the surface. The predictions of an analytical model of transient heat transfer which developed by Wang and Podowski (2019) showed a good agreement with measurements. Sometimes the two-fluid model considering multiple effects between liquid and vapor phases have higher simulation accuracy, with closure models improved by experimental data for specific problems in a small range (Colombo and Fairweather, 2016; Sadaghiani and Koşar, 2016). However, due to lack of appropriate closure models describing all relevant phenomena and good numerical robustness for geometrically complex systems, applying two-fluid model to the engineering filed is very difficult now. It was noteworthy that within a certain operating range, the drift flux model predictions of the 2-D conventional scale channel were in good agreement with the experimental results (Rassame and Hibiki, 2018; Wei et al., 2018). And the empirical correlations of drift flow velocities and distribution parameters for different flow patterns in many drift flow models are available not only for conventional scale vertical channel (Hibiki and Ishii, 2003; Mei et al., 2018) but also for the horizontal flow of small channels (Bhagwat and Ghajar, 2014; Ran et al., 2018; Rassame and Hibiki, 2018). Therefore, based on the experimental data about heat transfer coefficients in the small rectangular channel of plate OTSG obtained by the researchers in our team (Huang, 2018; Huang et al., 2018), the drift flux model is applied to simulating the flow boiling heat transfer coefficients in the small rectangular channel of the plate OTSG in this paper. And the distribution parameters and the averaged drift velocities of drift flux model are illustrated in empirical correlations developed by Bhagwat and Ghajar (2014).
A test loop for the studying of flow boiling characteristics in small channel of plate OTSG had been built in our laboratory. Schematic diagram of the experimental apparatus is shown in Figure 1. The subcooled deionized water in the water tank is driven by the plunger pump into the preheater and then the test section. The 3 kW preheater is used to control the water temperature at the inlet of the test section. The voltage regulators having a total heating capacity of 9 kW make the preheated water turn into vapor in the channel of the test section. Then the liquid/vapor fluid mixture is condensed when mixture flows into the condenser. Finally the deionized water flow back to the tank. The mass flow in the loop is measured by the mass flowmeter. Temperature and pressure data are measured not only at inlet of the preheater but also at inlet and outlet of the test section. The system pressure is controlled by back pressure valve and safety valve. A high-speed camera is used to capture the flow pattern along the visualized area.
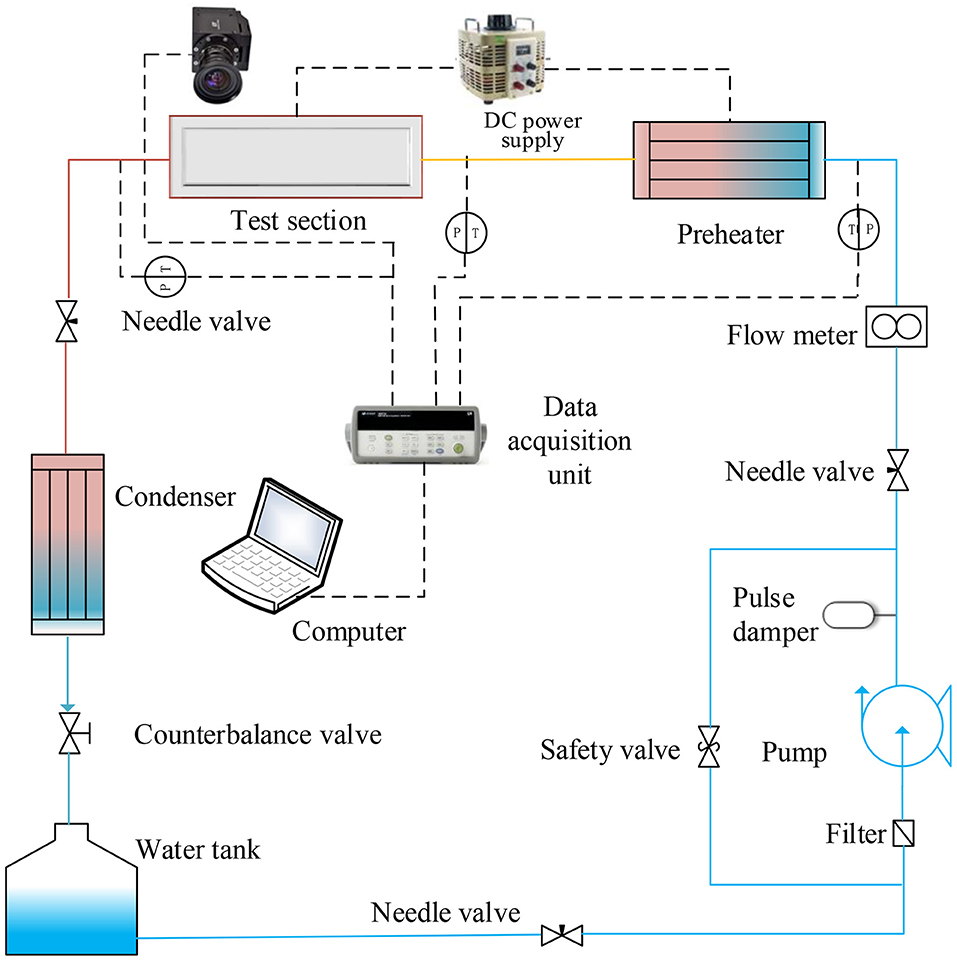
Figure 1. Schematic diagram of the experimental apparatus.
The schematic diagram of the test section is represented in Figure 2. The test section which horizontally placed in the test facility is 1,300 mm long, 90 mm wide, and 60 mm high. The rectangular small channel is machined in a stainless steel block. The high borosilicate glass is on the rectangular channel with asbestos pad under it. The rubber gasket is under the stainless steel cover of test section and the stainless steel cover is pressed against the glass by bolts. The rectangular channel is 2 mm in width and 1 mm in depth (the thickness of the asbestos gasket is 0.5 mm and so the total depth is 1.5 mm), thus resulting in an internal equivalent diameter of 1.7 mm. Its total length is 1,100 mm and the effective heating length is 900 mm. There are circular sumps with a diameter of 6 mm at each end of the rectangular channel. The two sumps extend 11 mm downward and connected with a circular passage of 8 mm in diameter and 86 mm in length, respectively. In order to facilitate the pipe connection, circular passages with a diameter of 13 mm and a length of 14 mm are machined at the inlet and outlet. At the bottom of the experimental section, there are two slots with a width of 5 mm and a depth of 39 mm near the inlet and outlet, so that the heat of the heated copper block is conducted upward, so as not to affect the liquid temperature measurement of the inlet and outlet. To measure the temperature along the test section, 27 thermocouples, three in each group, arranged right below the rectangular channel. Thirty-six barrel heaters with the diameter of 9 mm are placed in the copper base to provide heat power. The test section is covered with asbestos insulation material in order to minimize the heat losses.
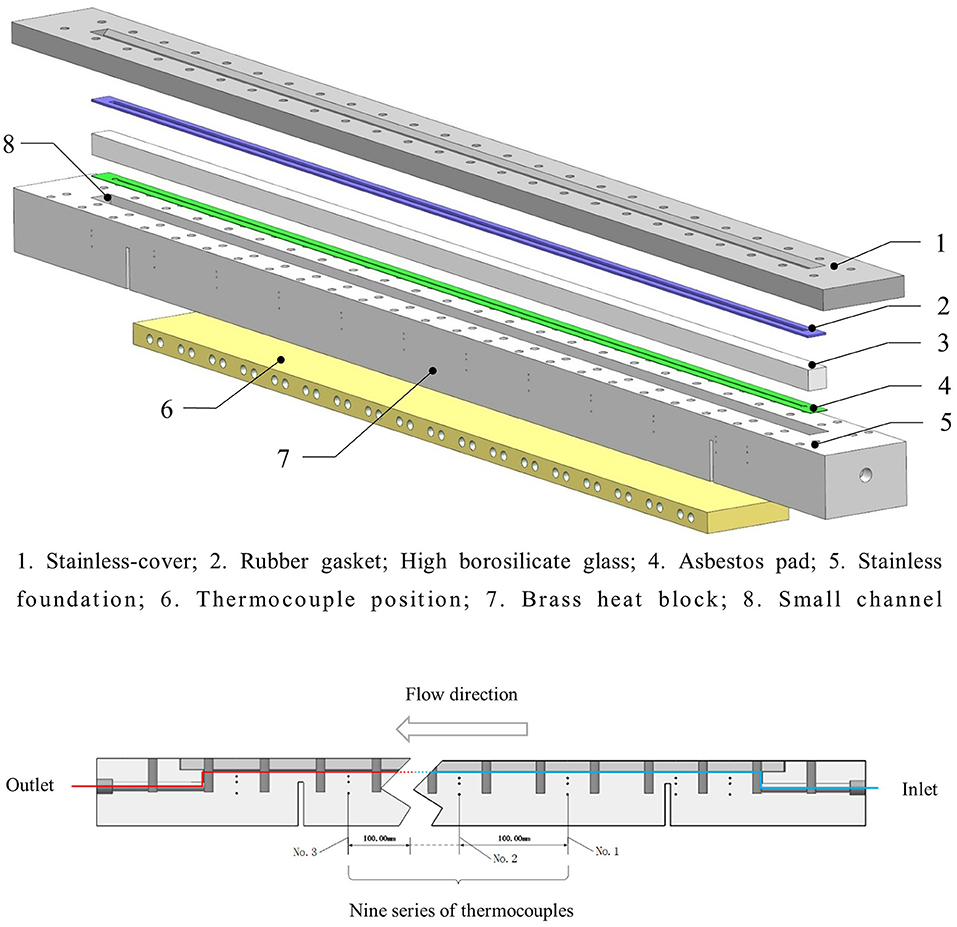
Figure 2. The schematic diagram of the test section.
The mass flux G inside the channel are calculated by the measured mass flow rate:
Subcooled section length:
The vapor quality x at outlet can be calculated by the following formula:
The heat transfer coefficient at the measurement point is obtained as follows:
The subscript i refers to the ith point. Whereas, Twater, i represents the temperature of the water. The temperature of the water rises linearly from the inlet temperature to the saturation temperature in the flow direction when the water is in subcooled state. In the boiling state, the temperature of the water represents the saturation temperature. Assuming that the pressure along the path decreases linearly from the inlet pressure to the outlet pressure and the corresponding saturation temperature evaluated by the software REFPROP 9.0.
The heat flux and channel wall temperature are evaluated by the one-dimensional Fourier heat conduction law in the direction perpendicular to the channel cross section, respectively:
Whereas, qi is the heat flux and Tw, i is the channel wall temperature. Where k is thermal conductivity of stainless material. ΔTi and Δyi represent the temperature difference and vertical distance between the thermocouples, respectively. Ti refers to the thermocouple temperature.
Huang (2018) and Huang et al. (2018) conducted the subcooled flow boiling experiments in the rectangular small channel with the above introduced test loop. The heat transfer coefficients along the flow direction were reported with the uncertainty of ±6.98%. The flow patterns in the rectangular small channel at a low pressure and a high pressure from Huang (2018) and Huang et al. (2018) are shown in Figure 3. As shown seven flow patterns were defined along the path in the experimental visualization and the proportion of every flow patterns in the flow path was described in the literature. To deeply understand the heat transfer mechanism in the small rectangular channel of plate OTSG, the drift flux model is applied to simulate the heat transfer coefficients in this paper based on the experimental data reported. The experimental conditions applied in this simulation are listed in Table 1. The vapor qualities at outlet of the channel for all these cases are lower than 1 and critical heat flux (CHF) does not occurred during Huang's experiments.
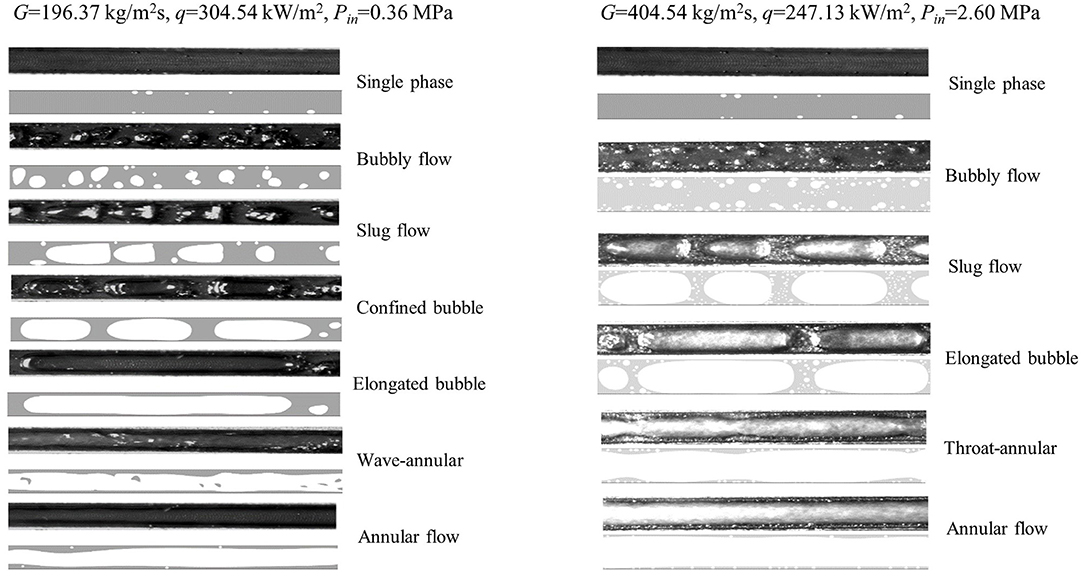
Figure 3. The flow patterns in the rectangular small channel at a low pressure and a high pressure.
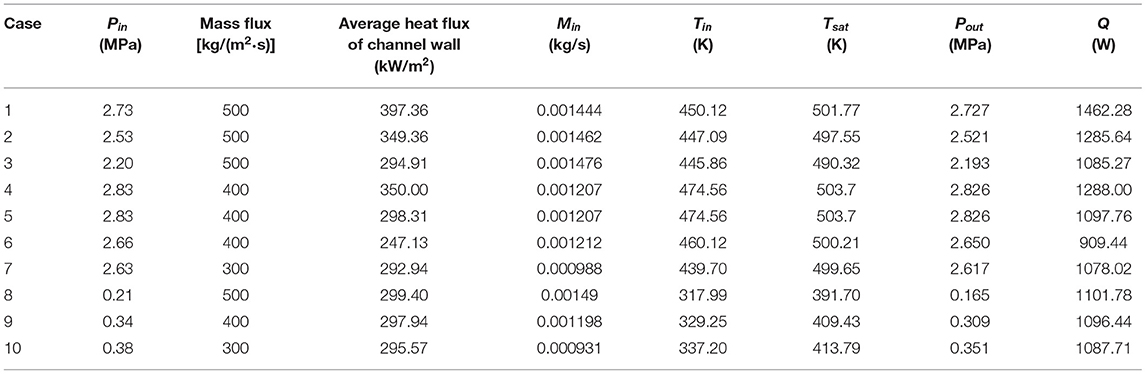
Table 1. Simulation cases based on experimental conditions.
Assumption:
(a) The gas-liquid two-phase mixture is considered as a single fluid;
(b) The gas-liquid two phases are in thermal equilibrium;
(c) The gas-liquid two phases can move relative to each other.
Vapor quality:
Vapor volume fraction:
Mixture continuity:
Mixture momentum:
Mixture energy:
Solid equation:
Flow-solid interface equation:
The stress tensor:
Heat flux:
The effective thermal conductivity:
The mixture density:
The mixture velocity:
The mixture viscosity:
The mixture thermal conductivity:
The mixture-specific static enthalpy:
The mixture total energy:
The mixture total enthalpy:
The mean drift velocity of the vapor phase:
The volume-weighted mixture velocity:
The velocity of vapor phase:
The velocity of liquid phase:
The averaged drift velocity is formulated in a functional form as:
The distribution parameter:
The subscripts v, l, m, and s represent gas phase, liquid phase, mixing, and solids, respectively. Tsat is the saturation temperature. ρvs and ρls are the densities of vapor and liquid at saturation temperature, respectively. hvs and hls refer to the enthalpies of vapor and liquid at saturation temperature, respectively. fv is the force due to gravity.
The empirical correlations of the distribution parameter and the averaged drift velocity developed by Bhagwat and Ghajar (2014) with experimental methods can be modeled as follow.
The distribution parameter:
The averaged drift velocity:
The numerical model and boundary conditions is shown in Figure 4. UG is used for the construction of the 3-D numerical model. Numerical solutions are obtained by using STAR-CCM+. As shown the numerical model is almost the same to that experimental test section studied by Huang (2018). Thermocouple holes and bolt holes have little effects on heat transfer in the channel. They are removed to simplify the numerical model so as to reduce the number of grids and increase computational efficiency. The uniform heating power is provided on the barrel heaters wall in the copper base. The other solid walls are adiabatic. The mass flow inlet and pressure outlet boundary conditions are selected for the flow liquid, respectively. All the data of simulation boundary conditions are taken from Huang's experimental data as shown in Table 1. The temperature of fluid thermo-physical properties is defined as saturation temperature at the average pressure of the inlet and outlet of test section. The fluid thermo-physical properties are obtained from the software REFPROP 9.0. The turbulence model is the K-Epsilon model. The thermo-physical properties of the solid materials are presented in Table 2. Steady-state simulations are conducted for all cases.
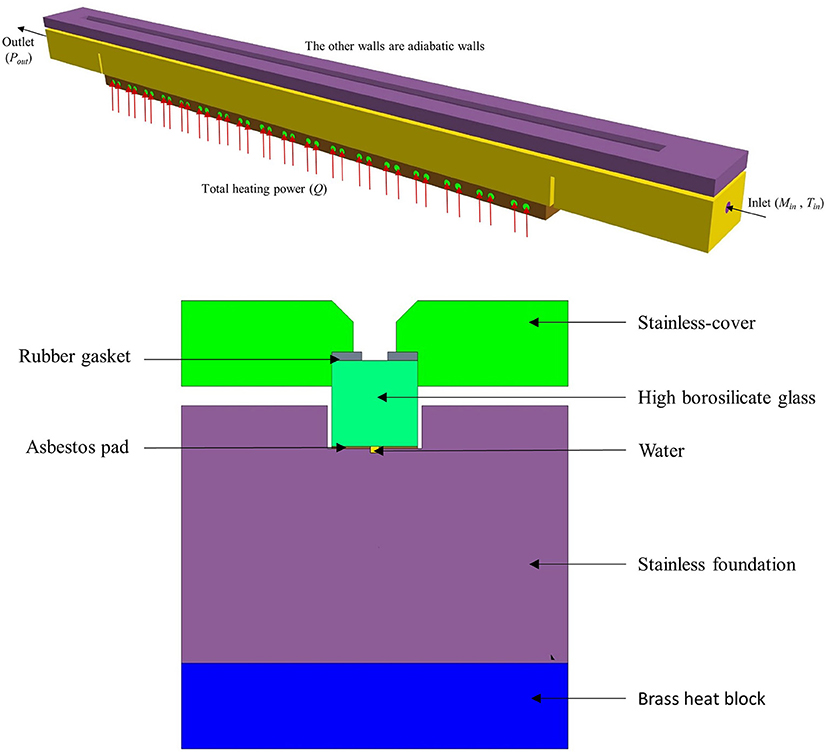
Figure 4. The numerical model and boundary conditions.
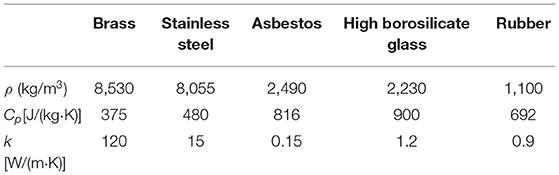
Table 2. The thermo-physical properties of the solid materials.
The mesh of numerical model is shown in Figure 5. The mesh consists of a polyhedral mesh and a near wall prism layer mesh. The prism layer mesh is used at the interface between the solid and the fluid. The first layer is 0.1 mm. And three rows are constructed with a growth factor of 1.2 so that the wall y+ value remains at ~30. Four different base size polyhedral meshes are used for mesh independence test, including mesh with grid numbers of 2373485, 2814973, 3370942, and 3722110. The results of grid independent validation test, illustrated in Figure 6, confirm that the average heat transfer coefficients do not change too much as a function of number of elements when the grid beyond 3370942 elements. Therefore, the grid number of 3370942 is sufficient to obtain a grid independent result.
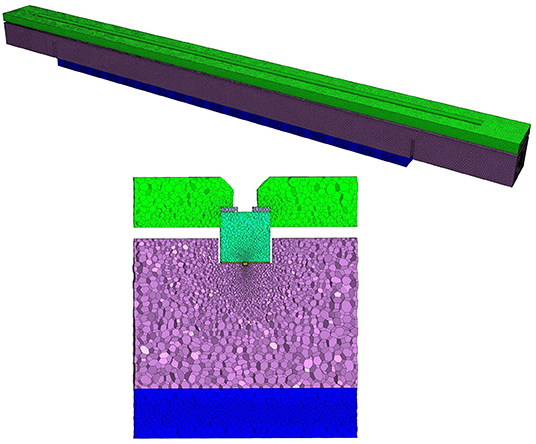
Figure 5. The mesh of numerical model.
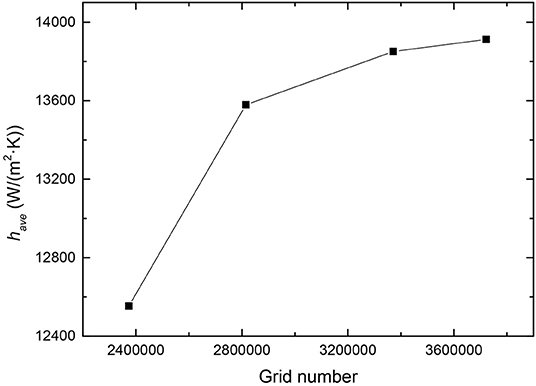
Figure 6. The results of grid independent validation test.
The data reduction method of simulation is presented in Figure 7. The numerical heat transfer coefficients along the path can be calculated with the same formula used in the experiment. To reduce the error that maybe be caused by limit local data in the simulation, the small rectangular channel is divided into nine sections and each is 100 mm long. The heat flux and temperature of the channel wall of each section in the formula are regarded as the area average value, respectively. The fluid temperature of each section is defined as the average temperature at the centerline. Simply, the homogeneous flow model is abbreviated as HM, the drift flux model, as DFM, the experiment, as Exp.
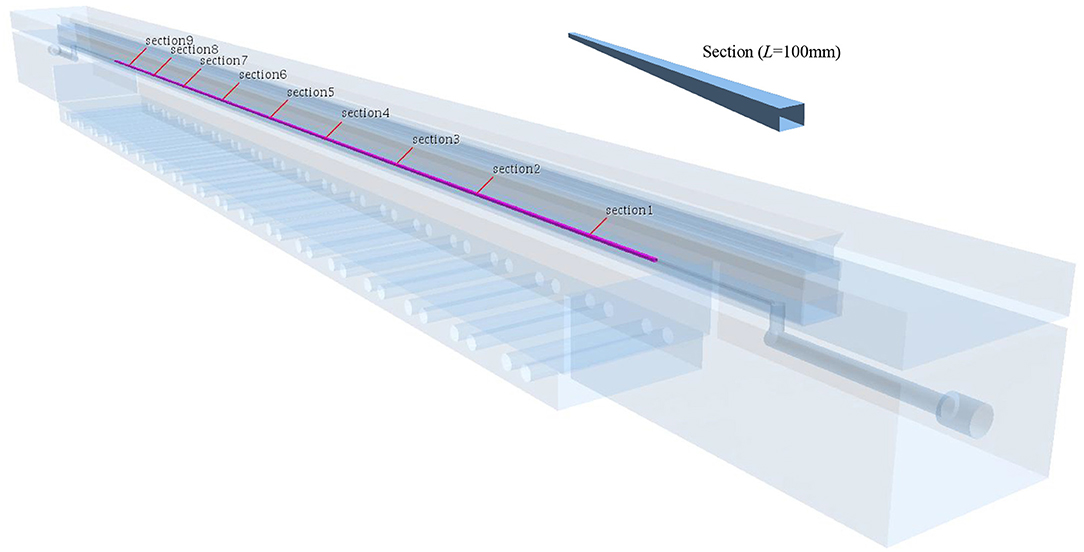
Figure 7. The data reduction method of simulation.
The relative error can be calculated as follow:
It should be noted that the proportions of different flow patterns mentioned in this results discussion are all taken from literatures of Huang (2018) and Huang (2018).
Figure 8 shows the effects of the distribution parameters and the averaged drift velocities on the heat transfer coefficients for case 1 [G = 500 kg/(m2·s), q = 397.36 kW/m2]. The distribution parameters and drift velocities calculated by Bhagwat and Ghajar (2014) have little change with gas fraction. So they are each evaluated by the average value (C0 = 1.02,vvj = 0.05m/s) in the simulation. Also other typical values for the drift velocities and the distribution parameters are also applied in the simulation. An acceptable prediction is observed in the middle section of the channel, while simulated heat transfer coefficient is somewhat over-predicted in the inlet section and under-predicted in the outlet section. Obviously the drift velocities and the distribution parameters have little effects on the heat transfer coefficients during subcooled flow boiling. In short, the effects of two parameters of drift flux model can be neglected and that is homogeneous flow model.
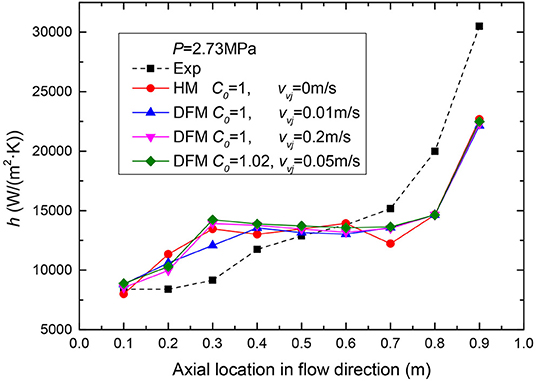
Figure 8. The effects of the distribution parameters and the averaged drift velocities on the heat transfer coefficients.
The comparisons between experimental and numerical heat transfer coefficients at three heat fluxes of 294.91, 349.36, and 397.36 kW/m2, a mass flux of 500 kg/(m2·s) are shown in Figures 9–11 respectively. As can be found in the simulation results, the heat transfer coefficients increase along the flow path and the trends of simulation results match well with that of the experimental data. Compare with the experimental data, the heat transfer coefficients of simulation are well higher in the single-phase liquid convective heat transfer region and the higher the heat flux, the higher the simulated heat transfer coefficients. The differences among the heat transfer coefficients of simulation and those of experiment are mainly caused by the differences of thermo-physical properties. The temperature of the simulated fluid thermo-physical properties is defined as saturation temperature corresponding to the average pressure of the inlet and outlet of test section. The inlet pressure are slightly higher than the average pressure of inlet and outlet and also the inlet temperature are lower than the saturation temperature at the average pressure. And the values of specific heat of water in inlets of experiments are smaller than those at saturation temperatures which are applied to the simulation. Therefore, more heat is taken away from the inlet section in the simulation and the numerical heat transfer coefficients are higher than those of experiment. As the fluid enters the nucleate boiling region, the numerical heat transfer coefficients tend to approach the experimental results, and this trend continues in the region that from bobble flow to the slug flow. This is because of the phenomenon that the bubbles separated from the wall and sufficiently mixed with the water. Then the homogeneous flow model can well predict the heat transfer coefficients of plate OTSG. As flow boiling develops, the flow pattern is converted from a slug flow to an annular flow. The heat transfer coefficients continued to increase, even though they are still lower than those of experiment, It is considered that the small bubbles in the thin liquid layer near the wall disturb the thermal boundary layer and enhance the convective heat transfer in the experiment. But the homogeneous model can't give this phenomena a reasonable description. Figure 12 indicates the relative error at high pressure. The relative error between simulation and experiment is from −50 to +50%.
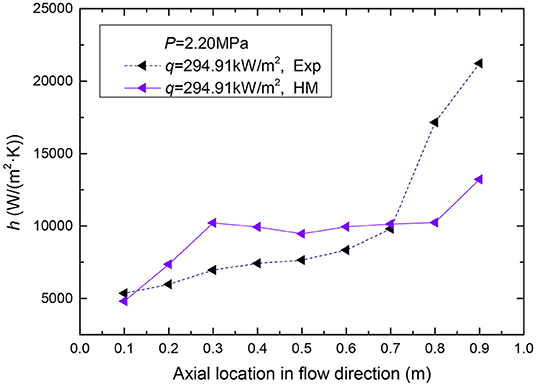
Figure 9. The comparisons between experimental and numerical heat transfer coefficients for q = 294.91 kW/m2 and G = 500 kg/(m2·s).
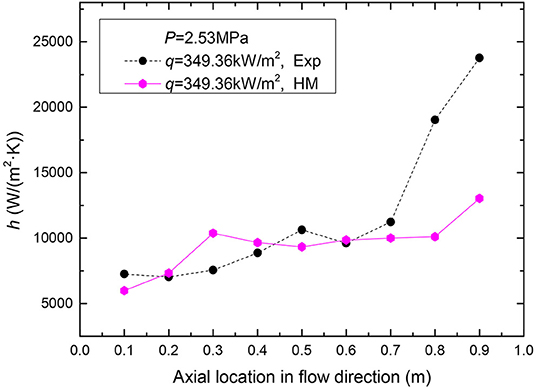
Figure 10. The comparisons between experimental and numerical heat transfer coefficients for q = 349.36 kW/m2 and G = 500 kg/(m2·s).
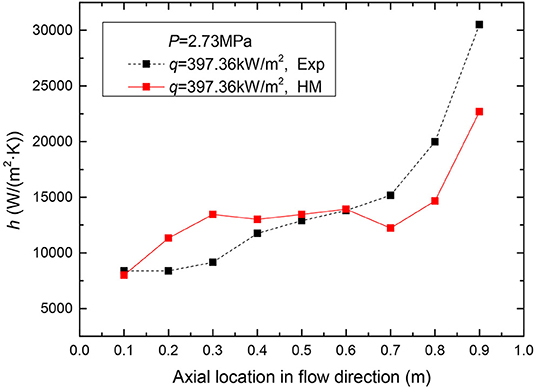
Figure 11. The comparisons between experimental and numerical heat transfer coefficients for q = 397.36 kW/m2 and G = 500 kg/(m2·s).
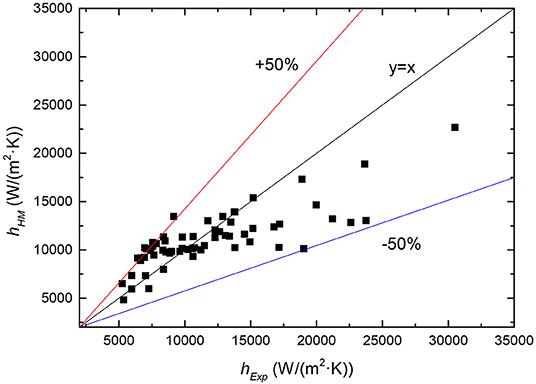
Figure 12. The relative error at high pressure.
The influences of the pressures on the heat transfer coefficients for mass fluxes of 300 and 400 kg/(m2·s), heat flux of 300 kW/m2 are illustrated in Figures 13, 14, respectively. Compare with the experimental data, the simulation results trends at high pressures match better than those at low pressures. The numerical heat transfer coefficients in the single-phase liquid convective heat transfer region are basically consistent with the experimental results at low pressure. While simulation results are lower than the experimental data in the flow boiling region. It is taken into consideration that the gas density is lower at low pressure and thus the bubble disturbance to the liquid can significantly increase heat transfer in the experimental. The relative error at low pressure indicated in Figure 15, shows that the relative error between model predicted results and experimental data is from −60 to +10%.
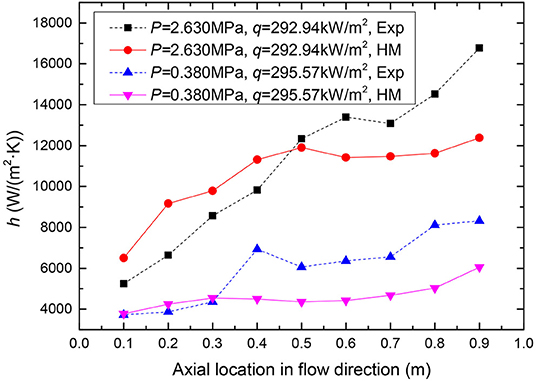
Figure 13. The influences of the pressures on the heat transfer coefficients for q = 300 kW/m2 and G = 300 kg/(m2·s).
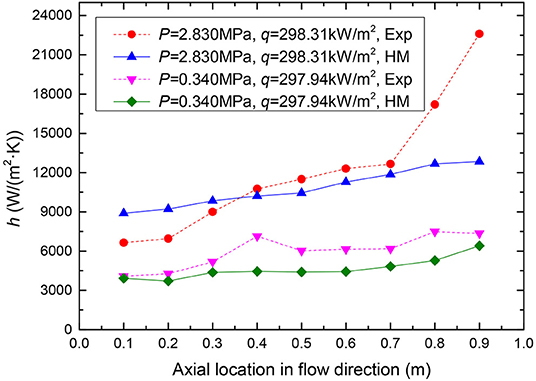
Figure 14. The influences of the pressures on the heat transfer coefficients for q = 300 kW/m2 and G = 400 kg/(m2·s).
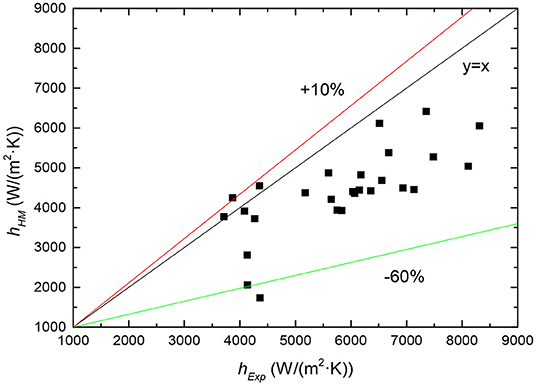
Figure 15. The relative error at low pressure.
In this research, the drift flux model and homogeneous flow model are adopted to simulate the flow boiling heat transfer coefficients in small rectangular channel, The simulation software is STAR-CCM+. Conclusions are drawn as follows:
(1) The drift velocities and the distribution parameters have little effects on the heat transfer coefficients of the plate OTSG and the effects can be neglected.
(2) The homogeneous flow model under-predicts the heat transfer coefficients during subcooled flow boiling at low pressures. And the predictions of the homogeneous flow model at high pressures match better with the experimental results.
(3) At high pressure, the relative error between prediction and experiment is from −50 to +50%. At low pressure, the relative error between prediction and experiment is from −60 to +10%.
(4) According to the fluid-solid coupled 3-D simulations, the homogeneous flow model can predict the trends of heat transfer coefficients along the path at both high and low pressures. And at high pressure, the homogeneous flow model can well predict the heat transfer coefficients of plate OTSG in the region that from bobble flow to the slug flow. It is shown that the homogeneous flow model will be useful for evaluating the heat transfer characteristics of the plate OTSG.
All datasets generated for this study are included in the article/supplementary material.
XY carried out the establishment of boiling numerical model, geometric model, mesh models, the sampling of boundary conditions from experimental data, the results analysis as well as the writing of paper. LY provided the guideline of the research and modified the language of manuscript. ZT help finish the geometric modeling. SH and HL also provide guidance and assistance in the process. All authors worked together to define the methodology and procedures.
The authors declare that the research was conducted in the absence of any commercial or financial relationships that could be construed as a potential conflict of interest.
Aneesh, A. M., Sharma, A., Srivastava, A., and Chaudhury, P. (2018). Effects of wavy channel configurations on thermal-hydraulic characteristics of printed circuit heat exchanger (PCHE). Int. J. Heat Mass Transf. 118, 304–315. doi: 10.1016/j.ijheatmasstransfer.2017.10.111
Banowski, M., Hampel, U., Krepper, E., Beyer, M., and Lucas, D. (2017). Experimental investigation of two-phase pipe flow with ultrafast X-ray tomography and comparison with state-of-the-art CFD simulation. Nucl. Eng. Des. 336, 90–104. doi: 10.1016/j.nucengdes.2017.06.035
Basu, N., Warrier, G. R., and Dhir, V. K. (2005a). Wall heat flux partitioning during subcooled flow boiling: part 1—model development. J. Heat Transfer 127, 131–140. doi: 10.1115/1.1842784
Basu, N., Warrier, G. R., and Dhir, V. K. (2005b). Wall heat flux partitioning during subcooled flow boiling: partII—model validation. J. Heat Transfer 127, 141–148. doi: 10.1115/1.1842785
Bhagwat, S. M., and Ghajar, A. J. (2014). A flow pattern independent drift flux model based void fraction correlation for a wide range of gas-liquid two phase flow. Int. J. Multiphase Flow 59, 186–205. doi: 10.1016/j.ijmultiphaseflow.2013.11.001
Chen, M., Sun, X., and Christensen, R. N. (2019). Thermal-hydraulic performance of printed circuit heat exchangers with zigzag flow channels. Int. J. Heat Mass Transf. 130, 356–367. doi: 10.1016/j.ijheatmasstransfer.2018.10.031
Chen, M., Sun, X., Christensen, R. N., Shi, S., Skavdahl, I., Utgikar, V., et al. (2016). Experimental and numerical study of a printed circuit heat exchanger. Ann. Nucl. Energy 97, 221–231. doi: 10.1016/j.anucene.2016.07.010
Colombo, M., and Fairweather, M. (2016). Accuracy of eulerian–eulerian, two-fluid cfd boiling models of subcooled boiling flows. Int. J. Heat Mass Transf. 103, 28–44. doi: 10.1016/j.ijheatmasstransfer.2016.06.098
Gilman, L., and Baglietto, E. (2017). A self-consistent, physics-based boiling heat transfer modeling framework for use in computational fluid dynamics. Int. J. Multiphase Flow 95, 35–53. doi: 10.1016/j.ijmultiphaseflow.2017.04.018
Hibiki, T., and Ishii, M. (2003). One-dimensional drift-flux model and constitutive equations for relative motion between phases in various two-phase flow regimes. Int. J. Heat Mass Transf. 46, 4935–4948. doi: 10.1016/S0017-9310(03)00322-3
Huang, Q. (2018). Experimental study on flow boiling in large diameter ratio of small channel [master's thesis]. Beijing Jiaotong University, Beijing, China.
Huang, Q., Jia, L., Dang, C., and Yang, L. X. (2018). Experimental study on flow boiling of deionized water in a horizontal long small channel. J. Therm. Sci. 27, 157–166. doi: 10.1007/s11630-018-0996-1
Khan, H. H., M, A. A., Sharma, A., Srivastava, A., and Chaudhuri, P. (2015). Thermal-hydraulic characteristics and performance of 3d wavy channel based printed circuit heat exchanger. Appl. Therm. Eng. 87, 519–528. doi: 10.1016/j.applthermaleng.2015.04.077
Kwon, D., Jin, L., Jung, W. S., and Jeong, S. (2018). Experimental investigation of heat transfer coefficient of mini-channel pche (printed circuit heat exchanger). Cryogenics 92, 41–49. doi: 10.1016/j.cryogenics.2018.03.011
Li, H. W., Li, J. W., Su, Q., Liu, J. P., and Sun, B. (2017). Analysis of the characteristics of two-phase flow pattern in y-shape mixed microchannel based on double coupled duffing vibration simulation detection system. Exp. Therm. Fluid Sci. 91, 432–442. doi: 10.1016/j.expthermflusci.2017.10.039
Mei, Y., Gong, S. J., Gu, H. Y., and Ma, W. M. (2018). A study on steam-water two phase flow distribution in a rectangular channel with di?erent channel orientations. Exp. Therm. Fluid Sci. 99, 219–232. doi: 10.1016/j.expthermflusci.2018.07.022
Ran, K., Qingzi, Z., Seungjin, K., Mamoru, I., Stephen, B., Kirk, T., et al. (2018). Void fraction prediction and one-dimensional drift-flux analysis for horizontal two-phase flow in different pipe sizes. Exp. Therm. Fluid Sci. 99, 433–445. doi: 10.1016/j.expthermflusci.2018.08.019
Rassame, S., and Hibiki, T. (2018). Drift-flux correlation for gas-liquid two-phase flow in a horizontal pipe. Int. J. Heat Mass Transf. 69, 33–42. doi: 10.1016/j.ijheatfluidflow.2017.11.002
Rowinski, M. K., White, T. J., and Zhao, J. Y. (2015). Small and medium sized reactors (SMR): a review of technology. Renew. Sustain. Energy Rev. 44, 643–656. doi: 10.1016/j.rser.2015.01.006
Sadaghiani, A. K., and Koşar, A. (2016). Numerical and experimental investigation on the effects of diameter and length on high mass flux subcooled flow boiling in horizontal microtubes. Int. J. Heat Mass Transf. 92, 824–837. doi: 10.1016/j.ijheatmasstransfer.2015.09.004
Shin, C. W., and No, H. C. (2017). Experimental study for pressure drop and flow instability of two-phase flow in the PCHE-type steam generator for SMRs. Nucl. Eng. Des. 318, 109–118. doi: 10.1016/j.nucengdes.2017.04.004
Shirvan, K., Hejzlar, P., and Kazimi, M. S. (2012). The design of a compact integral medium size PWR. Nucl. Eng. Des. 243, 393–403. doi: 10.1016/j.nucengdes.2011.11.023
Sun, H., Wang, C., Liu, X., Tian, W., Qiu, S., and Su, G. (2018). Reactor core design and analysis for a micronuclear power source. Front. Energy Res. 6:14. doi: 10.3389/fenrg.2018.00014
Wang, Z. Y., and Podowski, M. Z. (2019). Analytical modeling of the effect of heater geometry on boiling heat transfer. Nucl. Eng. Des. 144, 122–130. doi: 10.1016/j.nucengdes.2018.12.020
Wei, N., Xu, C. Y., Meng, Y. F., Li, G., Ma, X., and Liu, A. Q. (2018). Numerical simulation of gas-liquid two-phase flow in wellbore based on drift flux model. Appl. Math. Comput. 338, 175–191. doi: 10.1016/j.amc.2018.03.067
Yan, M., Ren, T., Chen, K., Yan, C., Yang, Y., Tian, C., et al. (2018). Visualized experiment of bubble behaviors in a vertical narrow rectangular channel under natural circulation condition. Front. Energy Res. 6:105. doi: 10.3389/fenrg.2018.00105
Yin, S., Tian, Y., Qiu, S., Tian, Y., Fang, H., Huang, W., et al. (2018). Accident process and core thermal response during a station blackout initiated study for small modular reactor. Front. Energy Res. 6:43. doi: 10.3389/fenrg.2018.00043
Keywords: plate OTSG, rectangular channel, flow boiling, drift flux model, heat transfer coefficient
Citation: Yuan X, Yang L, Tian Z, Han S and Lu H (2020) Numerical Simulation of Flow Boiling in Small Channel of Plate OTSG. Front. Energy Res. 7:161. doi: 10.3389/fenrg.2019.00161
Received: 07 October 2019; Accepted: 11 December 2019;
Published: 10 January 2020.
Edited by:
Liangming Pan, Chongqing University, ChinaReviewed by:
Rita Mastrullo, Università degli Studi di Napoli Federico II, ItalyCopyright © 2020 Yuan, Yang, Tian, Han and Lu. This is an open-access article distributed under the terms of the Creative Commons Attribution License (CC BY). The use, distribution or reproduction in other forums is permitted, provided the original author(s) and the copyright owner(s) are credited and that the original publication in this journal is cited, in accordance with accepted academic practice. No use, distribution or reproduction is permitted which does not comply with these terms.
*Correspondence: Lixin Yang, bHh5YW5nMUBianR1LmVkdS5jbg==
Disclaimer: All claims expressed in this article are solely those of the authors and do not necessarily represent those of their affiliated organizations, or those of the publisher, the editors and the reviewers. Any product that may be evaluated in this article or claim that may be made by its manufacturer is not guaranteed or endorsed by the publisher.
Research integrity at Frontiers
Learn more about the work of our research integrity team to safeguard the quality of each article we publish.