 Sabine Ernst
 Tom Patrick Heins1,2
 Uwe Schröder
95% of researchers rate our articles as excellent or good
Learn more about the work of our research integrity team to safeguard the quality of each article we publish.
Find out more
ORIGINAL RESEARCH article
Front. Energy Res. , 20 December 2019
Sec. Electrochemical Energy Storage
Volume 7 - 2019 | https://doi.org/10.3389/fenrg.2019.00151
In this paper, a Nonlinear Electrochemical Impedance Spectroscopy (NLEIS) method is presented that allows capturing the nonlinearity of current and overpotential of a lithium-ion battery individually in charge and discharge direction. A DC bias is applied to the battery to shift its operating point to the nonlinear region of current and overpotential. An alternating current of a low amplitude (AC) is simultaneously superimposed in order to investigate the system additionally in the time domain. NLEIS cell spectra and selected electrode-resolved NLEIS spectra are recorded as a function of state of charge and temperature. Furthermore, Distribution of Relaxation Times (DRT) plots obtained from EIS measurements provide information, which electrochemical processes correlate with the occurrence of nonlinear distortions of current and overpotential. Moreover, the occurrence of overpotentials and their degree of nonlinearity at cathode and anode as a function of the state of charge are determined by current pulse measurements.
Lithium-ion batteries in their entirety represent complex electrochemical systems. Their complexity is mainly reflected in the multitude of characteristically different electrochemical processes taking place within the battery. These processes are responsible for the occurrence of cell overpotentials leading to energy efficiency losses. In order to characterize these electrochemical processes, sophisticated analytical techniques are required. Electrochemical Impedance Spectroscopy (EIS) has proven to be a powerful tool for the characterization of complex electrochemical systems such as lithium-ion batteries (Aurbach, 2000; Atebamba et al., 2010; Illig et al., 2012; Cañas et al., 2013; Heins et al., 2017). The application of this technique allows the differentiation and quantification of major loss processes, making EIS a most powerful electroanalytical tool. Nevertheless, EIS possesses one major limitation: it is restricted to the application of sufficiently small excitations to obey the requirement of linearity between current and voltage. The application of larger input signals results in a distortion of the output signal, compromising the measurement. Moreover, within the EIS, only the mean impedance of charge and discharge direction, i.e., the impedance around the origin of the current-voltage ratio, is determined. Conventional EIS is therefore not capable:
(1) to reflect the nonlinear character of electrode kinetics.
(2) to determine the impedance in charge and discharge direction individually.
Therefore, in this work, an approach to Nonlinear Electrochemical Impedance Spectroscopy (NLEIS) will be presented to investigate the nonlinear current-voltage ratio of lithium-ion batteries in charge and discharge direction individually. Moreover, we examined overpotentials occurring at the cathode and anode in charge and discharge direction.
Whenever a current is being applied to an electrochemical system (e.g., lithium-ion batteries), its open cell voltage (OCV—the equilibrium voltage) is altered by the cell overpotential η. The magnitude of the overall overpotential is determined by several processes—the ohmic overpotential (caused by ionic conductivity of the electrolyte, electronic conductivity of the electroactive material, and the electronic conductivity of the current collector), the contact resistance (caused by the resistance between electroactive material and current collector) the charge transfer overpotential (caused by activation energy at the electrode surfaces) and the diffusion overpotential (caused by lithium ion diffusion especially near the electrode surfaces and the solid-state diffusion inside the active electrode material) (Vetter et al., 2005; Jossen, 2006).
Provided that the OCV of an electrochemical cell remains constant over an entire measurement period, the relation of current and voltage is exclusively determined by the magnitude of overpotential (η-characteristic). For low currents, the Iη-relation remains almost linear, whereas for moderate and higher currents it develops into a nonlinear behavior. The individual overpotentials depicted in Equation (1) have different impacts on nonlinear distortion. Thus, the ohmic and the contact overpotential cause linear Iη-characteristics. Charge transfer and diffusion transfer processes on the other hand result in nonlinear Iη-behavior (Bard and Faulkner, 2001). Figure 1 illustrates the major overpotentials responsible for the nonlinear distortion of current and overpotential within a lithium-ion battery for the example of the discharge direction. The cathodic charge transfer overpotential (ηct) involves the stripping of the solvation shell followed by the phase-transfer into the active electrode material (intercalation). The anodic intercalation process differs: lithium-ions first pass through the solid electrolyte interphase (SEI) and subsequently intercalate into the active material (Xu et al., 2010). For the sake of simplicity, however, we do not consider this difference in the following discussions.
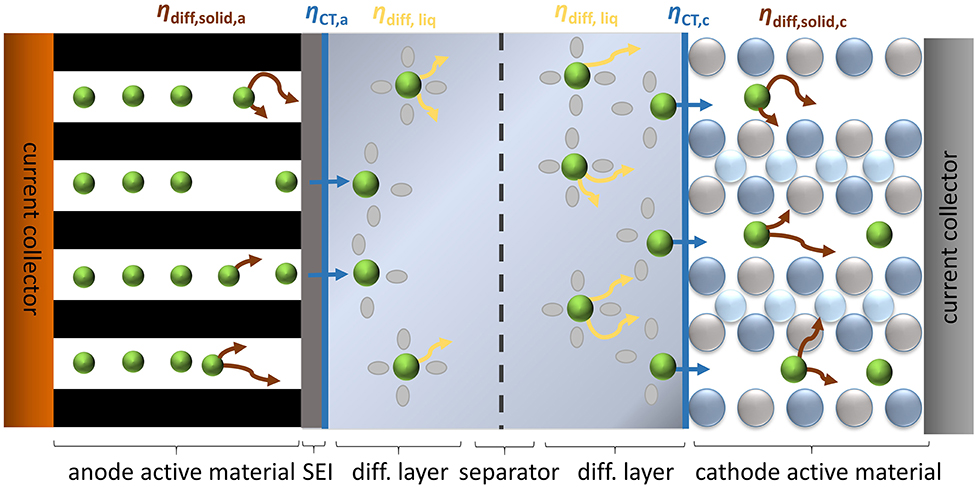
Figure 1. Schematic illustration of the major overpotentials in a lithium-ion battery causing nonlinear distortion of current and overpotential.
The charge transfer overpotential is one of the decisive parameters in electrochemical kinetics as it reflects the resistance to the electrode surface reaction. It is mathematically linked to the current density by Butler-Volmer Equation (Equation 2), providing that mass-transfer effects are not considered (Bard and Faulkner, 2001; Jossen, 2006).
Here, i and i0 represent current density and exchange current density, respectively. Since Butler-Volmer considers that electrode reactions (charge transfer) may be asymmetric, a transfer coefficient (α) describes the proportion of forward and backward reaction at the corresponding electrode (Bard and Faulkner, 2001).
Generally, diffusion processes take place as response to a concentration gradient. Therefore, they occur in the bulk solution particularly near the electrode surface due to the reaction of the electroactive species (ηdiff,liq) (Bard and Faulkner, 2001). After intercalating into the active material, the lithium ions diffuse toward free lattice sites in the cathode material (in case of charging the same process takes place at the anode). This represents the solid-state diffusion process (ηdiff,solid) (Jossen, 2006).
In this work, we focused on the investigation of electrochemical processes causing nonlinear distortion of current and overpotential such as charge transfer and diffusion processes (Figure 1). We present an approach to NLEIS where the operating point of the lithium-ion battery on the Iη-curve is shifted by a DC bias to the nonlinear region of current and overpotential. We are therefore able to consider the nonlinearity of charge and discharge direction individually. An alternating current of a small amplitude is simultaneously superimposed to investigate the system in the time domain.
In mathematical terms, nonlinear relation of current and overpotential means the absence of the strict validity of Ohm's law. This implies that results of conventional EIS, which requires the validity of Ohm's law, can be compared to results of nonlinear measurements only to a limited extent. In spectral analytics, nonlinearity appears in higher harmonics (Hx>1) of the output signal, representing integer multiples of the frequency of the input signal (H1). The general distortion of a signal can be expressed by Total Harmonic Distortion (THD) (Shmilovitz, 2005).
In this study, however, the occurrence of each higher harmonic is considered individually to investigate its characteristic response and therefore Equation (4) was utilized. Each higher harmonic is normalized to the fundamental frequency (H1). The result gives the magnitude of the corresponding higher harmonic (Hx).
The current pulse measurements were used to determine the characteristics between current and overpotential.
A current pulse of 1/5 C with a duration of 10 s is applied to the lithium-ion battery, followed by a relaxation step of 5 min. The procedure is subsequently repeated for a negative current pulse (Figure 2) in order to avoid time deviations of the system due to a change of the state of charge. The height of the current pulse is then increased to a certain value (see Experimental section). The current pulse duration was chosen according to the smallest time constant of the system (determined by EIS), to ensure that all electrochemical processes are captured.
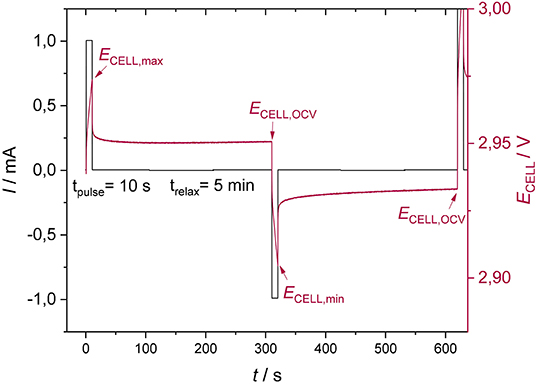
Figure 2. Measurement procedure for estimating current and overpotential relation of lithium-ion batteries.
After each current pulse pair, the value of the OCV was compared to the initial OCV. If this value deviated by more than 2%, the data were discarded to prevent results from being compromised due to a change of the system's state. To determine the overpotentials in charge and discharge direction, the following equations were used:
In order to estimate the degree of nonlinearity between current and overpotential, the dimensionless Pearson Correlation Coefficient (r) was utilized (Equation 7) (Ahlgren et al., 2003).
Where and ; r takes values between 1 and −1. At a value of 1 or−1, there is a complete positive or negative linear relationship between I and η. For r = 0, I, and η are uncorrelated.
To successfully investigate the nonlinearity of an electrochemical system, some fundamental approaches have already been proposed (Kiel et al., 2008; Mao et al., 2010; Harting et al., 2017; Murbach et al., 2018; Zabara et al., 2019). The main similarity between the underlying methods is that the operating point of the electrochemical system on the Iη-curve is shifted to the range of nonlinearity. In the current work, the operating point of the lithium-ion battery is shifted by applying a sufficiently high direct current (DC). For investigating the system in the time domain, an alternating current (AC) with a small amplitude is simultaneously superimposed. The distorted output signal contains not only the fundamental frequency but also its higher harmonics. By means of Fast Fourier Transform (FFT) its discrete frequency coefficients are isolated from the signal. The fourier coefficients are then normalized to the fundamental frequency and the result is used to estimate the magnitude of each higher harmonic. The NLEIS spectra are recorded with alternating current pulses—according to measurement procedure of the I-pulse measurements. First, a positive direct current is applied and an additional alternating current of a specific frequency is superimposed. Subsequently, the corresponding negative direct current with the alternating current of the same frequency is measured (Figure 3). The main advantage of this method is that we can determine nonlinearity in charge and discharge direction individually. Note, that we are windowing our digitized signal to prevent aliasing. Therefore, the higher harmonics will be suppressed to a certain extent due to this drift correction.
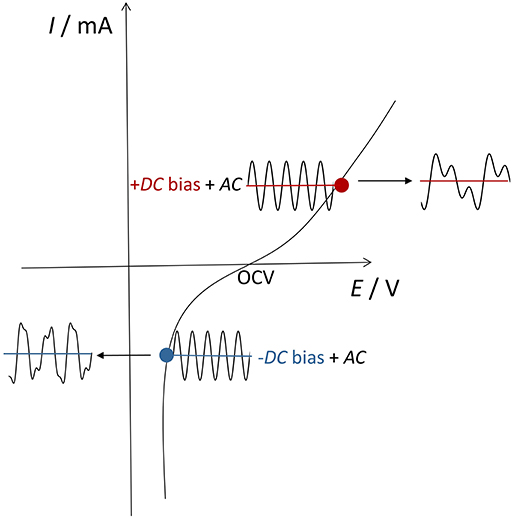
Figure 3. Overview of the NLEIS measurement.
Generally, the underlying approach (Figure 3) is widely used for investigating the harmonic characteristics of highly nonlinear electronic components such as diodes (Suematsu et al., 1982; Caverly and Hiller, 1987; Way, 1987). In terms of electrochemical systems there are several methods performing DC and AC experiments in a single measurement [e.g., Dynamic-EIS (Sacci et al., 2014; Zhang et al., 2014; Huang et al., 2015)] but without considering the system's nonlinearity. There are only a few publications, however, of DC/AC experiments that are used to specifically investigate nonlinearity of electrochemical systems (Xu and Riley, 2013). To the best of our knowledge, this measurement technique has not been applied to energy storage media such as lithium-ion batteries, yet. Since we apply a DC bias, occurring higher harmonics can be the result of a system's potential drift or capacitances. Therefore, we also performed an experiment with a supercapacitor that has a capacitance similar to our system (ca. 22 mF). If potential issues like voltage drift or capacitances generally cause the appearance of higher harmonics, they have to become visible in this experiment. Since we did not see significant higher harmonics (<0.1%) (see Supplementary Material), these issues can be exclude as source for higher harmonics in case of our measurement setup.
For a more detailed understanding of the measurement method and its development for lithium-ion batteries in general refer to the Supplementary Material.
EIS measurements were performed in order to correlate the tendency of overpotentials with data obtained from EIS. Additionally, EIS spectra were utilized to determine which electrochemical processes of the lithium-ion battery are attributed to the frequency range captured in the NLEIS measurements. Therefore, the time constants obtained using DRT (Saccoccio et al., 2014; Wan et al., 2015) are compared to the occurrence of higher harmonics from the NLEIS spectra.
In order to gain a deeper understanding of when nonlinearity in the studied lithium-ion batteries becomes relevant and whether the electrode reactions are asymmetric, we initially recorded Iη-curves by current-pulse measurements (I-Pulse). The Iη-curves were recorded up to a current pulse of 34 mA (~7 C). This current limit was chosen in order to avoid irreversible degradation of electrochemical functionality by reaching certain potentials. We therefore chose in this case a cell voltage of 3.3 V to ensure that e.g., the anode's potential does not drop below 0 V preventing metallic lithium deposition on the anode surface even at high current densities (Bugga and Smart, 2010).
In the following figures, all data referring to the charge direction are shown in red and the results of the discharge direction are represented in blue.
The Iη-curves for anode and cathode indicate asymmetric kinetics of the electrode reactions with respect to charge and discharge direction, with the asymmetry being considerably more pronounced at the cathode (Figure 4). The cathode's Iη-curve in discharge direction indicates much higher overpotentials than in charge direction. It is therefore necessary to consider the positive and negative current range individually to obtain differentiated information about the kinetics of the electrode reactions in charge and discharge direction.
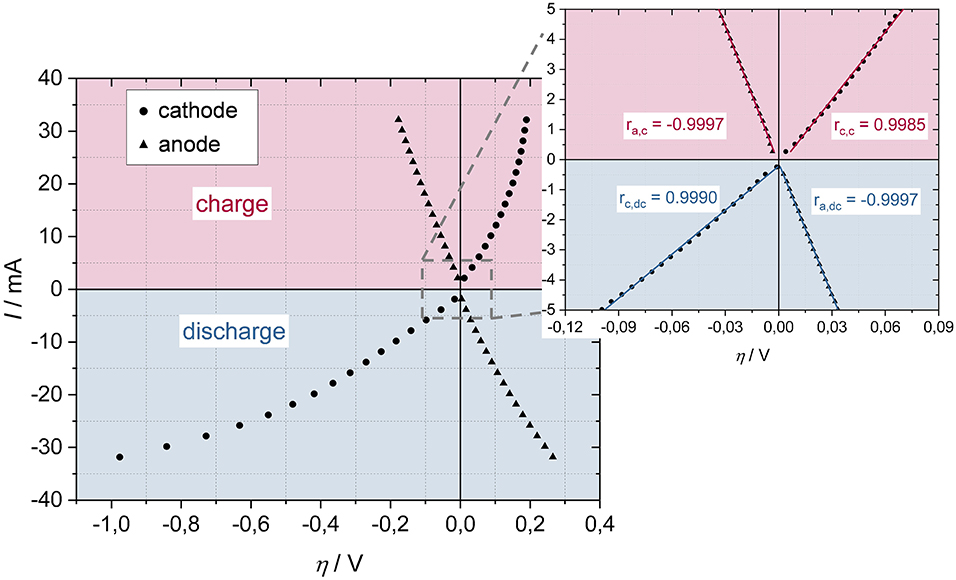
Figure 4. Iη- characteristic of the investigated lithium-ion battery (ΔI = 2 mA) (Left) with the corresponding correlation coefficients for a DC bias of max. 5 mA (ΔI = 0.5 mA) (Right) of anode (ra) and cathode (rc) in charge (red) and discharge (blue) direction at a cell voltage of 3.3 V recorded at 20°C.
Obviously, it is not possible to apply such a high DC bias, 34 mA, to record NLEIS, because the change of the cell properties due to a shift in the state of charge (over time) would be significant. In order to avoid large time deviations of the system, therefore, an operating point on the Iη-curve was selected, which already points to nonlinearity between current and overpotential, for which, however the lowest possible current is required. The magnified figure to the right (Figure 4) shows the range selected to measure NLEIS with corresponding r. Accordingly, the following NLEIS spectra were recorded with 5 mA DC (ca. 1 C) and 2 mA AC. Previous to this study we analyzed different DC bias (2, 5, 7, and 9 mA) to investigate how the DC bias affects the higher harmonics. We found out that the values of the higher harmonics increase with increasing DC bias, but the course of the harmonic values remains the same (same in quality). At a value of 9 mA the harmonics decrease, probably due to a significant change in the cell voltage. Therefore, we chose a DC bias of 5 mA, since the higher harmonic values' signal to noise ratio is satisfactory and the change in the cell voltage is less. Further, we chose 2 mA AC since the impedance spectra are performed with that amplitude. We therefore ensure, that our lithium-ion battery system does not become nonlinear due of the AC signal, but only because of the applied DC bias. Additionally, the signal to noise ratio is satisfactory for this amplitude.
All following current pulse measurements were evaluated at a DC bias of 5 mA, according to the DC bias of recorded NLEIS spectra.
The overpotentials of the cathode are strongly dependent on the state of charge of the lithium-ion battery and generally increase with decreasing cell voltage (Figure 5). According to literature, this can be explained by an increase of the charge transfer resistance (Wu et al., 2005). In addition, inhibited solid-state lithium ion diffusion within NMC (LiNi1/3Co1/3Mn1/3O2) is responsible for higher overpotentials at lower state of charges. This phenomenon is due to a contraction of a certain crystal plane within NMC at high lithiation degrees (Wiemers-Meyer et al., 2016). Further lithium intercalation requires large negative potentials, which leads to significant overpotentials in discharge direction (Latz and Zausch, 2013). Oppositely, during charging (decrease of lithiation degree), the solid-state lithium-ion diffusion becomes facilitated due to an expansion of the crystal plane. The lithium-ion mobility becomes thereby largest at 50% state of charge (Wiemers-Meyer et al., 2016). Moreover, the electronic conductivity of NMC increases with delithiation, which is attributed to the presence of mixed Ni3+/Ni4+ valence states, therefore contributing to a reduction of overpotentials with increasing state of charge (Amin and Chiang, 2016). At lower state of charges (at 3.3 V and below) the overpotentials are much higher for the discharge direction than for the charge direction. This effect is significantly enhanced at higher current values (Figure 4). Moreover, the nonlinear relation between current and overpotential (Figure 5, right) increases especially at the cathode with decreasing state of charge which corresponds to the tendency of overpotentials (Figure 5, left). The anode's overpotentials, in contrast, are only slightly affected by the state of charge of the lithium-ion battery. The values of its overpotentials are about half the cathode's overall overpotential. The anode is therefore significantly less kinetically inhibited. The slightly increasing overpotential in lower state of charge range might be due to an increase of the charge transfer resistance and the lower electronic conductivity of delithiated graphite (Umeda et al., 2001; Park et al., 2010; Gordon et al., 2017). In contrast to the cathode, the lithium solid-state diffusion within the graphite makes only a small contribution to the overpotentials, since the diffusion coefficient only weakly depends on the state of charge and is generally slightly larger than the diffusion coefficient of lithium within NMC (Yu et al., 1999; Wu et al., 2012). At a cell voltage of 3.7 V and above the overall overpotentials for anode and cathode become insignificantly small in both charge and discharge direction. In order to exemplarily correlate the tendency of overpotentials with EIS data, electrode-resolved EIS spectra in dependence of the state of charge are depicted in the Supplementary Material. In this work we primarily focus on the qualitatively correlation.
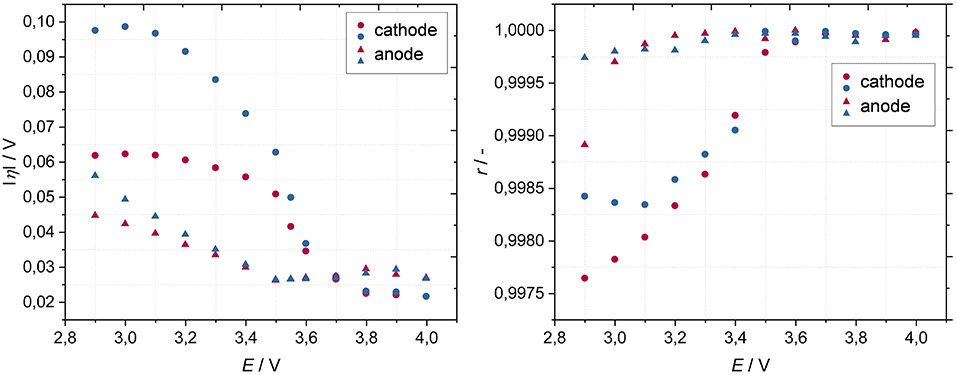
Figure 5. Overpotentials based on a DC bias of 5 mA (Left) and corresponding correlation coefficients based on a DC bias range of 1–5 mA (ΔI = 1 mA) (Right) of cathode and anode in charge (red) and discharge (blue) direction as a function of cell voltage at a temperature of 20°C.
Initially, we investigated the nonlinearity for a cell voltage of 3.3 V to determine, which higher harmonics of relevant magnitude generally occur.
Figure 6 indicates that the magnitude of harmonics decreases from the 2nd harmonic to higher harmonic orders and is generally higher in charge direction. The 2nd harmonic clearly appears in the middle and lower frequency range, whereas the 3rd harmonic is only slightly visible in the low frequency range of the discharge direction. In contrast, the 4th harmonic does not exhibit any relevant values. Based on this result, in further investigations only the 2nd and 3rd harmonics are considered. The random noises of the 2nd and 3rd harmonic are quantified by an ohmic resistance of 10 Ω.
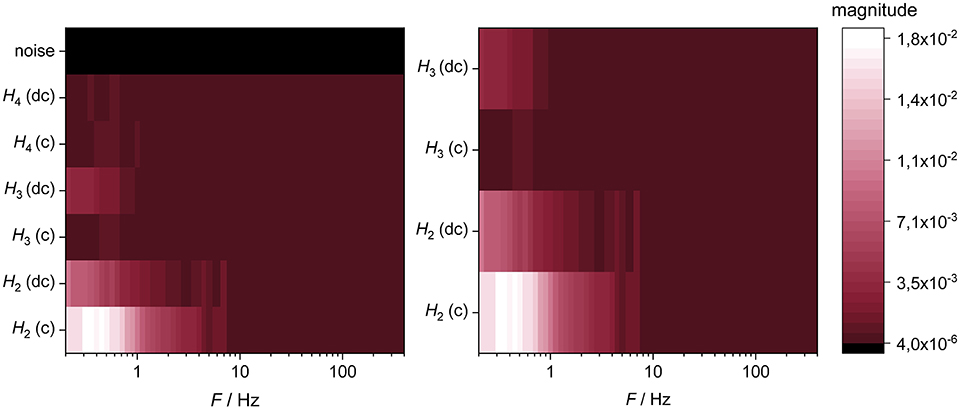
Figure 6. Visualization of the frequency dependent occurrence of the higher harmonics (H2–H4) in charge (c) and discharge direction (dc) and the corresponding random noise of the measurement setup at a cell voltage of 3.3 V. The figure to the right shows a magnification of the left one. The experiment was performed at a temperature of 20°C.
NLEIS cell spectra were recorded at four different cell voltages: 2.9, 3.3, 3.7, and 4.0 V (Figure 7).
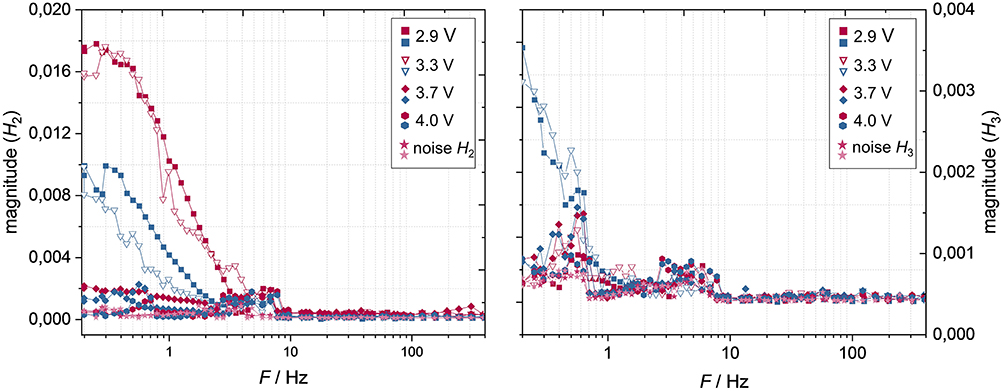
Figure 7. NLEIS cell spectra of the 2nd harmonic (Left) and 3rd harmonic (Right) for charge (red) and discharge (blue) direction as a function of cell voltage and at a temperature of 20°C with the corresponding random noises.
In general, the 2nd harmonic is negligible at a cell voltage of 3.7 V and above, but increases with decreasing voltage (Figure 7). This correlates with the described tendency of the overpotentials' charge-dependencies. At lower cell voltages, the 2nd harmonic occurs at frequencies below ~4 Hz and increases in its magnitude with decreasing frequency. Furthermore, the 2nd harmonic is significantly more pronounced in charge direction than in discharge direction, which agrees with the correlation coefficients (Figure 5, right), but is contrary to the overpotentials being higher in discharge direction. Interestingly, the magnitude of 2nd harmonic does not change significantly between 2.9 and 3.3 V, especially in charge direction. The 3rd harmonic occurs only in discharge direction at lower cell voltages from a frequency of 0.7 Hz (Figure 7) in relevant orders of magnitude.
To gain a deeper understanding which electrode—cathode or anode—causes the main nonlinearity, electrode-resolved NLEIS spectra at a cell voltage of 3.3 V were recorded (Figure 8, top). Therefore, the excitation signal was applied to the cell and the signals of anode and cathode were recorded individually using an integrated reference electrode. In addition, an electrode-resolved DRT plot (Figure 8, bottom) is shown to compare which processes take place in the corresponding frequency range according to EIS at this cell voltage. The corresponding impedance spectra are found in the Supplementary Material.
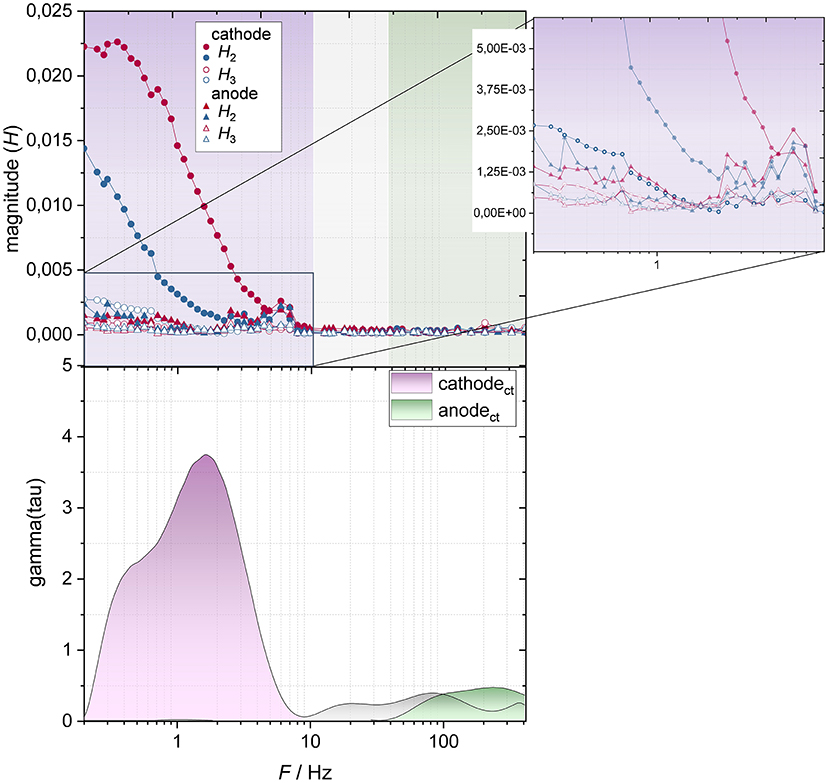
Figure 8. Electrode-resolved NLEIS spectra (Top) for charge (red) and discharge (blue) direction and electrode-resolved DRT plot (Bottom) of the lithium-ion battery at a cell voltage of 3.3 V at a temperature of 20°C.
According to the upper part of Figure 8, nonlinearity occurs especially at the cathode at frequencies below 4 Hz, with the nonlinearity in charge direction being much more pronounced than in discharge direction. According to the DRT-plot (Figure 8, bottom), the frequency range below 8 Hz is associated with the charge transfer resistance of the cathode and agrees with the appearance of the 2nd harmonic at the cathode. The 2nd harmonic of the anode is negligible over the entire frequency range, which is possibly a result of the charge transfer resistance being very low. We can therefore assume that the appearance of the 2nd harmonic correlates with the presence of a kinetic reaction inhibition. The magnification exhibits that even the magnitude of 3rd harmonic of the cathode (at a frequency below 0.7 Hz) is greater than the 2nd harmonic of the anode.
Interestingly, the cathode's higher overpotentials in discharge direction (Figure 5, left) are not reflected by NLEIS in form of the 2nd harmonic (higher in charge direction) (Figure 8). Therefore, the higher overpotentials in discharge direction may be expressed in form of the 3rd harmonic. Possibly, the inhibited solid-state lithium-ion diffusion within NMC due to the high degree of lithiation causes the occurrence of the 3rd harmonic. The fact that the 3rd harmonic becomes only visible at lower state of charges in the lower frequency range supports the assumption. Moreover, the occurrence of the 3rd harmonic in response to diffusion processes has already been suggested in literature (Wolff et al., 2018, 2019).
The following temperature dependent Iη-characteristics are based on a DC bias of 5 mA. In this case a constant cell voltage of 3.7 V was chosen (instead of 3.3 V depicted in Figure 6). Since the nonlinearities at cell voltages of 3.7 V and at a temperature of 20°C are negligible (Figures 5, 7), we can be sure that the occurrence of higher harmonics at 3.7 V (T <20°C) is exclusively due to a slower kinetic as a result of temperature reduction.
As expected, the overpotentials of both, cathode and anode, are strongly dependent on temperature and increase with decreasing temperature (Figure 9, left), with the overpotentials being higher in discharge direction. With decreasing temperature, the asymmetry of overpotentials of charge and discharge direction becomes more pronounced, especially at the cathode. The tendency of the correlation coefficients coincides with the tendency of the overpotentials and exhibit a predominantly higher degree of nonlinearity at the cathode in charge direction. In order to correlate the tendency of overpotentials with data obtained from EIS, electrode-resolved EIS spectra in dependence of the temperature are found in the Supplementary Material.
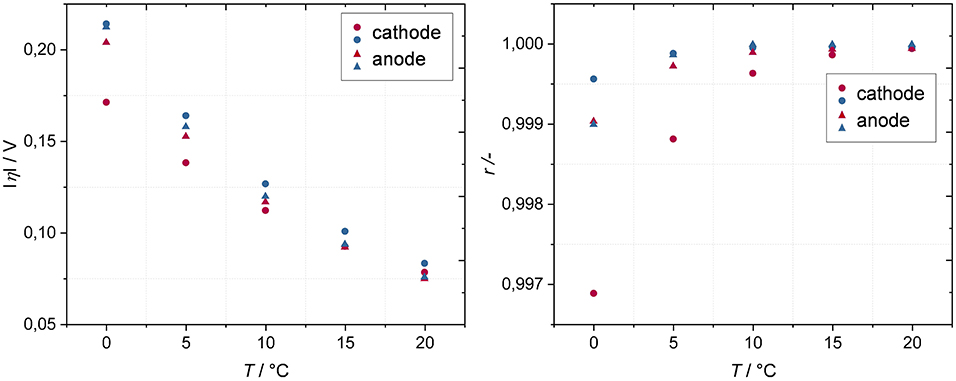
Figure 9. Overpotentials based on a DC bias of 5 mA (Left) and corresponding correlation coefficients based on a DC bias range of 1–5 mA (ΔI = 1 mA) (Right) of cathode and anode in charge (red) and discharge (blue) direction as a function of temperature at a cell voltage of 3.7°V.
Initially, we recorded a NLEIS cell spectrum at 0°C (and at a cell voltage of 3.7 V), to investigate, which harmonics occur at lowered temperature.
At a cell voltage of 3.7 V and a temperature of 0°C only the 2nd harmonic appears. The 3rd and 4th harmonic are negligible in charge and discharge direction.
In the following measurements, the occurrence of nonlinearities as a function of temperature will be investigated. For this purpose, NLEIS spectra are recorded at a cell voltage of 3.7 V in the temperature range from 0 to 20°C. Although the 3rd harmonic exhibits no relevant values in Figure 10, it is further considered for the sake of completeness. The random noises of the 2nd and 3rd harmonic are quantified by an ohmic resistance of 10 Ω.
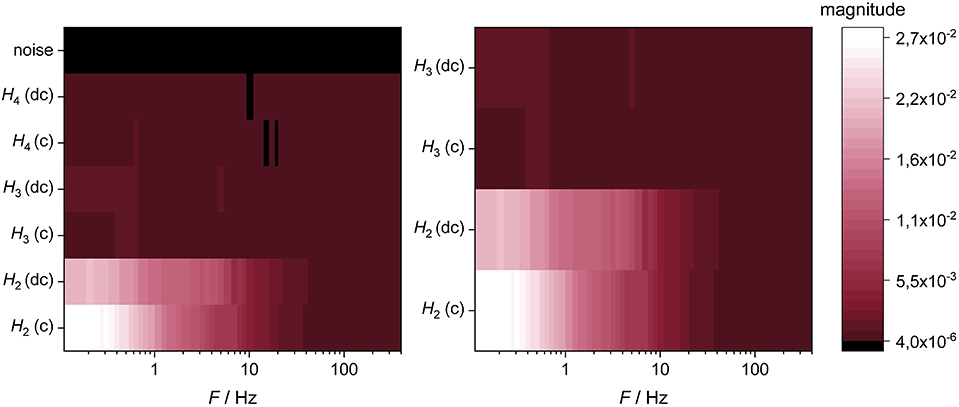
Figure 10. Higher harmonics (H2–H4) in charge (c) and discharge direction (dc) and the corresponding random noise of the measurement setup at a cell voltage of 3.7 V at a temperature of 0°C (Left) and the corresponding magnification (Right).
The magnitude of the 2nd harmonic decreases with increasing temperature (Figure 11, left), and at a temperature of 15°C and above the 2nd harmonic becomes insignificant. The 2nd harmonic appears at frequencies below ~10 Hz and increases with decreasing frequency until it reaches a plateau at ~0.4 Hz. Down to 6 Hz, the 2nd harmonic is very similar for charge and discharge direction, whereas in the frequency range of 6–2 Hz the discharge direction becomes predominant. This tendency inverts below 2 Hz, where the 2nd harmonic in charge direction becomes significantly larger than in discharge direction.
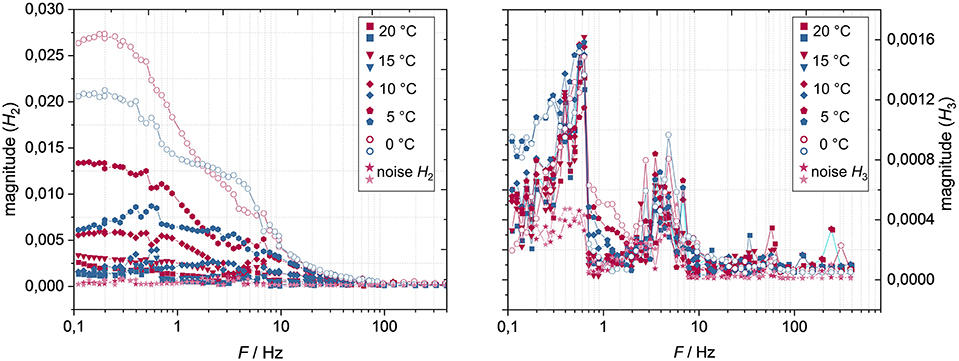
Figure 11. NLEIS cell spectra of the 2nd harmonic (Left) and 3rd harmonic (Right) for charge (red) and discharge (blue) direction with the corresponding noises as a function temperature of and at a cell voltage of 3.7 V.
At a frequency of 0.9 Hz the 3rd harmonic increases but, however, decreases further at a temperature of 10°C and above (Figure 11, right). At a temperature of 5°C and below only a slight increase of the 3rd harmonic can be seen in the lower frequency range. Interestingly, although the magnitude of the 2nd harmonic at 0°C (and a cell voltage of 3.7 V) is greater than the 2nd harmonic at a cell voltage of 2.9°V and a temperature of 20°C (Figure 7), the 3rd harmonic does not significantly arise here (Figures 10, 11, right). However, since the magnitudes of the 3rd harmonic are so small, further interpretation of these is initially omitted.
An electrode-resolved NLEIS spectrum (Figure 12, top) with a corresponding DRT plot (Figure 12, bottom) of the lithium ion-battery at 3.7 V and 0°C are further shown. The according impedance spectra are found in the supporting information.
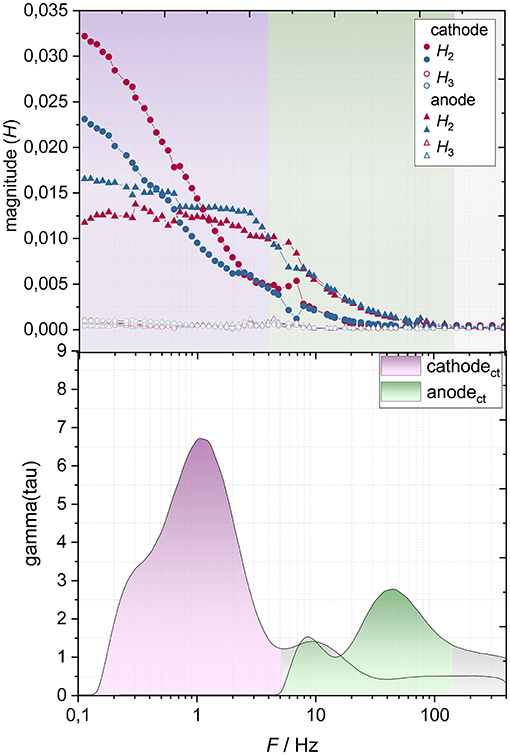
Figure 12. Electrode-resolved NLEIS spectra (Top) for charge (red) and discharge (blue) direction and electrode-resolved DRT plot (Bottom) of the lithium-ion battery at a cell voltage of 3.7 V at a temperature of 0°C.
The 2nd harmonic of the anode arises at frequencies below ca. 60 Hz, whereas the cathode's 2nd harmonic appears not before a frequency of 20 Hz. The frequency range of the anode's 2nd harmonic coincides with its charge transfer resistance (Figure 12, bottom). The DRT plot further exhibits that the anodic charge transfer resistance increases relative to the cathodic charge transfer resistance compared to the bottom of Figure 8. It can therefore be assumed that, due to the higher charge transfer resistance, in this case a 2nd harmonic arises at the anode.
Lowering the frequency from 20 Hz down to 4 Hz leads to an increase of the 2nd harmonic, after which it reaches a plateau. Before reaching the plateau, the 2nd harmonic of the anode is generally higher than that of the cathode, which is probably due to the lower time constant of the anode's charge transfer resistance. This tendency inverts at a frequency of ca. 1 Hz, where the 2nd harmonic of the anode remains constant and the cathode's 2nd harmonic increases further. The occurrence of the 2nd harmonic matches, as in the case of the anode, with the time constant of its charge transfer resistance (Figure 12, bottom). Furthermore, the charge direction at the cathode depicts much higher nonlinearities than the discharge direction. Since the 2nd harmonics of the anode of charge and discharge direction are very close to each other, no clear directional dependence (charge or discharge) can be found. This result indicates that the kinetics of the anodic electrode reaction is more symmetrical than the electrode reaction at the cathode regarding charge and discharge direction. The 3rd harmonics' magnitude is compared to the 2nd harmonics' magnitude negligible for both electrodes.
The change of the 2nd harmonic in the NLEIS cells spectra (Figure 11, left) with respect to charge and discharge direction can be explained with the change of the 2nd harmonics' magnitude between anode and cathode. Additionally, the plateau in the lower frequency range of cell spectra can be attributed to the anode's contribution. We can therefore assume that the NLEIS cell spectra represent the sum of the anodic and cathodic nonlinear contributions (in this case the 2nd harmonic).
When comparing the two electrode-resolved spectra (Figures 8, 12), it is noticeable that the 2nd harmonic, particularly at the anode, has significantly different courses depending on cell voltage or temperature. While the anode exhibits virtually no nonlinearities at a lower state of charge (3.3 V) (Figure 8), its contribution to nonlinearity at lowered temperature (0°C) is comparable to the contribution of the cathode (Figure 12). This observation leads us to the assumption that the overpotentials contributing to nonlinearity at varying cell voltages are either qualitatively different from the overpotentials that occur with temperature changes, or the same overpotential causes significantly different distortion of overpotential and current depending on state of charge or temperature changes. On the basis of the experiments carried out, we assume that the 2nd harmonic reflects the kinetic of the charge transfer reaction. Therefore, the same overpotential (charge transfer) shows different expressions in dependence of temperature changes and changes in state of charge. The fact that the 2nd harmonic exhibits a high temperature dependence and a rather low dependence on the state of charge may support the assumption (André et al., 2011; Farmann et al., 2016).
In this work, in addition to the investigation of nonlinear distortion of current and overpotential using a new approach to NLEIS, we also examined the state of charge and temperature dependent anodic and cathodic current-overpotential characteristics of a lithium-ion battery. For the first time, this NLEIS method allows to individually address nonlinearity in charge and discharge direction of lithium-ion batteries.
We show that the reaction kinetics at cathode and anode, according to Butler-Volmer, are asymmetric, with the cathodic asymmetry being much more pronounced than the anodic.
The overpotentials of the cathode depend significantly on the state of charge, whereas the respective overpotentials of the anode only show a slight dependence. In the NLEIS cell spectra, the nonlinearity (2nd harmonic) increases with decreasing SOC, which correlates with the tendency of overpotentials. The electrode-resolved spectra at a cell voltage of 3.3 V clearly show nonlinear distortion (2nd harmonic) at the cathode in the medium and low frequency range, whereas the nonlinear distortion at the anode is negligible.
Moreover, the 3rd harmonic only occurs significantly at lower state of charges (at 3.3 V and below) in the lower frequency range throughout the investigations (Figure 7, right). The electrode-resolved spectra (Figure 8) exhibits that the 3rd harmonic only occurs at 3.3 V at the cathode in discharge direction. Therefore, probably, the 3rd harmonic appears due to the inhibited solid-state lithium-ion diffusion within NMC (Amin and Chiang, 2016; Wiemers-Meyer et al., 2016). That the 3rd harmonic occurs as a response to diffusion processes in electrochemical systems has already been suggested in literature (Wolff et al., 2018, 2019).
When cell temperature is changed and the state of charge remains constant, the overpotentials at both electrodes increase in a similar manner with decreasing temperature. The results of NLEIS spectra compared to current-overpotential characteristics show that the occurrence of the 2nd harmonic correlates with the presence of significant overpotentials. Furthermore, the 2nd harmonic's frequency range matches with the frequency range of the charge transfer resistance for both electrodes at lowered temperature (0°C), respectively. The occurrence of 2nd harmonic may therefore be attributed to the kinetic inhibition of the charge transfer process.
One the basis of experimental data of this work and existing results from literature, in this work suggestions on the cause of 2nd and 3rd harmonic within a lithium-ion battery were made. However, further experiments have to be carried out in order to be able to make educated proposals. One approach would be to investigate other cell systems by varying the electrode materials.
The investigated system is a lithium-ion battery in a three-electrode setup (EL-Cell, Germany), of which the anode and cathode represent round die-cuts (diameter = 18 mm, electrode surface ~2.55 cm2). A metallic lithium reference ring is implemented in the separator. The corresponding electrode components are listed in the Tables 1–3.
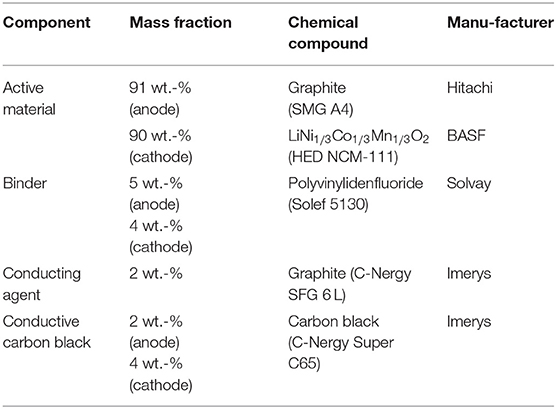
Table 1. Electrode composition of the investigated lithium-ion battery.
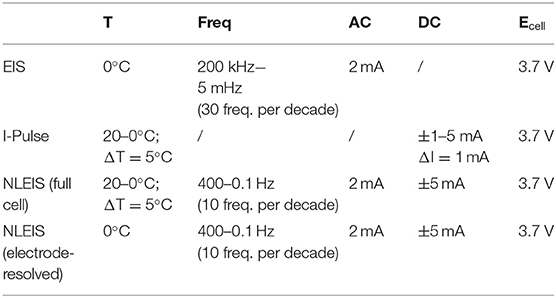
Table 2. Experimental parameters for EIS spectra, I-Pulse measurements, and NLEIS spectra as a function of temperature.
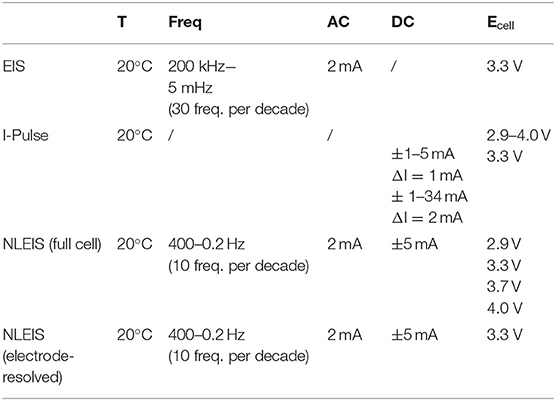
Table 3. Experimental parameters for EIS spectra, I-Pulse measurements, and NLEIS spectra as a function of state of charge.
All data in this manuscript are based on a minimum of four cell replicates.
EIS and I-Pulse measurements were performed with a VMP3-Potentiostat (Biologic, France). The NLEIS was carried out by means of a VMP3 Potentiostat (BioLogic, France) which was solely used to generate the analog input signal (DC+AC). A DAQ-device (NI 9251, National Instruments, Germany) was connected to the E-Monitor of the VMP3-Potentiostat to record the analog output signal of the lithium-ion battery. This setup was chosen, since we required the raw data of the output signal and not the processed one. All temperature measurements (in the range between 0 to 20°C) were carried out in a climate chamber (MK58, Binder, Germany). EIS and I-Pulse measurements were recorded in three-electrode setup. The NLEIS spectra were recorded in a complete cell arrangement and a three-electrode setup was used for selected measurement parameters only, as the electron—resolved spectra in this setup are still laborious at this time.
All datasets generated for this study are included in the article/Supplementary Material.
All authors listed have made a substantial, direct and intellectual contribution to the work, and approved it for publication.
The authors declare that the research was conducted in the absence of any commercial or financial relationships that could be construed as a potential conflict of interest.
The authors would like to thank the Battery Lab Factory for providing the electrode materials and Bogdan Petrescu from BioLogic for the very helpful technical support. We acknowledge support by the German Research Foundation and the Open Access Publication Funds of the Technische Universität Braunschweig.
The Supplementary Material for this article can be found online at: https://www.frontiersin.org/articles/10.3389/fenrg.2019.00151/full#supplementary-material
Ahlgren, P., Jarneving, B., and Rousseau, R. (2003). Requirements for a cocitation similarity measure, with special reference to Pearson's correlation coefficient. J. Am. Soc. Inf. Sci. Technol. 54, 550–560. doi: 10.1002/asi.10242
Amin, R., and Chiang, M. (2016). Characterization of electronic and ionic transport in Li1-xNi0.33Mn0.33Co0.33O2 (NMC333) and Li1-xNi0.50Mn0.20Co0.30O2 (NMC523) as a function of Li CONTENT. J. Electrochem. Soc. 163, A1512–A1517. doi: 10.1149/2.0131608jes
André, D., Meiler, M., Steiner, K., Wimmer, C. H., Soczka-Guth, T., and Sauer, D. U. (2011). Characterization of high-power lithium-ion batteries by electrochemical impedance spectroscopy. I. Experimental investigation. J. Power Sources 196, 5334–5341. doi: 10.1016/j.jpowsour.2010.12.102
Atebamba, J. M., Moskon, J., Pejovnik, S., and Gaberscek, M. (2010). On the interpretation of measured impedance spectra of insertion cathodes for lithium-ion batteries. J. Electrochem. Soc. 157:A1218. doi: 10.1149/1.3489353
Aurbach, D. (2000). Review of selected electrode-solution interactions which determine the performance of Li and Li ion batteries. J. Power Sources 89, 206–218. doi: 10.1016/S0378-7753(00)00431-6
Bugga, R. V., and Smart, M. C. (2010). Lithium plating behavior in lithium-ion cells. ECS Trans. 25, 241–252. doi: 10.1149/1.3393860
Cañas, N. A., Hirose, K., Wagner, N., and Friedrich, K. A. (2013). Investigations of lithium-sulfur batteries using electrochemical impedance spectroscopy. Electrochim. Acta 97, 42–51. doi: 10.1016/j.electacta.2013.02.101
Caverly, R. H., and Hiller, G. (1987). Distortion in P-I-N diode control circuits. IEEE Trans. Microw. Theory Tech. 35, 492–501. doi: 10.1109/TMTT.1987.1133689
Farmann, A., Waag, W., and Sauer, D. U. (2016). Application-specific electrical characterization of high power batteries with lithium titanate anodes for electric vehicles. Energy 112, 294–306. doi: 10.1016/j.energy.2016.06.088
Gordon, I. A. J., Grugeon, S., Takenouti, H., Tribollet, B., Armand, M., Davoisne, C., et al. (2017). Electrochemical impedance spectroscopy response study of a commercial graphite-based negative electrode for Li-ion batteries as function of the cell state of charge and ageing. Electrochim. Acta 223, 63–73. doi: 10.1016/j.electacta.2016.12.013
Harting, N., Wolff, N., Röder, F., and Krewer, U. (2017). Nonlinear frequency response analysis (NFRA) of lithium-ion batteries. Electrochim. Acta 248, 133–139. doi: 10.1016/j.electacta.2017.04.037
Heins, T. P., Schlüter, N., and Schröder, U. (2017). Electrode-resolved monitoring of the ageing of large-scale lithium-ion cells by using electrochemical impedance spectroscopy. Chem. Electro. Chem. 4, 2921–2927. doi: 10.1002/celc.201700686
Huang, J., Li, Z., and Zhang, J. (2015). Dynamic electrochemical impedance spectroscopy reconstructed from continuous impedance measurement of single frequency during charging/discharging. J. Power Sources 273, 1098–1102. doi: 10.1016/j.jpowsour.2014.07.067
Illig, J., Inder, M., Chrobak, T., Schmidt, J. P., Klotz, D., and Ivers-Tiffee, E. (2012). Separation of charge transfer and contact resistance in LiFePO4-cathodes by impedance modeling. J. Electrochem. Soc. 159, A952–A960. doi: 10.1149/2.030207jes
Jossen, A. (2006). Fundamentals of battery dynamics. J. Power Sources 154, 530–538. doi: 10.1016/j.jpowsour.2005.10.041
Kiel, M., Bohlen, O., and Sauer, D. U. (2008). Harmonic analysis for identification of nonlinearities in impedance spectroscopy. Electrochim. Acta 53, 7367–7374. doi: 10.1016/j.electacta.2008.01.089
Latz, A., and Zausch, J. (2013). Thermodynamic derivation of a Butler-Volmer model for intercalation in Li-ion batteries. Electrochim. Acta 110, 358–362. doi: 10.1016/j.electacta.2013.06.043
Mao, Q., Krewer, U., and Hanke-Rauschenbach, R. (2010). Total harmonic distortion analysis for direct methanol fuel cell anode. Electrochem. Commun. 12, 1517–1519. doi: 10.1016/j.elecom.2010.08.022
Murbach, M. D., Hu, V. W., and Schwartz, D. T. (2018). Nonlinear electrochemical impedance spectroscopy of lithium-ion batteries: experimental approach, analysis, and initial findings. J. Electrochem. Soc. 165, A2758–A2765. doi: 10.1149/2.0711811jes
Park, M., Zhang, X., Chung, M., Less, G. B., and Sastry, A. M. A. (2010). Review of conduction phenomena in Li-ion batteries. J. Power Sources 195, 7904–7929. doi: 10.1016/j.jpowsour.2010.06.060
Sacci, R. L., Seland, F., and Harrington, D. A. (2014). Dynamic electrochemical impedance spectroscopy, for electrocatalytic reactions. Electrochim. Acta 131, 13–19. doi: 10.1016/j.electacta.2014.02.120
Saccoccio, M., Wan, T. H., Chen, C., and Ciucci, F. (2014). Optimal regularization in distribution of relaxation times applied to electrochemical impedance spectroscopy: ridge and lasso regression methods - a theoretical and experimental study. Electrochim. Acta 147, 470–482. doi: 10.1016/j.electacta.2014.09.058
Shmilovitz, D. (2005). On the definition of total harmonic distortion and its effect on measurement interpretation. IEEE Trans. Power Deliv. 20, 526–528. doi: 10.1109/TPWRD.2004.839744
Suematsu, Y., Hong, T., Chung, S., and Kang, M. (1982). Harmonic characteristics of laser diodes. J. Opt. Commun. 3, 42–48. doi: 10.1515/JOC.1982.3.2.42
Umeda, M., Dokko, K., Fujita, Y., Mohamedi, M., Uchida, S., and Selman, J. R. (2001). Electrochemical impedance study of Li-ion insertion into mesocarbon microbead single particle electrode: part I. Graphitized carbon. Electrochim. Acta 47, 885–890. doi: 10.1016/S0013-4686(01)00799-X
Vetter, J., Novák, P., Wagner, M. R., Veit, C., Möller, K. C., Besenhard, J. O., et al. (2005). Ageing mechanisms in lithium-ion batteries. J. Power Sources 147, 269–281. doi: 10.1016/j.jpowsour.2005.01.006
Wan, T. H., Saccoccio, M., Chen, C., and Ciucci, F. (2015). Influence of the discretization methods on the distribution of relaxation times deconvolution: implementing radial basis functions with DRTtools. Electrochim. Acta 184, 483–499. doi: 10.1016/j.electacta.2015.09.097
Way, W. I. (1987). Large signal nonlinear distortion prediction for a single-mode laser diode under microwave intensity modulation. J. Light. Technol. 5, 305–315. doi: 10.1109/JLT.1987.1075517
Wiemers-Meyer, S., Kasnatscheew, J., Rodehorst, U., Streipert, B., Jakelski, R., Wagner, R., et al. (2016). Learning from overpotentials in lithium ion batteries: a case study on the LiNi 1/3 Co 1/3 Mn 1/3 O 2 (NCM) cathode. J. Electrochem. Soc. 163, A2943–A2950. doi: 10.1149/2.0461614jes
Wolff, N., Harting, N., Heinrich, M., Röder, F., and Krewer, U. (2018). Nonlinear frequency response analysis on lithium-ion batteries: a model-based assessment. Electrochim. Acta 260, 614–622. doi: 10.1016/j.electacta.2017.12.097
Wolff, N., Harting, N., Röder, F., Heinrich, M., and Krewer, U. (2019). Understanding nonlinearity in electrochemical systems. Eur. Phys. J. Spec. Top. 227, 2617–2640. doi: 10.1140/epjst/e2019-800135-2
Wu, M. S., Chiang, P. C. J., and Lin, J. C. (2005). Electrochemical investigations on advanced lithium-ion batteries by three-electrode measurements. J. Electrochem. Soc. 152:A47. doi: 10.1149/1.1825385
Wu, S. L., Zhang, W., Song, X., Shukla, A. K., Liu, G., Battaglia, V., et al. (2012). High rate capability of Li(Ni1/3 Mn1/3 Co1/3)O2 electrode for Li-ion batteries. J. Electrochem. Soc. 159, A438–A444. doi: 10.1149/2.062204jes
Xu, K., Von Cresce, A., and Lee, U. (2010). Differentiating contributions to “ion transfer” barrier from interphasial resistance and Li+ desolvation at electrolyte/graphite interface. Langmuir 26, 11538–11543. doi: 10.1021/la1009994
Xu, N., and Riley, D. J. (2013). Nonlinear analysis of a classical system: the faradaic process. Electrochim. Acta 94, 206–213. doi: 10.1016/j.electacta.2013.01.141
Yu, P., Popov, B., Ritter, J., and White, R. (1999). Determination of the lithium ion diffusion coefficient in graphite. J. Electrochem. Soc. 146, 8–14. doi: 10.1149/1.1391556
Zabara, M. A., Uzundal, C. B., and Ulgut, B. (2019). Linear and nonlinear electrochemical impedance spectroscopy studies of Li/SOCl2 batteries. J. Electrochem. Soc. 166, A811–A820. doi: 10.1149/2.1231904jes
Keywords: lithium-ion battery, nonlinear electrochemical impedance spectroscopy, overpotential, current-overpotential characteristic, harmonic distortion
Citation: Ernst S, Heins TP, Schlüter N and Schröder U (2019) Capturing the Current-Overpotential Nonlinearity of Lithium-Ion Batteries by Nonlinear Electrochemical Impedance Spectroscopy (NLEIS) in Charge and Discharge Direction. Front. Energy Res. 7:151. doi: 10.3389/fenrg.2019.00151
Received: 03 June 2019; Accepted: 06 December 2019;
Published: 20 December 2019.
Edited by:
Jun Yan, Harbin Engineering University, ChinaReviewed by:
Shichun Mu, Wuhan University of Technology, ChinaCopyright © 2019 Ernst, Heins, Schlüter and Schröder. This is an open-access article distributed under the terms of the Creative Commons Attribution License (CC BY). The use, distribution or reproduction in other forums is permitted, provided the original author(s) and the copyright owner(s) are credited and that the original publication in this journal is cited, in accordance with accepted academic practice. No use, distribution or reproduction is permitted which does not comply with these terms.
*Correspondence: Uwe Schröder, dXdlLnNjaHJvZWRlckB0dS1icmF1bnNjaHdlaWcuZGU=
Disclaimer: All claims expressed in this article are solely those of the authors and do not necessarily represent those of their affiliated organizations, or those of the publisher, the editors and the reviewers. Any product that may be evaluated in this article or claim that may be made by its manufacturer is not guaranteed or endorsed by the publisher.
Research integrity at Frontiers
Learn more about the work of our research integrity team to safeguard the quality of each article we publish.