 Rachel Carter
 Emily J. Klein1
 Todd A. Kingston
 Corey T. Love
- 1Chemistry Division, U.S. Naval Research Laboratory, Washington, DC, United States
- 2NRC/NRL Cooperative Research Associate, U.S. Naval Research Laboratory, Washington, DC, United States
Li-ion batteries are prone to thermal transients imposed by external environmental conditions and/or operationally-induced self-heating characteristics. The material properties, form factor, and implemented cooling strategy of a battery influence the severity and behavior of thermal transients. In contrast to equilibrated low temperatures (0°C), both substantial and mild (40 to 0°C and 10 to 0°C) temporally transient thermal conditions, result in approximately half of the Li+ ions plating as lithium metal at the anode, as opposed to intercalating, in the first charge. This quantity of plated lithium accelerates capacity loss in subsequent cycles and causes rapid onset of jellyroll collapse (cycles 5–8). The plating process induced by charging under a thermal transient causes a unique drop in voltage during charging, resulting in a negative differential voltage, which is not observed in subsequent cycles when the cell temperature has reached thermal equilibrium or in any equilibrium condition. Because a negative differential voltage is distinct, it provides a route for detection to prevent rapid degradation and compromised safety. Accelerated rate calorimetry assesses cell safety after substantial plating and jellyroll collapse induced by charging under a temporally thermal transient condition. Self-heating begins at temperatures as low as 35°C and can wall rupture provides risk of propagation failures in battery packs. Charging during thermal transients is identified as a plating-prone condition that alters the long-term performance and safety of Li-ion batteries. This work exemplifies the importance of understanding the role of thermal transients in pack assemblies to enable safe operation.
Introduction
Electrochemical behaviors are strongly coupled with thermal conditions (Rodrigues et al., 2017; Mistry et al., 2018). Temperature variations alter the kinetics of redox processes (Nernst equation) and material properties that influence mass transport, for example electrolyte viscosity. These temperature variations can permit undesirable behaviors such as lithium plating and excessive solid-electrolyte interphase (SEI) growth. Low temperatures (Love et al., 2015), high charging rates (C-rates) (Waldmann et al., 2018), and spatial thermal gradients (Carter and Love, 2018) are known to enable lithium plating, a phenomenon often blamed for Li-ion battery failures. High temperatures accelerate SEI growth and diminish performance (Rodrigues et al., 2017).
At a system level, batteries are susceptible to spatial thermal gradients across a pack assembly and temporal thermal transients due to varying operational conditions (Liu et al., 2017; Zhao et al., 2018). These thermal gradients and transients can be manifested or exacerbated by the cell's C-rate (Huang et al., 2019; Liu et al., 2019; Tomaszewska et al., 2019), which modulates ion movement and in turn, affects Joule heating (Zhang et al., 2014). Electric vehicle batteries subjected to fast charging or variable climates are particularly at risk of these conditions. Spatial and temporal variation of undesired (e.g., SEI growth and lithium plating) and desired (e.g., conventional intercalation) characteristics alter the safety and performance of the system and, as pointed out by Hales et al. can contribute greater degradation than absolute temperatures (Hales et al., 2019).
Ideally, thermal management systems for Li-ion batteries attempt to maintain an isothermal condition which is expected to deliver optimal performance (Rao and Wang, 2011; Zhao et al., 2015; Wang et al., 2016; Bolsinger and Birke, 2019). Particularly in electric vehicle batteries, thermal management systems attempt to counter environmental changes and cell self-heating (Wang et al., 2016). Various cooling strategies have been examined for efficacy (Chen et al., 2016), with some better suited to adjust cell temperature rapidly while others for limiting spatial variation (Liu et al., 2017). It is important to understand the implications of these thermal fluctuations on battery performance to provide long term stability.
The geometry and material properties of the cell combined with its cooling strategy govern the battery's transient response when subjected to changing thermal conditions. The timescale of the transient response relative to the cell's charge and discharge time is important because significant cell temperature fluctuations in conjunction with changes in the state of charge (SOC) facilitate complex electrochemical behavior. The system's sensitivity to spatial temperature variation is dictated, in part, by the battery cell design and operational factors (physical cell form factor, usage conditions, cooling strategy, and cell material properties) and thermal characteristics (heat transfer coefficients, thermal conductivities and self-heating rates). For example, cylindrical cells are more prone to spatial thermal gradients than pouch cells, particularly in the radial direction when subjected to high C-rates (Waldmann et al., 2015), given their smaller surface area to volume ratio. Understanding the susceptibility of the system to these factors is exceedingly important when considering thermal management strategies and/or safe operational or environmental conditions.
This work probes the performance and safety implications of charging a 2.6 Ah 18650 Li-ion battery exposed to a temporally transient thermal condition. Immediately following transfer from a warmer chamber to a colder chamber, the cells reveal plating dominant charging behavior not present in the ones equilibrated to their respective thermal environment.
Methods
Cell Screening
Cell conditioning described in our recent work involving the same cell (Love et al., 2018) was utilized to equilibrate each cell state before comparative testing. First the cell's discharge capacity is assessed. Next the capacity loss with cycling is checked for tolerance. Finally, the cells are stored at equivalent states of charge. Each cell was examined with X-ray radiography down the length of the can using Zeiss Xradia 520 Versa (Carter et al., 2018). Using the 0.4X detector, the cell was imaged with 12 s of exposure at 140 kV and 10 W. This configuration provided a voxel size of 20 μm. X-ray imaging confirmed the lack of a mandrel inside the cell and pristine initial condition.
Testing
Five cells were utilized to examine five different thermal conditions. Three cells were placed in different environmental chambers (Tenney) set to 40, 20, or 0°C. The cells equilibrated to these temperatures for 1.5 h and were then electrochemically cycled; these cells represent the Equilibrium conditions. Two other cells were subjected to thermally transient conditions by first equilibrating them in chambers of 40 and 10°C and then transferring them to 0°C chambers. Additionally, data from cells transferred from 20 and 5°C to 0°C are incorporated in Figure S5. For these Transient cells, cycling was started immediately upon transferring to the 0°C chamber. Both Equilibrium and Transient cells were cycled using a CC-CV/CC (constant current-constant voltage charge and constant current discharge) strategy recommended by the manufacturer: C/2 (1.3 A) CC charge to 4.2 V followed by 4.2 V CV charge until the current < C/50 (0.052 A); C/2 (1.3 A) CC discharge to 2.75 V.
Model
The spatial and temporal temperature evolution of the battery once transferred from the higher temperature chamber to the lower temperature chamber affects the cell's electrochemistry. The Biot number was used to determine if spatial temperature gradients within the jellyroll of the battery were likely to be present. The Biot number provides a measure of the temperature gradient within the cell relative to the temperature gradient between the outside surface of the cell can wall and the surrounding air. If the resistance to convection (Rconv) between the can surface and the surrounding air is significantly higher than the internal conduction resistance (Rconv), it can be concluded that spatial temperature gradients within the jellyroll are negligible and the temperature of the cell is approximately spatially uniform at each point in time. The Biot number is given by:
where the characteristic length of the cell is Lc = V/As. The volume of the jellyroll was calculated using where Do and Di are the outside and inside diameter of the jellyroll and L is the length of the jellyroll. The outside and inside diameters of the jellyroll were measured to be ~18 and 4 mm, respectively, using X-ray radiography (Figure S1). Because the diameter of the cell is small relative to the length, the ends of the cell were neglected for thermal modeling purposes. Thus, the surface area of the cell was calculated using As = πDoL. Because heat transfer is assumed to only occur in the radial direction, the effective radial thermal conductivity of the jellyroll was assumed to be 3.39 W/mK, as experimentally measured by Maleki et al. (1999). This effective radial thermal conductivity takes into account the electrodes, separator and electrolyte. The convective heat transfer coefficient (h) inside the colder chamber was evaluated using an empirical Nusselt number correlation for a cylinder in cross flow (Incropera et al., 2007): where the Reynolds number is Re = UDo/υ; constants C and m are obtained from Incropera et al. (2007); and kf is the thermal conductivity, Pr is the Prandtl number, and υ is the viscosity of air evaluated at the arithmetic mean of the initial (Ti) and final (Tf) temperature of the cell (i.e., the hot and cold chamber temperatures, respectively). The velocity of the air inside the cold chamber (U) was measured to be 1.9 m/s. The calculated convective heat transfer coefficient was ~32 W/m2K for both transient conditions. Using these experimental parameters, the Biot number is determined to be 0.03 for both thermal transient conditions. This Biot number is similar to those found in the literature when cells are subjected to natural convection or low-velocity forced convection in air (Al Hallaj et al., 1999; Zhang et al., 2019). Because the Biot number is <0.1, it is concluded that the spatial temperature gradients within the jellyroll of the cell are negligible and the temperature of the cell is only a function of time. This analysis assumes that the heat generation rate within the cell during charge and discharge is relatively small, which has been shown to be a good assumption for low C-rates, such as the one used in this study (C/2) (Jeon and Baek, 2011).
Given the lack of spatial temperature gradients within the cell, a lumped capacitance thermal model is appropriate and the temporal evolution of the battery temperature when transferred from the hot chamber to the cold chamber can be predicted using:
where ρ and c are the density and specific heat of the jellyroll, which were assumed to be 2,680 kg/m3 and 1,280 J/(kg °C), respectively, as experimentally measured by Maleki et al. (1999).
End of Life (EOL) Safety Assessment
To assess the safety implications of subjecting cells to a thermal transient, an end of life (EOL) safety assessment was performed on three different cells. Starting with brand new cells in a pristine initial condition, these cells were discharged and cycled according to the conditions outlined in section “Testing” for the Transient 40 to 0°C, Equilibrium 0°C, and Equilibrium 20°C. Cells subjected to the Transient 40 to 0°C and Equilibrium 0°C conditions which are prone to mechanical and electrochemical degradation were cycled until their capacity had faded to 75% of their initial discharge capacity (signaling EOL). The Transient cell started with a discharge capacity of 1.98 Ah and was stopped at 1.50 Ah. The Equilibrium cell started with a discharge capacity of 2.08 Ah and was stopped at 1.57 Ah. The Equilibrium 20°C cell would require many cycles to reach equivalent energy loss, so this cell was cycled 100 times and exhibited ~6% capacity fade. X-rays were collected for these cells before and after cell cycling in accordance with the screening procedure in section “Cell Screening”.
Following X-ray imaging, the cells were fully charged using the CC-CV procedure described in section Testing and the plastic wrapping of the cells was removed as well as the plastic ring around the positive tab. An N-type thermocouple was attached to the center of the cell on the can wall using high temperature tape and a nickel wire. The cell was then positioned inside a holder to keep the cell upright during testing and then lowered into an extended volume Thermal Hazard Technology accelerated rate calorimeter (EV-ARC). The EV-ARC's “heat-wait-seek” method was utilized to slowly heat the chamber in 5°C increments followed by a 5 min wait period and a 20 min seek period. During the “seek” period, if the temperature rate exceeds 0.02°C/min, the EV-ARC will enter “exotherm” mode where the cell temperature is measured until the temperature rate decreases below 0.02°C/min or reaches a predefined temperature cutoff. If the temperature cutoff is not reached during this exotherm mode, the EV-ARC enters the heat-wait-seek mode again and the process will continue until the temperature cutoff is reached either due to heating by the EV-ARC or thermal runaway.
Results and Discussion
Quantifying Thermal Transients
A temporally transient thermal condition is induced on the cells by transferring them from the warmer to the colder environmental chamber, as illustrated in Figure 1A. The start of this thermal transient condition coincides with the start of cell charging. The temperature of the batteries as a function of time upon leaving the hot chamber (either at a nominal temperature of 40 or 10°C) and being inserted into the cold chamber (nominally 0°C) is shown in Figure 1B. It is worth noting that while there is a substantial (40°C) and mild (10°C) temporal temperature evolution of the cells for the two Transient cases, the spatial temperature gradients within the cells are negligible and the entire jellyroll is assumed to be at the temperature shown in Figure 1B for reasons discussed in section Model. The triangle symbols represent the experimentally-obtained data and the solid lines represent the lumped capacitance thermal model predictions (Equation 2).
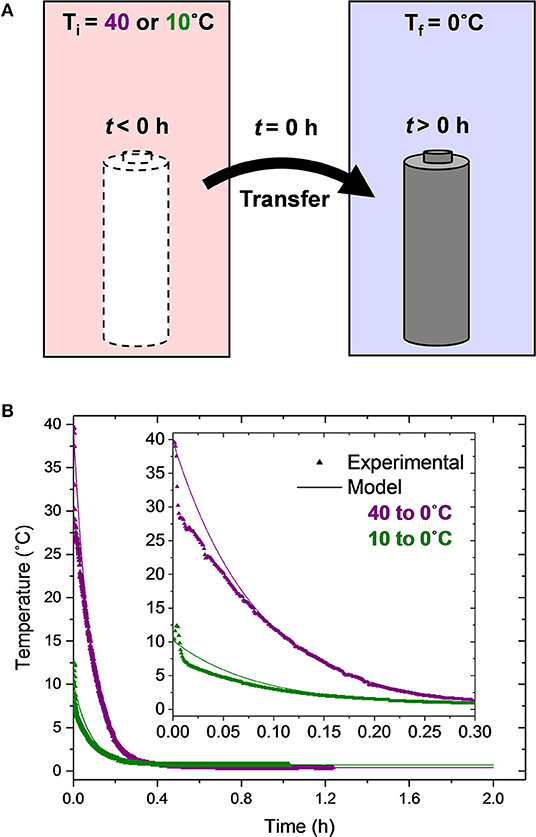
Figure 1. (A) Schematic diagram of the cell transfer process used to create a thermal transient condition and (B) experimentally measured and theoretically predicted cell temperature upon transfer to the 0°C chamber.
In general, the model predictions agree quite well with the experimental data. For the Transient 40 to 0°C experimental test condition, there is an initial, more rapid reduction in the cell temperature (0 < t < 0.007 h or 25 s) relative to the model predictions. This rapid initial reduction is likely due to the movement of the cell from one chamber to the other. After this initial discrepancy, the model agrees with the experimental data very well. The experimentally-obtained thermal time constant, defined as the amount of time the cell takes to change 63.2% of the chamber-to-chamber temperature difference, is τexp = 0.0806 h (4.8 min). The theoretical thermal time constant is τpred = ρVc/hAs = 0.0826 h (5 min). Thus, the error in the theoretical thermal time constant for this transient condition is only 2.5%. At t = 0.354 h (21 min), the cell temperature is within 0.3°C of the cold chamber temperature and has changed more than 99% of the chamber-to-chamber temperature difference; it is essentially in thermal equilibrium with the cold chamber. Thus, it is only during the first 22% of the first charge duration that the cell is under a thermal transient condition.
For the 10 to 0°C condition, the measured temperature of the cell initially increases 2°C from t = 0 to 0.004 h (14 s) followed by a rapid reduction in temperature from t = 0.004 to 0.009 h and then a slower reduction after t = 0.009 h (32 s). This non-monotonic behavior is due to the transfer of the cell from an initially 10°C chamber, through room temperature air (≈ 22°C), to a 0°C chamber. While some minor differences between the model predictions and the experimental data are present for the first 0.1 h (6 min), the two agree quite well thereafter.
First Cycle Characteristics
First Charge
The first CC charge of the cell following transfer from the warmer to the colder environmental condition is when all of the temperature variation is occurring. In order to provide a baseline understanding for the thermo-electrochemical coupling across the temperature range that the Transient cells experience, the electrochemical behavior under thermal equilibrium conditions was probed. The first charge of cells equilibrated to 40, 20, and 0°C are provided in Figure 2A. Minimal difference between the Equilibrium 40 and 20°C conditions (red and black curves, respectively) exists, but the Equilibrium 0°C cell (navy) exhibits significantly higher overpotential to intercalation, causing the cell to charge at a higher voltage. The increased charge voltage prevents a complete charge, since the upper voltage cutoff is reached before the cell achieves its full capacity. Based on these observations, the behavior in the first ~0.2 h of the Transient 10 to 0°C case (olive, Figure 2B) agrees well with the Equilibrium 0°C cell (for ease of comparison, all 5 conditions are plotted together in Figure S2). However, the voltage continues to rise beyond the voltage where a plateau was reached in the Equilibrium 0°C case. The cell voltage peaks at ~3.92 V after 0.36 h of charging, a duration that is remarkably similar to the time required for the temperature to reach 99% of equilibrium. Without further testing, it is unclear whether this finding holds in a more general sense or whether it is coincidental. The peak is followed by a decrease in voltage (inset of Figure 2B). Ultimately, the cell reaches its cutoff voltage slightly earlier than the warmer (Equilibrium 40 and 20°C) conditions, resulting in a reduced capacity. The Transient 40 to 0°C case (plum) behaves remarkably similar to the 10 to 0°C condition, except for lower overpotential at the beginning of charge. Despite being initially 30°C warmer than the Transient 10 to 0°C cell, the Transient 40 to 0°C cell still peaks at ~3.9 V after 0.35 h of charging. At the time of the peak, the cells have reached approximately the same temperature (0.9°C, as shown in Figure 1) although starting at vastly different initial temperatures.
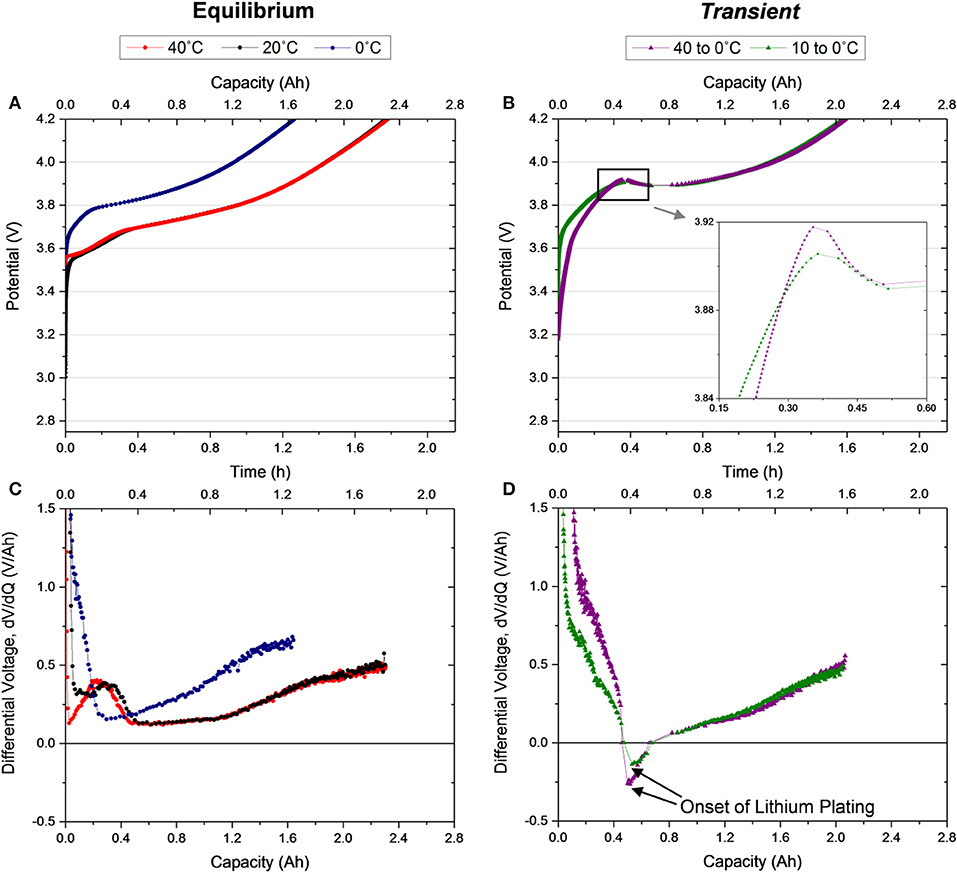
Figure 2. Voltage profiles for the first C/2 galvanostatic charge of (A) Equilibrium 40, 20, and 0°C cells after a 1.5 h rest, (B) Transient 40 to 0°C and 10 to 0°C cells after no rest, and their corresponding differential voltage (C,D), respectively.
For further interrogation of the charge features, the derivative of each charge curve is examined (Figures 2C,D). This analysis allows observation of lithium staging at the graphite anode (Dahn et al., 2012) during the charging process in the Equilibrium 40 and 20°C cells (Figure 2C). A peak in the derivative curve is observed at ~0.3 Ah which signals dilute stage IV, the first lithation state of graphite, and a plateau at 2 Ah indicating the last state, stage I. While a peak is not observed in the Equilibrium 0°C condition, due to the higher overpotential in the cell (Bloom et al., 2005; Dahn et al., 2012), a plateau does appear at ~1.6 Ah. Notably, the derivative of the charge of all three equilibrium cells never drops below 0 V/Ah. However, the derivative of the transient cases (Figure 2D) reveals very different trends with a rapid decrease to a negative differential followed by a recovery to a positive differential until the end of charge. The negative differential corresponds to the observed voltage drop in the charge (Figure 2B). This feature, distinct to the transient case, suggests the onset of a new process in the system which is likely plating lithium. It is probable that lithium plating is initiated when the derivative voltage becomes negative and continues in tandem with conventional intercalation processes until the termination of the charge, even after the derivative voltage has returned to a positive value. Evidence of stripping in the subsequent discharge confirms speculation of lithium plating in this first charge (Figure 3).
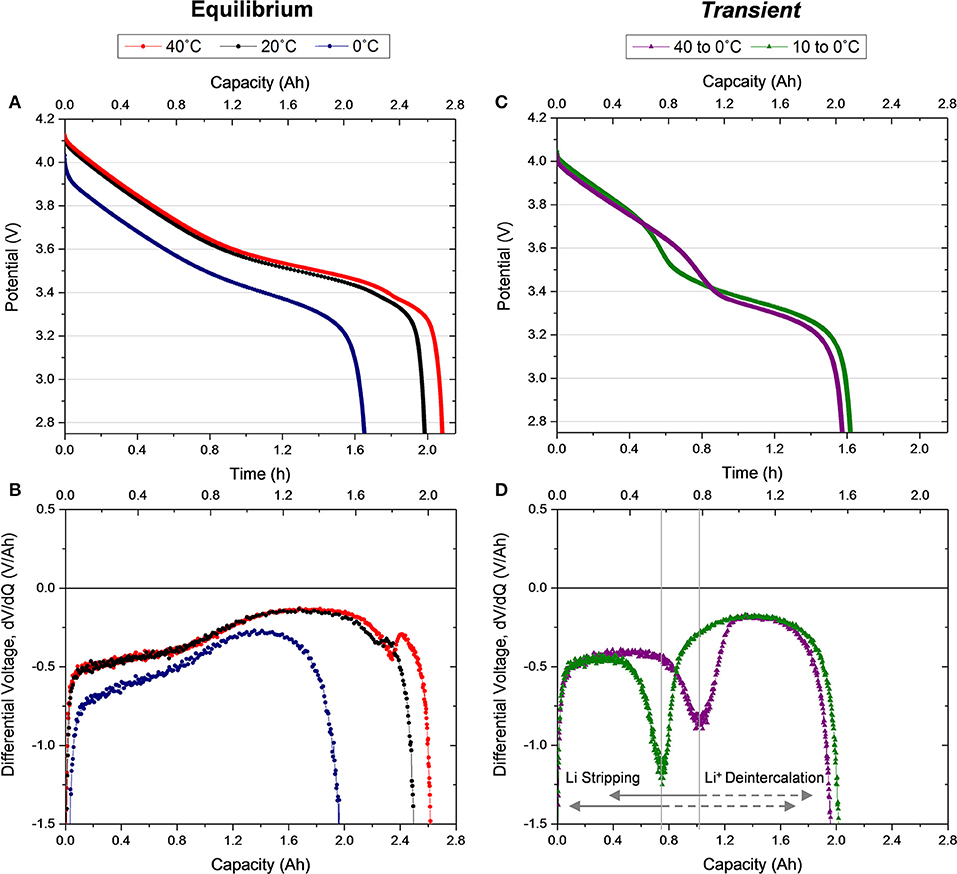
Figure 3. (A) Voltage profiles and (B) differential voltage for the first C/2 galvanostatic discharge immediately following the first charge for Equilibrium 40, 20, and 0°C cells. (C) Voltage profiles and (D) differential voltage for the first C/2 galvanostatic discharge immediately following the first charge for Transient 40 to 0°C and 10 to 0°C cells.
First Discharge
Figure 3 shows the first discharge behavior directly following the first charge that was shown in Figure 2, displayed in the same arrangement of conditions and analysis. In accordance with the charging condition, the Equilibrium 40 and 20°C cells exhibit similar discharge voltage behavior but with slightly higher discharge capacity delivered by the 40°C cell. Recall the Equilibrium 0°C cell experienced higher overpotential during charging causing the cell to reach cutoff voltage prior to 100% SOC (Figure 2A). The same behavior causes a lower discharge voltage and capacity compared to the other Equilibrium cells (Figure 3A). Notably, in this first discharge for the Equilibrium 0°C condition no lithium stripping, indicated as an additional discharge voltage plateau, is observed, indicating lithium plating did not occur during the charge despite the affinity to this behavior in low temperature operation (Love et al., 2015, 2018; Petzl et al., 2015). The shape of the differential voltage for the Equilibrium discharge curves (Figure 3B) agrees well with previous reports in the literature (Bloom et al., 2005; Dahn et al., 2012). Here, again, the two rounded plateaus correlate to graphite anode staging processes and the ending peak in the 40 and 20°C cells align with the initial feature (dilute stage IV) in the charge differential (Figure 2C). The small peak is slightly larger in the Equilibrium 40°C where kinetics are more efficient enabling complete deintercalation.
Alternatively, the discharge of both thermally transient cells reveals a new process with an additional plateau in the cell voltage (Figure 3C). This additional plateau corresponds to lithium metal stripping, which occurs at the beginning of discharge and perpetuates until deintercalation of the anode becomes dominant (Petzl et al., 2015; Campbell et al., 2019). Since metal stripping has a higher standard reduction potential than the conventional deintercalation discharge behavior, this process initiates a slightly higher voltage than the Equilibrium 0°C discharge despite the equivalent thermal condition of the cells at this time (Figure S1). As the discharge potential becomes favorable for deintercalation and stripping terminates, the slope of the voltage profile increases and then steadies into the traditional deintercalation behavior. Since a change in slope differentiates the transition between the stripping dominant behavior and deintercalation dominant behavior, the derivative of the voltage profile helps interrogate the transition at the minima of a valley in the curve, as labeled in Figure 3D. In both cells a significant quantity of lithium is stripped from the anode, particularly in the Transient 40 to 0°C condition. Here the transition to deintercalation dominant processes happens approximately halfway through discharge (at ~1.04 Ah), indicating at least half of the lithium ions transported to the anode during charging were stored as metallic lithium. This lithium quantity is substantially higher than other commercial cell observations (Petzl et al., 2015; Campbell et al., 2019; Carter et al., 2019), emphasizing the distinct risk of transient conditions. Further, ~0.75 Ah of lithium (~38% of the capacity) is stripped in the 10 to 0°C Transient condition, which indicates that even small temperature transients can have a large impact on the electrochemical behavior of the cell. Based on this observation, a Transient 5 to 0°C and a Transient 20 to 0°C case was examined for trends and consistency. The cyclic behavior of these cells is incorporated in Figure S5.
Long Term Performance
Since the cells subjected to a temporally thermal transient condition during their first charge show distinct electrochemical behaviors during their first cycle in comparison to relevant equilibrium conditions, we examined the long term effects of these behaviors on cell performance. By the end of the first cycle, the thermal transient cells have reached thermal equilibrium with the 0°C temperature chamber. Therefore, in cycles 2–50 the only distinction between the transient conditions and the equilibrium 0°C cell is provided by residual effects of the first cycle.
Figure 4 shows the discharge capacity delivered by all five thermal conditions over the first 50 cycles. The Equilibrium 40 and 20°C cells show minimal evidence of degradation. The Equilibrium 0°C shows minimal degradation initially, followed by a gradual decay beginning around cycle 25, where jellyroll collapse likely begins, as carefully characterized in our previous publication investigating the role of a mandrel on Equilibrium 0°C cycling (Carter et al., 2019). In stark contrast, the Transient 10 to 0°C cell shows rapid degradation beginning at approximately cycle eight and the Transient 40 to 0°C cell at approximately cycle five. Here the mechanical implications of plating and stripping significant quantities of lithium metal, even in the first cycle as identified in Figure 3D, likely expedite the jellyroll collapse failure mode.
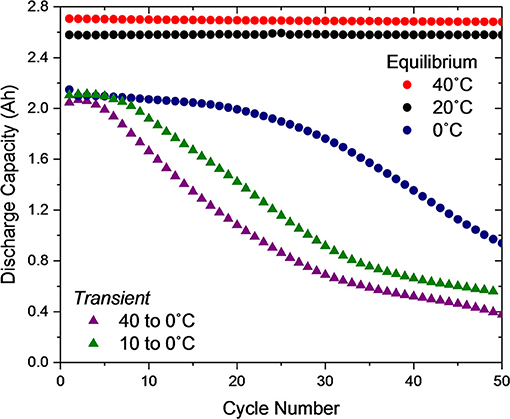
Figure 4. Discharge capacity over 50 cycles for all five cell types.
Route for Detection and Unraveling Mechanisms
Since the Equilibrium 0°C cell's long-term performance proved distinctly different than the thermally transient cells, despite their identical conditions after the first cycle, the behavior of the cells in subsequent cycles was investigated. The differential voltage of the charging and discharging profiles (Figure S3) for cycle(s) 1, 2, 5, 10, 20, 30, and 40 for the Equilibrium 0°C cell and the Transient condition that degraded the quickest, Transient 40 to 0°C, is presented in Figure 5. The most notable observation when examining the differential voltage of the first charge (Figures 5A,B) is that a negative differential is only observed in the first cycle of the Transient 40 to 0°C cell. It is not observed in any subsequent cycles (when thermal equilibrium has been reached) or in any cycle for the Equilibrium 0°C condition. This emphasizes that the feature discussed in Figures 2B,D is distinct to charging under thermal transient conditions and indicative of the onset of lithium metal plating dominant electrochemical processes. Since the feature is distinct mechanistically and numerically, it is feasible for a battery management system (BMS) to detect a negative voltage differential during charging and halt current flow.
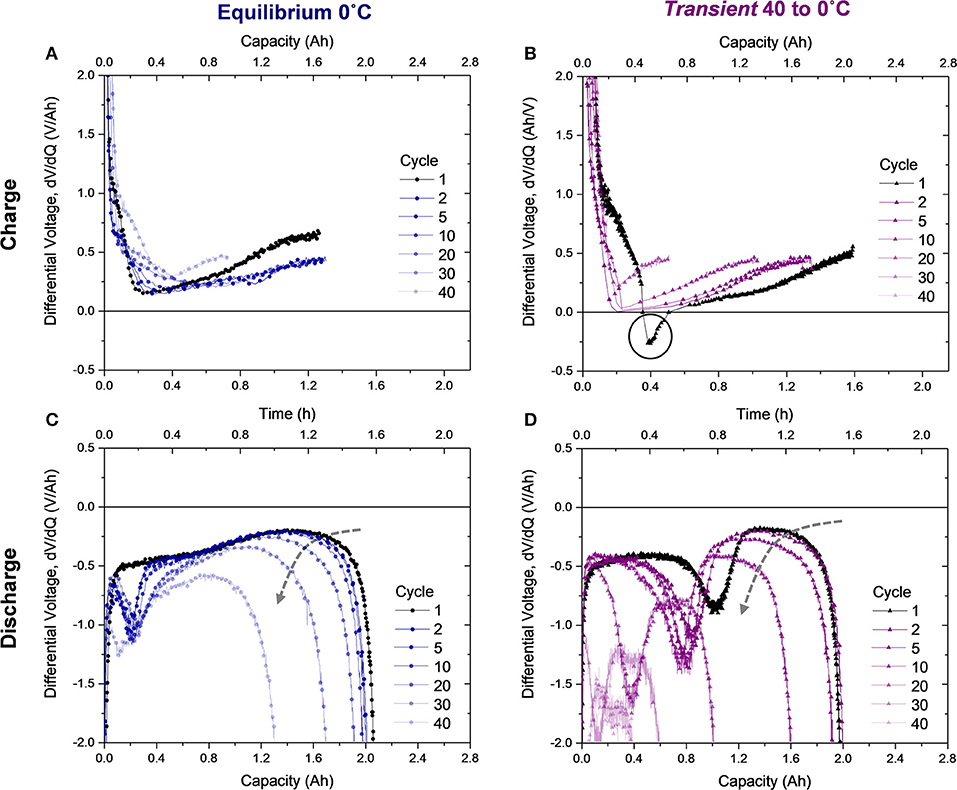
Figure 5. Differential voltage from select charges (1, 2, 5, 10, 20, 30, and 40) of the (A) Equilibrium 0°C cell and (B) Transient 40 to 0°C cell and differential voltage of their subsequent discharges, (C,D), respectively. The dashed arrow in (C,D) shows the trend of decreasing average differential voltage during deintercalation which correlates to jellyroll collapse.
While differential voltage of the charging profile gives route to plating detection, analysis of the differential voltage profile during discharge provides evidence of degradation modes. In the Equilibrium 0°C cell (Figure 5C), the valley characteristic of the transition from stripping to deintercalation appears in the second cycle at ~0.2 Ah. Therefore, plating occurred during the second charge, despite a negative differential voltage not being observed (Figure 5A). In comparison to the first charge, where no plating or stripping was observed, cycles 2–40 exhibit a lower differential voltage at the end of charge, where plating is most probable. The location of the valley in the discharge differential voltage (Figure 5C) does not modulate with cycling, indicating that this lithium stripping behavior is reversible and minimally detrimental to the cell. However, the rounded feature following the valley, correlating to deintercalation from the anode, begins to show substantial decrease in average value following cycle 20, as indicated by the dashed gray arrow in Figure 5C. Dramatic reduction in the differential voltage in the deintercalation region indicates jellyroll collapse, which is the primary degradation mode in this cell, since the stripping behavior proves reversible. The decreased differential voltage correlates to higher cell impedance and manifests as a sharper slope in the voltage profile (provided in the Supplementary Material). Jellyroll collapse causes material delamination and the cell's resistance, or impedance, to increase and capacity to decrease (Waldmann et al., 2014; Pfrang et al., 2018; Carter et al., 2019). As the jellyroll collapse causes damage to the layers, delamination leads to active material loss. This behavior dominates cell degradation at the 40th cycle, where the valley feature and deintercalation region shift left. Here less stripping and deintercalation are observed because the active material loss prevents reversibility.
For the Transient 40 to 0°C cell, a similar decrease in the magnitude of differential voltage in the deintercalation region after cycle five indicates the start of jellyroll collapse (Figure 5D). Not only does this degradation mode onset earlier than the Equilibrium 0°C cell, but changes in the stripping behavior are also evident. From the first to the second cycle, the amount of stripped lithium (quantified by the location of the valley minima) decreases from 1.04 to 0.88 Ah, meaning less lithium was plated on the second charge. The location of the minima then remains relatively constant until the magnitude of the differential voltage in the deintercalation region begins reducing, indicating jellyroll collapse, during cycle 10. Subsequently, the slope in the stripping region also changes due to the enhanced cell impedance and the stripped quantity decreases as the active material is damaged by the mechanical collapse. This is coupled with a leftward shift in the stripping and deintercalation region as loss of active material occurs during the collapse. These trends continue until the cell delivers minimal capacity or is deactivated.
Decoupling Jellyroll Collapse and Lithium Plating
Using the minima of the characteristic valley in the differential voltage discharge curve for each cell type, the capacity of stripped lithium was assessed over the duration of cycling (Figure 6A). In accordance with the discussion of Figure 5A, the ~0.2 Ah of lithium stripped in cycle two for the Equilibrium 0°C cell remains stable across the 50 cycles, indicating the reversibility of plating and stripping this quantity of lithium at the anode composite. A simple calculation converts this capacity to a lithium film of ~2 μm when distributed uniformly across the ~455 cm2 anode surface area. Since the active material layer of the anode is ~80 μm thick and ~35% porous, it is feasible for this volume of lithium to distribute across the surface of graphite particles and remain electrically connected without damaging the composite, enabling reversibility.
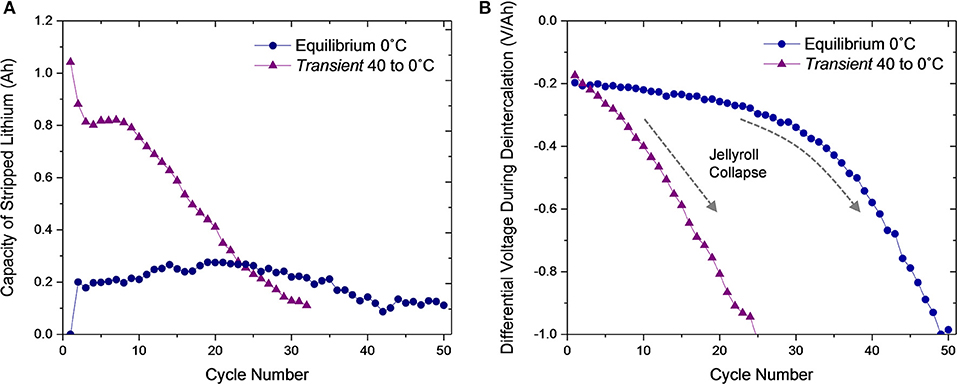
Figure 6. (A) Capacity of lithium stripped during discharge and (B) average differential voltage during deintercalation over 50 cycles for the Equilibrium 0°C and Transient 40 to 0°C cells. The dashed arrow in (B) indicates the onset of jellyroll collapse in the Transient 40 to 0°C condition.
For the Transient 40 to 0°C cell, the high quantity of lithium initially stripped (1.04 Ah) during the first discharge due to the thermal transient-induced plating during the first charge decreases to a region of stability at ~0.81 Ah for cycles 2–8. The second cycle stripping quantity (0.88 Ah) is much greater than the Equilibrium 0°C quantity (0.2 Ah), which indicates that the first charge alters long term performance. The initially stripped quantity (1.04 Ah) equates to a ~11 μm-thick lithium film and the plateau region (0.81 Ah), ~9 μm. These volumes of lithium, which are >10% of the existing anode active material, will either alter the anode thickness, causing pressure to build throughout the jellyroll, or damage the interconnection of the anode composite, rendering the material inactive. These destructive behaviors instigate jellyroll collapse and loss of capacity. At cycle nine, stripping capacity steadily decreases until the cell is deactivated.
To further emphasize that the Equilibrium 0°C cell and Transient 40 to 0°C cell jellyroll collapse behaviors are different, the average differential voltage, of the deintercalation plateau is shown for each cycle (Figure 6B). This value indicates the cells impedance to deintercalation which increases as the jellyroll collapses. The differential voltage in the deintercalation region of the Equilibrium 0°C cell shows minimal change until after cycle 30 and then decreases rapidly until testing completion. However, for the Transient 40 to 0°C cell, the differential voltage begins decreasing immediately. Combined with Figure 6A, this analysis confirms that the Equilibrium 0°C cell primarily degrades because of jellyroll collapse while the Transient 40 to 0°C cell degrades more rapidly with substantial lithium plating followed by jellyroll collapse.
Safety Analysis
Since the Equilibrium 0°C and Transient 40 to 0°C cells degrade in a different manner, the implications of their EOL physical condition on thermal runaway are important to assess. The discharge capacity of the cells shown in Figure 4 were allowed to decay substantially below a typical EOL condition, where they decayed to unequal amounts. Therefore, fresh cells (Figure S6) were subjected to the same thermal conditions (Equilibrium 0°C and Transient 40 to 0°C) and cycled to equivalent EOL conditions of 75% capacity retention. The cells degraded (Figure 7A) in a manner consistent with those analyzed in Figure 4 but at a slightly slower rate, indicating the experimental variation of a jellyroll collapse failure, which is unpredictable in nature as we observed previously (Carter et al., 2019). Subsequent radiographs of the cells at the EOL confirmed that both thermal conditions resulted in jellyroll collapse (Figures 7B,C).
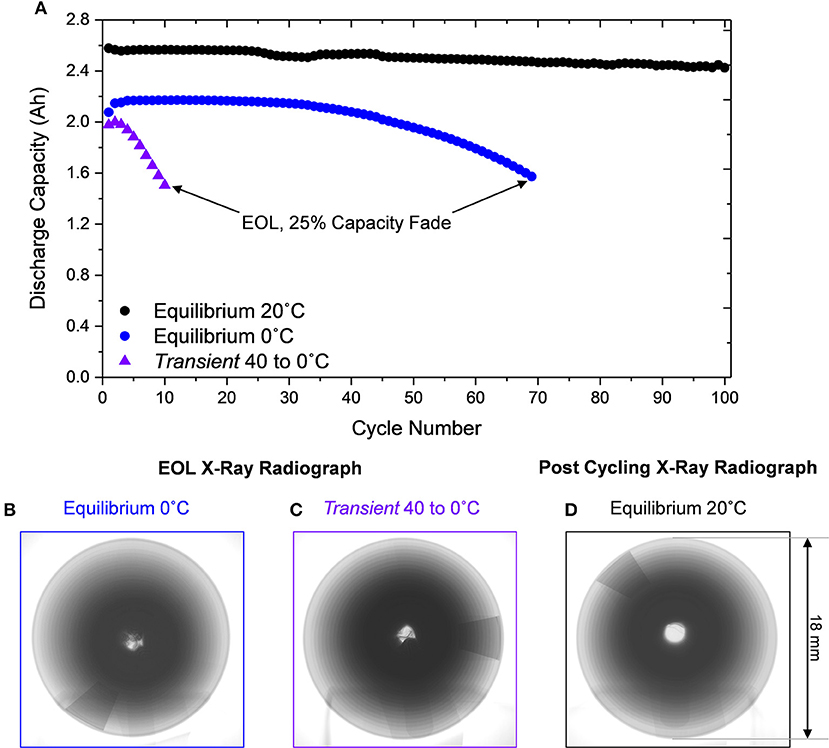
Figure 7. (A) Discharge capacity of Equilibrium 20°C over 100 cycles and Equilibrium 0°C and Transient 40 to 0°C cells to 25% capacity fade. X-ray radiograph after 30% capacity fade for cells subjected to (B) Equilibrium 0°C and (C) Transient 40 to 0°Cwith evidence of jellyroll collapse, contrasted to the Equilibrium 20°C cell cycled 100 times without mechanical degradation (D).
Additionally, a fresh cell at Equilibrium 20°C was cycled for 100 cycles. Since minimal degradation is observed in this thermal condition, many cycles would be required to reach the EOL condition. After 100 cycles the Equilibrium 0°C exhibited ~6% capacity fade and no jellyroll collapse (Figure 7D). These three cells therefore represent a conventionally cycled cell (Figure 7D), a cell exhibiting jellyroll collapse and 30% energy loss (Figure 7B), and a cell subjected to substantial plating, jellyroll collapse, and 30% energy loss (Figure 7C).
These three cells were then fully charged and tested via ARC to assess their thermal runaway (Carter et al., 2018). The conventionally cycled Equilibrium 20°C cell began self-heating at 130°C when separator melting occurred (Waldmann et al., 2017; Carter et al., 2019; Figure 8A). This cell then vents providing an endothermic downshift at 140°C. Finally the cell enters thermal runaway at ~200°C. After the test, the cell exhibits signs of combustion at the vent holes but otherwise shows minimal evidence of failure (Figure 7B). In contrast to this conventional behavior, the Equilibrium 0°C and Transient 40 to 0°C cells which both possess lower electrochemical energy, began to self-heat at only 50 and 35°C, respectively. With these cells, Equilibrium 0°C and Transient 40 to 0°C, two distinct inflection temperatures occur after self-heating initiates. The first onsets are around 70°C for both cells and correlates to lithium side reactions where residual lithium metal reacts with electrolyte components (Feng et al., 2019). The higher peak temperature of the Transient 40 to 0°C cell (154°C compared to 108°C for the Equilibrium 0°C condition) caused by lithium side reactions, indicates a greater quantity of metallic lithium, augmenting the heat generation. Subsequently the Transient 40 to 0°C cell more rapidly self-heats when the lithium side reactions terminate to a rate of 0.3°C/min compared to only 0.07°C/min for the Equilibrium 0°C cell. Heating rate data with respect to temperature are incorporated in Figure S8. Since self-heating initiates at such low temperatures and both cells experience lithium side reactions, cell venting is not evident. Ultimately, both cells self-heat to ~200°C where thermal runaway occurs. Since venting is not evident in the data for each of these cells, both cans rupture during the thermal runaway event, releasing active material (Figure 8B). In the case of the Equilibrium 0°C cell, the jellyroll ejects through the top of the cell whereas the Transient 40 to 0°C cell exhibits side wall rupture opening the cell in the radial direction. These dramatic behaviors which involve material ejecta and can wall deformation induce risk to local assets and failure propagation in pack assemblies. These thermal runaway behaviors emphasize the compromised safety of cells containing metallic lithium and/or exhibiting collapsed jellyrolls.
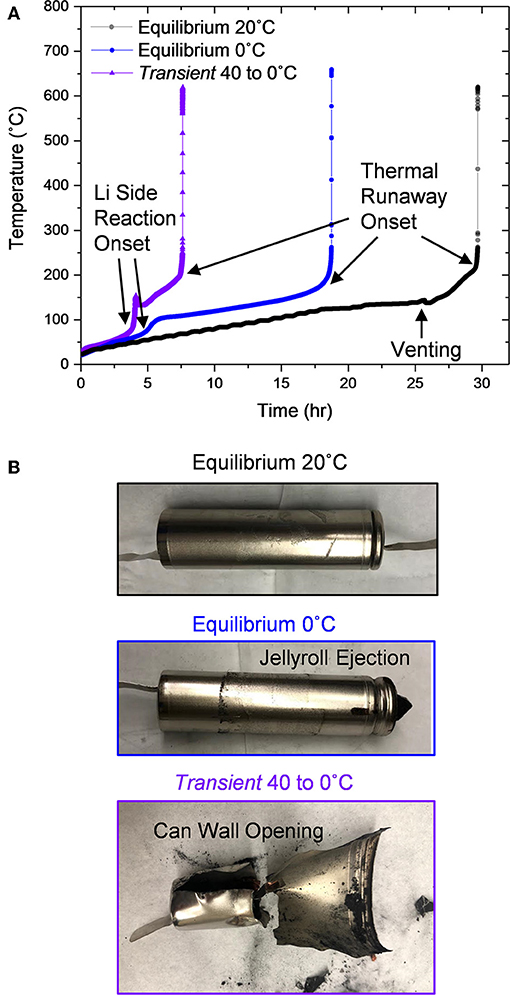
Figure 8. (A) Cell temperature over time during accelerating rate calorimetry (ARC) testing and (B) photographs of each cell after ARC testing.
Conclusions and Future Outlook
Charging lithium-ion cells under spatially uniform, temporally transient thermal conditions can greatly reduce performance and safety. Herein we determine that a single charge of a commercial Li-ion battery while its temperature is decreasing temporally toward 0°C induces lithium plating which causes early loss of capacity, earlier onset temperature of thermal runaway, and higher heat generation temperature during thermal runaway. The 18650 cells examined show evidence that approximately half of the Li+ ions transferred in this first charge deposit as lithium metal rather than intercalating in both the mild Transient 10 to 0°C and the more substantial Transient 40 to 0°C cases. When this substantial plating is induced by the transient thermal condition, a depression in the charge voltage to a negative differential voltage occurs. However, after the cells reach 0°C (cycles 2–50 of the Transient cells or all cycles of the Equilibrium 0°C cell), stripping is still observed on the discharge, but the charge voltage does not exhibit a negative differential. The distinct nature of this feature provides a route for detection of the onset of this aggressive lithium plating behavior with BMS algorithms.
Since cells charged during the transient to 0°C experience significant lithium plating and subsequent stripping, the mechanical implications cause its long term performance to differ from a cell initially equilibrated to the same condition. The Equilibrium 0°C cell undergoes significantly less lithium metal plating and stripping (~0.2 Ah) but eventually experiences jellyroll collapse after ~30 cycles due to low temperature aging after ~30 cycles. However, the large quantity of lithium plated and stripped in the transient condition, particularly in the Transient 40 to 0°C case (1.04 Ah), causes the jellyroll to collapse more rapidly, after only ~5 cycles. These distinct degradation modes enable extremely energetic failure modes following self-heating at mild temperatures of only 50 and 35°C for the Equilibrium 0°C and Transient 40 to 0°C cases, respectively. The Transient 40 to 0°C case shows evidence of more residual lithium metal and a more rapid acceleration to thermal runaway. The thermal runaway of both cells results in can wall breaches providing risk of failure propagation.
Our observations, in regards to the cells' sensitivity to thermal transient conditions, emphasize the need to understand the correlations between Li-ion battery environments and local electrochemistry. This understanding can better evaluate safe operating conditions and thermal management strategies. The thermal sensitivity of particular form factors and pack assemblies should be evaluated. Further assessment of the impact of differing magnitude and direction of the thermal transient is required to fully understand the safety implications. Moreover, it is important to understand the time to equilibrium when selecting C-rate, so that substantial SOC variation does not occur during a thermal transient condition. These considerations are particularly important for extreme fast charging. Our observations spark questions about transients at different state charge and operational conditions as well, like cold start, discharging in a transient cold to warm condition.
Data Availability Statement
All datasets available upon request for this study are included in the article/Supplementary Material.
Author Contributions
RC, TK, and CL conceived the idea and designed experiments. RC conducted the experiments, analyzed the data, and wrote the manuscript. TK developed the thermal model and assisted with manuscript writing. EK supported experimental data collection.
Funding
This work was funded under grant from the Office of Naval Research, N0001419WX00517.
Conflict of Interest
The authors declare that the research was conducted in the absence of any commercial or financial relationships that could be construed as a potential conflict of interest.
Acknowledgments
The authors acknowledge Prof. Iryna Zenyuk for training in micro CT image analysis and Dr. Andrew Geltmacher for assistance in the use of the XCMT instrument. The authors acknowledge Dr. Robert W. Atkinson III and Mr. Conner Fear for helpful discussions. The authors thank Dr. Michele Anderson, Office of Naval Research, for funding of this effort. The authors thank the Department of Transportation PHMSA for financial support to procure the accelerated rate calorimeter. TK was funded through the National Academies NRC RAP program.
Supplementary Material
The Supplementary Material for this article can be found online at: https://www.frontiersin.org/articles/10.3389/fenrg.2019.00144/full#supplementary-material
References
Al Hallaj, S., Maleki, H., Hong, J. S., and Selman, J. R. (1999). Thermal modeling and design considerations of lithium-ion batteries. J. Power Sources 83, 1–8. doi: 10.1016/S0378-7753(99)00178-0
Bloom, I., Jansen, A. N., Abraham, D. P., Knuth, J., Jones, S. A., Battaglia, V. S., et al. (2005). Differential voltage analyses of high-power, lithium-ion cells: 1. Technique and application. J. Power Sources 139, 295–303. doi: 10.1016/j.jpowsour.2004.07.021
Bolsinger, C., and Birke, K. P. (2019). Effect of different cooling configurations on thermal gradients inside cylindrical battery cells. J. Energy Stor. 21, 222–230. doi: 10.1016/j.est.2018.11.030
Campbell, I. D., Marzook, M., Marinescu, M., and Offer, G. J. (2019). How observable is lithium plating? Differential voltage analysis to identify and quantify lithium plating following fast charging of cold lithium-ion batteries. J. Electrochem. Soc. 166, A725–A739. doi: 10.1149/2.0821904jes
Carter, R., Huhman, B., Love, C. T., and Zenyuk, I. V. (2018). X-ray computed tomography comparison of individual and parallel assembled commercial lithium iron phosphate batteries at end of life after high rate cycling. J. Power Sources 381, 46–55. doi: 10.1016/j.jpowsour.2018.01.087
Carter, R., Klein, E. J., Atkinson, R. W., and Love, C. T. (2019). Mechanical collapse as primary degradation mode in mandrel-free 18650 Li-ion cells operated at 0 °C. J. Power Sources 437:226820. doi: 10.1016/j.jpowsour.2019.226820
Carter, R., and Love, C. T. (2018). Modulation of lithium plating in li-ion batteries with external thermal gradient. ACS Appl. Mater. Interfaces 10, 26328–26334. doi: 10.1021/acsami.8b09131
Chen, D., Jiang, J., Kim, G.-H., Yang, C., and Pesaran, A. (2016). Comparison of different cooling methods for lithium ion battery cells. Appl. Therm. Eng. 94, 846–854. doi: 10.1016/j.applthermaleng.2015.10.015
Dahn, H. M., Smith, A. J., Burns, J. C., Stevens, D. A., and Dahn, J. R. (2012). User-friendly differential voltage analysis freeware for the analysis of degradation mechanisms in li-ion batteries. J. Electrochem. Soc. 159, A1405–A1409. doi: 10.1149/2.013209jes
Feng, X., Ren, D., Zhang, S., He, X., Wang, L., and Ouyang, M. (2019). Influence of aging paths on the thermal runaway features of lithium-ion batteries in accelerating rate calorimetry tests. Int. J. Electrochem. Sci. 14, 44–58. doi: 10.20964/2019.01.14
Hales, A., Diaz, L. B., Marzook, M. W., Zhao, Y., Patel, Y., and Offer, G. (2019). The cell cooling coefficient: a standard to define heat rejection from lithium-ion batteries. J. Electrochem. Soc. 166, A2383–A2395. doi: 10.1149/2.0191912jes
Huang, S., Wu, X., Cavalheiro, G. M., Du, X., Liu, B., Du, Z., et al. (2019). In situ measurement of lithium-ion cell internal temperatures during extreme fast charging. J. Electrochem. Soc. 166, A3254–A3259. doi: 10.1149/2.0441914jes
Incropera, F. P., Dewitt, D. P., Bergman, T. L., and Lavine, A. S. (2007). Fundamentals of Heat and Mass Transfer (Hoboken, NJ: John Wiley & Sons, Inc.).
Jeon, D. H., and Baek, S. M. (2011). Thermal modeling of cylindrical lithium ion battery during discharge cycle. Energy Convers. Manage. 52, 2973–2981. doi: 10.1016/j.enconman.2011.04.013
Liu, H., Wei, Z., He, W., and Zhao, J. (2017). Thermal issues about Li-ion batteries and recent progress in battery thermal management systems: a review. Energy Convers. Manage. 150, 304–330. doi: 10.1016/j.enconman.2017.08.016
Liu, Y., Zhu, Y., and Cui, Y. (2019). Challenges and opportunities towards fast-charging battery materials. Nat. Energy 4, 540–550. doi: 10.1038/s41560-019-0405-3
Love, C., Dubarry, M., Reshetenko, T., Devie, A., Spinner, N., Swider-Lyons, K., et al. (2018). Lithium-ion cell fault detection by single-point impedance diagnostic and degradation mechanism validation for series-wired batteries cycled at 0°C. Energies 11:834. doi: 10.3390/en11040834
Love, C. T., Baturina, O. A., and Swider-Lyons, K. E. (2015). Observation of lithium dendrites at ambient temperature and below. ECS Electrochem. Lett. 4, A24–A27. doi: 10.1149/2.0041502eel
Maleki, H., Hallaj, S. A., Selman, J. R., Dinwiddie, R. B., and Wang, H. (1999). Thermal properties of lithium-ion battery and components. J. Electrochem. Soc. 146, 947–954. doi: 10.1149/1.1391704
Mistry, A., Fear, C., Carter, R., Love, C. T., and Mukherjee, P. P. (2018). Electrolyte confinement alters lithium electrodeposition. ACS Energy Lett. 1, 156–162. doi: 10.1021/acsenergylett.8b02003
Petzl, M., Kasper, M., and Danzer, M. A. (2015). Lithium plating in a commercial lithium-ion battery – A low-temperature aging study. J. Power Sources 275, 799–807. doi: 10.1016/j.jpowsour.2014.11.065
Pfrang, A., Kersys, A., Kriston, A., Sauer, D. U., Rahe, C., Käbitz, S., et al. (2018). Long-term cycling induced jelly roll deformation in commercial 18650 cells. J. Power Sources 392, 168–175. doi: 10.1016/j.jpowsour.2018.03.065
Rao, Z., and Wang, S. (2011). A review of power battery thermal energy management. Renew. Sustain. Energy Rev. 15, 4554–4571. doi: 10.1016/j.rser.2011.07.096
Rodrigues, M., Babu, G., Gullapalli, H., Kalaga, K., Sayed, F., Kato, K., et al. (2017). A materials perspective on Li-ion batteries at extreme temperatures. Nat. Energy 2:2017108. doi: 10.1038/nenergy.2017.108
Tomaszewska, A., Chu, Z., Feng, X., O'Kane, S., Liu, X., Chen, J., et al. (2019). Lithium-ion battery fast charging: a review. eTransportation 1:100011. doi: 10.1016/j.etran.2019.100011
Waldmann, T., Bisle, G., Hogg, B.-I., Stumpp, S., Danzer, M. A., Kasper, M., et al. (2015). Influence of cell design on temperatures and temperature gradients in lithium-ion cells: an in operando study. J. Electrochem. Soc. 162, A921–A927. doi: 10.1149/2.0561506jes
Waldmann, T., Gorse, S., Samtleben, T., Schneider, G., Knoblauch, V., and Wohlfahrt-Mehrens, M. (2014). A mechanical aging mechanism in lithium-ion batteries. J. Electrochem. Soc. 161, A1742–A1747. doi: 10.1149/2.1001410jes
Waldmann, T., Hogg, B.-I., and Wohlfahrt-Mehrens, M. (2018). Li plating as unwanted side reaction in commercial Li-ion cells – A review. J. Power Sources 384, 107–124. doi: 10.1016/j.jpowsour.2018.02.063
Waldmann, T., Quinn, J. B., Richter, K., Kasper, M., Tost, A., Klein, A., et al. (2017). Electrochemical, post-mortem, and ARC analysis of li-ion cell safety in second-life applications. J. Electrochem. Soc. 164, A3154–A3162. doi: 10.1149/2.0961713jes
Wang, Q., Jiang, B., Li, B., and Yan, Y. (2016). A critical review of thermal management models and solutions of lithium-ion batteries for the development of pure electric vehicles. Renew. Sustain. Energy Rev. 64, 106–128. doi: 10.1016/j.rser.2016.05.033
Zhang, G., Cao, L., Ge, S., Wang, C.-Y., Shaffer, C. E., and Rahn, C. D. (2014). In situ measurement of radial temperature distributions in cylindrical li-ion cells. J. Electrochem. Soc. 161, A1499–A1507. doi: 10.1149/2.0051410jes
Zhang, X., Klein, R., Subbaraman, A., Chumakov, S., Li, X., Christensen, J., et al. (2019). Evaluation of convective heat transfer coefficient and specific heat capacity of a lithium-ion battery using infrared camera and lumped capacitance method. J. Power Sources 412, 552–558. doi: 10.1016/j.jpowsour.2018.11.064
Zhao, R., Zhang, S., Liu, J., and Gu, J. (2015). A review of thermal performance improving methods of lithium ion battery: electrode modification and thermal management system. J. Power Sources 299, 557–577. doi: 10.1016/j.jpowsour.2015.09.001
Keywords: Li-ion battery, thermal transient, lithium plating, jellyroll collapse, accelerated rate calorimetry, differential voltage
Citation: Carter R, Klein EJ, Kingston TA and Love CT (2019) Detection of Lithium Plating During Thermally Transient Charging of Li-Ion Batteries. Front. Energy Res. 7:144. doi: 10.3389/fenrg.2019.00144
Received: 30 August 2019; Accepted: 19 November 2019;
Published: 05 December 2019.
Edited by:
Matthieu Dubarry, University of Hawaii, United StatesReviewed by:
Xiangming He, Tsinghua University, ChinaGeorge Baure, University of Hawaii at Manoa, United States
Copyright © 2019 Carter, Klein, Kingston and Love. This is an open-access article distributed under the terms of the Creative Commons Attribution License (CC BY). The use, distribution or reproduction in other forums is permitted, provided the original author(s) and the copyright owner(s) are credited and that the original publication in this journal is cited, in accordance with accepted academic practice. No use, distribution or reproduction is permitted which does not comply with these terms.
*Correspondence: Corey T. Love, Y29yZXkubG92ZUBucmwubmF2eS5taWw=