
94% of researchers rate our articles as excellent or good
Learn more about the work of our research integrity team to safeguard the quality of each article we publish.
Find out more
ORIGINAL RESEARCH article
Front. Energy Res., 05 November 2019
Sec. Indoor Environment
Volume 7 - 2019 | https://doi.org/10.3389/fenrg.2019.00122
This article is part of the Research TopicNew Materials and Design of the Building EnclosureView all 7 articles
Cool/white roofing systems use paints and membranes with high solar reflectivity to reflect a portion of the incident solar radiation resulting in lowering the temperature of the exterior surfaces in respect of the conventional/black roofing systems. This study focuses on the energy performance of roofing system that is being used in buildings of the Gulf Cooperation Council countries when this roof is exposed to a hot and humid climatic conditions in Saudi Arabia. The long-term moisture performance of the white and black roofing systems were investigated in a previous study in which the results showed that no risk of condensation and mold growth occurred in the roofs with different values of solar reflectivity of the rooftop and different initial construction moisture. With the same environmental conditions that were used in the previous study, the focus of this paper is on assessing the energy performance of white and black roofing systems for a wide range of: (a) thermal insulation thickness, and (b) solar reflectivity of the rooftop. Also, considerations are given in this study to develop a practical design tool that can easily be used by building engineers and architects for determining all pairs of the insulation thickness and the corresponding solar reflectivity of the reflective roofing materials/coatings that resulted in the same levels of the energy performance as those for the black roofing systems of thicker insulation thickness. The results of this study along with the developed practical design tool can be used in future to upgrade the Saudi building code to allow using less insulation in the roofs if white roofing systems are installed.
The global warming phenomenon and its consequences are among some issues that we currently face. This has resulted in many environmental problems such as increased precipitation intensity, increased greenhouse gas emissions, and as well higher atmospheric temperatures. Research studies in China has indicated that urban heat island effect contributed to climate warming by about 30% (Zhao, 2011; Huang and Lu, 2015). The short-wave solar radiation is one of the main drivers of urban heat islands. For example, urban surfaces reflect less solar radiation back to the atmosphere compared to vegetation and other natural ground cover. They instead absorb and store more of solar energy resulting in an increase in the surrounding temperature (Oleson et al., 2010; U.S. Environmental Protection Agency (EPA), 2010, 2018a; Peltier et al., 2018). In accordance with the U.S. Environmental Protection Agency (EPA) (2018a), the yearly average temperature of the air in a city with one million people or more can be 1–3°C warmer than its surroundings. However, during the evening, the difference can be as high as 12°C as a result of the built environment radiates the absorbed heat during the day [U.S. Environmental Protection Agency, 2008a]. It is important to point out that higher surrounding temperature basically means not only a greater demand for air conditioning (A/C) systems but also a lower coefficient of performance of the A/C systems resulting in more energy consumption to run these systems. Consequently, thermal power stations burn more fossil fuels and thus generate additional carbon emissions. Urban heat islands are hot and more polluted. This is because smog forms from the photochemical reactions of pollutants in the air, and the rate of these chemical reactions are more likely to increase at higher air temperatures. The incidents of smog increase in some cities by 3% for everyone degree the temperature increase above 21°C (Peltier et al., 2018).
According to the U.S. EPA (U.S. Environmental Protection Agency (EPA), 2018b), there are five main strategies to help mitigate the urban heat island effects. These strategies are:
1) Increasing trees and vegetative cover in urban areas in which the urban heat island effect can occur. Providing shade and cooling through evapotranspiration, however, help lower the surface and air temperatures.
2) Using cool/reflective pavements on sidewalks, parking lots, and streets to reflect more solar radiation back to the environment. The cool pavements result in lower temperatures for the pavement surfaces and surrounding air than conventional/black pavements.
3) Utilizing smart growth practices. These practices cover a range of conservation strategies and development that help protect the natural environment [U.S. Environmental Protection Agency (EPA), 2019].
4) Installing green roofing systems by growing a vegetative layer (e.g., plants, shrubs, grasses, and/or trees) on the rooftops (U.S. Environmental Protection Agency, 2008b). The vegetative layers provide shade and also absorb heat from the surrounding air through evapotranspiration. This helps reduce the rooftop and ambient air temperatures. By July 2012, about 59,000 green homes had been completed in the United States (Boral Roofing LLC, 2019).
5) Installing cool/white/reflective roofing systems, which is the focus of this study. As provided in many previous studies and this study as well, the cool roofing systems use roofing membranes or coatings with high short-wave solar reflectivity so as to reflect sunlight and heat away from the buildings, and hence reduce the cooling energy loads. This can reduce the dependence on the fossil fuels, which results in a reduction of the carbon footprint. Building owners and roofing contractors in the US have used different types of reflective roofing systems for more than 20 years (U.S. Environmental Protection Agency, 2008a).
In the building sector, energy consumption is high and although the situation differs from one country to another, buildings consume around 30–50% of the total energy (European Commission, 2010; Vrachopoulos et al., 2012). A significant amount of energy is used for cooling the buildings in the Gulf Cooperation Council countries. For example, in 2004, the building sector accounted for 90% of Kuwait's electricity consumption and the residential sector was responsible for more than 70% of the peak electricity demand in Kuwait (Krarti and Hajiah, 2011). As such, the design of the building envelopes (roofs, walls, and fenestration systems) in order to achieve energy savings can not only reduce energy consumption and hence energy demand over time, but also contribute to the fight against global warming. This paper focuses on the energy performance of only one part of the building envelope, which is the roofing system.
Many research studies (Solecki et al., 2005; European Commission, 2010; Jo et al., 2010; Levinson et al., 2010; Ray and Glicksman, 2010; Urban and Roth, 2010; Zirkelbach et al., 2010; Bentz, 2011; Durhman et al., 2011; Ismail et al., 2011; McHugh and Petrick, 2011; Vrachopoulos et al., 2012; Xu et al., 2012; Hutchinson, 2018) investigated the benefits of installing reflective and green roofing systems on the energy savings, and reducing the urban heat islands, local air pollution, and greenhouse gas emissions. When a building with modified-bitumen roof was subjected to the climates of Boston, Ray and Glicksman (2010) showed that it was possible to save 13% of energy by doubling the amount of insulation, however, saving 12% of energy was possible by replacing this roof by a green roof. For white roofing systems, Akbari et al. (1999, 2000) investigated the effect of the short-wave solar absorption coefficient (αs) of the rooftops on the heating and cooling energy loads of commercial and residential buildings in the US. Their results showed that about half the amount of the insulation can be saved by decreasing αs from 0.8 to 0.4 for a one-story single-family building. Levinson and Akbari (2010) studied the potential benefits related to installing white roofing systems in 236 US cities. With white roofing systems, their results showed the annual savings in the energy cost was $0.356 per square meter of the roof area (nationally).
Because white roofing systems work at low temperatures due to the reflection of part of the incident solar radiation, which depends on the value of αs of the rooftop, moisture can accumulate in these roofs, and the summer season may not be sufficient to dry them (Bludau et al., 2009; Brehob et al., 2011; Ennis and Kehrer, 2011; Saber et al., 2011b, 2012c). This may cause deterioration and mold growth in the white roofing systems. As such, it is important for a given climate to use the appropriate reflective roofing material or coating when designing white roofing systems that can lead to energy savings at no risk of moisture-related problems. Brehob et al. (2011) studied the properties of reflective coatings (containing ceramic particles) that can be used in the white roofing systems. Their results showed that the value of αs is the essential feature for choosing the type of the coatings. For a number of climatic conditions, Ennis and Kehrer (2011) studied the moisture performance of black roofing systems with αs = 0.9 and white roofing systems with αs = 0.3. During the winter, their results showed that the accumulated moisture in the white roofing system was more than twice that in the black roofing system. However, the accumulated moisture during the winter dried out completely during the summer. For Chicago, Phoenix, Holzkirchen and Anchorage climates, Bludau et al. (2009) studied the accumulation of moisture in black and white roofing systems over a 5-year period. In that study, the black roofing systems were simulated with αs = 0.88, whereas the white roofing systems were simulated with αs = 0.2. The results showed that white roofing systems always work with higher moisture than black roofing systems (Bludau et al., 2009). For a number of climatic conditions in the US and Canada, Saber et al. (2011b, 2012c) investigated the moisture accumulation in black roofing systems (αs = 0.88) and white roofing system (αs = 0.2). For the climates of Saskatoon and St John's, the results showed that the white roofing systems could lead to long-term moisture-related problems (Saber et al., 2011b).
For the case of initial construction moisture, Bludau et al. (2010) studied the moisture performance of black roof (αs = 0.9) and white roof (αs = 0.2). Their results showed that the drying capacity was lower in the white roof compared to black roof. With different values of initial construction moisture, and wide range of insulation thickness (δins) and wide range of αs, most recently Saber et al. (2019b) investigated the long-term moisture performance of roofing systems when these roofs were subjected to Saudi climates. The results showed that black roofing systems always perform with lower moisture than white roofing systems. However, the highest relative humidity values in these roofs were well below 80% resulting in no risk of condensation and mold growth occurred in these roofs (Saber et al., 2019b).
The exterior surfaces of the roofing systems are exposed to several environmental factors specific to the local climate such as dirt, wind, sunlight, snow, rain, outdoor temperature, relative humidity, and cloud index. All these environmental factors and roofing specifications (materials, dimensions, etc.) contribute to the variations in the thermal and moisture performance of the roofs. Figure 1 shows that when the incident solar radiation hits a roof surface, part of the solar radiation is reflected to the environment and the other part is absorbed by the roofing system. The absorbed part of solar radiation results in increasing the surface temperature of the roof, thereby increasing the cooling energy load in summer and decreasing the heating energy load in winter. As indicated earlier, white roofing systems use bright surfaces with high short-wave solar reflectivity to reflect a significant part of the solar radiation, thus lowering the rooftop temperature and the cooling energy load compared to conventional roof systems.
With the new advanced technology of radiative cooling materials that can be used as reflective materials in white/cool/radiative roofing systems (Kubota, 2017; Knoss, 2019; SurfaPaint ThermoDry Elastomeric Roof Paint., 2019), their short-wave solar absorption coefficients are very small and close to zero, and long-wave thermal emissivities are very high and close to 1.0 (i.e., behaves approximately as blackbody in emitting thermal energy from the reflective material to the environment). For example, Kubota and his team from Stanford University (Kubota, 2017) have recently used a multilayer optical film that reflected about 97% (i.e., the short-wave solar absorption coefficient, αs = 0.03) of the sunlight. Due to the high long-wave thermal emissivity, their material was simultaneously being able to emit the surface's thermal energy through the atmosphere. As well, Knoss and his team from University of Colorado Boulder (Knoss, 2019) developed a new material that can reflect most of the incoming solar rays back into the atmosphere (i.e., αs ≈ 0.03); while it still providing a means of emitting its surface thermal energy to the environment.
Fernandez and his team from Pacific Northwest National Laboratory (PNNL) (Fernandez et al., 2015) have used the radiative cooling material that was developed by Stanford University team (Kubota, 2017) to investigate the potential energy savings as results of using this material against using the best cool roof surfaces on the market. Their simulation results using EnergyPlus model showed that using this radiative cooling material has resulted in electricity saving of 10 MWh in Miami, 13 MWh in Las Vegas, 8 MWh in Los Angeles, 3 MWh in San Francisco and 6 MWh in Chicago, per year, which represented 9, 16, 23, 22, and 14% of cooling electricity savings, respectively, in the above five cities (Fernandez et al., 2015). As provided in ASHRAE (2005), most of construction materials have a surface emissivity of 0.9. In this study, the value of the long-wave emissivity of the rooftop was taken equal 0.9. This value is same as that taken in many previous studies related to assessing the energy and moisture performance of black and white roofing systems [e.g., (Bludau et al., 2009, 2010; Saber et al., 2011b, 2012c, 2019b)].
The dust and/or dirt accumulations on the rooftops can reduce their short-wave solar reflectivity, leading to an increase in solar heat gain. Various studies and field test measurements investigated the effect of aging factors and dust and/or dirt accumulations on the changes in the rooftop properties (Akbari et al., 2005; Levinson et al., 2005; Berdahl et al., 2008; Suehrcke et al., 2008; Algarni and Nutter, 2015). With regard to the accumulation of dirt, various cleaning methods are available to bring the short-wave solar reflectivity of the roof surfaces to their original values. In the experimental study by Levinson et al. (2005), different cleaning processes were applied on light-colored roofing membrane samples (collected from roofs across the US) in order to study the effect of these cleaning processes on their short-wave solar reflectivity. The results of that study showed that inorganic carbon and black carbon were found on the sample surfaces, which led to reductions in their short-wave solar reflectivity. The cleaning processes applied to the surfaces of the samples included wiping process to mimic the wind action, rinsing to mimic the operation of the rain, washing with a dishwashing detergent to mimic homemade cleaning, and finally treating the surfaces of the samples with a mixture of sodium hydroxide and sodium hypochlorite to mimic professional cleaning. By applying the rinsing process and washing process, the dirt on the surfaces was removed, with the exception of a thin layer of contaminants. With the bleaching process, however, the layer of contaminants was removed, whereby the original short-wave solar reflectivity of these surfaces were restored (Levinson et al., 2005).
In another study (Akbari et al., 2005), the same cleaning processes that were developed by Levinson et al. (2005) were applied on 41 samples of unweathered (i.e., new materials) and weathered white membranes. These membranes were collected from different locations across the US and Canada where 16 samples were analyzed at Lawrence Berkeley National Laboratory, and 25 samples were analyzed at the National Research Council of Canada. The results showed that ~90% of the short-wave solar reflectivity of these samples were recovered (Akbari et al., 2005). Currently, an experimental study is being conducted on a number of coatings and reflective roofing materials when they are subjected to the natural dusty and highly polluted climate of Jubail Industrial City in Saudi Arabia. The main goals of that study are to: (a) investigate the changes in the short-wave solar reflectivity of these materials (b) develop cleaning technical guide for these materials, and (c) quantify the impact of dirt/dust accumulations on the overall thermal and moisture performance of the roofing systems. The results of that study will be published at a later date.
Automatic indoor air temperature control with an Optic-Variable Wall (OVW) was recently proposed by Wang et al. (2018) to reduce the HVAC (Heating, Ventilation & Air-Conditioning) energy consumption in containers. The external surface of the OVW is coated by a layer called “responsive coating.” Within the wavelength region of visible light, the characteristic of this responsive coating on the absorption and the reflection of solar radiation is sensible to its temperature. The surface characteristic of the responsive coating is quite attractive in building applications. This is because at high temperature, the responsive coating shows strong reflection (i.e., low short-wave solar absorption coefficient) to the solar radiation exposing on the OVW; while the solar reflection becomes weak (i.e., high short-wave solar absorption coefficient) at low temperature.
Wang et al. (2018) verified experimentally under natural winter conditions (i.e., low ambient temperature) the feasibility of the OVW performance on air temperature control inside a container. The test results showed that the color of OVW varies from dark at low temperature to light at high temperature, where the solar reflectivity of OVW was small at low temperature and high at high temperature. In addition, with the adoption of the OVW, their theoretical investigation on the air temperature inside a container showed that it was possible to simultaneously keep air cool in summer and warm in winter.
In another study, Wang et al. (2019a) theoretically investigated the effect of responsive coating properties on the potential of energy saving with OVW for stable air temperature control in buildings. The results of that study showed that with the adoption of the OVW, the heating load and cooling load could be simultaneously reduced. Furthermore, the results showed that the cooling load was reduced compared to optic-fixed wall having a constant low solar reflectivity, and as well the heating load was reduced compared to optic-fixed wall having a constant high solar reflectivity.
Wang et al. (2019b) conducted dynamic simulation to investigate the effect of the OVW having responsive coating on the façades of high-rise residential buildings when these buildings were subjected to the climatic conditions of Shanghai and Paris. The results showed that the potential use of the responsive coating on the south walls (or facing equator) resulted in more contribution to the energy saving than walls of other orientations. Also, the results showed that the contribution of the responsive coating to energy savings for the climatic conditions of Shanghai was (17%) about twice of that for a colder climatic conditions of Paris (8%).
By allowing more absorption of the solar radiation in winter while maintaining high solar reflection in summer, the concept of the responsive coating when it is applied on the rooftops would simultaneously result in reducing the cooling load during the summer season and as well reducing the heating load during the winter season. For a wide range of the short-wave solar absorption coefficient of the rooftop (0–0.88) and a wide range of insulation thickness [0–8″ (203 mm)], this study focused on the energy performance of a roofing system, that is commonly used in the buildings of the Gulf Cooperation Council countries, when it was subjected to Saudi hot and humid climates. Each value of the short-wave solar absorption coefficient was taken constant through the whole year. This represents the case of installing optic-fixed roof. Under different climatic conditions, a future study is recommended to compare the overall energy savings as a result of installing responsive coating on the rooftop (i.e., optic-variable roof) against the overall energy savings for the case of using optic-fixed roof (i.e., similar to this study).
In short, a logical step toward achieving energy-efficient buildings is to design roofing systems that offer potential energy savings at low risk of condensation and mold growth. The main parameters that affect the hygrothermal performance of the roofing systems are roof type, climate conditions (wind, sunlight, snow, rain, etc.), amount of insulation and the value of αs for the rooftop. With regard to the accumulation of dust and dirt on the rooftops, some cleaning processes are currently available that can be used to bring their short-wave solar reflectivity to approximately their initial values.
Due to reflecting part of the incident short-wave solar radiation, white roofing systems run at lower rooftop temperatures in respect of black roofing systems. For the type of the roofing system shown in Figure 2 that is commonly being used in buildings of the Gulf Cooperation Council countries, the questions are:
a) Do white roofing systems having different amount of insulation lead to moisture-related problems when they subjected to Saudi climates?
b) For the same amount of insulation, what is the amount of energy saving as a result of using white roofing systems (having different reflective materials and coatings) in place of the black roofing system?
c) What is the minimum amount of the insulation in white roofing system that results in the same energy performance as that for black roofing system with thicker insulation thickness?
This study is an extension of a previous study (Saber et al., 2019b) in which a hygrothermal model was developed to investigate the thermal and moisture performance of white and black roofing systems. That model was validated against experimental data, and its predictions were in good agreements with the test data. The full descriptions of the model, its validations, initial conditions, boundary conditions, simulation periods, and simulation parameters that include the material properties of all layers of the roofing system, indoor conditions, and outdoor conditions are available in (Saber et al., 2019b). In that study (Saber et al., 2019b), the model was used to address the question in (a) above for the black and white roofing systems shown in Figure 2. With different values of initial construction moisture, the results of the long-term moisture performance of the black and white roofing systems showed that no risk of moisture-related problems occurred (see Saber et al., 2019b for more details).
In this study, the previously developed and validated model (Saber et al., 2019b) is used to address the questions in (b) and (c) above. Consequently, the main objectives are to:
1) Conduct numerical simulations for the roof shown in Figure 2 with a wide range of δins [0–8″ (203 mm)] and a wide range of αs (0.88–0.05), in order to investigate the energy performance of black and white roofing systems.
2) For the same value of δins, determine the amounts of energy savings as results of installing white roofing systems with different values of αs instead of installing black roofing systems.
3) Use the results obtained in (1) above to determine the reductions in the amount of insulation in white roofing systems having different values of αs that provide the same energy performance levels as those for black roofing systems with thicker insulation thickness.
4) Use all results of this study to develop a practical design tool that can be used for identifying all δins and αs pairs that result in the same levels of energy performance as those for the black roofing systems.
The previously developed hygrothermal numerical model (Saber et al., 2019b) was used in this study to conduct numerical simulations in order to assess the energy and moisture performance of the roofing system shown in Figure 2 for wide ranges of insulation thickness [0–8″ (203 m)] and short-wave solar absorption coefficient (0–0.88) of the rooftop. In the various material layers of different building components, this model solves simultaneously the time dependent 2D and 3D moisture transport equation, energy equation, surface-to-surface radiation equation (e.g., the surface-to-surface radiation in enclosed airspaces in building components having airspace layers such as walls and roofs with reflective insulations, double/triple glazing systems such as windows, curtain walls, and skylight devices), and air transport equation. The air transport equation is the Navier-Stokes equation for the airspace layers (e.g., air cavities), and the Darcy equation (Darcy Number, DN ≤ 10−6) and Brinkman equation (DN > 10−6) for the porous material layers. With and without moisture transport, the model was extensively benchmarked against experimental results from the evaluation of a number of different building component assemblies (Saber et al., 2010a,b, 2011a, 2012a,b; Saber, 2012, 2013a,b,c,d, 2014). Saber et al. (2019a) provided a summary of model validations against experimental data.
In building applications that are similar to this study, the model was used to assess the hygrothermal performance of white and black Modified-Bitumen (MOD-BIT) roofing systems when they were subjected to different climatic conditions of North America (Saber et al., 2011b, 2012c). In the MOD-BIT roofing systems, the surface-to-surface radiation equation and Navier-Stokes equation were solved in the enclosed airspace between the steel deck and the vapor barrier (made of bituminous paper, Type II felt) that was attached to a rigid polyisocyanurate board (Saber et al., 2011b, 2012c). In this study, however, the surface-to-surface radiation equation and Navier-Stokes equation were not solved since there is no airspace inside the roofing system under consideration (see Figure 2).
This study focuses on the energy performance of only one part of the building envelope, which is the roofing system, subjected to the outdoor climatic conditions of the Eastern Province of Saudi Arabia, which is hot and humid climate. For the internal moisture loads, however, the black and cool roofing system were subjected to the indoor conditions that were based on the simple method of the design criteria for moisture control in buildings of ASHRAE Standard 160 (ASHRAE, 2009). This simple method classifies the indoor humidity level into three based on the outdoor temperature. The indoor relative humidity values are estimated to be 40 and 70% when the outdoor temperature is below and equal to −10°C and above or equal to 20°C, respectively. The indoor relative humidity values are computed between 40 and 70% for outdoor temperature between −10 and 20°C.
As indicated earlier, the full details of the long-term moisture performance of the roofing system shown in Figure 2 are available in a previous study (Saber et al., 2019b). At different values of initial moisture content, called “construction moisture,” in white and black roofing systems, subjected to Saudi climate, that study showed that no risk of moisture-related problems occurred in these roofs. As extension to the previous study (Saber et al., 2019b), the results of the energy performance of black and white roofing systems (see Figure 2) for wide ranges of δins and αs are discussed next.
As an example of a roofing system with δins = 6″ (152 mm), Figure 3A shows comparisons of the hourly rooftop temperatures for white roofing systems with αs = 0.05 and black roofing system (αs = 0.88). During the daytime, this figure shows that the high value of αs (i.e., large amount of the absorbed incident solar radiation) for the black roofing system has resulted in its rooftop temperature was greatly higher than that of the white roof with αs = 0.05. Throughout the whole year, the highest rooftop temperature for the black roof (occurred in August) was 91.5°C compared to 50.8°C for the white roofing system of αs = 0.05. However, during the night, the rooftop temperatures of the black roof and white roof were roughly the same. For a wide range with αs (0.88–0.05), Figure 4 shows the monthly average rooftop temperature of roofing systems with δins = 6″ (152 mm). As shown in this figure, the monthly average rooftop temperature increases with increasing αs. The highest values of these temperatures occurred in July followed by August. In July, the highest average rooftop temperature for the white roofing system with αs = 0.05 (39.1°C) was 11.3°C lower than that of black roofing system (50.4°C).
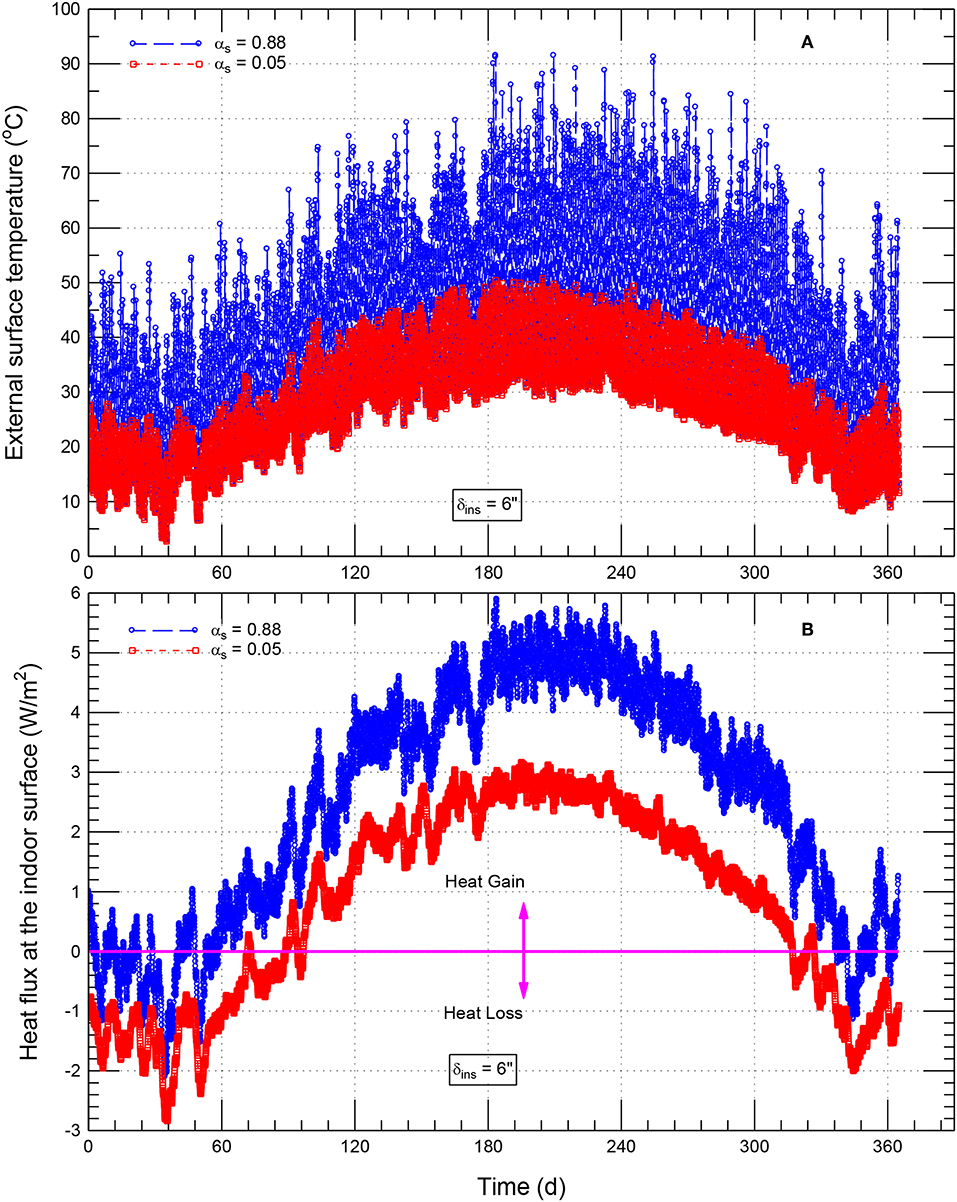
Figure 3. Comparison of: (A) hourly rooftop temperature and (B) hourly indoor surface heat flux of white and black roofing systems [δins = 6″ (152 mm)].
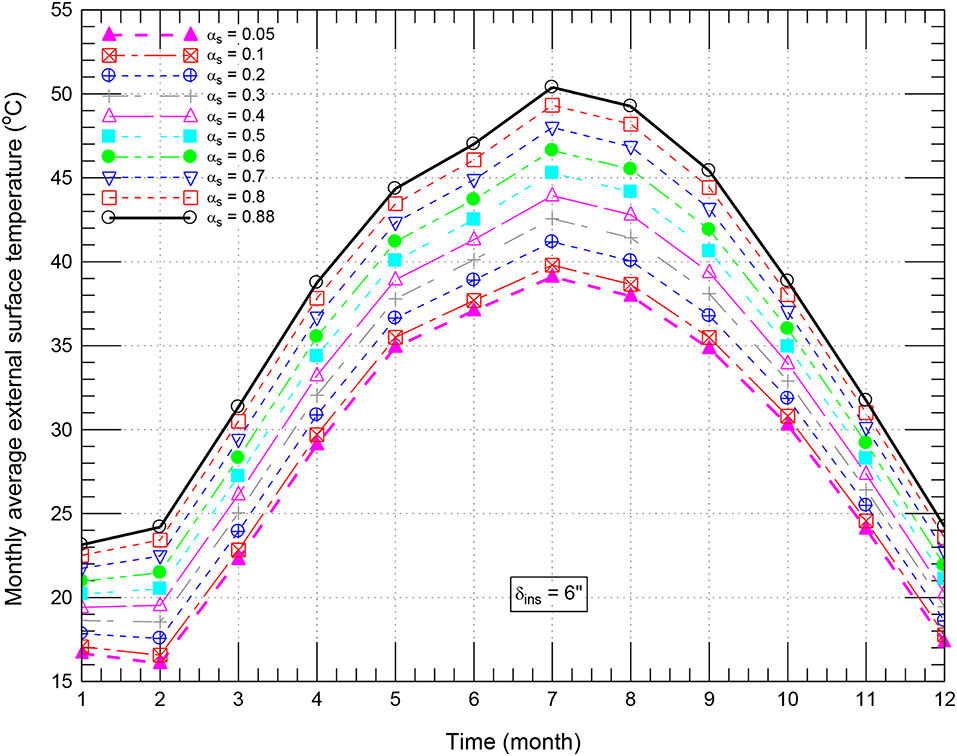
Figure 4. Comparison of monthly average rooftop temperatures of roofing system for a wide range of αs [δins = 6″ (152 mm)].
On the indoor surface of the black roofing system (αs = 0.88) and white roofing system (αs = 0.05), Figure 3B shows comparisons of the hourly heat fluxes. In this figure, when the heat flux is positive, this is called “heat gain” (i.e., heat enters the building where the system contributes to the cooling energy load). However, when the heat flux is negative, this is called “heat loss” (i.e., the heat leaves the building where the system contributes to the heating energy load). Throughout this paper, unless otherwise specified, the terms of cooling energy load, heating energy load and total energy load represent the contributions to the energy loads from the roofing system only. As can be seen in Figure 3B, because of the high rooftop temperature of the black roofing system (see Figure 3A), its heat gain is considerably higher than that of the white roofing system. Throughout the whole year, the highest hourly heat gain for black roofing system was 5.90 W/m2, which was 1.86 times that for white roofing system with αs = 0.05 (3.17 W/m2). However, the highest hourly heat loss throughout the year for the black roof was 2.11 W/m2, 0.74 times that for the white roofing system (2.84 W/m2). Accordingly, a black roof requires a higher cooling load than that with white roof. Conversely, a black roof requires lower heating load than that with white roof. In Saudi Arabia, the high heat gain takes place during peak electrical demand periods that occur in summer. Thus, installing white roofing systems can help reduce the peak electricity demand. It is important to point out that decreasing the energy consumption during the period of peak electricity demand can also reduce demand fees that some utilities charge.
The hourly heat fluxes on the indoor surface [e.g., see Figure 3B) for the case of roofing systems with δins = 6″ (152 mm)] were used to determine the monthly cooling and heating loads for wide ranges of δins, [0–8″ (203 mm)] and αs (0.88–0.05). As examples of roofing systems with different values of αs and having δins of 2″ (51 mm), 4″ (102 mm), 6″ (152 mm), and 8″ (203 mm), Figures 5A–D, respectively, show the monthly cooling loads (+ve values) and the monthly heating loads (–ve values). In cold climates, the energy sources needed for heating the residential buildings are frequently fossil fuels; while those needed for the cooling loads are electrical energy. Because of the difference in prices per thermal unit due to using fossil fuels and the electrical energy, the heating load and the cooling load must be specified individually (Bludau et al., 2009; Saber et al., 2011b, 2012c). In hot climates such as that in Saudi Arabia, however, the energy sources for both heating and cooling loads are mainly electrical energy. So, the total load can be obtained as the sum of the heating load and cooling load (see Figures 6A–D) for roofs having different values of δins.
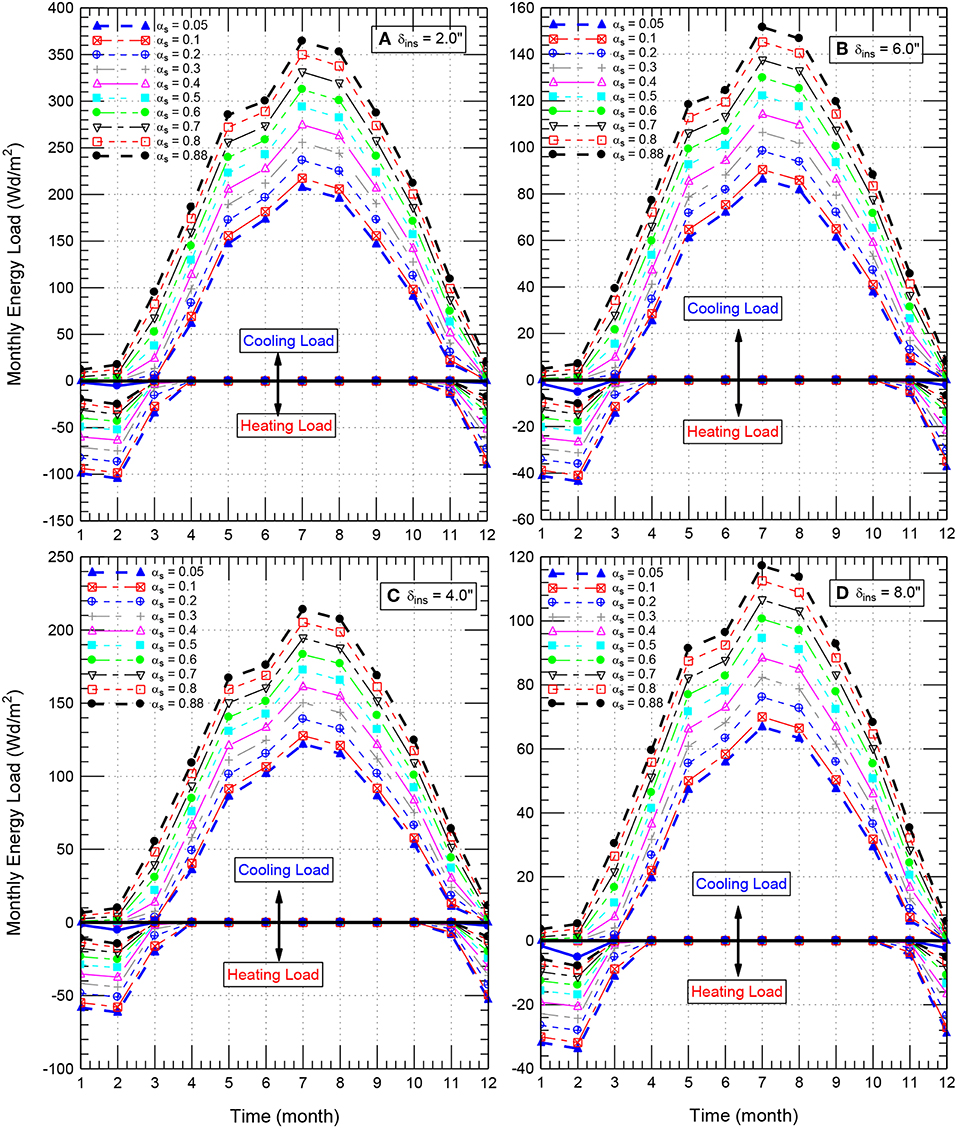
Figure 5. Monthly energy loads for a wide range of αs of roofing systems having insulation thickness of: (A) 2.0″, (B) 4″, (C) 6.0″, and (D) 8″.
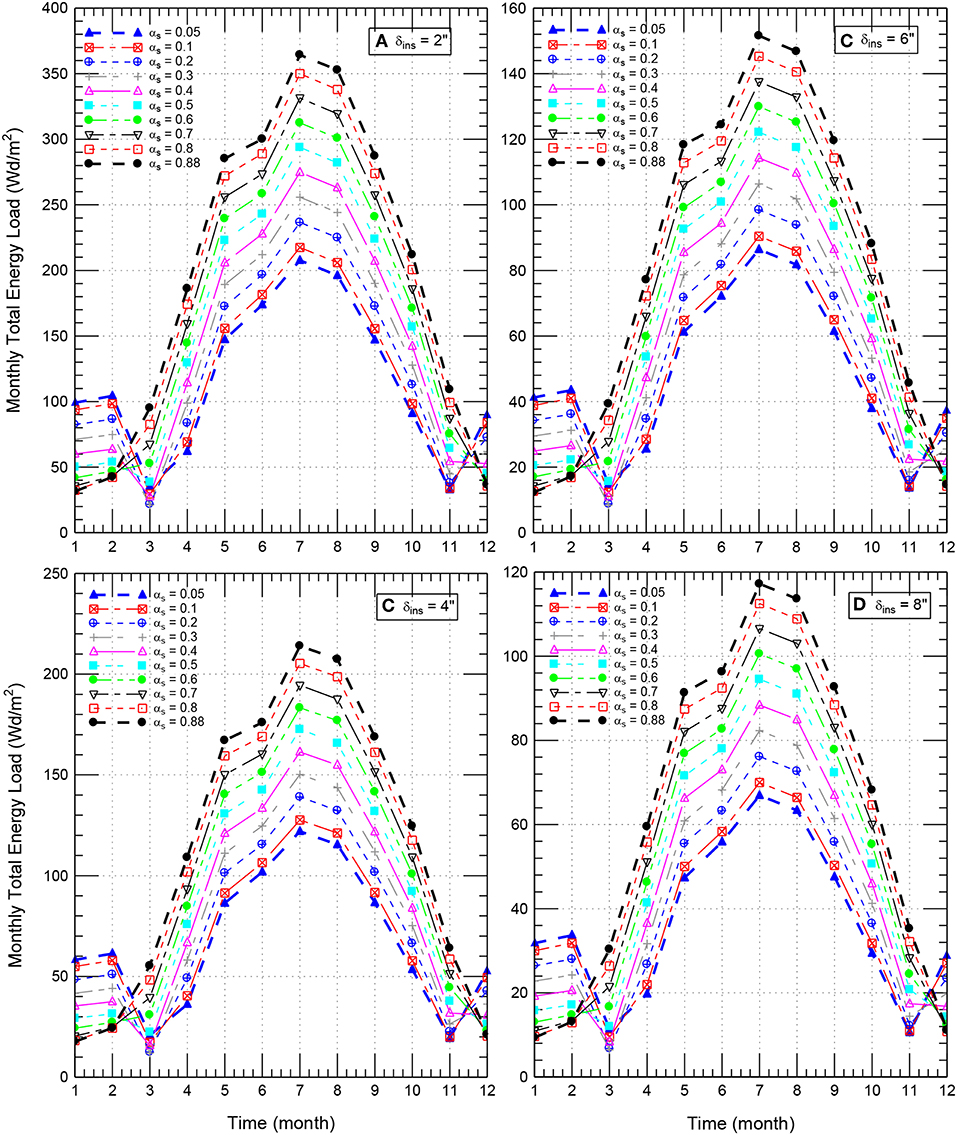
Figure 6. Monthly total energy loads for a wide range of αs of roofing systems having insulation thickness of: (A) 2.0″, (B) 4″, (C) 6.0″, and (D) 8″.
For a given value of δins, Figures 5A–D show that the monthly cooling load decreases with decreasing αs. Conversely, the monthly heating load increases with decreasing αs. For a given value of αs, because the highest rooftop temperatures occurred in July (see Figure 4), Figures 5A–D show that the highest cooling load occurred in July, followed by August. In July, the cooling loads for the black roofing systems (αs = 0.88) having δins of 2″ (51 mm), 4″ (102 mm), 6″ (152 mm), and 8″ (203 mm), were 364, 214, 152, and 117 Wd/m2, respectively. For white roofing systems with αs of 0.2, the corresponding cooling loads were 237, 139, 98, and 76 Wd/m2, respectively. Additionally, for white roofing systems with αs of 0.05, the corresponding cooling loads were 208, 122, 86, and 67 Wd/m2, respectively. For different values of δins, these represent energy savings in the monthly energy loads by 35 and 43%, respectively, as results of using white roofing systems with αs of 0.2 and 0.05 instead of black roofing systems (αs = 0.88).
Note that the largest share of electricity consumption in buildings is used for cooling in Saudi Arabia (e.g., see Figure 5). This may cause significant strain on the country's electricity grid during the summer. The Saudi Electricity and Cogeneration Regulatory Authority has announced that the Council of Ministers has approved gradual revision of energy prices including changes to electricity tariffs that has taken effect on January 1, 2018, where lower energy consumption (1–6,000 kWh/month) are charged at a lower rate of 18 halala/kWh, whereas higher energy consumptions (>6,000 kWh/month) are charged at a higher rate of 30 halala/kWh. Consequently, the Saudi buildings should be designed/retrofitted with the intent of minimizing the cooling energy loads so as to help not only reduce the annual electrical peak demand especially during the summer but also reduce the cost for operating the buildings.
Reflective roofing materials/coatings and roof insulation are not comparable options to enhance the energy performance of buildings. They work differently. Separate decisions must be made by the building owners either to improve roof insulation levels or to install reflective roofing material/coating. For wide ranges of δins [0–8″ (203 mm)] and αs (0.88–0.05), the results for the monthly cooling, heating and total energy loads (e.g., see Figures 5, 6) were used to calculate the yearly cooling loads and yearly total loads. The results provided next show the potential savings (relative to black roofing systems with the same δins) in the yearly loads due to using white roofing systems of different values of αs.
As examples of roofing systems with different values of αs and having δins of 2″ (51 mm), 4″ (102 mm), 6″ (152 mm) and 8″ (203 mm), the results for the yearly cooling and total loads are provided in Figures 7A–D, respectively. For a given δins, these figures show that decreasing αs has resulted in reductions in the yearly cooling and total loads. In addition, for a given αs, increasing δins resulted in reductions in the yearly cooling loads and yearly total loads. For examples, with αs = 0.88 (black roof), 0.2 and 0.05, the yearly cooling and total loads for the roofing system having: (a) δins of 2″ (51 mm) were 2242, 1238, and 1043 Wd/m2, and 2303, 1502, and 1386 Wd/m2, respectively (Figure 7A), (b) for δins of 4″ (102 mm) were 1314, 728, and 614 Wd/m2, and 1350, 883, and 814 Wd/m2, respectively (Figure 7B), (c) for δins of 6″ (152 mm) were 931, 515, and 435 Wd/m2, and 955, 625, and 577 Wd/m2, respectively (Figure 7C), and (d) for δins of 8″ (203 mm) were 720, 399, and 337 Wd/m2, and 738, 484, and 447 Wd/m2, respectively (Figure 7D). For different values of δins, Figures 7A–D show that decreasing αs from 0.88 (black roof) to 0.2 and 0.05 resulted in savings in the yearly cooling loads by 45 and 53%, respectively. As well, the corresponding savings in the yearly total loads were 35 and 40%, respectively.
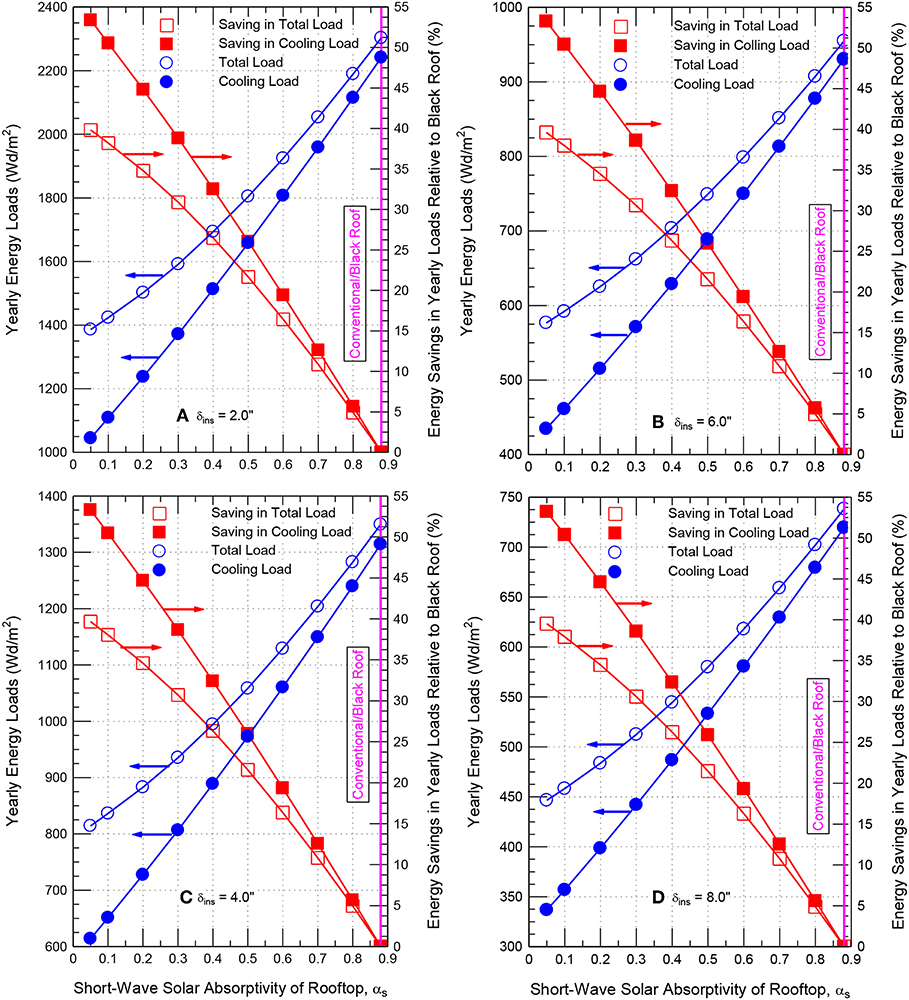
Figure 7. Effect of αs on the yearly cooling and total loads, and energy savings in these loads for roofing systems having insulation thickness of: (A) 2.0″, (B) 4″, (C) 6.0″, and (D) 8″.
This study mainly focuses on the energy performance of only one part of the building envelope, which is the roofing system. As indicated above, using reflective roofing materials/coatings with low αs in Saudi climates has resulted in significant reductions in the yearly energy loads in relation to black roofing systems of the same δins. However, to explore the effect of these reductions on the overall energy requirements for the whole building, another study is currently being conducted to assess the energy performance of the whole building instead of the roofing system only in which the effect of the following factors are accounted for:
1) Details of all building envelope components, namely: (a) roofing systems (b) wall systems, and (c) fenestration systems (windows, skylight devices),
2) Cardinal orientations of the wall systems,
3) Cardinal orientations of the windows,
4) Window-to-wall ratios,
5) Number of stories in the building,
6) Type of the building (attached or detached),
7) Outdoor conditions in which the building is subjected to, and
8) Internal loads, air leakage rate, and lighting.
For black roofing systems (αs = 0.88) of different values of δins, the results of the yearly cooling and total loads are provided in Figure 8. Because the yearly heading load for the case of a black roofing system is much lower than the yearly cooling load, the yearly total load (i.e., heating load + cooling load) is a little higher than the yearly cooling energy load (see Figures 8A,B). For small values of δins [δins ≤ 2″ (51 mm)], Figure 8 shows that the yearly energy loads and the associated reduction rates in these energy loads (i.e., the derivative of the energy load w.r.t. δins, |dYCLB/d δins| and |dYTLB/d δins|, plotted on the right y-axis of Figure 8) significantly decrease with increasing δins. For example, the reduction rates in the yearly energy loads |dYCLB/d δins| and |dYTLB/d δins| were, respectively, 151, 72, and 30 (Wd/m2)/mm for δins of 0.5″ (13 mm), 1″ (25 mm), and 2″ (51 mm). However, for large values of δins (δins ≥ 4), the yearly energy loads and the associated reduction rates in these energy loads slightly decrease with increasing δins. For example, for δins of 4″ (102 mm), 6″ (152 mm), and 8″ (203 mm), the values of |dYCLB/d δins| and |dYTLB/d δins| were, respectively, only 11, 6, and 4 (Wd/m2)/mm.
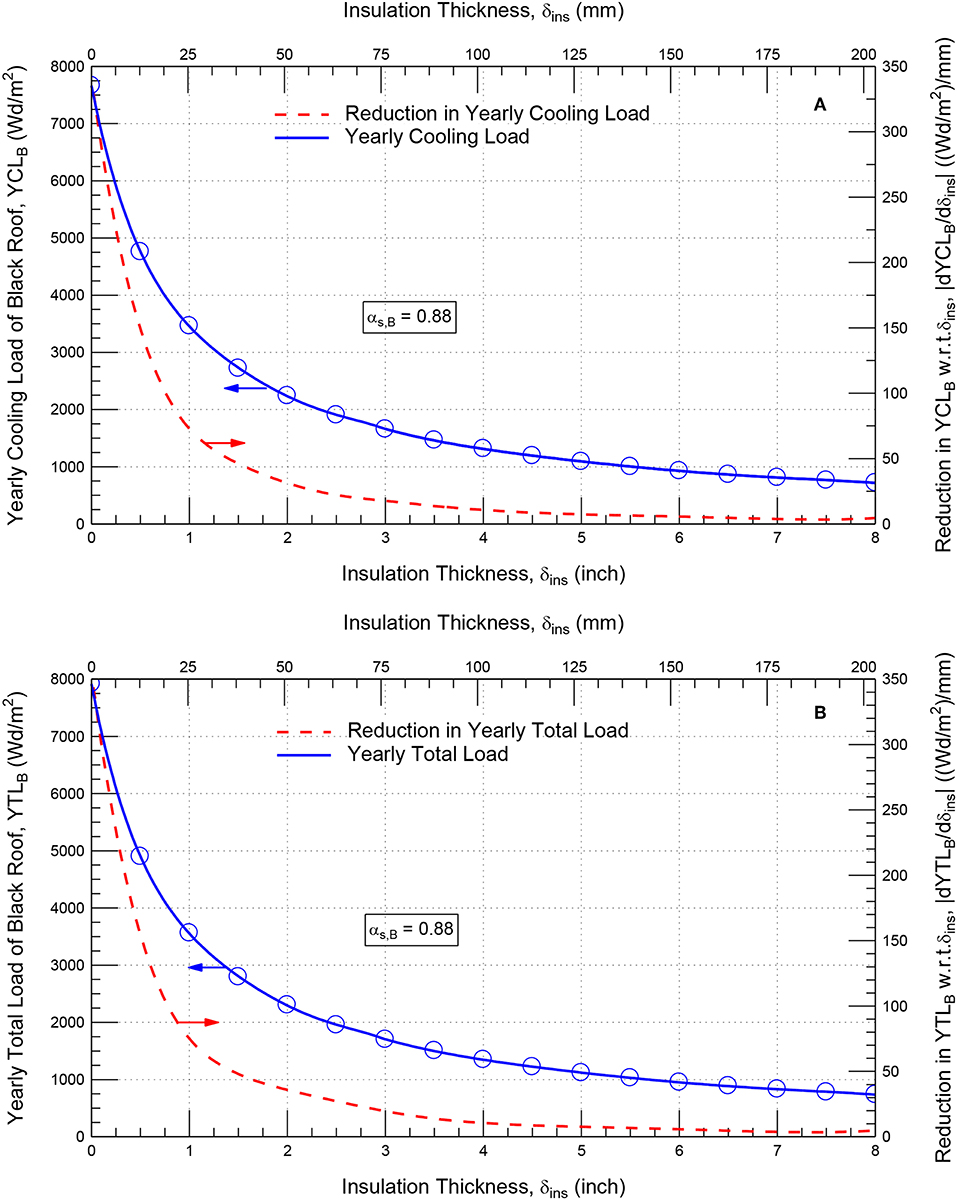
Figure 8. Effect of δins on: (A) the yearly cooling load and reduction in this load, and (B) the yearly total load and reduction in this load with respect to δins for black roofing systems.
For black roofing systems (αs = 0.88) of different values of δins, the yearly cooling energy loads (YCLB) and the yearly total loads (YTLB) that are provided in Figures 8A,B, respectively, can be given as functions of δin as:
The coefficients a0 through a5 in Equations (1) and (2) are listed in Table 1. Also, for specified YCLB and YTLB, the associated value of δins that is needed can be determined from the following correlations:
Where the coefficients a0 through a5 in Equations (3) and (4) are listed in Table 1. Note that in Equations (1) through (4), the units of YCLB and YTLB are in Wd/m2 and the unit of δin is in inch.
Figure 9 shows the results of yearly energy loads for wide ranges of δins and αs. The results of yearly energy loads were used to recognize the δins and αs pairs at which the energy performance of such roofing system with these δins and αs pairs are the same as that for the black roofing system (αs = 0.88). Figure 10A shows the pairs of δins and αs for a number of yearly cooling loads. Additionally, Figure 10B shows the pairs of δins and αs for a number of yearly total loads.
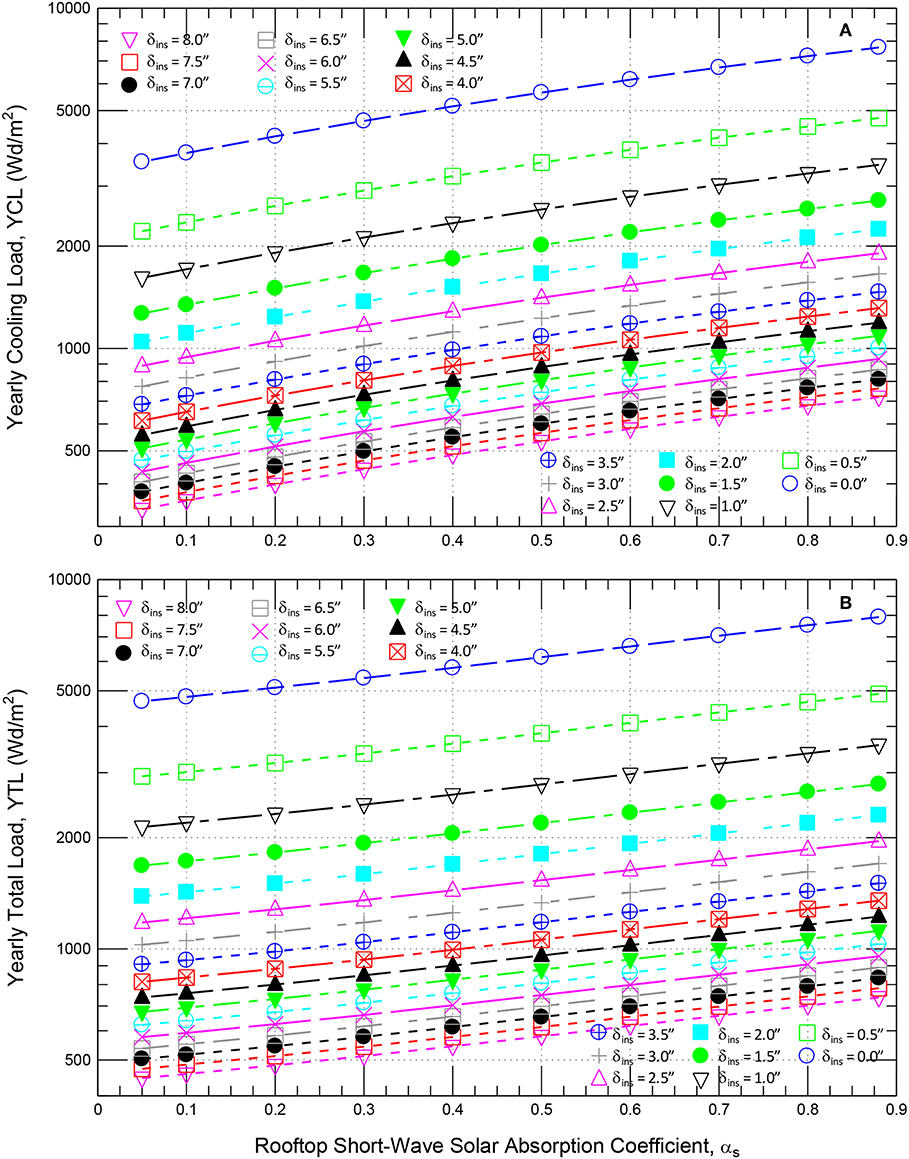
Figure 9. Effect of δins on: (A) the yearly cooling energy load, and (B) the yearly total energy load for wide range αs.
As example, Figure 11A shows that the yearly cooling energy load for a black roofing system (αs = 0.88) having δins = 8″ (203 mm) is 720 Wd/m2. This load can be achieved with the pairs of δins and αs that are given as:
The value of δins in Equation (5) should be in inch. For this yearly cooling load (YCL) of 720 Wd/m2, Figure 11A shows that a 0, 25, 50, and 59% savings in insulation thickness [i.e., δins = 8″ (203 mm), 6″ (152 mm), 4″ (102 mm), and 3.26″ (83 mm)] would require that the value of αs must be, respectively, 0.88 (i.e., black), 0.55, 0.19, and 0.05.
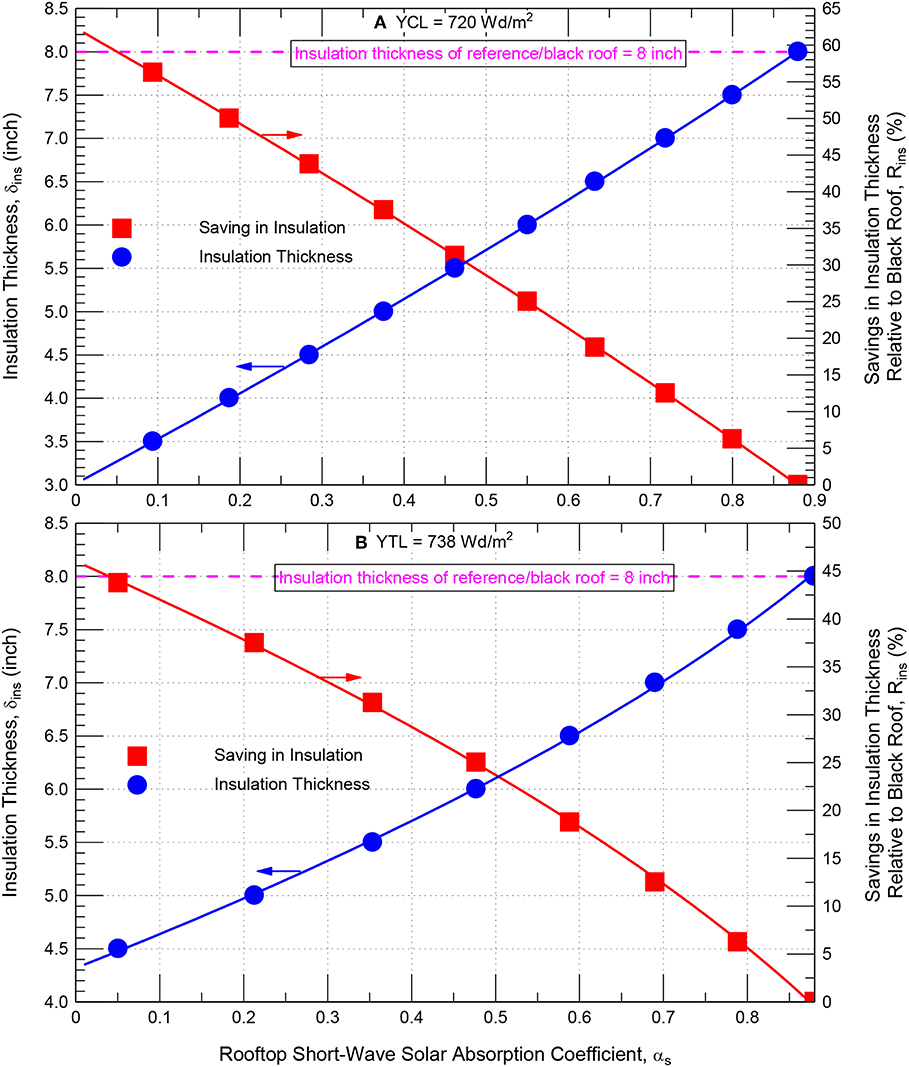
Figure 11. A design chart for all δins & αs pairs, and the associated savings in insulation that provides the same (A) yearly cooling load of 720 Wd/m2 (B) yearly total load of 738 Wd/m2 as black roofing system having δins of 8″.
As an example, a yearly total energy load of YTL = 738 Wd/m2 that relates to a black roofing system with δins = 8″ (203 mm) and αs = 0.88 (Figure 11B) can be obtained with the pairs of δins and αs that are given as:
The value of δins in Equation (6) should be in inch. From Figure 11B or Equation (6) for YTL = 738 Wd/m2, a 0, 12.5, 25, and 44% savings in insulation thickness [i.e., δins = 8″ (203 mm), 7″ (178 mm), 6″ (152 mm), and 4.48″ (114 mm)] would require that the value of αs must be, respectively, 0.88 (i.e., black), 0.70, 0.48, and 0.05. Next, a practical design tool was developed for the roofing system shown in Figure 2 that can be used to determine all δins and αs pairs for different yearly energy loads.
The obtained results for the roofing systems investigated in this study (Figure 2) and having different values of δins [0–8″ (203 mm)] without and with reflective roofing materials/coatings of a wide range of αs (0.05–0.88) were used to develop a practical design tool. This tool can easily be used to determine all possible pairs of δins and αs that resulted in the same yearly cooling and total loads as those for the reference/black roofing systems (i.e., αs = 0.88). Examples of design charts for all possible pairs of δins and αs as well as the corresponding savings in the insulation thickness (in respect of the reference/black roof) that provide the same yearly energy cooling load (YCL = 720 Wd/m2) and yearly total energy load (YTL = 738 Wd/m2) as those for a black roofing system with δins of 8″ (203 mm) are provided in Figures 11A,B, respectively.
For all yearly cooling and total energy loads of roofing systems with a wide range of δins [0–8″ (203 mm)] and wide range of αs (0.05–0.88), the results provided in Figure 9 were used to develop the following correlations:
Where:
• YCLN is the normalized yearly cooling energy load with respect to the yearly cooling energy load of black roofing systems (YCLB), which is given by Equation (1).
• YTLN is the normalized yearly total load with respect to the yearly total energy load of black roofing systems (YTLB), which is given by Equation (2).
• αN is the normalized short-wave solar absorption coefficient of the rooftop with respect the short-wave solar absorption coefficient of black roofing system of αB = 0.88.
Figures 12A,B show that the calculated values of YCLN and YTLN using Equations (7) and (8) are in good agreements with the predicted values of YCLN and YTLN for the wide ranges of δins and αs. Also, the results shown in Figure 9 were used to develop the following correlations:
Figures 13A,B show that for all values of δins [0–8″ (203 mm)] and αs (0.05–0.88) considered in this study, the calculated yearly cooling loads (YCL = YCLN × YCLB) using the correlations given by Equations (1) and (7) and the calculated yearly total loads (YTL = YTLN × YTLB) using the correlations given by Equations (2) and (8) are in good agreements with the predicted values that are provided in Figure 9 (within ± 1%). Note that the correlations developed in this study are applicable for different types of coatings and reflective roofing materials available in the market.
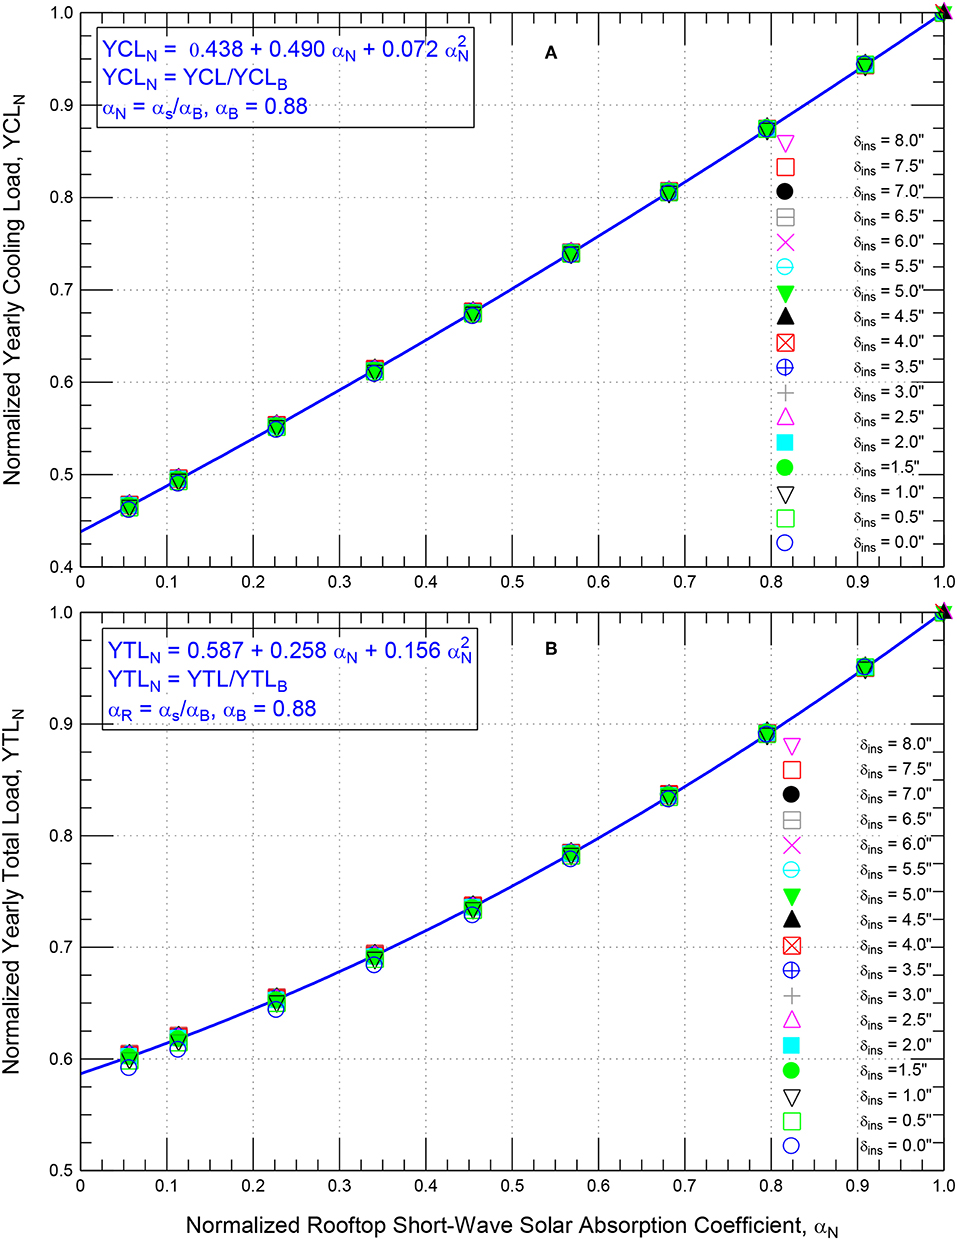
Figure 12. Dependence of: (A) the normalized yearly cooling load and (B) the normalized yearly total load on the normalized rooftop short-wave solar absorption coefficient for roofing systems having different δins and αs.
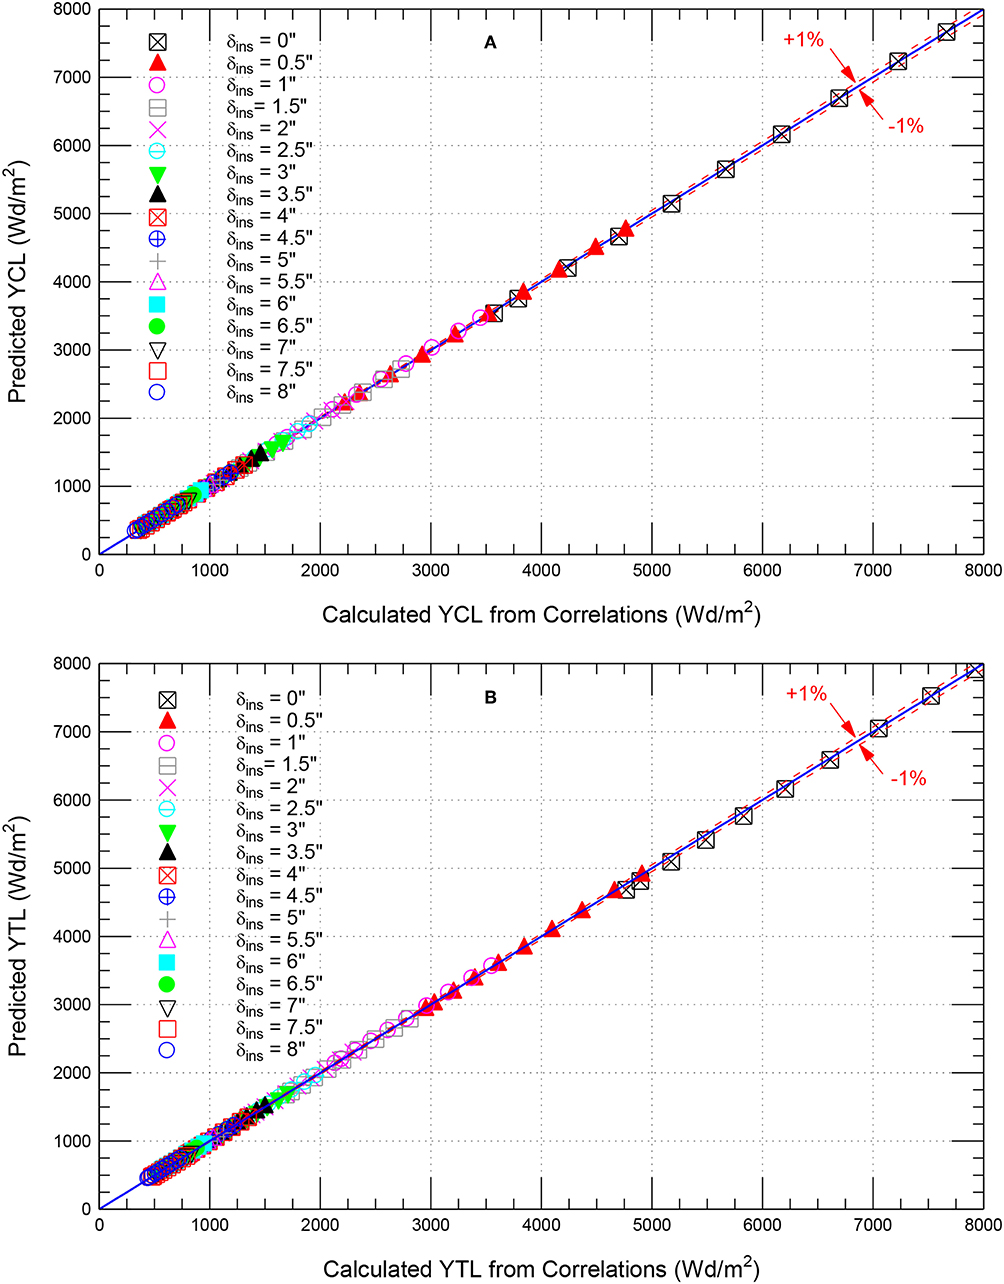
Figure 13. Comparison of model predictions of: (A) yearly cooling loads and (B) yearly total loads with those calculated using Equations (1), (2), (7), and (8).
To obtain the pairs of δins and αs that result in the same yearly cooling energy loads (YCL) and yearly energy total loads (YTL) as those for the reference/black roofing system, the building designer can either:
a) Specify the type of the reflective roofing material (i.e., αs is known) and then follow the simple procedure that is shown in Figure 14A to determine the corresponding value of δins, or
b) Specify the value of δins and then follow the simple procedure that is shown in Figure 14B to determine the corresponding value of αs of the rooftop. Once the value of αs is known, the type of reflective roofing material/coating can be selected accordingly.
Last but not the least, for given reflective roofing material/coating (i.e., the value of αs is known) and value of δins for the roofing system, the correlations given by Equations (1), (2), (7), and (8) can easily be used to determine the yearly cooling and total energy loads as provided by the simple procedure shown in Figure 14C.
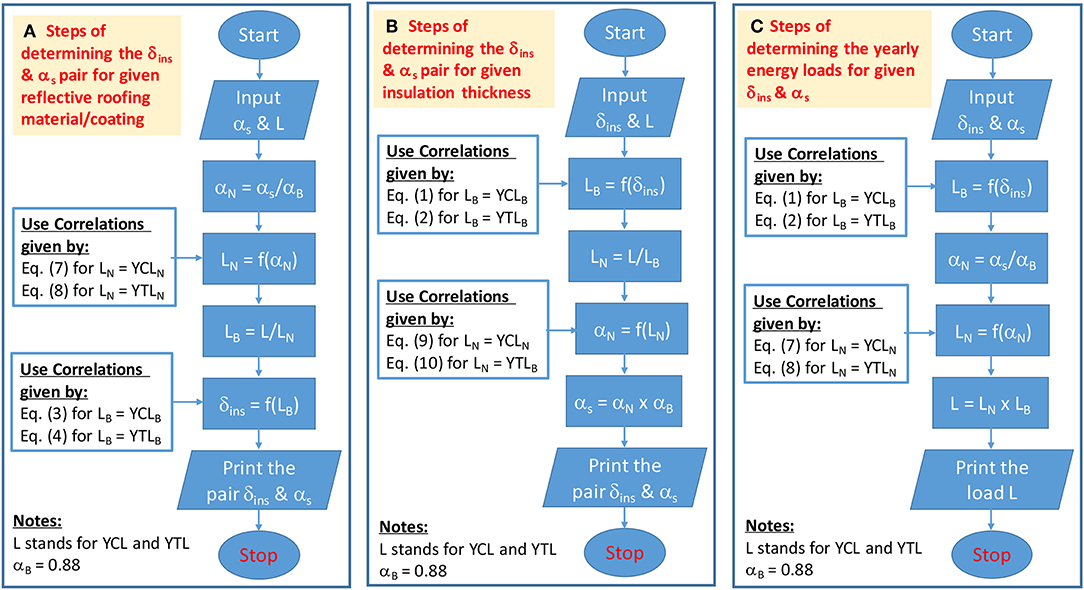
Figure 14. Flowchart for the procedures of determining: (A) the δins & αs pair for given reflective roofing material/coating, (B) the δins & αs pair for given insulation thickness, and (C) the yearly energy loads for given δins & αs.
This study is an extension of a previous study that focussed on assessing the long-term moisture performance of black and white roofing systems. The results of the previous study showed that no risk of moisture-related problems occurred in these roofing systems. The type of the roofing system considered in this and the previous studies is commonly used in the buildings of the Gulf Cooperation Council countries. The model that was developed and validated against experimental data in the previous study was used in this study to assess the energy performance of black and white roofing systems for a wide range of insulation thickness δins [0–8″ (203 mm)] and a wide range of the short-wave absorption coefficient of the rooftop αs (0.88–0.05). For the same value of δins, the results showed that white roofing systems experienced an increase in the heating loads in respect of black roofs. However, the decrease in the cooling loads with white roofing systems was considerably greater than the increase in heating loads. As such, using white roofing systems have resulted in net energy savings compared to black roofing systems. For a given value of δins, the results showed that decreasing the value of αs of the rooftop from 0.88 (black roof) to 0.2 and 0.05 resulted in savings in the yearly cooling loads by 45 and 53%, respectively, and savings in the yearly total loads by 35 and 40%, respectively.
For wide ranges of δins and αs, the results of the numerical simulations were used to recognize all possible pairs of δins and αs that resulted in the same yearly energy loads as those for the black roofing systems of thicker insulation thickness. Also, these results were used to develop a practical design tool that can easily be used to determine all possible pairs of δins and the corresponding αs that resulted in the same yearly energy loads as those for the black roofing systems. This design tool uses a number of correlations that were developed in this study and provided by Equations (1) through (4) and Equations (7) through (10). These correlations are applicable for all values of δins ≤ 8″ (203 mm) and all values of αs ≤ 0.88. The calculated values of all parameters using correlations were in good agreements with the predicted values of these parameters (within ± 1%). The procedure of using this design tool is provided in Figure 14. Additionally, for given δins and αs for the roofing system, the correlations given by Equations (1), (2), (7), and (8) can easily be used to determine the yearly energy loads as described in the simple procedure shown in Figure 14C.
The results of this research study have shown the potential capabilities of using different coatings and reflective roofing materials for: (a) enhancing the energy performance of the roofing systems for a given insulation thickness, and (b) using less amount of insulation that resulted in obtaining the same energy performance levels as those of black roofing systems of thicker insulation thickness. Additionally, they obtained results in this research study can be used in future to upgrade the Saudi building code in order to allow using less roof insulation if white roofing systems are installed.
The raw data supporting the conclusions of this manuscript will be made available by the authors, without undue reservation, to any qualified researcher.
HS is the Principal Investigator, conducted the numerical simulations, and prepared the manuscript. WM conducted literature review, analyzed the data from numerical simulation, and contribute to prepare the manuscript.
The authors declare that the research was conducted in the absence of any commercial or financial relationships that could be construed as a potential conflict of interest.
Akbari, H., Berhe, A., Levinson, R., Graveline, S., Foley, K., Delgado, A. H., et al. (2005). “Aging and weathering of cool roofing membranes”, in Proceedings of the First International Conference on Passive and Low Energy Cooling for the Built Environment (Athens).
Akbari, H., Konopacki, S., and Parker, D. (2000). “Updates on revision to ASHRAE standard 90.2: including roof reflectivity for residential buildings,” in Proceedings ACEEE Summer Study on Energy Efficiency in Buildings, Vol. 1 (Pacific Grove, CA), 11–111.
Akbari, H., Konopacki, S., and Pomerantz, M. (1999). Cooling energy savings potential of reflective roofs for residential and commercial buildings in the United States. Energy 24, 391–407. doi: 10.1016/S0360-5442(98)00105-4
Algarni, S., and Nutter, D. (2015). Influence of dust accumulation on building roof thermal performance and radiant heat gain in hot-dry climates. Energy Build. 104, 181–190. doi: 10.1016/j.enbuild.2015.07.018
ASHRAE (2005). Thermal and Water Vapor Transmission Data, Chapter 25, ASHRAE Handbook of Fundamentals. Atlanta, GA: American Society of Heating, Refrigeration and Air-Conditioning Engineers, Inc.
ASHRAE (2009). ANSI/ ASHRAE Standard 160-2009, Criteria for Moisture-Control Design Analysis in Buildings. Atlanta, GA: American Society of Heating, Refrigeration and Air Conditioning Engineers, Inc.
Bentz, S. P. (2011). “Decision-making process for green options in reroofing,” in Proceedings of the 2011 International Roofing Symposium (Washington, DC).
Berdahl, P., Akbari, H., Levinson, R., and Miller, W. A. (2008). Weathering of roofing materials – an overview. Constr. Build. Mater. 22, 423–433. doi: 10.1016/j.conbuildmat.2006.10.015
Bludau, C., Künzel, H. M., and Zirkelbach, D. (2010). “Hygrothermal performance of flat roofs with construction moisture,” 11th International Conference on Thermal Performance of the Exterior Envelopes of Whole Buildings (Buildings XI Conference) (Clearwater, FL).
Bludau, C., Zirkelbach, D., and Kuenzel, H. M. (2009). Condensation problems in cool roofs. Interface J. RCI XXVII, 11–16. Available online at: http://rci-online.org/wp-content/uploads/2016/04/2009-08-bludau-zirkelbach-kunzel.pdf
Boral Roofing LLC (2019). Available online at: http://www.boralamerica.com/Media/Default/Temp/PDF%20Fills/AIA-CEU-Print-Version.pdf (accessed February, 2019).
Brehob, E., Desjarlais, A., and Atchley, J. (2011). “Effectiveness of cool roof coatings with ceramic particles,” in Proceedings of the 2011 International Roofing Symposium (Washington, DC).
Durhman, A., Collins, M., and McGillis, W. R. (2011). “Utilizing green technology and research to assess green roofing benefits,” in Proceedings of the 2011 International Roofing Symposium (Washington, DC).
Ennis, M., and Kehrer, M. (2011). “The effects of roof membrane coloronmoisture accumulation in low-slope commercial roof systems,” in Proceedings of the 2011 International Roofing Symposium (Washington, DC).
European Commission (2010). Green public procurement thermal insulation technical background reports. Report for the European Commission– DG Environment by AEA, Harwell, Owner, Editor: European Commission, DG Environment-G2, B-1049, Brussels.
Fernandez, N., Wang, W., Alvine, K., and Katipamula, S. (2015). Energy Savings Potential of Radiative Cooling Technologies, Prepared for U.S. Department of Energy under Contract DE-AC05-76RL01830 by Pacific Northwest National Laboratory (Richland). Available online at: https://www.pnnl.gov/main/publications/external/technical_reports/PNNL-24904.pdf (accessed May, 2019)
Huang, Q., and Lu, Y. (2015). The effect of urban heat island on climate warming in the Yangtze river delta urban agglomeration in China. Int. J. Env. Res. Public Health 12, 8773–8789. doi: 10.3390/ijerph120808773
Hutchinson, T. (2018). Cool Roofing Challenging What's Cool. Eco-structure. Available online at: http://www.eco-structure.com/cool-roofing/challenging-whats-cool.aspx (accessed May, 2019).
Ismail, A., Samad, M. H. A., and Rahman, A. M. A. (2011). The investigation of green roofs and white roof cooling potential on single storey residential building in the Malaysian climate. Proc. World Acad. Sci. Eng. Technol. 76, 129–137. Available online at: https://waset.org/publications/3595/the-investigation-of-green-roof-and-white-roof-cooling-potential-on-single-storey-residential-building-in-the-malaysian-climate
Jo, J. H., Carlson, J., Golden, J. S., and Bryan, H. (2010). Sustainable urban energy: development of a mesoscale assessment model for solar reflective roof technologies. Energy Policy 38, 7951–7959. doi: 10.1016/j.enpol.2010.09.016
Knoss, T. (2019). Newly Engineered Material can Cool Roofs, Structures With Zero Energy Consumption. Available online at: https://www.colorado.edu/today/2017/02/09/newly-engineered-material-can-cool-roofs-structures-zero-energy-consumption (accessed October 2019).
Krarti, M., and Hajiah, A. (2011). Analysis of the impact of daylight time savings on energy use of buildings in Kuwait. Energy Policy 39, 2319–2329. doi: 10.1016/j.enpol.2011.01.046
Kubota, T. (2017). A Cooling System That Works Without Electricity. Stanford University. Available online at: https://techxplore.com/news/2017-09-cooling-electricity.html (accessed October 2019).
Levinson, R., and Akbari, H. (2010). Potential benefits of cool roofs on commercial buildings: conserving energy, saving money, and reducing emission of greenhouse gases and air pollutants. Energy Efficiency 3, 53–109. doi: 10.1007/s12053-008-9038-2
Levinson, R., Akbari, H., Berdahl, P., Wood, K., Skilton, W., and Petersheim, J. (2010). A novel technique for the production of cool coloured concrete tile and asphalt shingle roofing products. Solar Energy Mater. Solar Cells 94, 946–954. doi: 10.1016/j.solmat.2009.12.012
Levinson, R., Berdahl, P., Berhe, A., and Akbari, H. (2005). Effects of soiling and cleaning on the reflectance and solar heat gain of a light-coloured roofing membrane. Atmos. Environ. 39, 7807–7824. doi: 10.1016/j.atmosenv.2005.08.037
McHugh, B., and Petrick, R. (2011). “Chicago's green and garden roofing codes and technology,” in Proceedings of the 2011 International Roofing Symposium (Washington, DC).
Oleson, K. W., Bonan, G. B., and Feddema, J. (2010). Effects of white roofs on urban temperature in a global climate model. Geophys. Res. Lett. 37:L03701. doi: 10.1029/2009GL042194
Peltier, R., Lee, S., Hennigan, C., and Arhami, E. (2018). Urban Meteorology. Available online at: http://apollo.eas.gatech.edu/EAS6792/2003/presentations/urbanMET.ppt (accessed June 2018).
Ray, S., and Glicksman, L. (2010). “Potential energy savings of various roof technologies,” 11th International Conference on Thermal Performance of the Exterior Envelopes of Whole Buildings (Clearwater, FL).
Saber, H. H. (2012). Investigation of thermal performance of reflective insulations for different applications. J. Build. Environ. 55, 32–44. doi: 10.1016/j.buildenv.2011.12.010
Saber, H. H. (2013a). Thermal performance of wall assemblies with low emissivity. J. Phys. 36, 308–329. doi: 10.1177/1744259112450419
Saber, H. H. (2013b). Practical correlations for the thermal resistance of vertical enclosed airspaces for building applications. J. Build. Environ. 59, 379–396. doi: 10.1016/j.buildenv.2012.09.003
Saber, H. H. (2013c). Practical correlation for thermal resistance of horizontal enclosed airspaces with upward heat flow for building applications. J. Build. Environ. 61, 169–187. doi: 10.1016/j.buildenv.2012.12.016
Saber, H. H. (2013d). Practical correlation for thermal resistance of 45o sloped enclosed airspaces with downward heat flow for building applications. Build. Environ. 65, 154–169. doi: 10.1016/j.buildenv.2013.04.009
Saber, H. H. (2014). Practical correlation for thermal resistance of horizontal enclosed airspaces with downward heat flow for building applications. J. Build. Phys. 37, 403–435. doi: 10.1177/1744259113498473
Saber, H. H., Maref, M., and Hajiah, A. E. (2019a). Effective R-value of enclosed reflective space for different building applications. J. Build. Phys. doi: 10.1177/1744259119880306. [Epub ahead of print].
Saber, H. H., Maref, W., Armstrong, M. M., Swinton, M. C., Rousseau, M. Z., and Ganapathy, G. (2010a). “Benchmarking 3D thermal model against field measurement on the thermal response of an insulating concrete form (ICF) wall in cold climate,” in 11th International Conference on Thermal Performance of the Exterior Envelopes of Whole Buildings XI (Clearwater, FL), 1–21. Available online at: https://nrc-publications.canada.ca/eng/view/object/?id=169c4cc3-e48a-4c94-9e60-0c3ff0fb2dbf (accessed December, 2010).
Saber, H. H., Maref, W., Elmahdy, A. H., Swinton, M. C., and Glazer, R. (2010b). “3D thermal model for predicting the thermal resistance of spray polyurethane foam wall assemblies,” in 11th International Conference on Thermal Performance of the Exterior Envelopes of Whole Buildings XI (Clearwater, FL), 1–19. Available online at: https://nrc-publications.canada.ca/eng/view/object/?id=9791797c-8d82-4681-9dfd-c4bc13420ee2 (accessed December, 2019).
Saber, H. H., Maref, W., Elmahdy, A. H., Swinton, M. C., and Glazer, R. (2012a). 3D heat and air transport model for predicting the thermal resistance of insulated wall assemblies. J. Build. Perform. Simul. 5, 75–91. doi: 10.1080/19401493.2010.532568
Saber, H. H., Maref, W., and Hajiah, A. E. (2019b). Hygrothermal performance of cool roofs subjected to saudi climates. J. Front. Energy Res. 7, 1–24. doi: 10.3389/fenrg.2019.00039
Saber, H. H., Maref, W., Sherrer, G., and Swinton, M.C. (2012b). Numerical modeling and experimental investigations of thermal performance of reflective insulations. J. Build. Phys. 36, 163–177. doi: 10.1177/1744259112444021
Saber, H. H., Maref, W., Swinton, M. C., and St-Onge, C. (2011a). Thermal analysis of above-grade wall assembly with low emissivity materials and furred-airspace. J. Build. Environ. 46, 1403–1414. doi: 10.1016/j.buildenv.2011.01.009
Saber, H. H., Swinton, M. C., Kalinger, P., and Paroli, R. M. (2011b). “Hygrothermal simulations of cool reflective and conventional roofs,” in NRCA International Roofing Symposium, Emerging Technologies and Roof System Performance (Washington, DC).
Saber, H. H., Swinton, M. C., Kalinger, P., and Paroli, R. M. (2012c). Long-term hygrothermal performance of white and black roofs in North American climates. J. Build. Environ. 50, 141–154. doi: 10.1016/j.buildenv.2011.10.022
Solecki, W. D, Rosenzweig, C., Parshall, L., Pope, G., Clark, M., Cox, J., et al. (2005). Mitigation of the heat island effect in urban New Jersey. Environ. Hazard 6, 9–49. doi: 10.1016/j.hazards.2004.12.002
Suehrcke, H., Peterson, E. L., and Selby, N. (2008). Effect of roof solar reflectance on the building heat gain in a hot climate. Energy Build. 40, 2224–2235. doi: 10.1016/j.enbuild.2008.06.015
SurfaPaint ThermoDry Elastomeric Roof Paint. (2019). Available online at: https://nanophos.com/images/SurfaPaint_ThermoDry_Elastomeric_Roof_Paint_PDS_en,_NEW.pdf (accessed October 2019).
U.S. Environmental Protection Agency (2008a). “Cool roofs,” in Reducing Urban Heat Islands: Compendium of Strategies. Available online at: https://www.epa.gov/heat-islands/heat-island-compendium (accessed January, 2019).
U.S. Environmental Protection Agency (2008b). “Green roofs,” in Reducing Urban Heat Islands: Compendium of Strategies. Available online at: https://www.epa.gov/heat-islands/heat-island-compendium (accessed June, 2019).
U.S. Environmental Protection Agency (EPA) (2010). “Urban heat island basics,” in Reducing Urban Heat Islands: Compendium of Strategies. Available online at: https://www.epa.gov/heat-islands/heat-island-compendium (accessed May, 2019).
U.S. Environmental Protection Agency (EPA) (2018a). Keeping Your Cool: How Communities Can Reduce the Heat Island Effect. Available online at: https://www.epa.gov/sites/production/files/2016-09/documents/heat_island_4-page_brochure_508_120413.pdf (accessed March, 2019).
U.S. Environmental Protection Agency (EPA) (2018b). Heat Island Cooling Strategies. Available online at: https://www.epa.gov/heat-islands/heat-island-cooling-strategies (accessed June, 2019).
U.S. Environmental Protection Agency (EPA) U.S. Environmental Protection Agency (EPA) (2019) Smart Growth and Heat Islands. Available online at: https://www.epa.gov/heat-islands/smart-growth-and-heat-islands (accessed June 2019).
Urban, B., and Roth, K. (2010). Guidelines for Selecting Cool Roofs, U.S. Department of Energy, Energy, Efficiency and Renewable Energy, Building Technologies, Program.
Vrachopoulos, M. G., Koukou, M. K., Stavlas, D. G., Stamatopoulos, V. N., Gonidis, A. F., and Kravvaritis, E. D. (2012). Testing reflective insulation for improvement of building energy efficiency. Cent. Eur. J. Eng. 2, 83–90. doi: 10.2478/s13531-011-0036-3
Wang, C., Guo, X., and Zhu, Y. (2019a). Energy saving with optic-variable wall for stable air temperature control. Energy 173, 38–47. doi: 10.1016/j.energy.2019.02.051
Wang, C., Zhu, Y., and Guo, X. (2019b). Thermally responsive coating on building heating and cooling energy efficiency and indoor comfort improvement. Appl. Energy 253, 1–10. doi: 10.1016/j.apenergy.2019.113506
Wang, C., Zhu, Y., Qu, J., and Hu, H. D. (2018). Automatic air temperature control in a container with an optic-variable wall. Appl. Energy 224, 671–681. doi: 10.1016/j.apenergy.2018.05.018
Xu, T., Sathaye, J., Akbari, H., Garg, V., and Tetali, S. (2012). Quantifying the direct benefits of cool roofs in an urban setting: reduced cooling energy use and lowered greenhouse gas emissions. Build. Environ. 48, 1–6. doi: 10.1016/j.buildenv.2011.08.011
Zhao, Z. C. (2011). Impacts of Urbanization on Climate Change, 10,000 Scientific Difficult Problems: Earth Science (in Chinese), 10,000 Scientific Difficult Problems Earth Science Committee Eds. Science Press, p. 843–846.
Keywords: design tools, cool roof, white roof, black roof, energy savings, solar reflectivity
Citation: Saber HH and Maref W (2019) Energy Performance of Cool Roofs Followed by Development of Practical Design Tool. Front. Energy Res. 7:122. doi: 10.3389/fenrg.2019.00122
Received: 13 July 2019; Accepted: 17 October 2019;
Published: 05 November 2019.
Edited by:
David W. Yarbrough, R & D Services, Inc., United StatesReviewed by:
Xiaofeng Guo, ESIEE Paris, FranceCopyright © 2019 Saber and Maref. This is an open-access article distributed under the terms of the Creative Commons Attribution License (CC BY). The use, distribution or reproduction in other forums is permitted, provided the original author(s) and the copyright owner(s) are credited and that the original publication in this journal is cited, in accordance with accepted academic practice. No use, distribution or reproduction is permitted which does not comply with these terms.
*Correspondence: Wahid Maref, V2FoaWQuTWFyZWZAZXRzbXRsLmNh
Disclaimer: All claims expressed in this article are solely those of the authors and do not necessarily represent those of their affiliated organizations, or those of the publisher, the editors and the reviewers. Any product that may be evaluated in this article or claim that may be made by its manufacturer is not guaranteed or endorsed by the publisher.
Research integrity at Frontiers

Learn more about the work of our research integrity team to safeguard the quality of each article we publish.