 Juan F. Ortiz-Medina
 Douglas F. Call
- Department of Civil, Construction, and Environmental Engineering, North Carolina State University, Raleigh, NC, United States
Microbial electrochemical technologies (METs) require the establishment of anode biofilms to generate electrical current. The factors driving bioanode formation and their variability during startup remain unclear, leading to a lack of effective strategies to initiate larger-scale systems. Accordingly, our objective was to characterize the electrochemical properties and microbial community structure of a large set of replicate bioanodes during their first cycle of current generation. To do this, we operated eight bioanode replicates at each of two fixed electrode potentials [−0.15 V and +0.15 V vs. standard hydrogen electrode (SHE)] for one fed-batch cycle. We found that startup time decreased and maximum current generation increased at +0.15 V compared to −0.15 V, but at both potentials the bioanode replicates clustered into three distinct activity levels based on when they initiated current. Despite a large variation in current generation across the eight +0.15 V bioanodes, bioanode resistance and abundance of Geobacter species remained quite similar, differing by only 10 and 12%, respectively. At −0.15 V, current production strongly followed Geobacter species abundance and bioanode resistance, wherein the largest abundance of Geobacter was associated with the lowest charge transfer resistance. Our findings show that startup variability occurs at both applied potentials, but the underlying electrochemical and microbial factors driving variability are dependent on the applied potential.
Introduction
Microbial electrochemical technologies (METs) convert organic material, such as wastewater, into electricity, hydrogen gas, or commodity chemicals (Wang and Ren, 2013). Over the past few decades, these technologies have advanced from lab- to demonstration-scales (Janicek et al., 2014). A challenge facing larger-scale systems is the unpredictable and erratic behavior during the initiation of current or what is frequently referred to as reactor startup (Cusick et al., 2011; Paitier et al., 2017). Identifying the underlying reasons for this behavior and how to improve startup is therefore paramount for the success of these technologies.
Despite the important role that electricity-generating microorganisms, or exoelectrogens, play in initiating current, most of our knowledge of their function and composition comes from bioanodic communities operated over long time scales (Logan, 2009). The most common enrichment procedure used to study these communities is to operate them throughout several cycles (in a batch system) until a stable current output is reached (Hutchinson et al., 2011; Paitier et al., 2017). Typically after at least 1 month of operation, bioanodes converge to similar electrochemical properties and community structure regardless of the inoculum source and operational conditions such as the anode potential (Yates et al., 2012; Zhu et al., 2014; Paitier et al., 2017). Most of these studies agree that exoelectrogens with efficient pathways of extracellular electron transfer (EET), such as members of the genus Geobacter, play a pivotal role in generating current and decreasing anode charge transfer resistance (Marsili et al., 2010; ter Heijne et al., 2015).
Bioanode properties during startup are less understood. Understanding startup behavior is important because many pilot-scale systems have reported significant delays (e.g., months) to initiate current (Cusick et al., 2011; Escapa et al., 2015; Hiegemann et al., 2016). It is frequently observed, but not discussed, in long-term studies that a high degree of variable electrochemical performance across replicates occurs during startup (Yates et al., 2012; Zhou et al., 2013), but the underlying factors driving the variation remain unclear. This can ultimately influence the predictability and reproducibility of bioanodes over the long term, as shown in several studies that observe this erratic behavior (Cusick et al., 2011; Zhang et al., 2013; Escapa et al., 2015; Yanuka-Golub et al., 2016). Insufficient replicates is an additional factor leading to this unpredictability, as it obscures a possible consensus on startup time, expected current, and influence of the microbial community. This causes conflicting results from which decisions about optimal electrochemical conditions for bioanode startup are determined, such as which fixed anode potential to choose (Finkelstein et al., 2006; Torres et al., 2009; Wagner et al., 2010; Zhu et al., 2014). The initial enrichment stage of bioanodes is further complicated by the fact that different outcomes during acclimation are influenced by both stochastic and deterministic factors, which are dictated by microbial community dynamics (Zhou et al., 2013).
The objective of this study was to characterize the electrochemical behavior and community structure of bioanode communities during startup as a function of anode potential. Two anode potentials were selected in order to create two different energy-harvesting conditions for the bioanodes. A lower anode potential of −0.15 V [vs. standard hydrogen electrode (SHE)] was chosen to impart a lower driving force for EET, and a higher potential of +0.15 V, which increases the EET rate, was selected to represent conditions under which the microorganisms could better exploit the available energy (Korth and Harnisch, 2019). Eight replicates at each anode potential were included in order to assess factors associated with startup variability, and all reactors were inoculated with the same enrichment culture (domestic wastewater) and electron donor (acetate). At the end of the first cycle, the bioanode electrochemical properties were measured using cyclic voltammetry and electrochemical impedance spectroscopy (EIS) and the community profile analyzed using high-throughput Illumina sequencing. Our findings show that startup variability occurs at both applied potentials, but the underlying electrochemical and microbial factors driving the variability are dependent on the applied potential.
Materials and Methods
Reactor Assembly and Configuration
Microbial electrolysis cells (MECs) were based on a polycarbonate circular chamber design (28 mL empty volume) as previously described (Call and Logan, 2008). This configuration fixed the electrode spacing across the replicates (2.3 ± 0.1 cm between anode and cathode). We selected a single-chamber design for this study because compared to two-chamber designs using membrane separators, it lowers resistance and eliminates detrimental pH gradients. The electrodes and their pretreatment were based on previous methods (Call and Logan, 2011; Zhu et al., 2014). Briefly, the anodes were graphite plates (2 × 2 cm; GraphiteStore.com, Inc., Northbrook, IL) pretreated by polishing with sandpaper (grit type 400), soaked in a 1 M HCl solution overnight, and rinsed and stored in DI water until used. The cathodes were stainless steel mesh (4 cm diameter; Type 304, mesh size 50 × 50; McMaster-Carr, Elmhurst, IL). The current collectors were titanium wire (anode) and stainless steel wire (cathode). Each MEC was adjusted until the contact resistance between electrodes and current collectors was <0.7 Ω. To fix the anode potentials, Ag/AgCl reference electrodes (~200 mV vs. SHE) were installed equidistant between the anode and cathode. All reference electrodes were checked against a calibrated saturated calomel electrode (SCE) to ensure that the difference in potential between them and the SCE was <1 mV.
Microbial Enrichment and Chronoamperometry
To perform the microbial enrichment, effluent from the primary clarifier of a domestic wastewater treatment plant (~300 mg/L COD) was mixed in equal proportions with 100 mM phosphate buffer, 1 g/L sodium acetate (780 mg/L COD) as the electron donor, and 10 mL/L of both Wolfe's trace vitamin and mineral solutions (Call and Logan, 2011). The contribution of acetate and wastewater to the total COD was 84 and 16%, respectively. We amended our MECs with acetate to promote the growth of exoelectrogens and reduce diversion of electrons to other pathways, such as fermentation. Enhancing exoelectrogen growth allowed us to better understand differences across bioreactors that initiated current quickly, slowly, or not at all and is consistent with other lab-scale investigations (Torres et al., 2009; Liu et al., 2011; ter Heijne et al., 2015; Yanuka-Golub et al., 2016) and amendment practices in some larger-scale systems (Dekker et al., 2009; Cusick et al., 2011; Brown et al., 2014; Liang et al., 2018). Cathodically-generated H2 gas may have been present and consumed as an electron donor as well by the microbial communities; thus, our design best represents applied systems operating without a membrane separator (e.g., MEC-amended anaerobic digesters) (Guo et al., 2013; Feng et al., 2015). The reactors were connected to a potentiostat (Bio-Logic Science Instruments, Knoxville, TN) and operated at different fixed anode potentials (EAN): −0.15 V or +0.15 V (both vs. SHE) or open circuit voltage (OCV). These potentials were chosen because they provide different scenarios of energy harvesting by microorganisms based on EET kinetics. The lower potential (−0.15 V) represents a smaller driving force that yields slower EET rates. The higher potential (+0.15 V) enables higher EET rates, and in turn more optimized energy harvesting from the available energy (Korth and Harnisch, 2019). Eight replicates for each of the three anode treatments were operated. Preliminary tests were conducted to assess when maximum current was reached for each EAN. These values were 5.5 days for −0.15 V and 5.0 days for +0.15 V. Bioanodes at OCV were operated for 5.0 days. All reactors were operated at a constant 30°C.
Electrochemical Characterization
To characterize the electrochemical properties of the bioanodes, cyclic voltammograms (CVs) were collected at a scan rate of 1 mV/s, ranging from −0.3 to +0.5 V vs. SHE. A single CV cycle was performed to avoid a prolonged effect of varying the potential on the subsequent microbial community analysis. EIS was conducted to determine the total and component resistances of the bioanodes. The bioanodes were operated for 30 min at their respective enrichment EAN (−0.15 or +0.15 V) and the frequency was varied from 0.1 to 10 mHz with a 10 mV perturbation amplitude. Both CVs and EIS were performed at the end of the chronoamperometry measurements. To initially characterize the reactors and ensure that all replicates agreed within 10%, both techniques were likewise performed at the start of the experiments with the reactors filled with 50 mM phosphate buffer and no inoculum. The same techniques were conducted in an identical manner on the OCV controls, but with the anode potential held at OCV during EIS instead of one of the two EAN. Depending on the bioanode impedance behavior, data from the EIS tests were fitted using equivalent circuits similar to single and double-time constant models (Figure S1), which have been used previously (Srikanth et al., 2008; Martin et al., 2013). The resistances in the model were attributed to solution resistance (Rs) and charge transfer resistances (Rct, Rct, 2). Model fitting was performed using the function Z-Fit on the EC-Lab software, version 11.10, by minimizing the Chi-Square values of each system.
Microbial Community Visualization and Analysis
After the electrochemical analyses were completed, the MECs were disassembled and the bioanodes processed for further analysis. To observe the extent of microbial colonization of the anodes, one piece of every electrode was visualized using scanning electron microscopy (SEM). The samples were placed in a 2.5% glutaraldehyde solution overnight, dehydrated in ethanol, and dried for 2 h at 30°C (Katuri et al., 2014). Before imaging, the samples were coated with a gold/palladium layer for 2 min at 12 mA under an argon atmosphere. The sample was visualized using a Hitachi S-3200N variable pressure scanning electron microscope (Hitachi High-Technologies, Japan) with an accelerating voltage of 5 kV and a working distance of 23 mm.
To analyze the microbial community composition and diversity, samples from the anodic biofilm and the suspension were obtained. Anodic biofilm was scraped using a sterile blade. For the suspension samples, 10 ml of reactor effluent was collected in 15 ml centrifuge tubes, then centrifuged at 4,000 rpm for 20 min. DNA from the biofilm and suspension pellets was extracted using a PowerSoil® DNA isolation kit (MO BIO Laboratories, Carlsbad, CA) following the manufacturer's instructions. The V3 and V4 regions of the 16S rRNA gene were amplified using the forward primer 5′ TCGTCGGCAGCGTCAGATGTGTATAAGAGACAGCCTACGGGNGGCWGCAG 3′ and the reverse primer 5′ GTCTCGTGGGCTCGGAGATGTGTATAAGAGACAGGACTACHVGGGTATCTAATCC 3′ for Illumina sequencing, using the protocol provided by the company (Illumina Inc., 2013). The samples were sequenced using the Illumina MiSeq platform (Illumina Inc., San Diego, CA), with a paired-end sequencing of 300 base pairs (bp) length. The sequencing data was deposited into the GenBank database of the National Center of Biotechnology Information (NCBI), under the BioProject accession number PRJNA559682.
To establish the composition and compare microbial communities, the software QIIME was utilized (Caporaso et al., 2010). After alignment, the samples were clustered into operational taxonomic units (OTUs) by performing open-reference picking with the UCLUST algorithm, using 97% sequence similarity as the threshold and following the default commands available at the developers' website (QIIME, 2015). After OTU classification at the genus level, the generated data was further processed in the R platform. Shannon (H) diversity indexes were calculated to assess the diversity of the studied samples, while Principal Component Analysis (PCA) plots were constructed to visualize the relationship between community composition and bioanode performance. Both were generated in R with the help of the vegan (Oksanen et al., 2017) and phyloseq packages (McMurdie and Holmes, 2013).
Results and Discussion
Current Generation During Bioanode Initiation
We first examined current densities (IA) over time during the startup period. Despite identical inoculum, reactor design, and operating conditions, IA was highly variable across the eight replicates for each EAN (Figure 1). To quantify variability, we defined startup time as the point when the bioanodes reached 0.1 A/m2 [dashed line in Figures 1A,B; selected based on similar thresholds used in other MET startup studies (Liu et al., 2011; Commault et al., 2013)]. Bioanodes that did not reach this value after five (+0.15 V) or 5.5 days (−0.15 V) were defined as inactive. Based on this definition, three bioanodes were inactive at −0.15 V and one was inactive at +0.15 V. The remaining bioanodes clustered into two levels: (1) high-activity, which reached the 0.1 A/m2 threshold the fastest, and (2) low-activity, which were the slowest to reach the threshold (Figure 1B).
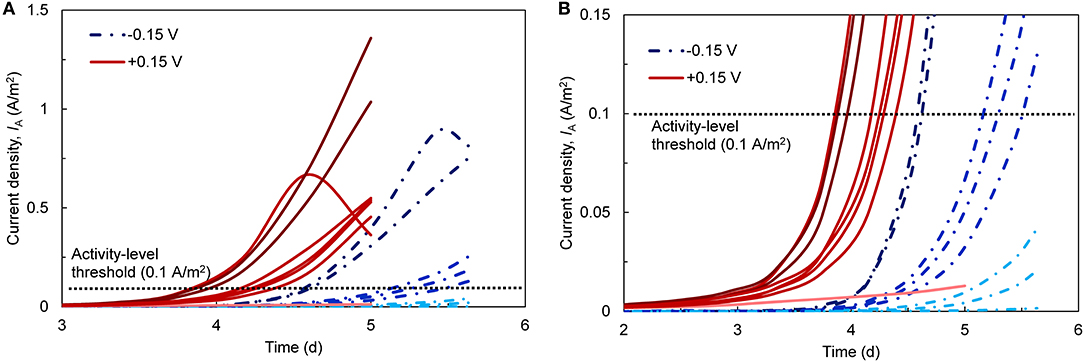
Figure 1. (A) Current densities (IA; normalized to anode surface area) over time during the startup phase of the bioanodes. Eight replicates (red lines) were started with an applied anode potential [EAN; reported vs. the standard hydrogen electrode (SHE)] of +0.15 V and another eight (blue, segmented lines) were started at −0.15 V. The dark, medium, and light shading of the lines corresponds to high-, low-activity, and inactive bioanodes, respectively. The horizontal dotted line denotes the current density threshold (0.1 A/m2) selected to define the bioanode activity level. (B) A closer view of the bioanode startup current densities with respect to the activity threshold.
Considering only the high- and low-activity bioanodes, there were appreciable differences during the startup period within and across each EAN. At +0.15 V, the high-activity bioanodes required 3.91 ± 0.06 days and the low-activity bioanodes required 4.28 ± 0.10 days to reach the startup threshold. At −0.15 V, the high- and low-activity reactors took significantly longer to reach the threshold than those at +0.15 V (t-test, p < 0.05), requiring 4.60 ± 0.03 and 5.32 ± 0.16 days, respectively. Maximum IA followed a similar trend as the startup time, wherein bioanodes at +0.15 V reached higher maximum IA than those at −0.15 V for all activity levels. Bioanode startup activity level largely agreed with the maximum current behavior. The exception was one bioanode at +0.15 V, which classified as high-activity with respect to startup time but did not reach the same IA as the other high-activity bioanodes. This bioanode ended the cycle at the same level of current as the +0.15 V low-activity bioanodes.
The startup behavior of METs varies widely across the literature, and our results are consistent with some, but not all, prior reports. The high degree of startup variability that we observed is often not discussed (or reported) in other studies that use triplicate or duplicate reactors, even though there is a clear need to operate enough replicates to characterize possible outcomes (Yates et al., 2012). Zhou et al. (2013), which is one of the only studies to use more than triplicate reactors, reported a wide range of startup times (~1–12 days) across 14 replicates, which is consistent with our findings. The effect of EAN on startup varies across studies. Using a microbial fuel cell (MFC) with a cloth separator between the electrodes, Zhang et al. (2013) showed that wastewater-inoculated reactors at +0.2 V started up more quickly than those at −0.2 V. Faster startup at less negative potentials has been reported in other studies as well, in both single-chamber (Finkelstein et al., 2006) and double-chamber systems (Wang et al., 2009; Commault et al., 2013). While one explanation for this behavior is the higher energy harvested due to higher EET rates (Korth and Harnisch, 2019), a selection of exoelectrogens with more efficient EET mechanisms at higher potential has also been proposed (Commault et al., 2013). Conversely, Torres et al. (2009), using a double-chamber system with multiple anodes in one chamber, observed a faster startup and higher maximum current density at more negative anode potentials. They attributed this behavior to the selection of microorganisms (e.g., Geobacter sulfurreducens) that could harvest energy and transfer electrons efficiently at such negative potentials. However, it is unclear if their unique multi-anode configuration played a role in their findings. Kumar et al. (2013), comparing single- and double-chamber MECs with the same inoculum, medium, and under continuous operation, observed that the single-chamber MEC displayed a higher level of electrochemical activity at less negative potentials (0 V vs. SHE). Both configurations have inherent differences, such as cathodically-generated H2 that can serve as an electron donor in single-chamber systems (Call et al., 2009; Lee and Rittmann, 2010) and pH gradients in double-chamber reactors (Rozendal et al., 2006) that may influence bioanode enrichment and startup time. Reactor configurations thus play an additional factor that needs to be considered during research on startup behavior.
Cyclic Voltammetry
To investigate the electrochemical properties of the bioanodes, we used cyclic voltammetry at the end of the startup cycle. Cyclic voltammetry reveals electron transfer kinetics between microorganisms and the electrode across a range of bioanode potentials, as well as possible electron transfer mechanisms (Fricke et al., 2008). The CVs clustered according to the activity levels defined above and had limiting currents (il, a) that were generally proportional to the maximum current densities recorded during startup (Figure 2). The CVs of bioanodes that did not reach the startup threshold closely followed the OCV control. All other bioanodes generated a sigmoidal shaped CV regardless of EAN, which is indicative of a self-regenerating electron transfer process that is typical in mediatorless, exoelectrogenic biofilms (Katuri et al., 2010; Marsili et al., 2010; Zhang et al., 2013). These same bioanodes showed a similar midpoint potential (E1/2) at −0.18 ± 0.01 V (dashed vertical line in Figure 2) and potential (Ep; ca. −0.1 V) where maximum oxidative current (ip) was reached, which further confirms the presence of a primary electron transfer pathway utilized by the biofilm across EAN and levels of activity. This behavior is frequently associated with bioanodes dominated by Geobacter spp., which normally show sigmoidal-shaped voltammograms and midpoint potentials between −0.16 and −0.22 V due to the outer membrane cytochromes expressed by these organisms (Marsili et al., 2008; Katuri et al., 2012; Zhu et al., 2014). This suggests that Geobacter spp. were primarily involved in EET on our bioanodes during startup.
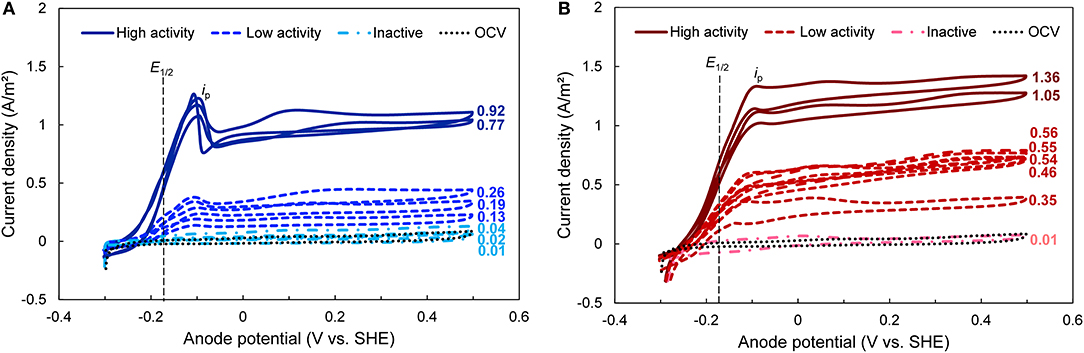
Figure 2. Cyclic voltammograms (CVs) taken at the end of the startup period for bioanodes fixed at (A) EAN = −0.15 V and (B) EAN = +0.15 V. All curves in the same plot are replicates. High-, low-activity, and inactive bioanode levels are defined based on the time required to reach the startup current threshold (Figure 1). Numbers next to each curve represent the current density recorded at the end of the startup cycle. E1/2, midpoint potential (vertical black dashed line); ip, peak current obtained during the potential sweep; OCV, open circuit voltage (dotted black line).
The most notable effect of EAN was observed in the CV behavior of the high-activity bioanodes. Although bioanodes at both EAN showed similar sigmoidal curves and ip values, after the sweeping potential increased beyond Ep, the current produced by the two high-activity bioanodes enriched at −0.15 V dropped sharply by ~25% (Figure 2A). Current slightly increased with potential, but did not exceed ip. In contrast, the bioanodes enriched at +0.15 V did not show the same drop in current; current remained similar to ip after passing Ep (Figure 2B). Both behaviors at similar EAN in other studies have been consistently observed in full grown biofilms (Marsili et al., 2010; Zhu et al., 2012, 2014; Commault et al., 2013). One explanation for this difference is that at +0.15 V, electron transfer rates operated near their maximum because this potential provided a larger driving force for electron flow through the cell (Korth and Harnisch, 2019). This is consistent with previous reports that at potentials beyond which ip occurs, electron transfer rates do not increase substantially because they are kinetically limited by intracellular electron carriers (e.g., NAD+/NADH) (Marsili et al., 2010; Wei et al., 2010; Korth and Harnisch, 2019). At −0.15 V, the bioanodes were subject to a lower driving force, and in turn lower electron turnover rates.
It is known that biofilms dominated by Geobacter spp. express different pathways, regulated by inner membrane cytochromes, to allow growth using electron acceptors at different potentials. This has been demonstrated by the presence of different oxidation peaks as a function of EAN (Zhu et al., 2012; Peng et al., 2016). One electron transfer pathway, the CbcL-dependent pathway, operates at redox potentials below −0.10 V (Zacharoff et al., 2016), whereas at EAN above this value, the ImcH-dependent pathway is expressed to harvest additional energy (Levar et al., 2017). The CbcL pathway has been reported to contribute significantly (at least 60%) to electron transfer, even in bioanodes formed at higher EAN and its deletion shifts the midpoint potential to values around −0.1 V (Zacharoff et al., 2016). It is thus possible that the bioanodes at −0.15 V expressed a pathway that was not adapted to EET at more positive EAN, which is consistent with the current drop after ip. Differences in the expression and activity of these two pathways are therefore the likely reasons for the different CV profiles at −0.15 V and +0.15 V.
Electrochemical Impedance Spectroscopy
Bioanode impedance profiles, which characterize the biofilm-electrode interface in terms of resistance and capacitance elements, were dependent on activity level for the bioanodes enriched at −0.15 V, but not +0.15 V (Figure 3). The majority of the bioanode profiles (all except the high-activity −0.15 V bioanodes) reflected a single characteristic impedance semi-circle. Those profiles could be fitted to an equivalent circuit that considers the solution resistance (Rs) and a single charge transfer resistance (Rct) circuit (Srikanth et al., 2008). For all bioanodes (both −0.15 and +0.15 V), Rs was 13 ± 4 Ω, which is low relative to the majority of the Rct values. Other observable phenomena in the high frequency region of the semi-circle were perceived as too small (Figure S2) because including them during model fitting did not change the values of the other calculated resistances by more than 5%.
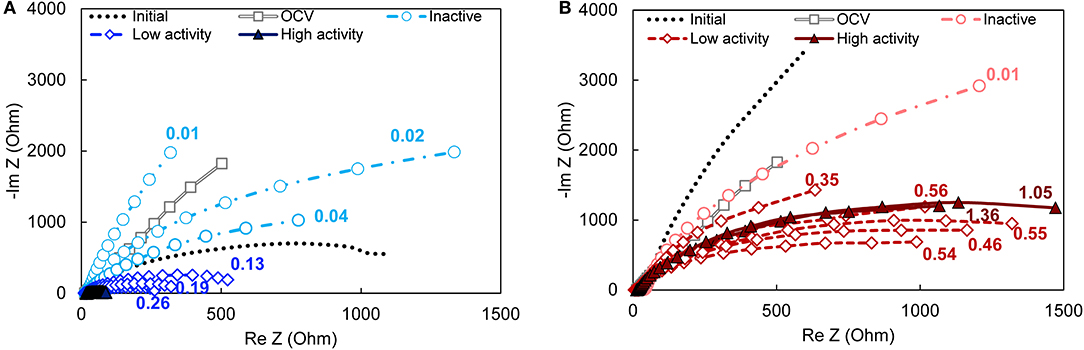
Figure 3. Nyquist plots of bioanodes fixed at (A) EAN = −0.15 V and (B) EAN = +0.15 V taken at the end of the startup cycle. All curves in the same plot are replicates. The magnitude of impedance is lower when the ratio of the curve is lower, which translates into lower total resistance. High-, low-activity, and inactive bioanode levels are defined based on the time required to reach the startup current threshold (Figure 1). The numbers next to each curve are the current density recorded at the end of the startup period. OCV, open circuit voltage (gray double line with squares); Initial—prior to inoculation (dotted line).
The impedance of the −0.15 V bioanodes decreased as the current recorded at the end of the startup period increased (Figure 3A). The corresponding Rct ranged from 24 Ω to 3.4 × 10⁴ Ω between the bioanodes with the highest and the lowest current density, respectively. The high-activity bioanodes at −0.15 V had impedances that were up to 90% lower than the low-activity bioanodes (Figure S3A). They generated Nyquist plots with double semicircles (Figure S4) that can be attributed to two charge transfer processes (Ramasamy et al., 2009). Such processes can be better distinguished in the phase angle Bode plot as two local minimums that become one as activity decreases and impedance increases (Figure S3B). Relative to the abiotic controls (i.e., prior to introducing the microorganisms), impedance of the low-activity bioanodes was lower and the inactive bioanodes was higher. The latter result suggests that electron transfer to the anode was slowed or inhibited. This may have been caused by growth of non-conductive biofilms (Dheilly et al., 2008) or presence of substances such as polysaccharides (Kouzuma et al., 2010) that changed the anode surface conductivity. The similar impedance profile of these bioanodes and the OCV control (where microorganisms are present but not respiring on the anode) lends support for this hypothesis.
Bioanodes enriched at +0.15 V produced similar impedance profiles of single semi-circles, regardless of the startup current or the electrochemical activity reflected in the CVs (Figure 3B). Total impedance did not increase dramatically in the low frequency region as was observed for the bioanodes at −0.15 V (Figure S3C), and the phase angle only increased slightly relative to the initial response of the graphite anode (Figure S3D). The average charge transfer resistances (Rct), calculated by the aforementioned model fitting, were 3,140 ± 330 and 2,140 ± 580 Ω for the high- and low-activity bioanodes, respectively. The differences in resistance cannot be explained by differences in the bioanode design, materials, connections, etc., because the impedance of each anode prior to inoculation was not related to the final activity obtained at both EAN (Figure S5). Thus, higher current production at +0.15 V did not correlate with lower total resistance.
To better visualize the relationship between Rct and bioanode activity level, Rct of each bioanode was divided by the respective initial Rct (calculated before inoculation). Plotting IA against normalized charge transfer resistance () yielded a linear relationship for the high- and low-activity (R2 = 97%) bioanodes at −0.15 V (Figure 4). Bioanodes at +0.15 V did not show a clear trend in terms of decrease in Rct, and high-activity bioanodes had similar values as most of the low-activity bioanodes, but they had a much larger IA (Figure 4). Their larger maximum current output in CVs indicates that despite appreciable resistance, these communities were highly efficient at transferring electrons to the anode.
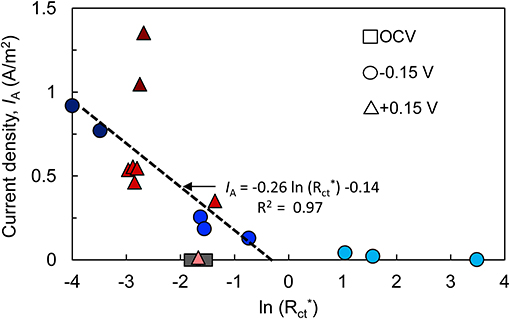
Figure 4. Relationship between bioanode charge transfer resistance (; normalized to each bioanode's resistance prior to introducing microorganisms) and current density (IA). Both metrics were recorded at the end of the startup cycle. Points with the same shape represent replicate bioanodes fixed at −0.15 V (circles) and +0.15 V (triangles). The points are shaded to reflect bioanode activity level (dark, high-activity; medium, low-activity; light, inactive). OCV, open circuit voltage bioanodes (squares). The linear regression of high- and low-activity bioanode points at −0.15 V is shown as a dashed line.
Microbial Colonization of the Anodes
We visualized the bioanode surfaces to qualitatively assess relationships between the electrochemical characteristics described above and biofilm coverage. To do this, we captured SEM images of the bioanodes at the end of the startup cycle. At −0.15 V, the high-activity bioanodes were fully covered with a homogenous layer of microorganisms (Figure 5A), and the low-activity bioanodes had little to no coverage (data not shown). At +0.15 V, biofilm coverage was patchy and heterogeneous (Figure 5B), with no clear difference between high- and low-activity bioanodes. Inactive bioanodes at both potentials showed a less defined colonization pattern (Figure 5C), which was similar to the OCV controls (Figure 5D).
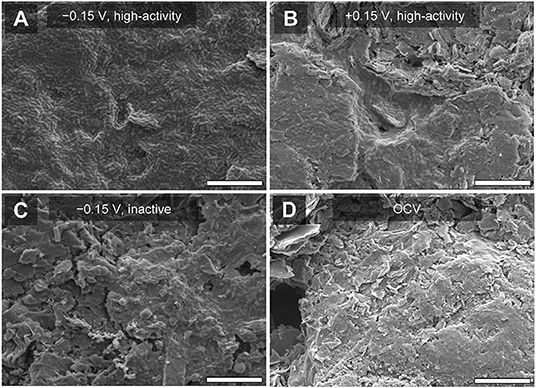
Figure 5. Scanning electron microscopy (SEM) images of bioanodes at the end of the startup cycle. (A) High-activity bioanode at −0.15 V showing uniform and complete surface coverage of microorganisms, (B) high-activity bioanode at +0.15 V with similar cell morphology as (A), but less surface coverage, (C) low-activity bioanode at −0.15 V, with mixed cell morphology and lower coverage relative to (A), and (D) bioanode at open circuit voltage (OCV). White bar at the bottom of each figure represents a distance of 10 μm.
Bioanode surface coverage was consistent with the EIS results. A more complete coverage of the anode minimizes charge transfer resistance (Marsili et al., 2008). This was observed in the high-activity bioanode impedance spectra at −0.15 V (Figure 3). Thin biofilms and limited surface coverage are associated with larger charge transfer resistance, which was observed in the high- and low-activity bioanodes at +0.15 V. This implies that even though bioanode resistance was larger at +0.15 V, the per-cell EET rates at that potential were greater than at −0.15 V. Improved kinetics and optimization of energy-harvesting pathways at more positive anode potentials support this observation (Ramasamy et al., 2009; Borole et al., 2010). Overall, these results show that bioanode growth and activity occur differently depending on EAN.
Microbial Community Composition
Across low- and high-activity levels at both EAN, sequences matching to Geobacter had the highest relative abundance in the biofilms (Figure 6). The relative abundance of this genus was generally higher in bioanodes that produced the highest IA, which is more noticeable at −0.15 V (Figure 6A) than +0.15 V (Figure 6B). A similar trend was found in suspension samples obtained from the bioreactors, where Geobacter abundance was generally related to the maximum IA (Figure S6). Geobacter species are frequently enriched in METs supplied acetate as the electron donor, regardless of EAN, and consist of several known exoelectrogens (Zhu et al., 2014). The use of single chamber MECs in this study may have contributed to the enrichment of this genus, as some species are able to utilize hydrogen gas (H2) produced at the cathode as an additional electron donor (Call et al., 2009; Lee and Rittmann, 2010). Several other genera were present in the bioanodes, some of which may have participated in current generation. Genera, including Sedimentibacter, Fusibacter, Pseudomonas, and an unknown genus of the family Comamonadaceae, were detected. While the latter were found in the OCV controls, both Sedimentibacter and Fusibacter were not highly abundant (Figure S7A). Comamonadaceae were present in the inoculum, although at a low abundance of around 2.5% (Figure S7B). In the high-activity bioanodes, there was a greater abundance of Pseudomonas species at +0.15 V than −0.15 V. Some Pseudomonas species are exoelectrogenic, producing current through the use of electron shuttles (Rabaey et al., 2004). A greater abundance of these bacteria at +0.15 V than −0.15 V is consistent with prior reports regarding the influence of EAN on the thermodynamic favorability of electron transport mechanisms (Finkelstein et al., 2006; Wei et al., 2010).
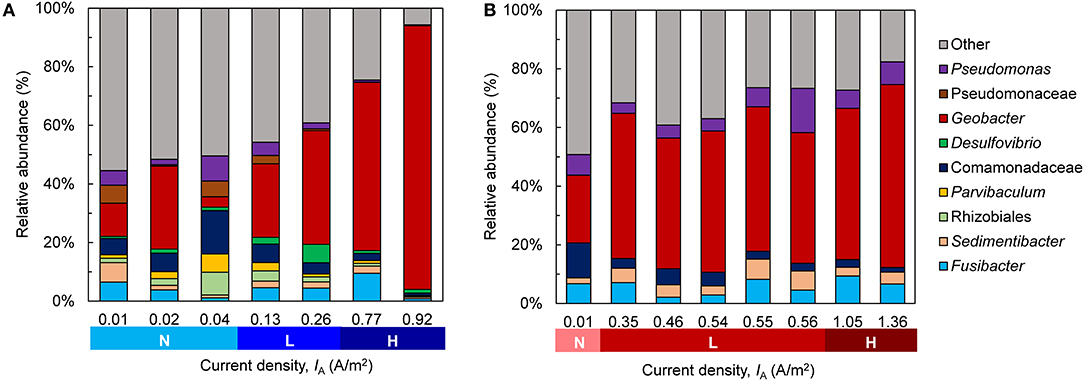
Figure 6. Community composition of the bioanode biofilms fixed at (A) −0.15 V and (B) +0.15 V. The replicates for each anode potential are ordered from lowest to highest current density (IA) recorded at the end of the startup cycle and are categorized according to their activity level during the startup cycle [Inactive (N), low-activity (L), high-activity (H)]. Genera with a relative abundance <5% are grouped into “Other”.
To better visualize the relationship between community composition and bioanode performance, a PCA biplot was constructed (Figure 7). In this plot, genera are represented as vectors, and the points depict each bioanode and its corresponding current output at the end of the startup cycle. Points located along the axis of a vector contain a higher relative abundance of those respective genera, and the length of the vector indicates possible influence of the corresponding microorganism on the distribution of samples (Ramette, 2007). The genus Geobacter was the primary influence affecting bioanode activity level at both EAN. Its vector aligns well with the horizontal axis that explains more than 90% of the observed variation. Bioanodes with the highest activity levels are closest to this vector. In contrast, samples corresponding to inactive bioanodes are located in the opposite direction of this vector, indicating a lower presence of Geobacter spp. The other enriched microorganisms, Sedimentibacter and Fusibacter spp., had a stronger influence on the low- and high-activity bioanodes at +0.15 V than −0.15 V. These microorganisms have been detected in METs exhibiting stable electrochemical performance (Lesnik and Liu, 2014). Although their function in an electrically conductive biofilm is unclear, their presence in early biofilm formation suggests a possible role during startup. In contrast, vectors of microorganisms such as Comamonadaceae and Pseudomonas spp. are directed toward inactive reactors and the OCV controls.
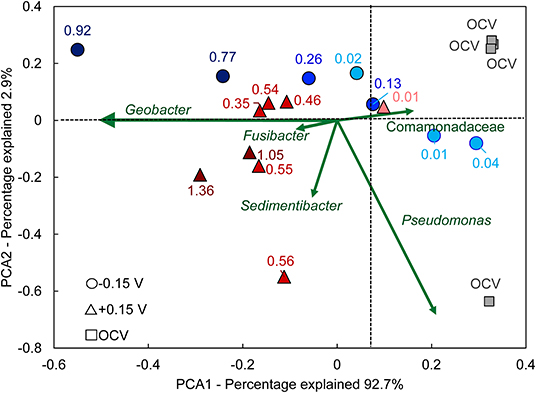
Figure 7. Principal component analysis (PCA) biplot of anode biofilm microbial communities. Points with the same shape represent replicate bioanodes fixed at −0.15 V (circles) and +0.15 V (triangles). The points are shaded to reflect bioanode activity level (dark, high-activity; medium, low-activity; light, inactive). The numbers next to each curve are the current density recorded at the end of the startup period. Green vectors symbolize the eigenvector of the corresponding genus. Samples that are located in the direction of an eigenvector contain that particular genus, with an increased relative abundance the farther they are located from the center. OCV, open circuit voltage bioanodes (squares).
In all bioanodes, a higher abundance of Geobacter resulted in lower community diversity. By plotting the Shannon index (H), an indicator of microbial diversity, against the current density recorded at the end of the startup cycle, we found that diversity at both EAN decreased as IA increased (Figure 8); however, the rate of decrease was much faster at −0.15 V than +0.15 V. This result can be explained by the greater selection pressure at −0.15 V. The thermodynamic driving force for EET is lower at −0.15 V than +0.15 V; thus it favors microorganisms that can regulate electron transfer pathways to capture energy under challenging thermodynamic conditions (Korth and Harnisch, 2019). Microorganisms that use electron transport mechanisms, such as electron shuttles, that have more positive midpoint potentials than −0.15 V are limited by thermodynamic constraints (Torres et al., 2009). Comparatively, at +0.15 V, the thermodynamics are favorable for a wider range of microorganisms and/or electron transfer mechanisms (Torres et al., 2009).
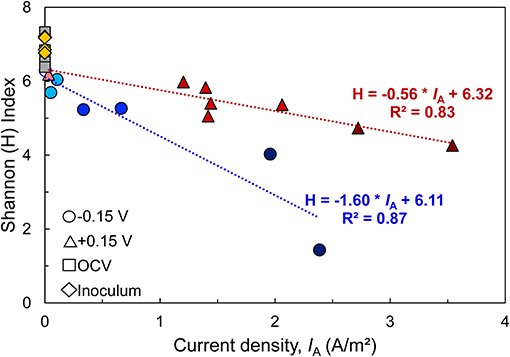
Figure 8. Relationship between microbial diversity [estimated by the Shannon Diversity index (H)] and bioanode current density (IA) recorded at the end of the startup cycle. A higher H index represents a more diverse microbial community. Linear regression of replicates from each fixed potential are represented by dotted lines (blue: −0.15 V, red: +0.15 V), along with regression equation and coefficient of determination (R2). Points with the same shape represent replicate bioanodes fixed at −0.15 V (circles) and +0.15 V (triangles). The points are shaded to reflect bioanode activity level (dark, high-activity; medium, low activity; light, inactive). Communities from the wastewater inoculum are shown as yellow rhombi and the open circuit (OCV) controls are represented as gray squares.
The more selective nature of −0.15 V is one possible reason why there was a higher number of inactive bioanodes at −0.15 V. Since the driving force for energy harvesting is lower at −0.15 V than +0.15 V, external forces that influence bioanode colonization and respiration, such as alternative electron acceptors, may have a stronger impact on biofilm development than at +0.15 V. We hypothesize that under those conditions, competition of Geobacter spp. with other microorganisms that are able to use the same electron donor and breathe on traces of other electron acceptors such as oxygen becomes more pronounced (Ren et al., 2014; Hasany et al., 2016). The relatively low abundance of Geobacter in inactive reactor bioanodes and suspension supports this hypothesis.
Coupling the microbial community data with the electrochemical properties described above, several interesting observations can be made. First, the relative abundance of Geobacter was closely linked with bioanode electrochemical behavior at −0.15 V, but not +0.15 V. From the low- to high-activity bioanodes at +0.15 V, the relative abundance of Geobacter deviated by only 12% and ranged from 44.5 to 62.3%. This trend matches well with the impedance data, wherein the total resistance across these same bioanodes varied by 10%. In contrast, at −0.15 V the relative abundance of Geobacter increased from 25.1 to 90.0% across these same activity levels, resulting in a total deviation of at least 53% compared to the average of all activity levels. Total bioanode resistance followed this pattern, with a 91% decrease in resistance between the low- to high-activity bioanodes. One possible explanation for why impedance did not vary with activity level for the +0.15 V bioanodes is that that potential selected for an EET pathway (i.e., from the terminal cytochrome to electrode) that was highly optimized for electron transfer to the anode. In that case, the rate of electron flow would depend on internal electron transfer processes (i.e., electron transport prior to EET) which would be a function of the “maturity,” or activity level, of those internal pathways during startup.
Conclusions
Our overall objective was to determine the impact of two anode potentials on the electrochemical and microbial characteristics of bioanodes during the first cycle of current generation. Within this objective, we also assessed the variability in these characteristics across a large (n = 8) set of replicates for each potential. We found that the anode potential (EAN; −0.15 V, +0.15 V vs. SHE) had a strong impact on the amount of time required to initiate current, the electrochemical properties [measured by cyclic voltammograms (CVs) and EIS], and the resulting microbial community composition. Even though variability across replicates was large, three distinct bioanode activity levels (defined based on the time required to reach a current density threshold) emerged within each EAN. Bioanodes fixed at −0.15 V required more time to initiate current, and total resistance was closely related to the startup current and abundance of Geobacter species in the biofilm. Bioanodes at +0.15 V initiated current faster and had less variability in total resistance and Geobacter abundance across bioanode activity levels. SEM images of the bioanodes were consistent with the electrochemical profiles. Highly active bioanodes at −0.15 V had homogeneous biofilm coverage whereas sparse colonization at +0.15 V was consistent with the higher total resistance at that potential. A larger decrease in community diversity with current production at −0.15 V indicated that this potential was more selective for Geobacter spp., whereas the more favorable exploitation of energy at +0.15 V allowed for a greater diversity of other microorganisms. Further studies are needed in order to gain a deeper insight of microbial dynamics within the community that forms during the startup phase as a function of EAN. Filling this knowledge gap may allow the design of more robust and predictable METs for practical applications.
Data Availability
Sequencing data was deposited into the GenBank database of the National Center of Biotechnology Information (NCBI), under the BioProject accession number PRJNA559682. Other generated datasets are available upon request to the corresponding author.
Author Contributions
JO-M designed the experiments, collected and analyzed the data. DC and JO-M wrote the manuscript.
Conflict of Interest Statement
The authors declare that the research was conducted in the absence of any commercial or financial relationships that could be construed as a potential conflict of interest.
Acknowledgments
This work was performed in part at the Analytical Instrumentation Facility (AIF) at North Carolina State University, which was supported by the State of North Carolina and the National Science Foundation (award number ECCS-1542015). The AIF is a member of the North Carolina Research Triangle Nanotechnology Network (RTNN), a site in the National Nanotechnology Coordinated Infrastructure (NNCI). Next Generation (Illumina) sequencing of microbial communities was performed by the Genomic Sciences Laboratory at North Carolina State University. Special thanks to Ling Wang and Chuck Mooney for their help during sequencing analysis and SEM visualization, respectively. This work was supported by funding from North Carolina State University.
Supplementary Material
The Supplementary Material for this article can be found online at: https://www.frontiersin.org/articles/10.3389/fenrg.2019.00103/full#supplementary-material
References
Borole, A. P., Aaron, D., Hamilton, C. Y., and Tsouris, C. (2010). Understanding long-term changes in microbial fuel cell performance using electrochemical impedance spectroscopy. Environ. Sci. Technol. 44, 2740–2745. doi: 10.1021/es9032937
Brown, R. K., Harnisch, F., Wirth, S., Wahlandt, H., Dockhorn, T., Dichtl, N., et al. (2014). Evaluating the effects of scaling up on the performance of bioelectrochemical systems using a technical scale microbial electrolysis cell. Bioresour. Technol. 163, 206–213. doi: 10.1016/j.biortech.2014.04.044
Call, D. F., and Logan, B. E. (2008). Hydrogen production in a single chamber microbial electrolysis cell lacking a membrane. Environ. Sci. Technol. 42, 3401–3401. doi: 10.1021/es8001822
Call, D. F., and Logan, B. E. (2011). A method for high throughput bioelectrochemical research based on small scale microbial electrolysis cells. Biosens. Bioelectron. 26, 4526–4531. doi: 10.1016/j.bios.2011.05.014
Call, D. F., Wagner, R. C., and Logan, B. E. (2009). Hydrogen production by Geobacter species and a mixed consortium in a microbial electrolysis cell. Appl. Environ. Microbiol. 75, 7579–7587. doi: 10.1128/AEM.01760-09
Caporaso, J. G., Kuczynski, J., Stombaugh, J., Bittinger, K., Bushman, F. D., Costello, E. K., et al. (2010). QIIME allows analysis of high- throughput community sequencing data. Nat. Publ. Gr. 7, 335–336. doi: 10.1038/nmeth.f.303
Commault, A. S., Lear, G., Packer, M. A., and Weld, R. J. (2013). Influence of anode potentials on selection of Geobacter strains in microbial electrolysis cells. Bioresour. Technol. 139, 226–234. doi: 10.1016/j.biortech.2013.04.047
Cusick, R. D., Bryan, B., Parker, D. S., Merrill, M. D., Mehanna, M., Kiely, P. D., et al. (2011). Performance of a pilot-scale continuous flow microbial electrolysis cell fed winery wastewater. Appl. Microbiol. Biotechnol. 89, 2053–2063. doi: 10.1007/s00253-011-3130-9
Dekker, A., Ter Heijne, A., Saakes, M., Hamelers, H. V. M., and Buisman, C. J. N. (2009). Analysis and improvement of a scaled-up and stacked microbial fuel cell. Environ. Sci. Technol. 43, 9038–9042. doi: 10.1021/es901939r
Dheilly, A., Linossier, I., Darchen, A., Hadjiev, D., Corbel, C., and Alonso, V. (2008). Monitoring of microbial adhesion and biofilm growth using electrochemical impedancemetry. Appl. Microbiol. Biotechnol. 79, 157–164. doi: 10.1007/s00253-008-1404-7
Escapa, A., San-Martín, M. I., Mateos, R., and Morán, A. (2015). Scaling-up of membraneless microbial electrolysis cells (MECs) for domestic wastewater treatment: bottlenecks and limitations. Bioresour. Technol. 180, 72–78. doi: 10.1016/j.biortech.2014.12.096
Feng, Y., Zhang, Y., Chen, S., and Quan, X. (2015). Enhanced production of methane from waste activated sludge by the combination of high-solid anaerobic digestion and microbial electrolysis cell with iron-graphite electrode. Chem. Eng. J. 259, 787–794. doi: 10.1016/j.cej.2014.08.048
Finkelstein, D. A., Tender, L. M., and Zeikus, J. G. (2006). Effect of electrode potential on electrode-reducing microbiota. Environ. Sci. Technol. 40, 6990–6995. doi: 10.1021/es061146m
Fricke, K., Harnisch, F., and Schröder, U. (2008). On the use of cyclic voltammetry for the study of anodic electron transfer in microbial fuel cells. Energy Environ. Sci. 1, 144–147. doi: 10.1039/b802363h
Guo, X., Liu, J., and Xiao, B. (2013). Bioelectrochemical enhancement of hydrogen and methane production from the anaerobic digestion of sewage sludge in single-chamber membrane-free microbial electrolysis cells. Int. J. Hydrogen Energy 38, 1342–1347. doi: 10.1016/j.ijhydene.2012.11.087
Hasany, M., Mardanpour, M. M., and Yaghmaei, S. (2016). Biocatalysts in microbial electrolysis cells: a review. Int. J. Hydrogen Energy 41, 1477–1493. doi: 10.1016/j.ijhydene.2015.10.097
Hiegemann, H., Herzer, D., Nettmann, E., Lübken, M., Schulte, P., Schmelz, K.-G., et al. (2016). An integrated 45 L pilot microbial fuel cell system at a full-scale wastewater treatment plant. Bioresour. Technol. 218, 115–122. doi: 10.1016/j.biortech.2016.06.052
Hutchinson, A. J., Tokash, J. C., and Logan, B. E. (2011). Analysis of carbon fiber brush loading in anodes on startup and performance of microbial fuel cells. J. Power Sources 196, 9213–9219. doi: 10.1016/j.jpowsour.2011.07.040
Illumina Inc. (2013). 16S Metagenomic Sequencing Library Preparation, 1–28. Available online at: http://support.illumina.com/content/dam/illumina-support/documents/documentation/chemistry_documentation/16s/16s-metagenomic-library-prep-guide-15044223-b.pdf (accessed August 21, 2017).
Janicek, A., Fan, Y., and Liu, H. (2014). Design of microbial fuel cells for practical application: a review and analysis of scale-up studies. Biofuels 5, 79–92. doi: 10.4155/bfs.13.69
Katuri, K. P., Kavanagh, P., Rengaraj, S., and Leech, D. (2010). Geobacter sulfurreducens biofilms developed under different growth conditions on glassy carbon electrodes: insights using cyclic voltammetry. Chem. Commun. 46, 4758–4760. doi: 10.1039/c003342a
Katuri, K. P., Rengaraj, S., Kavanagh, P., O'Flaherty, V., and Leech, D. (2012). Charge transport through Geobacter sulfurreducens biofilms grown on graphite rods. Langmuir 28, 7904–7913. doi: 10.1021/la2047036
Katuri, K. P., Werner, C. M., Jimenez-Sandoval, R. J., Chen, W., Jeon, S., Logan, B. E., et al. (2014). A novel anaerobic electrochemical membrane bioreactor (AnEMBR) with conductive hollow-fiber membrane for treatment of low-organic strength solutions. Environ. Sci. Technol. 48, 12833–12841. doi: 10.1021/es504392n
Korth, B., and Harnisch, F. (2019). Spotlight on the energy harvest of electroactive microorganisms: the impact of the applied anode potential. Front. Microbiol. 10:1352. doi: 10.3389/fmicb.2019.01352
Kouzuma, A., Meng, X. Y., Kimura, N., Hashimoto, K., and Watanabe, K. (2010). Disruption of the putative cell surface polysaccharide biosynthesis Gene SO3177 in Shewanella oneidensis MR-1 enhances adhesion to electrodes and current generation in microbial fuel cells. Appl. Environ. Microbiol. 76, 4151–4157. doi: 10.1128/AEM.00117-10
Kumar, A., Leech, D., Siggins, A., Katuri, K., Mahony, T., O'Flaherty, V., et al. (2013). Catalytic response of microbial biofilms grown under fixed anode potentials depends on electrochemical cell configuration. Chem. Eng. J. 230, 532–536. doi: 10.1016/j.cej.2013.06.044
Lee, H. S., and Rittmann, B. E. (2010). Significance of biological hydrogen oxidation in a continuous single-chamber microbial electrolysis cell. Environ. Sci. Technol. 44, 948–954. doi: 10.1021/es9025358
Lesnik, K. L., and Liu, H. (2014). Establishing a core microbiome in acetate-fed microbial fuel cells. Appl. Microbiol. Biotechnol. 98, 4187–4196. doi: 10.1007/s00253-013-5502-9
Levar, C. E., Hoffman, C. L., Dunshee, A. J., Toner, B. M., and Bond, D. R. (2017). Redox potential as a master variable controlling pathways of metal reduction by Geobacter sulfurreducens. ISME J. 11, 741–752. doi: 10.1038/ismej.2016.146
Liang, P., Duan, R., Jiang, Y., Zhang, X., Qiu, Y., and Huang, X. (2018). One-year operation of 1000-L modularized microbial fuel cell for municipal wastewater treatment. Water Res. 141, 1–8. doi: 10.1016/j.watres.2018.04.066
Liu, G., Yates, M. D., Cheng, S., Call, D. F., Sun, D., and Logan, B. E. (2011). Examination of microbial fuel cell start-up times with domestic wastewater and additional amendments. Bioresour. Technol. 102, 7301–7306. doi: 10.1016/j.biortech.2011.04.087
Logan, B. E. (2009). Exoelectrogenic bacteria that power microbial fuel cells. Nat. Rev. Microbiol. 7, 375–381. doi: 10.1038/nrmicro2113
Marsili, E., Rollefson, J. B., Baron, D. B., Hozalski, R. M., and Bond, D. R. (2008). Microbial biofilm voltammetry: direct electrochemical characterization of catalytic electrode-attached biofilms. Appl. Environ. Microbiol. 74, 7329–7337. doi: 10.1128/AEM.00177-08
Marsili, E., Sun, J., and Bond, D. R. (2010). Voltammetry and growth physiology of Geobacter sulfurreducens biofilms as a function of growth stage and imposed electrode potential. Electroanalysis 22, 865–874. doi: 10.1002/elan.200800007
Martin, E., Savadogo, O., Guiot, S. R., and Tartakovsky, B. (2013). Electrochemical characterization of anodic biofilm development in a microbial fuel cell. J. Appl. Electrochem. 43, 533–540. doi: 10.1007/s10800-013-0537-2
McMurdie, P. J., and Holmes, S. (2013). Phyloseq: an R package for reproducible interactive analysis and graphics of microbiome census data. PLoS ONE. 8:e61217. doi: 10.1371/journal.pone.0061217
Oksanen, J., Blanchet, F. G., Friendly, M., Kindt, R., Legendre, P., McGlinn, D., et al. (2017). Package “Vegan.” Community Ecology Package, 1–263.
Paitier, A., Godain, A., Lyon, D., Haddour, N., Vogel, T. M., and Monier, J. M. (2017). Microbial fuel cell anodic microbial population dynamics during MFC start-up. Biosens. Bioelectron. 92, 357–363. doi: 10.1016/j.bios.2016.10.096
Peng, L., Zhang, X. T., Yin, J., Xu, S. Y., Zhang, Y., Xie, D. T., et al. (2016). Geobacter sulfurreducens adapts to low electrode potential for extracellular electron transfer. Electrochim. Acta 191, 743–749. doi: 10.1016/j.electacta.2016.01.033
QIIME (2015). pick_open_reference_otus.py - Perform Open-Reference OTU Picking. Available online at: http://qiime.org/scripts/pick_open_reference_otus.html (accessed April 27, 2017).
Rabaey, K., Boon, N., Siciliano, S. D., Verhaege, M., and Verstraete, W. (2004). Biofuel cells select for microbial consortia that self-mediate electron transfer. Appl. Environ. Microbiol. 70, 5373–5382. doi: 10.1128/AEM.70.9.5373-5382.2004
Ramasamy, R. P., Gadhamshetty, V., Nadeau, L. J., and Johnson, G. R. (2009). Impedance spectroscopy as a tool for non-intrusive detection of extracellular mediators in microbial fuel cells. Biotechnol. Bioeng. 104, 882–891. doi: 10.1002/bit.22469
Ramette, A. (2007). Multivariate analyses in microbial ecology. FEMS Microbiol. Ecol. 62, 142–160. doi: 10.1111/j.1574-6941.2007.00375.x
Ren, L., Zhang, X., He, W., and Logan, B. E. (2014). High current densities enable exoelectrogens to outcompete aerobic heterotrophs for substrate. Biotechnol. Bioeng. 111, 2163–2169. doi: 10.1002/bit.25290
Rozendal, R. A., Hamelers, H. V. M., and Buisman, C. J. N. (2006). Effects of membrane cation transport on pH and microbial fuel cell performance. Environ. Sci. Technol. 40, 5206–5211. doi: 10.1021/es060387r
Srikanth, S., Marsili, E., Flickinger, M. C., and Bond, D. R. (2008). Electrochemical characterization of Geobacter sulfurreducens cells immobilized on graphite paper electrodes. Biotechnol. Bioeng. 99, 1065–1073. doi: 10.1002/bit.21671
ter Heijne, A., Schaetzle, O., Gimenez, S., Navarro, L., Hamelers, B., and Fabregat-Santiago, F. (2015). Analysis of bio-anode performance through electrochemical impedance spectroscopy. Bioelectrochemistry 106, 64–72. doi: 10.1016/j.bioelechem.2015.04.002
Torres, C. I., Krajmalnik-Brown, R., Parameswaran, P., Marcus, A. K., Wanger, G., Gorby, Y. A., et al. (2009). Selecting anode-respiring bacteria based on anode potential: phylogenetic, electrochemical, and microscopic characterization. Environ. Sci. Technol. 43, 9519–9524. doi: 10.1021/es902165y
Wagner, R. C., Call, D. F., and Logan, B. E. (2010). Optimal set anode potentials vary in bioelectrochemical systems. Environ. Sci. Technol. 44, 6036–6041. doi: 10.1021/es101013e
Wang, H., and Ren, Z. J. (2013). A comprehensive review of microbial electrochemical systems as a platform technology. Biotechnol. Adv. 31, 1796–1807. doi: 10.1016/j.biotechadv.2013.10.001
Wang, X., Feng, Y., Ren, N., Wang, H., Lee, H., Li, N., et al. (2009). Accelerated start-up of two-chambered microbial fuel cells: effect of anodic positive poised potential. Electrochim. Acta 54, 1109–1114. doi: 10.1016/j.electacta.2008.07.085
Wei, J., Liang, P., Cao, X., and Huang, X. (2010). A new insight into potential regulation on growth and power generation of Geobacter sulfurreducens in microbial fuel cells based on energy viewpoint. Environ. Sci. Technol. 44, 3187–3191. doi: 10.1021/es903758m
Yanuka-Golub, K., Reshef, L., Rishpon, J., and Gophna, U. (2016). Community structure dynamics during startup in microbial fuel cells - The effect of phosphate concentrations. Bioresour. Technol. 212, 151–159. doi: 10.1016/j.biortech.2016.04.016
Yates, M. D., Kiely, P. D., Call, D. F., Rismani-Yazdi, H., Bibby, K., Peccia, J., et al. (2012). Convergent development of anodic bacterial communities in microbial fuel cells. ISME J. 6, 2002–2013. doi: 10.1038/ismej.2012.42
Zacharoff, L., Chan, C. H., and Bond, D. R. (2016). Reduction of low potential electron acceptors requires the CbcL inner membrane cytochrome of Geobacter sulfurreducens. Bioelectrochemistry 107, 7–13. doi: 10.1016/j.bioelechem.2015.08.003
Zhang, F., Xia, X., Luo, Y., Sun, D., Call, D. F., and Logan, B. E. (2013). Improving startup performance with carbon mesh anodes in separator electrode assembly microbial fuel cells. Bioresour. Technol. 133, 74–81. doi: 10.1016/j.biortech.2013.01.036
Zhou, J., Liu, W., Deng, Y., Jiang, Y.-H., Xue, K., He, Z., et al. (2013). Stochastic assembly leads to alternative communities with distinct functions in a bioreactor microbial community. MBio 4, e00584–12. doi: 10.1128/mBio.00584-12
Zhu, X., Yates, M. D., Hatzell, M. C., Ananda Rao, H., Saikaly, P. E., and Logan, B. E. (2014). Microbial community composition is unaffected by anode potential. Environ. Sci. Technol. 48, 1352–1358. doi: 10.1021/es404690q
Keywords: microbial electrochemical technologies, bioanode, Geobacter, bioreactor start-up, bioenergy
Citation: Ortiz-Medina JF and Call DF (2019) Electrochemical and Microbiological Characterization of Bioanode Communities Exhibiting Variable Levels of Startup Activity. Front. Energy Res. 7:103. doi: 10.3389/fenrg.2019.00103
Received: 17 June 2019; Accepted: 04 September 2019;
Published: 19 September 2019.
Edited by:
Uwe Schröder, Technische Universitat Braunschweig, GermanyReviewed by:
Benjamin Korth, Helmholtz Centre for Environmental Research (UFZ), GermanyPascal E. Saikaly, King Abdullah University of Science and Technology, Saudi Arabia
Copyright © 2019 Ortiz-Medina and Call. This is an open-access article distributed under the terms of the Creative Commons Attribution License (CC BY). The use, distribution or reproduction in other forums is permitted, provided the original author(s) and the copyright owner(s) are credited and that the original publication in this journal is cited, in accordance with accepted academic practice. No use, distribution or reproduction is permitted which does not comply with these terms.
*Correspondence: Douglas F. Call, ZGZjYWxsQG5jc3UuZWR1