
95% of researchers rate our articles as excellent or good
Learn more about the work of our research integrity team to safeguard the quality of each article we publish.
Find out more
ORIGINAL RESEARCH article
Front. Energy Res. , 14 June 2019
Sec. Solar Energy
Volume 7 - 2019 | https://doi.org/10.3389/fenrg.2019.00056
This article is part of the Research Topic Applications of Monte Carlo Method in Chemical, Biochemical and Environmental Engineering View all 8 articles
In this study we assess whether availability of silver could constrain a large-scale deployment of solar photovoltaics (PV). While silver-paste use in photovoltaics cell metallization is becoming more efficient, solar photovoltaics power capacity installation is growing at an exponential pace. Along photovoltaics, silver is also employed in an array of industrial and non-industrial applications. The trends of these uses are examined up to the year 2050. The technical coefficients for the expansion in photovoltaics power capacity and contraction in silver paste use have been assessed through an expert-consultation process. The trend of use in the non-PV sectors has been estimated through an ARIMA (auto-regressive integrated moving average) model. The yearly and cumulative silver demand are evaluated against the technological potential for increasing silver mining and the estimates of its global natural availability, respectively. The model implemented is tested with a quasi-random Monte Carlo variance-based global sensitivity analysis. The result of our inquiry is that silver may not represent a constraint for a very-large-scale deployment of photovoltaics (up to tens TW in installed power capacity) provided the present decreasing trend in the use of silver paste in the photovoltaics sector continues at an adequate pace. Silver use in non-photovoltaic sectors plays also a tangible influence on potential constraints. In terms of natural constraints, most of the uncertainty is dependent on the actual estimates of silver natural budget.
Large-scale development of renewable energy is a conditio sine qua non for an energy transition away from fossil-fuel-based power sources. Plenty of efforts are being devoted to foster a rapid growth of low-carbon technologies with appreciable results in terms of renewable-energy power-capacity installed for electricity production.
In this contribution we aim to shed light on silver use for the front-contact metallization of crystalline-silicon-based photovoltaics (PV) cells. We analyse whether silver may represent a constraint for the large-scale deployment of photovoltaic power capacity up to the year 2050.
This potential criticality also applies to other renewable-energy-based technology that resort to scarce metals for the manufacturing of the energy-harvesting devices. This theme has recently attracted the attention of many scholars (Feltrin and Freundlich, 2008; Kleijn et al., 2011; Zuser and Rechberger, 2011; Elshkaki and Graedel, 2013, 2015; Grandell and Thorenz, 2014; Davidsson and Höök, 2016). A pioneering contribution on solar photovoltaics was published by (Feltrin and Freundlich, 2008), where the authors assessed several solar technologies. Commenting on crystalline-silicon-based technologies, the authors concluded that the installed power of solar panels could hardly overcome the Terawatt (TW) threshold under the silver paste use per unit of power at the time of the study. Kleijn et al. (2011) estimated the increase in the annual requirement of the mined commodity under a high PV penetration scheme for electricity generation. Elshkaki and Graedel (2013) have performed a similar accounting for all renewable energies. In their scenarios, the share of first-generation solar PV progressively decreases in favor of second generation, thin-film based. Zuser and Rechberger (2011) tackled the mineral resources availability for the equal deployment of four different types of PV technology. The scenario addressed in their contribution considered a production of 25% of the electricity coming from PV by 2040, amounting to 10,000 TWh per year (roughly half of the current global electricity consumption). The crucial assumption of these authors is that crystalline-silicon-based PV will be gradually substituted by three types of the second-generation PV technologies, i.e., (i) amorphous silicon in tandem configuration, (ii) cadmium telluride, and (iii) copper-indium-gallium diselenide PV. The result of Zuser and Rechberger (2011) investigation is that silver, tellurium and indium could be considered as critical materials, with tellurium and indium representing a more stringent constraint for the PV sector development. A moot point in this discussion is whether the second-generation PV systems can smoothly replace the currently dominant crystalline-silicon PV. In the literature it has been largely claimed that second-generation-PV technologies will increase their share to the detriment of first-generation PV (i.e., crystalline-silicon based). As of today, the PV market is still largely based on crystalline-silicon-wafer solar modules, with a share of more than 90%. This figure does not show any apparent sign of decline (International Energy Agency IEA, 2016) in spite of the proliferation of second- and third-generation solar photovoltaics technologies based on thin-film, organic/polymeric materials (Chen et al., 2012) and so forth. Therefore, the constraint imposed by silver natural budget could be the most severe in light of the current trends. Grandell and Thorenz (2014) focused their analysis exclusively on the several solar technologies requiring the use of silver and concluded that these could provide a significant fraction of future world electricity under the condition that the reduction in silver content in the cells proceeds at an adequate pace. However, their model rested on the assumption that the market share for this application would not have overcome the 5% threshold. This market-oriented assumption no longer holds as this figure was already exceeded in recent years (The Silver Institute, 2018). According to Jean et al. (2015) and García-olivares (2015), silver would not represent a criticality for a TW-scale deployment of photovoltaics even under the current typical silver-based contact paste consumption. According to these authors, the considerable progress made in replacing the use of the metal also for the front-contact metallization would allow to timely move away from silver use. In fact, available data show that the use of silver for the commercial solar panels amounted to 100 mg/cell as of 2017, with a constant declining trend over the previous years. Yet a slower pace has been recently documented (PV Technology Roadmap Forum, 2010; Fischer et al., 2011; International Technology Roadmap for Photovoltaics, 2012; GiorgoForstner et al., 2014; International Technology Roadmap for Photovoltaic, 2015) with a decrease of <10% on 2017 against 2015. According to the second ITRPV release (Fischer et al., 2011), silver was to totally be replaced by copper in 2015. However, this goal has been systematically moved forward in time and technological developments does not seem to promise a rapid and full silver replacement. While the reduction in silver use for the rear contact of the cells with partial substitution with aluminum is already standard practice in the industry, the same does hold for the frontal part yet. Several efforts have been made as to decrease the amount of silver used in the contact metallization, partially replacing it with copper or copper composites (Wood et al., 2015; Panek et al., 2016). A nickel barrier (Kraft et al., 2015) is typically coated onto the cell as to prevent the copper diffusion into the silicon mass, which would result in hampering the cell performance. While the research results in the use of copper-nickel alloys for the frontal contact metallization are promising, the experts from the field agree that the total substitution of silver is still an unresolved matter for the forthcoming years (Schubert et al., 2013).
Silver uses also include traditional non-industrial applications such as jewelery, coins, medals, ingots and general silverware. Other industrial applications are in the fields of electrical and electronics equipment, brazing alloys and solders, and as catalyst in the ethylene-oxide synthesis. The use of silver for photography has seen a constant and drastic decrease due to the marginalization of developing films. Other minor, but still consistent, applications reside in water purification, food hygiene, medical and textiles due to the biocide action of the metal. Finally, the metal is also used in radio frequency identification tags as well as wood preservatives (Grandell and Thorenz, 2014). A large deployment of solar photovoltaics could conflict with all these other uses and potentially create a competition in the metal's demand. Silver recycling from photovoltaics modules will represent in the future a potential significant source in the light of the current increasing exponential trend of PV deployment. In the literature, the actual percentage of metal recoverable from PV modules has been amply debated, with the most recent estimates (Paiano, 2015) amounting to 30–50% of the total metal. Yet lacking a standard procedure, several chemical and thermal methods have been proposed. A recovery of 94% of the material has been claimed (Dias et al., 2016) via nitric acid leaching and final precipitation.
In terms of natural availability, the crustal abundance of silver amounts to 0.1 g t−1, placing it as the 65th most abundant metal. Yet metal accessibility and extractability is hardly influenced by its crustal abundance: It is the presence of a sufficient number of sites with an adequately high concentration that plays a prominent role in metal mining. For instance, the yearly amount of silver mined overcome that of indium by two order of magnitudes despite their similar crustal abundance. This is due to the number of deposits with a profitable concentration of ore for silver, which are far less for indium (Vesborg and Jaramillo, 2012). Silver concentration can be as high as 400 g t−1 in some combined zinc-lead-silver ores, or even 2,000 g t−1 in pure silver ores (Vesborg and Jaramillo, 2012). In addition, the recoverability of a metal is also determined by the ease of separation from companion metals. Silver is mostly mined as by-product in lead, zinc, copper or gold deposits (Nassar et al., 2015). In these mines the more abundant host metal is recovered first, and the by-product (companion metal) can be either recovered or simply discarded. When silver's concentration is adequately high, the metal can be mined alone, although these favorable circumstances are less frequent. This contributes to some inelasticity in the price of silver as its extraction tends to follow the demand curve of the host metal(s).
As regards silver natural abundance, its figures vary depending upon whether reserves or resources are being considered. According to United States Geological Survey (2012), resources estimates include the total amount of a certain metal, excluding any evaluation of its recoverability. That is to say, identified and undiscovered metal resources are equally included. Undiscovered resources account for the amounts likely present but not yet characterized. Conversely, reserves represent the identified mineral resources minable under the present economic and technological conditions. The definition has an implicit dynamic character due to the numerous influencing factors, such as the price of the commodity as well as interlinked technological factors. These aspects affect deposits profitability and the efforts allocated toward overcoming potential natural and economic barriers. However, one should bear in mind the reserve/resource distinction is also variable from country to country due to the different national codes adopted in the official statistical accountings (Mudd et al., 2017). Gordon et al. (2006) estimates the amount of silver resources up to 4,000 Gg (i.e., 4,000,000 metric tons-4,000 ktons), although the authors do not provide any insight on its actual recoverability. The estimation is simply derived by triangulating the crustal abundance of Zn and Cu with the Ag concentration in these mining sites from which silver may be recovered as companion metal. According to Sverdrup et al. (2014) the ultimate recoverable reserves amount to 2,500 ktons. Other studies produced different estimates, which depend on the mining project censuses and estimates (Mudd et al., 2017; Mudd and Jowitt, 2018). For instance, Mudd places the global availability of silver from Pb-Zn deposits alone at more than 800 ktons, on the basis on a global census of several mining countries. Yet the author admits that this estimate is not entirely exhaustive. In comparison, the estimates of the USGS survey appear quite conservative (530 ktons) (National Minerals Information Center, 2018), a fortiori because it includes the estimation from all the typologies of mines from which silver is typically extracted (Pb-Zn, Cu, Au and Ag). Globally, the overall quantity of metal annually mined amounts to around 30 ktons (National Minerals Information Center, 2018) with a generally increasing trend over the course of the Twentieth century (National Minerals Information Center, 2018).
Several ways to model trends in mineral production and demand have been proposed in the literature. In some studies, constraints were simply assessed by comparing the cumulative demand figures against the natural budget available (Feltrin and Freundlich, 2008; Kleijn et al., 2011; Zuser and Rechberger, 2011; Elshkaki and Graedel, 2013; Grandell and Thorenz, 2014; Davidsson and Höök, 2016). Other assessments include Hubbert curves, which are symmetric logistic distribution used in the approximation of the production rate of a resource over time (Heinberg, 2005, 2007, 2011; Ragnarsdottir et al., 2012; Sverdrup et al., 2013, 2014; Roper, 2016). While the models suggested and the underlying hypotheses are different, all these latter works place the peak production of silver between 2030 and 2040.
Recycling of old scrap should also be considered in addition to mining primary resources. According to the most up-to-date figures for the US (Butterman and Hilliard, 2005), most of the scrapped silver-based material comes—not surprisingly—from the photography sector. Lower quantities are obtained from catalysts recycling and finally electronics (Hilliard, 2000). The trend can be explained in light of the declining use of silver in photography with the growth of unused supplies. However, this trend is bound to change in the forthcoming years due to the depletion of unused supplies.
The following section describes the data sources and methods adopted in our approach to model the demand and the silver extraction up to the year 2050. The stakeholder engagement process for assessing the technical coefficients is also discussed, along with the global sensitivity analysis performed on the model. A discussion of the results is presented in section Results, followed by our main conclusions.
The amount of yearly silver demand has been assessed by considering four driving parameters, i.e.,
i) the amount of silver in the paste used for the contact metallization of crystalline-silicon-based first-generation solar cells
ii) the power capacity of first-generation crystalline-silicon-based solar modules
iii) the increase in efficiency of the crystalline-silicon-based first-generation solar cells
iv) the silver use in non-photovoltaic applications (other industrial and non-industrial)
Our equation for the yearly amount of silver used mAg as a function of time in the 2017–2050 range is:
Where t is time relative to the base year (2017); mAg, PVis the amount of silver paste used per unit of photovoltaic cell (100 mg/cell) in the starting year (2017) (International Technology Roadmap for Photovoltaic, 2018); PVPCis the yearly amount of photovoltaic power capacity installed in 2017 (99 GW) (REN21, 2018); ηFGis the share of first-generation crystalline-silicon based solar modules (0.9); nPVAg represents the amount of silver demand for non-PV uses (The Silver Institute, 2018); PVefficiency represents the typical cell efficiency (4.27 W/cell) in the base year (International Technology Roadmap for Photovoltaic, 2018). The typical loss in efficiency from cells to modules has been considered insignificant for the purposes of the present model.
In Equation (1) the yearly variations have been modeled as exponential following the coefficients Rs. A decreasing trend has been assumed for the use of silver paste for the contact metallization, whereas a positive trend has been assumed for the increase in cells efficiency. A positive trend has also been taken for the PV yearly capacity installed. The trend of non-PV silver use has been modeled through an auto-regression moving average approach (Hyndman and Athanasopoulos, 2018). Several of the parameters have been randomized: rather than producing a single deterministic value, a range of possibilities has been evaluated. This has been performed in the interest to fully acknowledge the option space, rather than carrying out a merely deterministic scenario. To the best of our knowledge, it is the first time this type of approach is carried out in the assessment of the potentiality of silver constraint to a large scale solar photovoltaics development. Rcellefficiency has been kept fixed instead at 0.10 y−1, resulting in a final cell efficiency of 6.10 W/cell in the year 2050. The share of first-generation crystalline-silicon based power capacity deployed has been kept constant at 0.9.
Forty-nine experts have been contacted as to achieve a robust estimation for the various trends up to the year 2050, distributed as follows: thirty experts of PV contact-metallization, fifteen energy international agencies as well as four silver-market agencies/relevant statistical institutes. The contact-metallization experts are practitioners from the industry and research-and-development institutes or spin-offs, as well as academics from relevant applied faculties for solar photovoltaics. Conversely, the energy agencies are represented by well-known international agencies, such as the International Renewable Agency (IRENA), the International Energy Agency (IEA), as well as by experts from relevant working groups of the affiliated Photovoltaic Power System Programme (IEA-PVPS). Each category has been submitted a survey (enclosed in the Supporting Info) asking respectively for their personal estimation about:
i) silver-use in contact metallization;
ii) overall solar-photovoltaic power capacity deployment;
iii) other industrial (all the sectors with the exception of photovoltaics) and non-industrial silver use;
The survey consisted in two questions: (a) an estimation for the parameter in the year 2050; (b) the pace at which the development would have been progressing until 2050. The experts engaged were also asked whether they felt comfortable with a constant rate of change.
Fourteen answers have been received—ten from contact-metallization experts and four from energy agencies. The answers from the energy institutes were mostly brief and focused on providing a quantitative assessment of the future photovoltaics deployment. Conversely, the reflections from the contact-metallization experts were more elaborated. Unfortunately, no answers from statistical institute nor silver-market agencies on sectoral silver-allocation future trends have been received.
An element present in the reactions of most of the engaged experts is the fact that 2050 is too far away in time to produce an accurate quantitative estimate. For two of the contacts engaged the amount of uncertainty is so high that an attempt of quantification would be almost meaningless. According to one of the experts, the fact that the more than half current solar photovoltaics components manufacturers are being produced in China—this figure rises up to 90% once the production taking place in Taiwan and Malaysia is included—makes the exercise of consulting with European sector experts inadequate.
Most of the experts feel rather confident in remarking that silver will not represent an issue in the long term, as in due time a technology will be available to emancipate from its use. One expert has remarked that new technologies have not yet been adopted due to the fact that silver paste is still the cheapest option for contact metallization of crystalline-silicon-based solar photovoltaic cells. Should there been a sudden rise in silver price, the industry could rapidly implement options to completely move away from silver use. However, the pending issue remains at what pace this could take place. One expert calls for a World Trade Organization intervention to ban silver-use in non-essential applications (included contact-metallization of crystalline solar cells) as to speed up the transition away from silver use. Only one expert believes silver may still represent a constraint for a large-scale deployment of solar photovoltaics. Finally, one of the engaged experts suggests that scenarios based on a large development of second-generation thin-film based photovoltaics examined in the literature are built on dubious narratives.
Many of the quantitative estimate of the experts converge toward the extrapolation of the current ITRPV figures to the year 2050 (International Technology Roadmap for Photovoltaic, 2018). A few experts propose slightly different quantitative figures, yet in line with these estimates. Finally, two respondents go as far as to predict that silver use would be virtually null in the year 2050.
To recapitulate, these are the quantitative estimates proposed:
- ITRPV trends extrapolated to 2050 (two experts) (International Technology Roadmap for Photovoltaic, 2016);
- No silver-paste use for contact metallization by 2050 (two experts);
- 10 mg/cell;
- 20 mg/cell;
- 5–7% yearly decrease;
- 4–6% yearly decrease.
Unfortunately, the data proposed by one of the experts had to be neglected due to the fact that it was limited to the year 2030 with no suggestion provided on how to extrapolate the figures provided to 2050. As regards the pool of assessments considered, the IEA Technology roadmap (International Energy Agency IEA, 2014) has been considered: the document foresees an increase in installed PV solar capacity up to 4,670 GW by the year 2050. Another report proposed a more generous estimate (Teske, 2015), presenting a deployed PV power capacity of 9,295 GW. The most optimistic estimate is the one produced by the Fraunhofer Institute (Henning and Palzer, 2015), according to which the deployed PV power capacity will amount to 30,700 GW by the year 2050. According to the study, a tremendously high share of electricity will be generated from PV in the decades to come as this technology is bound to become the cheapest on the market. Putting together these scenarios, photovoltaics is assumed to meet a global electricity production in the 10–75% range in the year 2050.
A normal distribution truncated to zero for the rate of silver-use reduction has been generated on the basis of the estimates provided. The forecast of null silver use by the year 2050 have been translated as 1% of the base year for the purpose of setting the upper limit for the rate of reduction. The increased rate of solar power capacity installation has been also modeled with a truncated normal distribution. The maximum corresponds to the Fraunhofer Institute projection. Silver use in the non-PV sector has been modeled on the basis of the World Silver Survey trend from 2006 onwards through an ARIMA regression as detailed in section Theoretical model.
An uncertainty analysis has been performed along with a global sensitivity analysis. Sample sizes of 213 (8,192) quasi-random values from the low-discrepancy Sobol quasi-random distribution were selected (Bratley and Fox, 1988; Broda Ltd., 2017) and global sensitivity analysis has been run via Monte Carlo simulations. After taking a quasi-random sample within the assumed distribution, the estimators for the first-order and total variance-based sensitivity indices have been computed according to the procedure illustrated in Saltelli et al. (2010) (Table 2 therein). Global sensitivity analysis allows to efficiently explore the entire sampling space (Saltelli et al., 2004) by studying the effect of simultaneous variation of the input variables. This allows to capture high-order-multiple-parameter interactions, which are left unaddressed when changing only one variable at the time (OAT). Although the literature mostly reports OAT sensitivity analyses (Ferretti et al., 2016; Saltelli et al., 2019), these can explore only a tiny portion of the sampling space. This implies that the uncertainty of the model would be grossly underestimated (Saltelli and Annoni, 2010). As regards our case study, global sensitivity analysis can describe the effect which the interaction among the uncertain variables would produce on the output uncertainty. For a thorough description of global sensitivity analysis, see (Saltelli et al., 2008).
As regards silver annual production, it is assumed 80% of the demand can be met with extraction of new virgin resources, while the remainder 20% is provided through old-scrap recycling. These figures are in line with the most recent observations by the World Silver Survey Institute (The Silver Institute, 2018). The pace of silver extraction has been extrapolated with an ARIMA model on the basis of the trend observed by USGS in the years after World War II (National Minerals Information Center, 2018). Cumulative figures were compared against the estimated ultimate recovery figures for silver (Gordon et al., 2006; Sverdrup et al., 2014; National Minerals Information Center, 2018). These latter have been modeled as uniformly distributed in the range 530-4,000 kton, i.e., spanning the most conservative and the most optimistic estimates of silver natural availability.
The effect of silver price on silver demand and production is not taken into account. Market agents can effectively intervene by triggering further efforts in exploration and technological solutions in an under-supply regime characterized by higher prices. For instance, companies could be motivated to improve the recovery conditions as well as to explore fields previously considered non-economically viable (Mudd et al., 2017). Conversely, any excess in supply would drive the opposite mechanism by lowering the commodity price and with it the efforts toward the exploration of new areas. However, markets mechanisms are ineffective to perform any balancing function when the absolute physical limits are approaching. As the aim of this contribution is to account for the potential conditions under which the silver natural budget could be overshoot, the silver-price element would act as a mere oscillatory mechanism alongside the overall trajectory toward the limit. In summary, monetary economic effects are assumed to fall within the uncertainty range proposed for the parameters modeled.
The simulations were run on a Jupyter Notebook using a source code based on Python 3.5+. The script is available from the following repository: https://github.com/Confareneoclassico/SilverPaper. Sensitivity indices were bootstrapped (Archer et al., 1997; Puy et al. under consideration) 1,000 times as to produce robust estimates.
Samples from the parameters distributions were generated by the integral transformation of the Sobol low-discrepancy sequences through their inverse cumulative distribution functions. The ARIMA model was run on the observed trends of silver use in the non-photovoltaic sector and of extraction capacity. A noise factor (normally distributed with null mean and a standard deviation of 0.3) was also taken into account. Truncated normal distributions were finally generated on the basis of the ARIMA fitting output (mean and 95% confidence interval) for both the parameters. Finally, all the samples were fed into 8,192 Monte Carlo simulations for the uncertainty analysis. Sensitivity analysis was run on 1,000 boot-strap replicas (with repetition) of the simulation pool.
The trends for the yearly silver demand are presented in Figure 1A: the factors driving an increase of silver use are in most of the cases dominating the contribution over the factors driving a decrease. In fact, the distribution mean increases from 34 (30–39 P2.5, P97.5) kton in the year 2018 to 41 (35–51 P2.5, P97.5) kton in the year 2050.
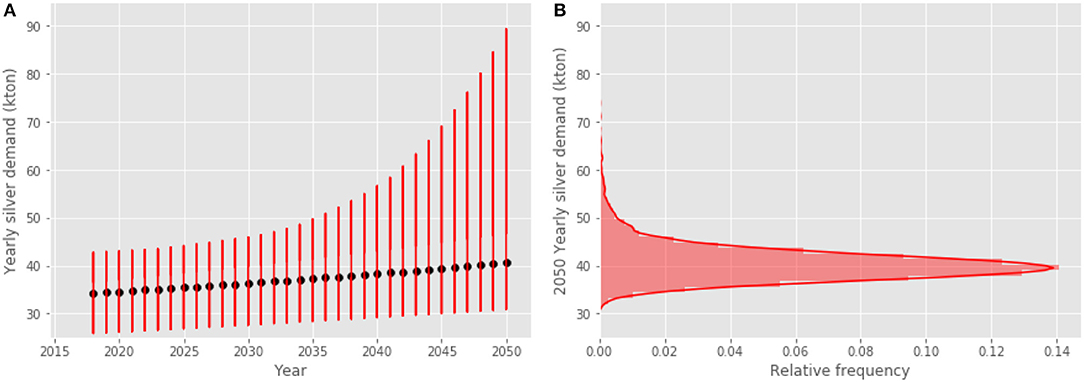
Figure 1. (A) Yearly trend of silver demand (kiloton per year) over 2018–2050 according to the Monte Carlo simulations run on 8,192 quasi-random samples. The means of the yearly distributions are shown in black. (B) The distribution of the simulations outcome for the year 2050 (yearly silver demand against relative frequency).
Note that the 8,192 points are not distributed uniformly. As regards the year 2050, a few points (about 3% of the simulations) are beyond the 50 kiloton threshold (Figure 1B).
Thus, the silver consumption trend toward 2050 could be stable or slightly increasing according to most of the simulations.
The distribution of silver demand from the photovoltaics sector shows a stable/slightly-decreasing trend (Figure 2A). In fact for about 75% of the simulations, the projected demand in the year 2050 is below 2018 (Figure 2B). Yet a very fat tail is present (Figure 2B) with about 3% of the simulations reporting a demand higher than 10 kton in 2050.
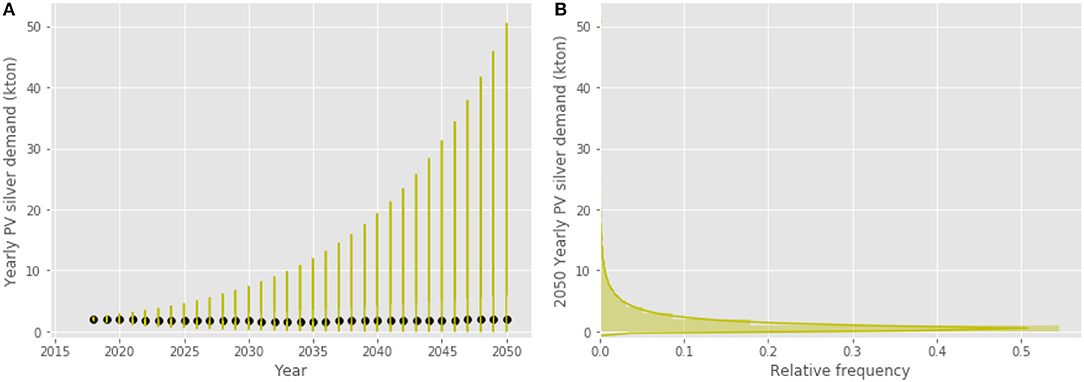
Figure 2. (A) Yearly trend of silver demand for the photovoltaic sector (kiloton per year) over 2018–2050 according to the Monte Carlo simulations run on 8,192 quasi-random samples. The means of the yearly distributions are shown in black. (B) The distribution of the simulations outcome for the year 2050 (yearly silver PV demand against relative frequency).
Silver demand is estimated to be overall increasing on a year-on-year basis as the sign of the first derivative is positive (Figure 3) except for a very small fraction of simulations (<1%) for the years 2019–2020.
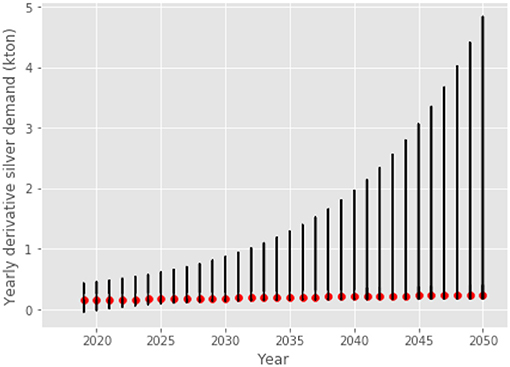
Figure 3. Year-on-year variation of the silver demand (kiloton per year) over 2018–2050 according to the Monte Carlo simulations run on 8,192 quasi-random samples. The means of the yearly distributions are shown in red.
Based on (Giampietro et al., 2013; Saltelli and Giampietro, 2017), we suggest looking at the problem using the categories of feasibility and viability. Viability and feasibility allow to map potential metabolic pattern of societies by defining potential constraints these latter may come across. Constraints that may be of an endogenous nature (lack of socio-techno-economical production factors within society) or exogenous (due to factors outside of human control, such as natural resource availability). Precisely:
• By feasibility we intend here the natural constraint, i.e., whether the amount of silver naturally available would allow to sustain the projected consumption pattern.
• By viability we mean here the constraint posed by the techno-economic means available. Would these allow for an expansion of the extractive capacity of silver?
Feasibility imposes a more stringent constraint as it refers to a so-called planetary boundary, impossible to overcome. An unviable scenario points to a technical and societal constraint, hence it may still be feasible. However, the reverse does not hold—an unfeasible scenario is certainly not viable.
We have chosen this type of assessment over a peak-based narrative due to the high uncertainty in in the knowledge about the actual mineral natural budget available (Mudd et al., 2017).
Viability is evaluated as the difference of the yearly silver demand against a hypothetical trend of metal extraction.
Feasibility is evaluated as the difference of cumulative silver demand against the available natural budget for the metal. The natural budget of silver has been decremented along years by subtracting 80% of the cumulative demand up to a given year (it is assumed also in this assessment the remainder can be met by old-scrap recycling).
Results for viability are shown in Figure 4. Potential constraints may already emerge in the near future although only 9% of the simulations forecast a deficit in the year 2050. A large deficit of more than 10 kton in the year 2050 results only from a limited fraction (< 1%) of the simulations.
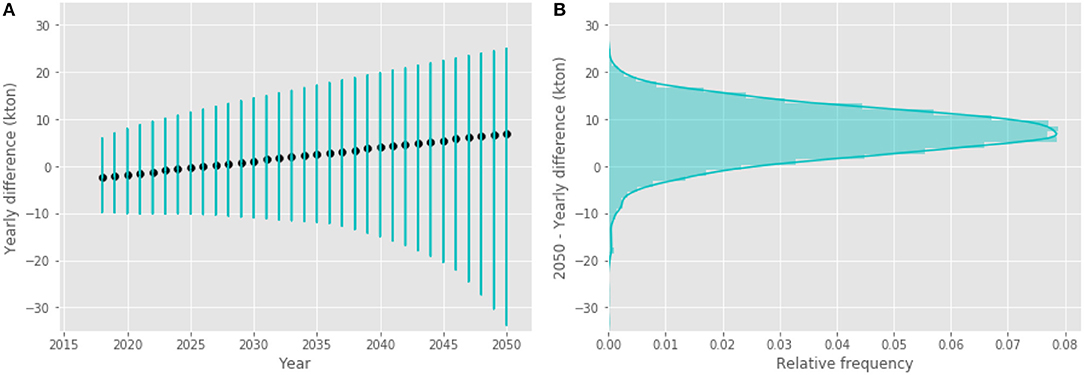
Figure 4. (A) Yearly difference between the extrapolated extraction capacity and 80% of the projected yearly demands (20% has been assumed to be met by scrap recycling) over 2018–2050. Negative values correspond to a deficit (demand higher than extraction capacity). Monte Carlo analysis simulations run on 8,192 quasi-random samples. The means of the yearly distributions are shown in black. (B) The distribution of the simulation outcomes for the year 2050 (yearly silver difference against relative frequency).
However, these viability figures need to be corroborated against feasibility estimates. Were a natural budget constraint present, the projected scaling up of the mining capacity would be invalidated by the incurred physical limit. As per Figure 5, feasibility constraints may also appear. In fact, some scenarios point at possible overshoots of the natural budget already in early 2030s. 13% of the simulations point to a potential natural deficit for the year 2050.
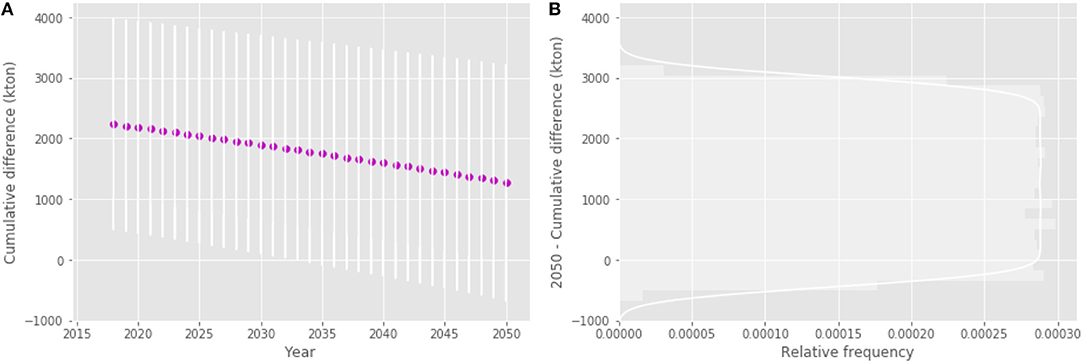
Figure 5. (A)Yearly difference between silver natural budget (kton) and 80% of the cumulative silver demand over 2018–2050; Negative values correspond to a deficit (demand overshooting the natural budget). Monte Carlo simulations run on 8,192 quasi-random samples. The means of the yearly distributions are shown in magenta. (B) The distribution of the simulation outcomes for the year 2050 (cumulative silver difference against relative frequency).
Scatter plots may be used to graphically illustrate the sensitivity of the output uncertainty to the uncertainty in the input parameters described in Table 1. While silver use in non-PV sector is by far the most important parameter in the first year of the simulation (2018), its effect on the output uncertainty decreases over the course of the years. The PV-sector parameters show a specular trend. Furthermore, the increase in heteroscedasticity of their trends may point to higher-order interaction effects.
Sobol' variance-based sensitivity indices are a robust method to evaluate the effects of the input parameters on the output uncertainty. These indices provide a crispy quantitative information about sensitivity: the indices are in the range 0, 1 and the higher the index the more important the parameter. The value of the first order sensitivity index tells—loosely speaking—which fraction of the output variance the factor is responsible for—for a more precise definition see (Saltelli et al., 2008). We also use in Figure 7 the second order sensitivity index, which informs about the fractions of the variance—again loosely speaking- due to the coupling (interaction) of two factors.
Note that for a model with three independent factors the indices of first and higher order would be related to one another via Equation (2)
i.e., with three main effects, three second order effects and one third order effect (Saltelli et al., 2008).
In the case described in the present work, the relation between PVPCRi and PVAgRd on one side, and nPVAg on the other side is additive. This implies no higher-order interactions across these two sets of terms. Therefore, four terms suffice to apportion the output variance on the inputs. Hence, equation 2 simplifies to the four terms below as SPVPCRi, nPVAg, SPVAgRd, nPVAgand SPVPCRi.PVAgRd, nPVAg are null:
The scatter plots shown in Figure 6 allow to visually appreciate how the effect of input parameters uncertainty on the output variance evolves across years. The same piece of information is conveyed by Figure 7 in the form of the aforementioned sensitivity indices: The decrease in importance of the use of silver in the non-PV sector over time is shown by the decreased sensitivity of variable nPVAg. The other variables AgPVRd and PVPCRi show an exactly specular trend. In the year 2050, only 31% of the output variance is explained by silver use in non-PV sectors. The remainder can be apportioned to AgPVRd (32%), PCPVRi (15%) and the interaction of these two parameters (22%).
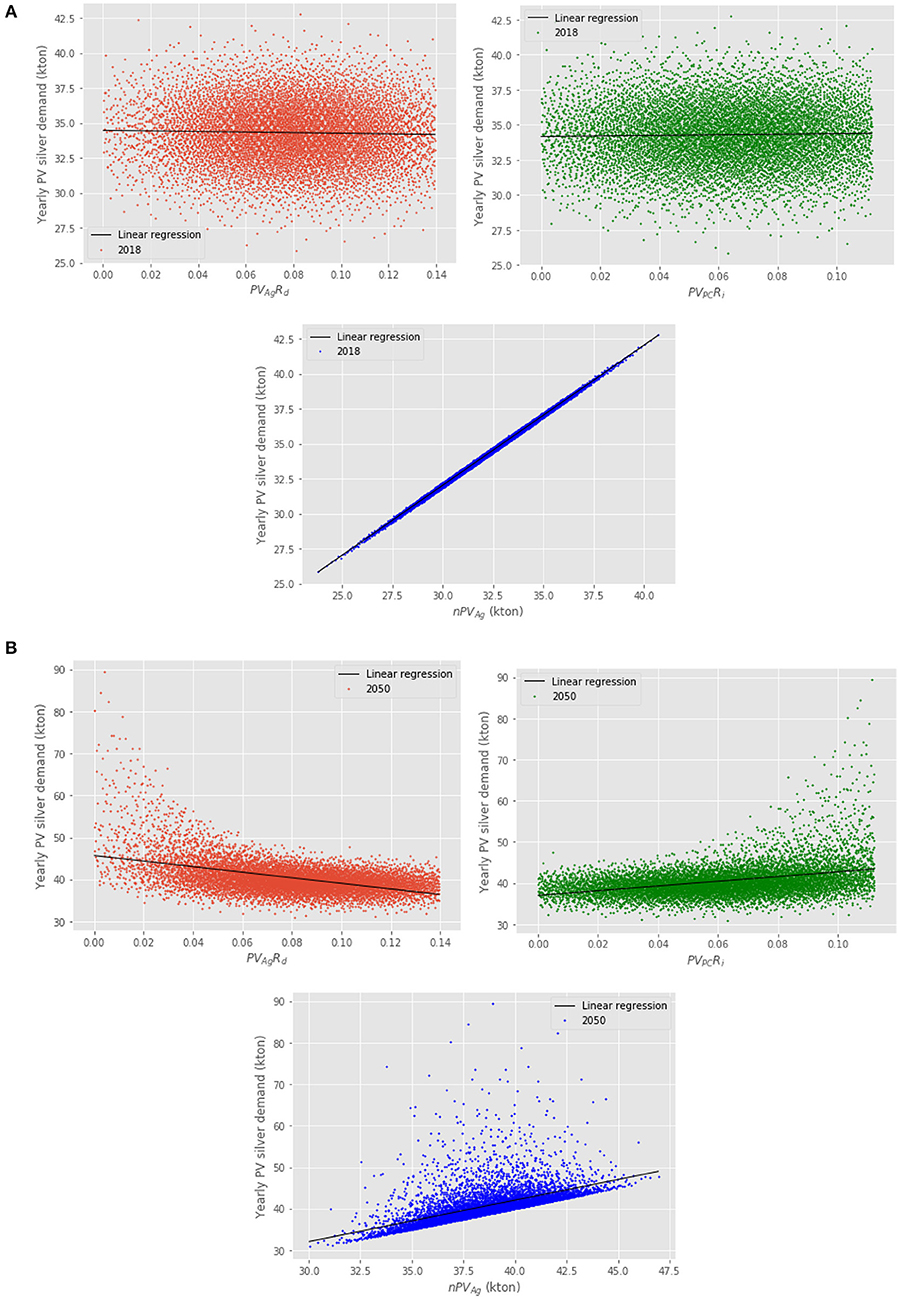
Figure 6. (A) The scatter plots of the Monte Carlo simulations run on 8,192 quasi-random samples. From top-left corner, the yearly silver demand (kton) in the year 2018 is presented against: (i) the decreasing pace of silver use in contact metallization; (ii) the increasing pace of PV modules installation; (iii) the demand from non-PV applications (kton). The line represents the linear fitting of the overall trends. (B) The scatter plots of the 8,192 quasi-random Monte Carlo simulations of the yearly silver demand in the year 2050. The order is the same as per (A).
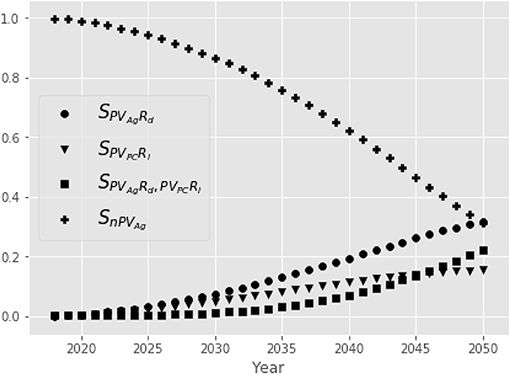
Figure 7. Global sensitivity analysis of the Monte Carlo simulations over 2018–2050 run on 8,192 quasi-random samples. Data have been bootstrapped 1,000 times with replacement. The first-order sensitivity index for (i) silver use in contact metallization are shown (circle) along with (ii) the installed PV power capacity (triangle); (iii) the second-order interaction between these two terms (square) and (iv) silver use in the non-PV sector (plus sign).
The trend just discussed is confirmed by the tri-dimensional plot of the PV input parameters against the output yearly demand (Figure 8) and cumulative demand (Figure 9) in the year 2050. Exceptionally high values of silver deficit are obtained for the combination low PVAgRd and high PVPCRi.
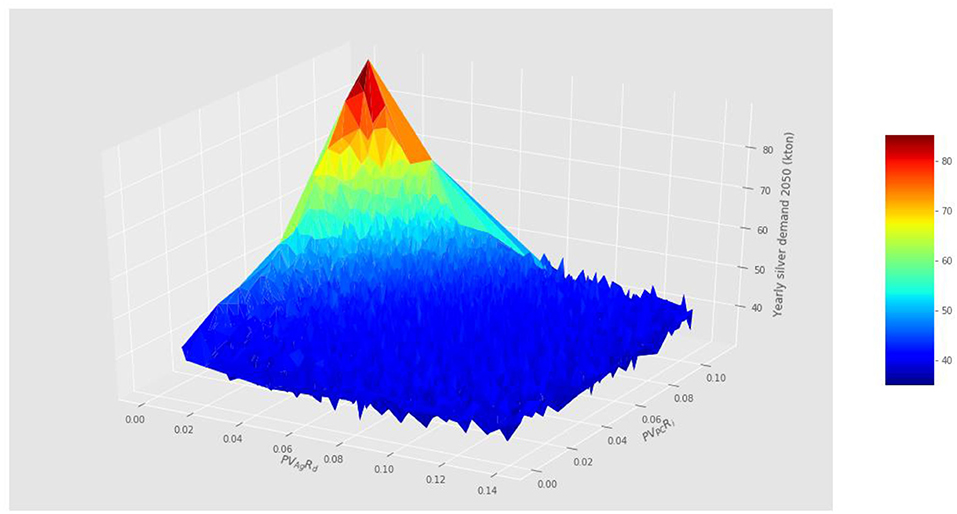
Figure 8. Yearly silver demand (kton) in 2050 against decreasing pace in silver use for PV cell contact metallization and increasing pace of PV power capacity installed. Monte Carlo simulations run on 8,192 quasi-random samples.
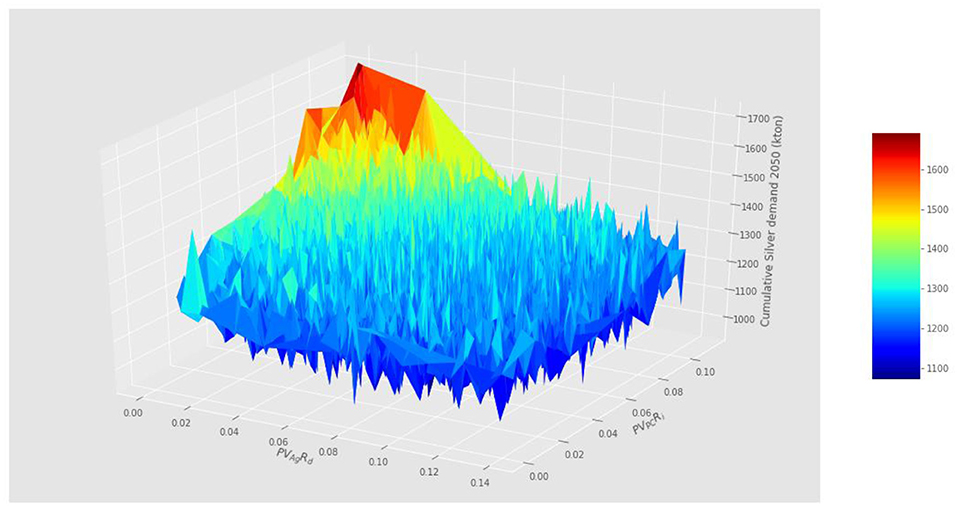
Figure 9. Cumulative silver demand (kton) in 2050 against decreasing pace in silver use for PV cell contact metallization and increasing pace of PV power capacity installed. Monte Carlo simulations run on 8,192 quasi-random samples.
Figures 10, 11 show the combination of parameters in the viable/non-viable and feasible/non-feasible range in the year 2050. In general, a low PVAgRd coupled to a high PVPCRi corresponds to ranges of non-viability, although the two areas partially overlap (Figure 10). This points to the fact the modeled pace of expansion of the mining sector plays also a role in determining this outcome. Feasibility ranges show a full overlap of the two ranges (Figure 11). This highlights the primary importance played by the actual natural budget of silver.
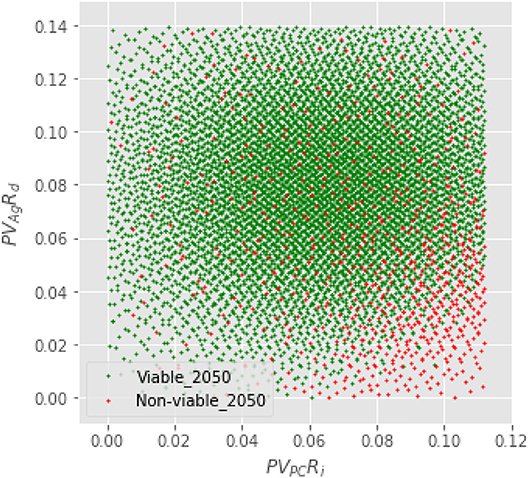
Figure 10. Viable (green) and non-viable (red) scenarios in the year 2050. The coordinates of each points are the values of the parameters (PVPCRi, PVAgRd) used in a given simulation. Monte Carlo simulations run on 8,192 quasi-random samples.
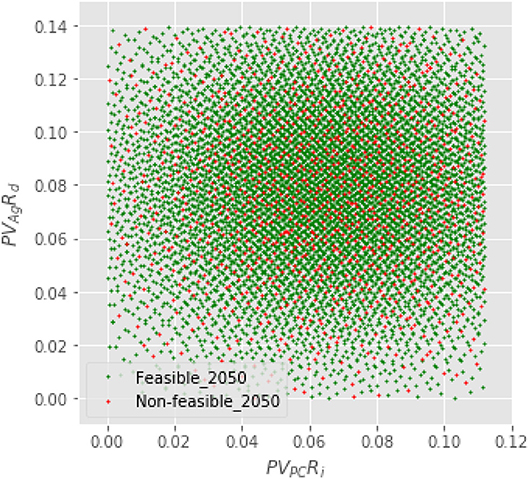
Figure 11. Feasible (green) and non-feasible (red) scenarios in the year 2050. The coordinates of each points are the values of the parameters (PVPCRi, PVAgRd) used in a given simulation. Monte Carlo simulations run on 8,192 quasi-random samples.
By analyzing the simulations that produce a feasible vs. a non-feasible outcome (not shown here), one can note that feasibility constraints will be practically certain to occur for a natural budget below 800 kton, likely between 800 and 1,100 kton (50% of the simulations), with no constraints beyond this threshold in any of the simulations.
In this contribution we have assessed whether silver would represent a constraint for a large-scale development of solar photovoltaics for electricity production. Global sensitivity analysis showed the importance of the parameters related to the photovoltaic sector (the rate of decrease in silver paste use in PV cells contact metallization PVAgRd and the rate of increase in first-generation PV installed capacity PVPCRi) grows over the course of the years: almost 70% of the variance of the yearly silver demand in the year 2050 is determined by these parameters and their combination. It is therefore of primary importance that the reduction in silver paste use for contact metallization proceeds at a meaningful pace, to ensure that photovoltaics deployment may continue at a sustained pace. Unless these conditions are fulfilled, technological viability constraints may be faced. In terms of natural constraints (feasibility), a primary role is played by the actual silver budget available for extraction. Within the investigated timeframe, values as low as 800 kton and likely up to 1,100 kton may correspond to situations of non-feasibility. This poses further pressure on the efforts to speed up efficiency gains in silver use in the photovoltaics sector as well as the need of more consistent recycling flows from old-scrap material.
The present work could be extended to investigate to a finer detail the quality of evidence the model is based on. This could be achieved if the pedigree of the data used in the present simulation could be established, e.g., with a dedicated workshop of experts. Pedigree based methodologies such as NUSAP (Funtowicz and Ravetz, 1990; van Der Sluijs et al., 2005) would help to capture the epistemic dimension of uncertainty. By coupling, for each uncertain input, the sensitivity measure and a pedigree, one would be able to identify those crucial parameters which have simultaneously a low pedigree (poor quality) and a high influence on the output (van Der Sluijs et al., 2005; Pye et al., 2018).
SLP designed and conducted the research, wrote the manuscript. AS contributed to design the sensitivity analysis of the experiment and reviewed the final version of the manuscript. JvdS contributed to design the overall post-normal science framework of the study and reviewed the final version of the manuscript.
The research received funding from the Peder Sather Center for Advanced Studies: http://sathercenter.berkeley.edu/
The authors declare that the research was conducted in the absence of any commercial or financial relationships that could be construed as a potential conflict of interest.
We would like to thank Loïc Tous, Jonas Bartsch, Giso Hahn, Helge Hannebauer, Marco Galliazzo, Jonas Buddgard, Jutta Trube, Christian Breyer, Mary Brunisholz as well as further contributors for participating in the expert consultation. We would like also to acknowledge the funding of the Peder Sater Center for Advanced Studies of the University of Berkeley for a project aimed to mainstream sensitivity analysis applications, http://sathercenter.berkeley.edu/peder-sather-grant/peder-sather-grant-2017-grantees/. The responsibility of any error in the manuscript remains solely with us.
Archer, G. E. B., Saltelli, A., and Sobol, I. M. (1997). Sensitivity measures, anova-like Techniques and the use of bootstrap. J. Stat. Comput. Simul. 58, 99–120. doi: 10.1080/00949659708811825
Bratley, P., and Fox, B. L. (1988). ALGORITHM 659: implementing Sobol's quasirandom sequence generator. ACM Trans. Math. Softw. 14, 88–100. doi: 10.1145/42288.214372
Broda Ltd. (2017). Enhanced 65536-Dimensional Sobol' LDS Generator SobolSeq65536. Available online at: http://www.broda.co.uk/projects.html#sobolseq1024 [Accessed June 29, 2017].
Butterman, W. C., and Hilliard, H. E. (2005). Mineral Commodity Profiles: Silver. USGS Numbered Series Online. Open-File Report, 1–44. doi: 10.3133/ofr20041251
Chen, C.-C., Dou, L., Zhu, R., Chung, C.-H., Song, T.-B., Zheng, Y. B., et al. (2012). Visibly transparent polymer solar cells produced by solution processing. ACS Nano 6, 7185–7190. doi: 10.1021/nn3029327
Davidsson, S., and Höök, M. (2016). Material requirements and availability for multi-terawatt deployment of photovoltaics. Energy Policy 108, 574–582. doi: 10.1016/j.enpol.2017.06.028
Dias, P., Javimczik, S., Benevit, M., Veit, H., and Bernardes, A. M. (2016). Recycling WEEE: extraction and concentration of silver from waste crystalline silicon photovoltaic modules. Waste Manag. 57, 220–225. doi: 10.1016/j.wasman.2016.03.016
Elshkaki, A., and Graedel, T. E. (2013). Dynamic analysis of the global metals flows and stocks in electricity generation technologies. J. Clean. Prod. 59, 260–273. doi: 10.1016/j.jclepro.2013.07.003
Elshkaki, A., and Graedel, T. E. (2015). Solar cell metals and their hosts: a tale of oversupply and undersupply. Appl. Energy 158, 167–177. doi: 10.1016/j.apenergy.2015.08.066
Feltrin, A., and Freundlich, A. (2008). Material considerations for terawatt level deployment of photovoltaics. Renew. Energy 33, 180–185. doi: 10.1016/j.renene.2007.05.024
Ferretti, F., Saltelli, A., and Tarantola, S. (2016). Trends in sensitivity analysis practice in the last decade. Sci. Total Environ. 568, 666–670. doi: 10.1016/j.scitotenv.2016.02.133
Fischer, M., Spiess, T., Wawer, P., Metz, A., Weindel, H., Lemke, C., et al. (2011). International Technology Roadmap for Photovoltaics (ITRPV.net) Results 2010. Crystalline Silicon PV Technology and Manufactuing (CTM) Group, 1–20.
Funtowicz, S., and Ravetz, J. R. (1990). Uncertainty and Quality in Science for Policy. Dordrecht: Kluwer.
García-olivares, A. (2015). Substituting silver in solar photovoltaics is feasible and allows for decentralization in smart regional grids. Environ. Innov. Soc. Transitions. 17, 15–21. doi: 10.1016/j.eist.2015.05.004
Giampietro, M., Mayumi, K., and Sorman, A. H. (2013). Energy Analysis for a Sustainable Future: Multi-scale Integrated Analysis of Societal and Ecosystem Metabolism. Chichester: Routledge.
GiorgoForstner, H. C., Falcon, T., Zwegers, M., and Bernreuter, J. (2014). International Technology Roadmap for Photovoltaic, 4th Edn., 1–34.
Gordon, R. B., Bertram, M., and Graedel, T. E. (2006). Metal stocks and sustainability. Proc. Natl. Acad. Sci. USA. 103, 1209–1214. doi: 10.1073/pnas.0509498103
Grandell, L., and Thorenz, A. (2014). Silver supply risk analysis for the solar sector. Renew. Energy 69, 157–165. doi: 10.1016/j.renene.2014.03.032
Heinberg, R. (2005). The Party's Over: Oil, War and the Fate of Industrial Societies. Gabriola Island, BC: New Society Publishers.
Heinberg, R. (2007). Peak Everything: Waking Up to the Century of Decline in Earth's Resources. Russet: Clairview Books.
Heinberg, R. (2011). The End of Growth: Adapting to Our New Economic Reality. Gabriola Island, BC: New Society Publishers.
Henning, H.-M., and Palzer, A. (2015). What Will the Energy Transformation Cost? Pathways for Transforming the German Energy System By 2050. Freiburg: Fraunhofer ISE.
Hilliard, H. E. (2000). Silver recycling in the United States in 2000. US Geol. Surv. Circ. 1196, 1–11.
Hyndman, R. J., and Athanasopoulos, G. (2018). Forecasting: Principles and Practice. 2nd Edn. Melbourne: OTexts.
International Energy Agency IEA (2014). Solar photovoltaic energy. Technol. Roadmap, 1–60. doi: 10.1007/SpringerReference_7300
International Technology Roadmap for Photovoltaic (2015). International Technology Roadmap for Photovoltaic, 2014 Results, 1–38.
International Technology Roadmap for Photovoltaic (2016). International Technology Roadmap for Photovoltaic, 2015 Results, 1–37.
International Technology Roadmap for Photovoltaic (2018). International Technology Roadmap for Photovoltaic, 2017 Results, 1–71.
International Technology Roadmap for Photovoltaics (2012). International Technology Roadmap for Photovoltaics, 2011 Results. 1–20.
Jean, J., Brown, P. R., Jaffe, R. L., Buonassisi, T., and Bulovic, V. (2015). Pathways for solar photovoltaics. Energy Environ. Sci. 8, 1200–1219. doi: 10.1039/C4EE04073B
Kleijn, R., van der Voet, E., Kramer, G. J., van Oers, L., and van der Giesen, C. (2011). Metal requirements of low-carbon power generation. Energy 36, 5640–5648. doi: 10.1016/j.energy.2011.07.003
Kraft, A., Wolf, C., Bartsch, J., and Glatthaar, M. (2015). Characterization of copper diffusion in silicon solar cells. Energy Procedia 67, 93–100. doi: 10.1016/j.egypro.2015.03.292
Mudd, G. M., and Jowitt, S. M. (2018). Global resource assessments of primary metals: an optimistic reality check. Nat. Resour. Res. 27, 229–240. doi: 10.1007/s11053-017-9349-0
Mudd, G. M., Jowitt, S. M., and Werner, T. T. (2017). The world's lead-zinc mineral resources: scarcity, data, issues and opportunities. Ore Geol. Rev. 80, 1160–1190. doi: 10.1016/j.oregeorev.2016.08.010
Nassar, N. T., Graedel, T. E., and Harper, E. M. (2015). By-product metals are technologically essential but have problematic supply. Sci. Adv. 1, e1400180. doi: 10.1126/sciadv.1400180
National Minerals Information Center (2018). Silver Statistics and Information. United States Geological Survey. Available online at: https://minerals.usgs.gov/minerals/pubs/commodity/silver/mcs-2017-silve.pdf (Accessed May 17, 2019).
Paiano, A. (2015). Photovoltaic waste assessment in Italy. Renew. Sustain. Energy Rev. 41, 99–112. doi: 10.1016/j.rser.2014.07.208
Panek, P., Socha, R. P., Putynkowski, G., and Slaoui, A. (2016). The new copper composite of pastes for si solar cells front electrode application. Energy Procedia 92, 962–970. doi: 10.1016/j.egypro.2016.07.108
Pye, S., Li, F. G. N., Petersen, A., Broad, O., McDowall, W., Price, J., et al. (2018). Assessing qualitative and quantitative dimensions of uncertainty in energy modelling for policy support in the United Kingdom. Energy Res. Soc. Sci. 46, 332–344. doi: 10.1016/j.erss.2018.07.028
Ragnarsdottir, K. V., Sverdrup, H. U., and Koc, D. (2012). “Assessing long term sustainability of global supply of natural resources and materials,” in Sustainable Development - Energy, Engineering and Technologies - Manufacturing and Environment, ed C. Ghenai (Rijeka: InTech). doi: 10.5772/28118
Roper, L. D. (2016). Precious Metals Depletion. Available online at: http://www.roperld.com/science/minerals/minerals.htm (accessed May 11, 2019).
Saltelli, A., Aleksankina, K., Becker, W., Fennell, P., Ferretti, F., Holst, N., et al. (2019). Why so many published sensitivity analyses are false: a systematic review of sensitivity analysis practices. Environ. Model. Softw. 114, 29–39. doi: 10.1016/j.envsoft.2019.01.012
Saltelli, A., and Annoni, P. (2010). How to avoid a perfunctory sensitivity analysis. Environ. Model. Softw. 25, 1508–1517. doi: 10.1016/j.envsoft.2010.04.012
Saltelli, A., Annoni, P., Azzini, I., Campolongo, F., Ratto, M., and Tarantola, S. (2010). Variance based sensitivity analysis of model output. Design and estimator for the total sensitivity index. Comput. Phys. Commun. 181, 259–270. doi: 10.1016/j.cpc.2009.09.018
Saltelli, A., and Giampietro, M. (2017). What is wrong with evidence based policy, and how can it be improved? Futures. 91, 62–71. doi: 10.1016/j.futures.2016.11.012
Saltelli, A., Ratto, M., Andres, T., Campolongo, F., Cariboni, J., Gatelli, D., et al. (2008). Global Sensitivity Analysis - The primer. Chichester: Wiley. doi: 10.1002/9780470725184
Saltelli, A., Tarantola, S., Campolongo, F., and Ratto, M. (2004). Sensitivity Analysis in Practice: A Guide to Assessing Scientific Models. Chicester: Wiley.
Schubert, G., Beaucarne, G., and Hoornstra, J. (2013). The Future of Metallization – Results from questionnaires of the four workshops from 2008 to. Energy Procedia 43, 12–17. doi: 10.1016/j.egypro.2013.11.083
Sverdrup, H., Koca, D., and Vala, K. (2014). Investigating the sustainability of the global silver supply, reserves, stocks in society and market price using different approaches. Resourc Conserv. Recycl. 83, 121–140. doi: 10.1016/j.resconrec.2013.12.008
Sverdrup, H. U., Koca, D., and Ragnarsdóttir, K. V. (2013). Peak metals, minerals, energy, wealth, food and population: urgent policy considerations for a sustainable society. J. Environ. Sci. Eng. 2, 189–222.
Teske, S. (2015). Energy [r]evolution - A Sustainable World Energy Outlook 2015. Hamburg: Greenpeace.
van Der Sluijs, J., Craye, M., Funtowicz, S., Kloprogge, P., Ravetz, J., and Risbey, J. (2005). Experiences with the NUSAP system for multidimensional uncertainty assessment. Water Sci. Technol. 52, 133–144. doi: 10.2166/wst.2005.0161
Vesborg, P. C. K., and Jaramillo, T. F. (2012). Addressing the terawatt challenge: scalability in the supply of chemical elements for renewable energy. RSC Adv. 2:7933. doi: 10.1039/c2ra20839c
Wood, D., Kuzma-Filipek, I., Russell, R., Duerinckx, F., Powell, N., Zambova, A., et al. (2015). Non-contacting busbars for advanced cell structures using low temperature copper paste. Energy Procedia 67, 101–107. doi: 10.1016/j.egypro.2015.03.293
Keywords: silver, solar photovoltaics, renewable energy, natural constraint, technological development, sensitivity analysis, stakeholders engagement
Citation: Lo Piano S, Saltelli A and van der Sluijs JP (2019) Silver as a Constraint for a Large-Scale Development of Solar Photovoltaics? Scenario-Making to the Year 2050 Supported by Expert Engagement and Global Sensitivity Analysis. Front. Energy Res. 7:56. doi: 10.3389/fenrg.2019.00056
Received: 10 December 2018; Accepted: 29 May 2019;
Published: 14 June 2019.
Edited by:
Antonio Espuña, Universitat Politecnica de Catalunya, SpainReviewed by:
Letian Dou, Purdue University, United StatesCopyright © 2019 Lo Piano, Saltelli and van der Sluijs. This is an open-access article distributed under the terms of the Creative Commons Attribution License (CC BY). The use, distribution or reproduction in other forums is permitted, provided the original author(s) and the copyright owner(s) are credited and that the original publication in this journal is cited, in accordance with accepted academic practice. No use, distribution or reproduction is permitted which does not comply with these terms.
*Correspondence: Samuele Lo Piano, c2xvcGlhbm9Ab3Blbi1ldmlkZW5jZS5jb20=; cy5sb3BpYW5vQGdtYWlsLmNvbQ==
Disclaimer: All claims expressed in this article are solely those of the authors and do not necessarily represent those of their affiliated organizations, or those of the publisher, the editors and the reviewers. Any product that may be evaluated in this article or claim that may be made by its manufacturer is not guaranteed or endorsed by the publisher.
Research integrity at Frontiers

Learn more about the work of our research integrity team to safeguard the quality of each article we publish.