- 1Fundamental Science on Nuclear Safety and Simulation Technology Laboratory, College of Nuclear Science and Technology, Harbin Engineering University, Harbin, China
- 2NeUtron eXploration Team, Beijing, China
Fault Tree Analysis (FTA) has been a well-established and widely used method to deduct system failure scenarios for large complex systems like Nuclear Power Plants (NPPs). Redundant design is usually adopted in NPPs to improve system reliability, including parallel design and standby design. Sequential failures exist among the modules in a standby redundant system, which have not been detailed considered in FTA in industry, leading to an overestimation of system failure probability. Then if FTA is used to compare the reliability of the two designs, it will be found that parallel design is more reliable than standby, which is just the opposite of the conclusion from Reliability Block Diagram (RBD) analysis. To solve this problem, an improved Fault Tree methodology is proposed in this paper, using Priority-AND (PAND) gate and Condition-AND (CAND) gate to model the sequential failures. And the Boolean laws of logic is extended correspondingly for qualitative analysis, as well as the mathematic formulas for quantitative analysis. A case study is also presented to demonstrate the process and benefits for using the proposed approach.
Introduction
Fault Tree Analysis (FTA) is a widely used method in system reliability analysis (Lee et al., 1985; Guimarẽes and Ebecken, 1999), and has been applied to nuclear power industry since early 1970s (NUREG, 1975).
It is a deductive methodology, which connects Top Event (system failure) with a set of Intermediate Events and Basic Events (component failures, human errors, etc.) by logic units like AND/OR gates. System failure paths and contributions of components/events to system failure can be located by FTA results (Vesely et al., 2002).
Redundancy is an effective measure to improve system reliability, including parallel redundant and standby redundant.
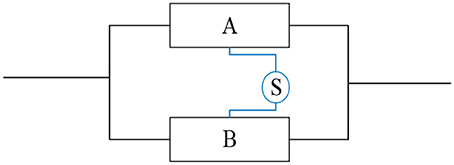
Figure 1 shows a typical two-redundant system design, in which the blue parts are unique to standby redundant design while the others for both. In parallel design, A and B are activated simultaneously. While in standby, A will be activated firstly, and then B by switching unit S if A fails.
The Minimal Cut Sets (MCSs) of the two systems are:
Parallel: A⋂B
Standby:A⋂B, A⋂S
With “no failure in standby” assumption, the standby system failure probability from FTA is bigger than the other, and the conclusion is opposite to that from Reliability Block Diagram analyzing (Bilintion and Allan, 1992). Detailed analysis about the MCSs of the two redundant systems is carried out, and it is found that the FTA has overestimated the failure probability of standby system, by involving two failure paths which should not be considered. They are: (1) B fails before A, which should not happen because B is in standby before A fails; (2) S fails after A, which may happen but should not lead to system failure as B should have been activated before S fails.
These are so called sequential failure problems in this paper, and are defined as:
1) Sequence-Dependent Failure (SDF)—the sequential failures of switching unit and redundant units. It means that the system fails or not depends on the failure sequence of these two types of units; and
2) Condition-Dependent Failure (CDF)—the sequential failures of redundant units. It means that the failure of the former unit is the prerequisite for the later one to fail, as the later unit will not fail until the former one fails.
Sequential failure problems are very common for process systems in which system/components may be placed in service orderly. And several solutions have been proposed to solve these problems in recent years. Representative works including:
- Pandora (Walker and Papadopoulos, 2006, 2009) based on Priority-AND gate to evaluate SDFs;
- Methodologies based on state transfer analysis involving CDF evaluation and other issues in analysis (Azaron et al., 2006; Wang et al., 2012; Hellmich and Berg, 2015);
- Event Sequence Diagram (ESD) (Swaminathan and Smidts, 1999a,b) to model failure of systems/components which are put in service orderly with a time delay; and
- Dynamic Fault Tree (DFT) (Manian et al., 1998; Cepin and Mavko, 2002) for risk evaluation for those systems whose comfiguration may change at different time points.
The first two kinds of methodology focus on only one sequential issue. DFT is designed with house event tables to take system configuration changes into consideration, but not to analyze the sequential issues discussed here. ESD is comprehensive in theory, but too complicated to construct a detailed model for large complex systems.
Hence, this research is to develop an FTA method to analyze both of the two sequential issues. The method suggested should be convenient to be implemented in model construction and computer aided analyzing.
Sequence-Dependent Failure Modeling and Analyzing
Priority-AND (PAND) gate is adopted to model the SDFs, which has been defined in Fault Tree Handbook (Vesely et al., 2002) but without qualitative and quantitative analysis laws.
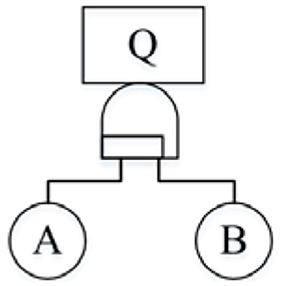
The graphic symbol of PAND gate is shown in Figure 2, and the mathematic expression is written asQ = A∀B, which means that event Q will occur if and only if:
1) B has occurred, following the occurrence of A; or
2) Both A and B occur simultaneously.
Most of the basic Boolean logic laws (Verma et al., 2010) are still available for Minimal Cut Sets Analysis for FTs involving PAND gates. For the convenience of reading, they are listed as follows:
Distributive Law:
Idempotent Laws: A∀A = A
Absorption Law: A⋃A∀B = A⋃(A∀B) = A
But it should be noticed that the Exchange Law is no longer available for PAND gate, that isA∀B ≠ B∀A.
And for multiple SDF, the extended Boolean Laws are:
A∀(B∀C) = (A⋂B)∀C, which means:
1) All of A, B and C should occur;
2) A should occur no later than the time when both B and C have occurred;
3) B should occur no later than C; and
4) A and B can occur in any order.
To calculate the probability of MCSs with SDFs, use
If B is an event with constant probability of QB, then
Where,f(t) is the probability density function of an event—the probability that an event may occur at time t.
Any A, B, or C may be a combination of more than one events. IfA = A1⋂A2, then
Where, F(t)is the distribution function of an event—the probability that an event may occur in time duration of t.
Then for the system in Figure 1, the MCS A⋂S becomesS∀A, and its probability is
Condition-Dependent Failure Modeling and Analyzing
Condition-AND (CAND) gate is constructed to model CDFs. The graphic symbol is shown in Figure 3, and the mathematic expression is written asQ = 〈A|B〉,which means that:
1) Event Q will occur if and only if both A and B occur; and
2) B never occurs before A.
The basic Boolean logic laws for CAND gate are as follows:
Distributive Law:
Idempotent Laws: 〈A|A〉 = A
Absorption Law: A⋃〈A|B〉 = A⋃(〈A|B〉) = A
Exchange Law is not available for CAND gate either.
And for multiple CDF, use the extended Boolean Law:
To calculate the probability of MCSs with CDFs, use
or
Then for the system in Figure 1, the MCS A⋂B becomes 〈A|B〉, and the probability is
Hybrid Logic Analysis
The two sequential logic gates discussed separately above usually exist simultaneously in one MCS for high-redundancy system, and the logic is hybrid.
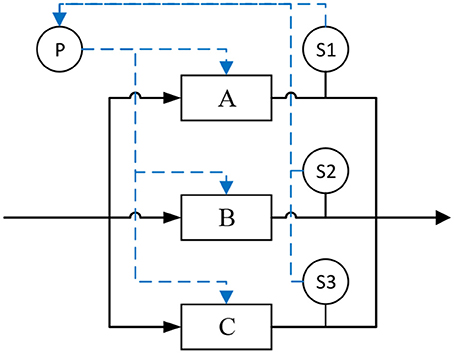
Figure 4 shows a simplified typical composition of a standby triple-redundant system with function modules of A, B, and C. The switching unit is consisted by three sensors (S1–S3) and a processing modular (P). Sensors S1, S2, and S3 are used to monitoring the parameters out from A, B, and C correspondingly. P processes the parameters from sensors and then generates a signal to activate the standby unit orderly if necessary. There are three operation modes for this system:
Mode1: A is put in operation firstly, B and C will be activated one-by-one in order of B and C;
Mode2: B is put in operation firstly, A and C will be activated one-by-one in order of C and A;
Mode3: C is put in operation firstly, A and B will be activated one-by-one in order of A and B.
These modes are completely symmetrical. We assume that the system is operated in Mode1.
The possible hybrid logics and laws to do qualitative and quantitative analysis are:
1) 〈(S1∀A)|(S2∀B)〉, and
2) 〈(S1∀A)|(S2∀B)〉 = 〈[(S1⋂S2)∀A]|B〉 , if B is a failure on demand with a constant probability, and
3) 〈A|(P∀B)〉 , with P as the unit shared by A and B. Then
4) For any A and B,〈A|(B∀A)〉 = B∀A.
Case Study
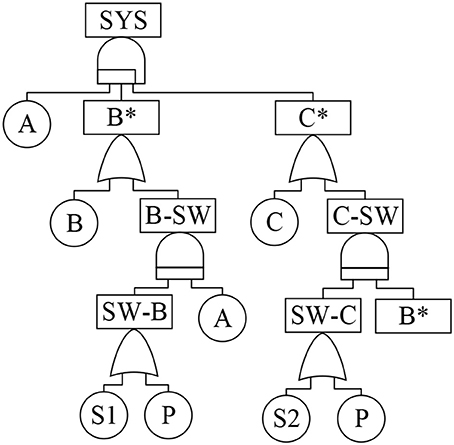
Taking the system shown in Figure 4 as an example to demonstrate the FTA process using the proposed methodology. And define events as follows:
1. SYS: System is failed.
2. Component name with*: All failures of the component;
3. Component name without*: The primary failure of component;
4. Component name-SW: Failed to activate the component;
5. SW-component name: The component is not activated because of the failure of relative switching unit.
The FT is shown in Figure 5.
S3 does not appear in the FT. It is because that A and B have failed when C is activated and there would be no standby remained once C is also failed. Then S3 is only used to monitor system parameters and find whether system has failed or not, with no contribution to system function failure.
Apply the extended Boolean logic rules, then
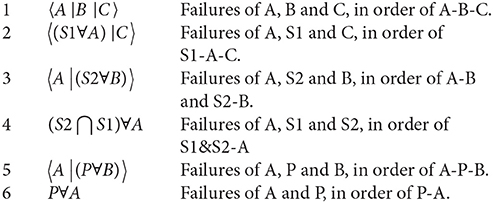
Ultimately, there are six MCSs for system failure:
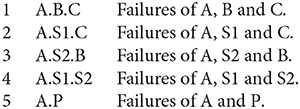
The MCSs of a classical FT are:
Using the same failure rate of 1E-04 h−1 for all the components in system, then the system failure probability in 24 h evaluated by the proposed FT method is 2.8892e-06, while the value of classical FT is 5.8013e-06, which is almost twice as much as the former.
From the case study, it is very clear that:
1) Usually, the failure scenarios of a standby redundant system obtained from the classic FT are too extensive (e.g., MCS A.B.C), including the scenarios which shouldn't occur or won't lead to system failure even if occurred;
2) Sometimes, failure scenarios may be omitted by the classic FT (e.g. MCS〈A|(P∀B)〉); and
3) System failure probability would be overestimated by the classic FTA, as the mission time of components used in calculation are longer than actual values.
And also it should be reasonable to suspect the accuracy of importance analysis result of the classic FT.
The proposed FT method provides a new perspective to avoid the issues above. It has been applied to an NPP system, under a Project on NPP risk monitor. The qualitative analysis to generate MCSs is implemented manually, and MATLAB program is used to do the quantitative calculation. And a software tool to do a complete analysis is under development.
Conclusion
It has been recognized for many years that the order in which the components may fail will affect system behavior in a standby redundant system. But, this issue has not been comprehensively considered yet in industry. The study of this paper aims to find a way to take account of this issue based on FTA methodology.
Firstly, the issue is divided into two categories:
1) Components can only fail in certain order;
2) Components may fail in any order, but only those failures in certain order will lead to a system failure.
Accordingly, two gates, Condition-AND gate and Priority-AND gate, are adopted in this study. The former gate is new constructed, while the later one has been defined in Fault Tree Handbook but not applied because of the lack of qualitative and quantitative analysis rules in the Handbook.
Then, the extended Boolean logic laws are proposed to implement the qualitative analysis of a FT, generating the MCSs with sequential characteristics. The mathematical formulas to calculate MCS probability (quantitative analysis) are also developed, as well as the variations in application.
Finally, a case study is presented to demonstrate the modeling and analyzing process using the improved FTA method. Compared with the results from classical FTA, it is found that the proposed method can lead to more realistic failure scenarios and reduce the conversation of classical FTA.
The future work will focus on how to improve the efficiency of the method for applying to large complex system (e.g., NPP system) when combined with other problems like common cause failure. Also, it is necessary to develop a software to do analysis automatically.
Author Contributions
ZZ found the engineering problem and proposed to do this research. MZ was in charge of and implemented the research to find the reason and solution of the problem. GZ helped to verify the method in a industrial system.
Conflict of Interest Statement
The authors declare that the research was conducted in the absence of any commercial or financial relationships that could be construed as a potential conflict of interest.
Acknowledgments
This study was supported by the National Science and Technology Major Project Research on Living PSA and Online Risk Monitoring and Management of NPPs [2014ZX06004-003].
References
Azaron, A., Katagiri, H., Kato, K., and Sakawa, M. (2006). Reliability evaluation of multi-component cold-standby redundant systems. Appl. Math. Comput. 173, 137–149. doi: 10.1016/j.amc.2005.02.051
Bilintion, R., and Allan, R. (1992). Reliability Evaluation of Engineering System. New York, NY: Springer.
Cepin, M., and Mavko, B. (2002). A dynamic fault tree. Reliab. Eng. Syst. Safety 75, 83–91. doi: 10.1016/S0951-8320(01)00121-1
Guimarẽes, A. C. F., and Ebecken, N. F. F. (1999). FuzzyFTA: a fuzzy fault tree system for uncertainty analysis. Ann. Nucl. Energy 26, 523–532. doi: 10.1016/S0306-4549(98)00070-X
Hellmich, M., and Berg, H.-P. (2015). Markov analysis of redundant standby safety systems under periodic surveillance testing. Reliab. Eng. Syst. Safety 133, 48–58. doi: 10.1016/j.ress.2014.08.007
Lee, W. S., Grosh, D. L., Tillman, F. A., and Lie, C. H. (1985). Fault tree analysis, methods, and applications: a review. IEEE Trans. Reliab. R-34, 194–203. doi: 10.1109/TR.1985.5222114
Manian, R., Bechta Dugan, J., Coppit, D., and Sullivan, K. J. (1998). “Combining various solution techniques for dynamic fault tree analysis of computer systems,” in Proceedings Third IEEE International High-Assurance Systems Engineering Symposium (Washington, DC), 21–28.
Swaminathan, S., and Smidts, C. (1999a). The mathematical formulation for the event sequence diagram framework. Reliab. Eng. Syst. Safety 65, 103–118. doi: 10.1016/S0951-8320(98)00092-1
Swaminathan, S., and Smidts, C. (1999b). The event sequence diagram framework for dynamic probabilistic risk assessment. Reliab. Eng. Syst. Safety 63, 73–90. doi: 10.1016/S0951-8320(98)00027-1
Verma, A. K., Srividya, A., and Karanki, D. R. (2010). Reliability and Safety Engineering. London: Springer.
Vesely, W. E., Stamatelatos, M., Dugan, J. B., Fragola, J., Minarick, J., and Railsback, J. (2002). Fault Tree Handbook with Aerospace Applications. NASA Office of Safety and Mission Assurance, USA.
Walker, M., and Papadopoulos, Y. (2006). Pandora: the time of priority-and gates. IFAC Proc. 39, 237–242. doi: 10.3182/20060517-3-FR-2903.00134
Walker, M., and Papadopoulos, Y. (2009). Qualitative temporal analysis: towards a full implementation of the Fault Tree Handbook. Control Eng. Prac. 17, 1115–1125. doi: 10.1016/j.conengprac.2008.10.003
Keywords: fault tree analysis, standby redundant system, sequential failure, Priority-AND gate, Condition-AND gate
Citation: Zhang M, Zhang Z and Zheng G (2018) Sequential Failure Modeling and Analyzing for Standby Redundant System Based on FTA Method. Front. Energy Res. 6:60. doi: 10.3389/fenrg.2018.00060
Received: 06 May 2018; Accepted: 06 June 2018;
Published: 26 June 2018.
Edited by:
Jun Wang, University of Wisconsin-Madison, United StatesReviewed by:
Carlos Antonio Sartin, Universidade de São Paulo, BrazilKeyou Mao, Purdue University, United States
Copyright © 2018 Zhang, Zhang and Zheng. This is an open-access article distributed under the terms of the Creative Commons Attribution License (CC BY). The use, distribution or reproduction in other forums is permitted, provided the original author(s) and the copyright owner are credited and that the original publication in this journal is cited, in accordance with accepted academic practice. No use, distribution or reproduction is permitted which does not comply with these terms.
*Correspondence: Zhijian Zhang, emhhbmd6aGlqaWFuX2hldUBocmJldS5lZHUuY24=
Min Zhang, emhhbmdtaW5AaHJiZXUuZWR1LmNu
 Min Zhang
 Zhijian Zhang1*
 Gangyang Zheng