- Department of Electrical and Electronic Engineering, Imperial College London, London, UK
The demand for ancillary service is expected to increase significantly in the future Great Britain (GB) electricity system due to high penetration of wind. In particular, the need for frequency response, required to deal with sudden frequency drops following a loss of generator, will increase because of the limited inertia capability of wind plants. This paper quantifies the requirements for primary frequency response and analyses the benefits of frequency response provision from demand-side response (DSR). The results show dramatic changes in frequency response requirements driven by high penetration of wind. Case studies carried out by using an advanced stochastic generation scheduling model suggest that the provision of frequency response from DSR could greatly reduce the system operation cost, wind curtailment, and carbon emissions in the future GB system characterized by high penetration of wind. Furthermore, the results demonstrate that the benefit of DSR shows significant diurnal and seasonal variation, whereas an even more rapid (instant) delivery of frequency response from DSR could provide significant additional value. Our studies also indicate that the competing technologies to DSR, namely battery storage, and more flexible generation could potentially reduce its value by up to 35%, still leaving significant room to deploy DSR as frequency response provider.
Introduction
The future electricity system of Great Britain (GB) is facing significant challenges as the penetration of renewable energy (wind in particular) continues to increase to meet ambitious carbon reduction targets. Efficient real-time demand-supply balancing in systems with high share of variable generation and inflexible low-carbon generation technologies will become a major challenge. This problem will be primarily driven by the increased need for various reserve and frequency response services to deal with wind output uncertainty and reduced system inertia. Traditionally, these services have been supplied by part-loaded or fast-start conventional plants. Due to dynamic constraints, provision of real-time balancing services by conventional plants is inevitably accompanied with delivery of energy since a synchronized generator has to produce output at least at the minimum-stable-generation level. The energy production associated with the provision of balancing services may therefore lead to significant curtailment of wind output during low-demand periods combined with high wind output. If the generation side remains the only source to meet the increased need for ancillary services, this will not only reduce the efficiency of system operation but may also limit the ability of the system to integrate wind generation.
Therefore, the increased requirements for balancing services may need to be met by other sources, e.g., energy storage and demand-side response (DSR). The major benefits and challenges of demand-side management in the UK electricity system were discussed in Strbac (2008). The key benefits include reduction of generation margin, improvement of transmission grid, and distribution network investment and operational efficiency, as well as better management of demand–supply balance in systems with intermittent renewables. Tan and Kirschen (2006) and Wang et al. (2003) investigated the value of DSR providing reserve in joint energy/reserve markets. In addition, the impact of the DSR’s load recovery effect is investigated in Karangelos and Bouffard (2012). The possibility for DSR to provide frequency response was discussed, simulated, and tested in Lu and Hammerstrom (2006). In order to enable efficient DSR control, the concept of decentralized control was discussed in Samarakoon et al. (2012) and Rautiainen et al. (2009) for a portfolio of flexible domestic loads. Moreover, a decentralized stochastic approach was proposed in Angeli and Kountouriotis (2012) to control refrigerators in order to provide frequency response.
Previous research has shown that DSR can be applied to respond to sudden power plant outages, and thus reduce the cost of reserve power required to deal with such events in GB power system. Short et al. (2007) demonstrated the concept and applicability of DSR in the provision of frequency response and provided a rough estimate of its potential economic values. The benefit of DSR for economic and environmental performance of the electricity system has also been estimated in Aunedi et al. (2013), by simulating annual system operation while taking into account of reserve and response requirements. However, the above studies do not consider the impact of reduced system inertia on the frequency response requirements in the future system with high penetration of wind generation.
Some DSR technologies are capable of instantly delivering frequency response, rather than delivering response gradually like conventional generation plants. For example, Douglass et al. (2013) demonstrate that water treatment plants are capable of instantly reducing their power consumption if the system frequency deviation reaches a certain frequency threshold. At the same time, the results in Teng et al. (2015) suggest that faster delivery of frequency response could significantly reduce the system operation cost and wind curtailment. Hence, treating the frequency response from such fast-responding DSR technologies in the same manner as that from conventional plants would underestimate its benefits. Therefore, this paper also models the instant delivery of frequency response from DSR, so that the maximum range of the benefits of frequency response provision from DSR can be quantified.
In order to study the impact of DSR providing frequency response, this paper introduces an advanced stochastic unit comment model that considers inertia-dependent frequency response requirements. The model is first applied to quantify the needs and the volume of the market for frequency response services and then analyze the system benefits of DSR in providing frequency response services in the future GB low-carbon electricity system. This paper focuses on the overall market volume and benefits of DSR in providing frequency response services. Therefore, no particular DSR technology is targeted; a generic model of DSR is implemented instead.
Inertia-Dependent Frequency Response Requirements in the Future GB System
The need for frequency response services, required to deal with sudden frequency drops following a loss of large generating plant, will increase in future low-carbon GB electricity system. One reason is that wind generation typically does not provide inertia to the system, leading to more rapid frequency drops following a system disturbance. Another driver for increased fast frequency regulation requirements is the expected increase in the size of the largest foreseeable supply loss, both due to larger size of future nuclear generators, as well as the result of expanded interconnection capacity to neighboring countries. This section hence focuses on quantifying the requirements for fast (i.e., primary) frequency response in future GB system.
Overview of Frequency Response Requirements in the GB System
An overriding factor in the operation of power systems is the need to maintain system security, i.e., to supply customers with electricity while meeting the quality of supply requirements at all times. In this context, the balance between demand and generation must be automatically and continually maintained in order to keep the system frequency within a narrow range around nominal system frequency. The UK Grid Code requires the system frequency to be maintained at ±1% of the nominal system frequency (50 Hz), except in exceptional circumstances. The responsibility of the system operator is to procure ancillary services to meet this requirement to ensure that the system can withstand the largest credible generator outage (currently 1,320 MW). A detailed overview of frequency regulation services in the UK can be found in National Grid (2015) and Erinmez et al. (1999).
The frequency containment operational policy currently adopted by the system operator is based on the following requirements:
• under normal operating conditions, the frequency change needs to be maintained within ±0.2 Hz of the nominal system frequency;
• for a sudden generation loss or demand changes up to 300 MW, the maximum frequency changes will be limited to ±0.2 Hz of the nominal system frequency;
• for a sudden generation loss or demand changes within the interval from 300 to 1,000 MW, the maximum frequency changes will be limited to ±0.5 Hz of the nominal system frequency;
• for a sudden generation loss between 1,000 and 1,320 MW, the maximum frequency changes will be limited to −0.8 Hz with frequency restored to 49.5 Hz within 1 min.
For any loss larger than 1,320 MW, the event will be treated as an emergency condition, and automatic low frequency load shedding will start at 48.8 Hz. In the event of frequency falling below 47 Hz, protection system will act and disconnect generators.
System operator utilizes a range of ancillary services (National Grid, 2015) that operate over different time scales in order to manage the system frequency effectively. Two types of frequency regulation services are used in the GB to deal with sudden loss of generation:
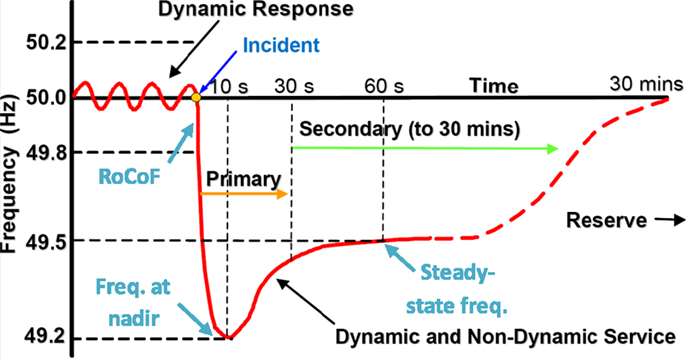
Primary response is defined as the automatic increase in output or decrease in demand, in response to a fall in frequency that occurs in the period 0–10 s from the time of the frequency fall and is sustained for a further 20 s. Primary response has the purpose of arresting the frequency fall, following a loss of generation, until secondary response becomes available. The primary response requirement is defined as the response 10 s after the loss of generation that would result in a frequency drop of −0.5 or −0.8 Hz for a significant event.
Secondary response is defined as the automatic increase in output or decrease in demand in response to frequency fall that is fully available 30 s from the time of the frequency fall, and is sustained at least for further 30 min. The objective of secondary response is to contain and partially recover the frequency after the fall has been arrested.
The present requirements for frequency response services are represented in the form of curves that specify the necessary response for a given demand level and size of generation loss. Details of the approach of deriving these curves can be found in Pearmine et al. (2006).
Inertia-Dependent Frequency Response Requirements in Future GB Systems
Given that high penetration of wind generation will reduce the output of conventional generation and therefore also reduce the number of synchronized conventional plants, the aggregated system inertia provided by rotating mass will decrease, requiring increased demand for frequency response to ensure adequate system performance in terms of maintaining the frequency within the statutory limits. This sub-section presents the modeling of system frequency fluctuations following a large generator outage and quantifies the requirements for frequency response services (Teng et al., 2015).
The time evolution of system frequency deviation can be described by a first-order ordinary differential equation (ODE) (Kundur, 1994):
where Δf (t) is the frequency deviation, H (MW/Hz) is the system inertia, D (%/Hz) represents the load damping rate, PD (MW) is the load level, and ΔPg,s (MW) describes the additional power provided by the generator, g, or storage, s, following the generation loss [MW].
The aim of frequency control is to contain the dynamic variations of frequency (e.g., after a generator outage) within certain security thresholds. The GB Security and Quality of Supply Standard (GB-SQSS) (National Grid, 2014) specifies the limits of frequency deviation for secured faults. As shown in Figure 1, the differential equation (1) is used to quantify three specific thresholds relevant for frequency response provision, which are then integrated into the stochastic unit commitment (SUC) model through considering appropriate constraints associated with these thresholds.
Rate of Change of Frequency
During a frequency disturbance event, such as the one illustrated in Figure 1, the largest magnitude of (negative) rate of change of frequency (RoCoF) is achieved immediately following the generation loss, when ΔPg,s(t) and Δf (t) are effectively equal to zero. According to eq. (1), this value is equal to ΔPL/2H. The maximum RoCoF encountered during an outage event is hence directly proportional to the size of the generation loss ΔPL, and inversely proportional to the system inertia H. This suggests that the minimum acceptable level of system inertia needed to satisfy the maximum allowed RoCoF is equal to ΔPL/2RoCoFmax. Therefore, the required minimum level of inertia can be formulated as the following constraint:
where f0 is the nominal frequency and Hg, , and are the inertia constant, installed capacity, and the number of online generators in group g, respectively.
Frequency at Nadir
The nadir is defined as the point where the system frequency achieves its minimum value during the transient disturbance event. The lowest point reached by system frequency will depend on the level of system inertia and the speed at which the generators are able to ramp up their output. In the following, we assume that the pre-contingency frequency was at the nominal level. It is also assumed that the total output of conventional generators providing frequency regulation increases at a constant rate g (expressed in megawatt per second) following the onset of the loss event, i.e., ΔPm(t) = g*t. The solution of equation (1) is then:
The time t* when the frequency deviation Δf reaches its nadir can be calculated by setting, :
The value of maximum frequency deviation at nadir can be found by substituting eq. (4) into (3):
The maximum frequency deviation, Δfnadir, should not exceed the predefined threshold Δfmin (e.g., −0.8 Hz in Figure 1). Rearranging eq. (5) gives:
The left-hand side of inequality (eq. 6) is a monotonically decreasing function of the product g*H. Therefore, for any given demand level PD and outage ΔPL, there exists a unique value of g*H, denoted by k*, such that the two sides of (eq. 6) become equal. The nadir constraint can therefore be formulated as g*H ≥ k*.
The maximum delivery time for primary frequency response in the GB system is currently set at 10 s. Therefore, the system response requirement can be expressed as R = 10*g (assuming that g is expressed in megawatt per second), and the contribution at time t, which is <10 s will be proportionally lower.
The nadir constraint can then be formulated as a bilinear constraint:
where k* is the unique solution from
Frequency at Quasi-Steady-State
The steady-state condition depends essentially on the amount of frequency response provided by generators by the time ts (corresponding to the time window relevant for delivering secondary frequency response). For instance, according to the current operating practices, it is required that the frequency should not drop below the steady-state threshold of 49.5 Hz for more than 60 s. We denote the maximum allowed steady-state frequency deviation with . For a given size of a generation loss of ΔPL, the steady-state frequency deviation can be found by assuming that RoCoF is effectively zero in eq. (1), i.e., that the frequency has reached a constant level:
This allows quantifying the required response to satisfy the quasi-steady-state frequency criterion as:
Frequency Response Requirements in the Future GB System
The requirements for frequency response services in the future GB electricity system characterized by high penetration of low-carbon generation technologies (such as nuclear or wind) are likely to increase significantly. The following factors are seen as critical for this increase:
• reduced system inertia due to increased output of wind and reduced output of conventional generators;
• increased size of the largest foreseeable generator loss due to larger expected size of future nuclear generators;
• expanded interconnection capacity with neighboring electricity systems.
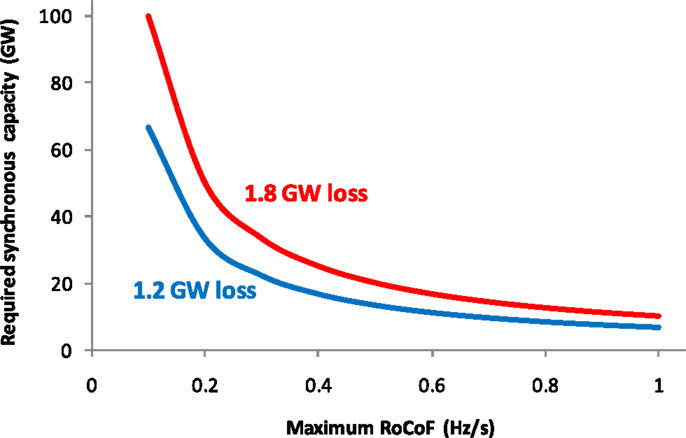
As part of the plans for expanding future nuclear power, larger unit sizes are being considered than today, so that the largest capacity of a single unit could increase to 1.8 GW once new nuclear units are added to the system in the future. In that context, assuming the individual generator inertia constant of Hi = 4.5s2, and the identical generator unit sizes, the minimum synchronized conventional capacity required to satisfy a given RoCoF limit is calculated and presented in Figure 2 for two levels of generation loss: 1.2 GW (representing today’s system) and 1.8 GW (relevant for the future system characterized by larger generating units).
Figure 2 suggests that the requirement for synchronized generation capacity may become much higher for a larger size of generation loss, especially for relatively low RoCoF limits. In order to ensure that distributed generation (DG) stays connected following an outage of large generating unit in the future GB system, resetting the island mode protection relays of DG is currently considered, which would allow higher levels of RoCoF to be tolerated, therefore making the system less prone to causing cascading outages. The current minimum recommended RoCoF setting is 0.125 Hz/s, which applies to the currently installed DG capacity of around 9 GW. The new proposal recommends modifying the Distribution Code and Engineering Recommendation G59, so that the RoCoF protection settings should be changed to 1 Hz/s at new and existing DGs with the capacity of 5 MW and above (National Grid, 2013). Other technologies, including some DSR and storage technologies equipped with adequate control, could potentially deliver frequency response in a very fast fashion and thus limit the speed of change of grid frequency.
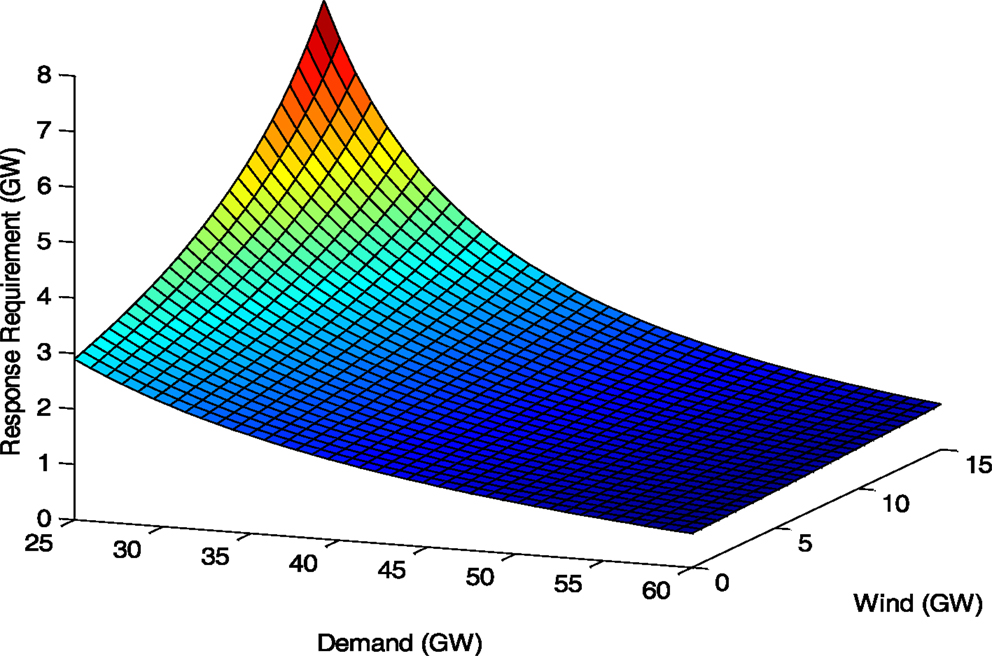
Using the same expression for system inertia as in eq. (2) and assuming that Hi = 4.5s, the system requirement for frequency response to ensure security during transient state can be calculated for various levels of demand, as well as for different levels of absorbed wind generation (as presented in Figure 3), assuming that wind generators do not contribute to system inertia. Transient-state-driven primary frequency response requirement in the future system could reach significantly higher values than those encountered in today’s operation, particularly in conditions when low demand coincides with high wind output. Meeting these increased response requirements with a lower number of synchronized conventional generations may become challenging.
In the present GB system, the amount of frequency response requirements is based on the demand level, which is primarily driven by the quasi-steady-state frequency threshold. However, the increased rating of the largest plant and the growing penetration of wind generation will make constraints associated with transient frequency evolution significantly more relevant. In this subsection, we demonstrate the change in frequency response requirements from being determined by quasi-steady-state frequency limit, to being driven by nadir frequency limit. Assuming the inertia constant of Hg = 4.5s and an average generator loading level of 80% of the maximum output, the present frequency response requirement driven by quasi-steady-state frequency constraints (red in Figure 4) is compared with the nadir-driven frequency response requirement (black). At present, given the largest plant rating of 1.32 GW, frequency response requirement driven by the quasi-steady-state frequency (red solid) is always binding, as it is always above the frequency nadir-driven requirement (black solid). This justifies the present requirements of frequency response described above. On the other hand, after the 1.8 GW nuclear plant is commissioned, the frequency nadir-driven response requirement would dominate the overall requirement when the demand is lower than about 30 GW in the system without wind (dashed) or when the demand is lower than 45 GW in the system with 20 GW of wind output (dotted). Under those conditions, the present requirements may compromise the system security.
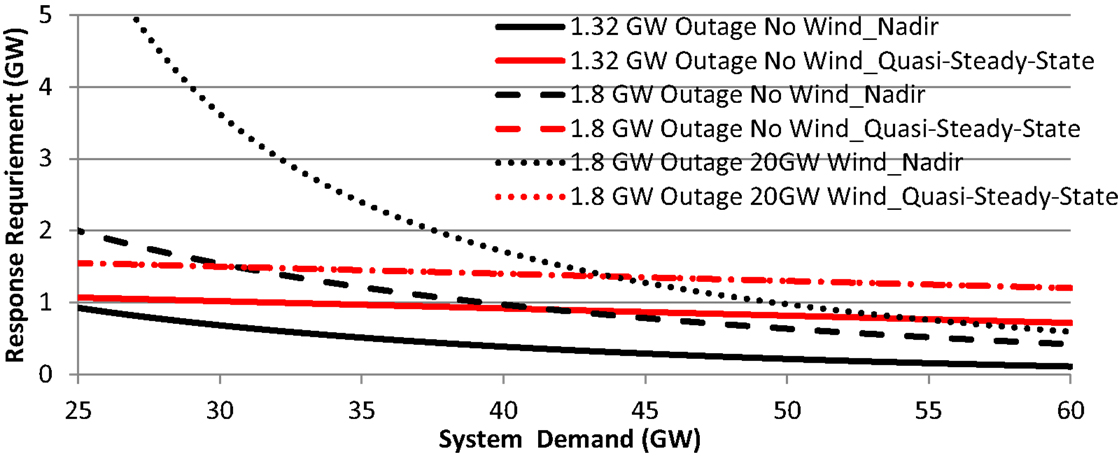
Figure 4. Nadir (black) vs. quasi-steady-state (red) response requirement (Teng et al., 2015).
The combined effect of high wind penetration and increased size of generator loss can be very significant, especially at low demand levels. While in the current conditions, the system would need about 1.5 GW of primary response to cope with a large generator outage at the demand level of 30 GW, with larger generator size and 20 GW wind generation, this could increase to almost 4 GW. This increase is further exacerbated by the fact that with low demand and high wind output, there will be far fewer synchronously operating conventional generators that are capable of delivering primary frequency response. As a result, it might become necessary to maintain a certain number of synchronized conventional generators even at the expense of curtailing wind output in order to maintain the capability of the system to manage frequency oscillations within an acceptable range.
In addition to increased generator sizes, the future GB electricity system is also likely to see the expansion of the interconnection capacity with the neighboring systems in order to deal with intermittency of renewable output and enable a more efficient system operation. At present, HVDC links do not enable the contribution to GB system inertia from synchronous generators in the neighboring systems (when GB is importing). The effect of this will be similar to increased wind penetration, leading to reduced system inertia and therefore potentially larger frequency deviations at times when the GB system is importing electricity.
Benefits of DSR in Providing Frequency Response Service in the Future GB System
In this section, we quantify the benefits of DSR in providing frequency response services in future GB systems, taking into account daily and seasonal changes in demand profiles. Sensitivity studies are carried out to assess the impact of fast delivery of frequency response and competing frequency response providers on the value of DSR.
Methodology
The methodology for assessing the benefit of DSR is based on the least-cost annual generation system scheduling approach, capable of considering both the delivery of energy as well as the provision of reserve and frequency regulation services. Generation scheduling determines the commitment and dispatch decisions of generators in a power system considering the need for various types of reserve and frequency response services. The cost minimization is subject to various dynamic operating constraints, such as, e.g., start-up time. The value of DSR is quantified by the comparison of the system operation cost with and without contribution of DSR into frequency response provision. The resulting operating cost savings are then expressed as the annual value per kilowatt of DSR capacity, and then capitalized assuming the discount rate of 7%.
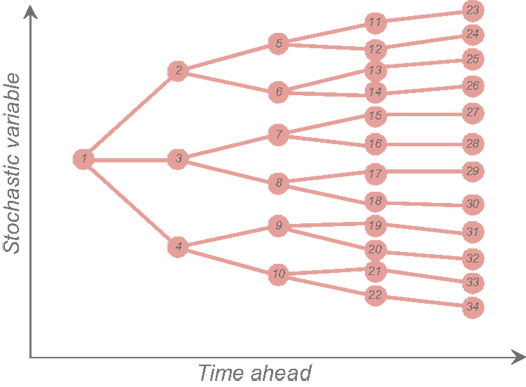
The advanced stochastic scheduling simulation tool (Teng et al., 2015) is designed to provide optimized generation schedules in the light of wind, demand, and generator outage uncertainties. The model simultaneously schedules energy production, standing/spinning reserves, and inertia-dependent frequency response. Wind realizations, wind forecast errors, and generator outages are synthesized from models and fed into a scheduling tool, which finds the optimal commitment and dispatch decisions given the uncertainties and constraints. The decisions are found using a scenario tree, which represents a discretization of the range of outcomes of the stochastic variables (e.g., available wind output), with each path through the tree representing a possible scenario. A simplified scenario tree is shown in Figure 5 below.
A set of feasible control decisions is obtained for each node on the tree, such that the expected total operating cost is minimized. Because the actual realization will differ from all the scenarios in the tree, the scheduling is performed using rolling planning, in which only the here-and-now decisions are fixed, and all subsequent decisions discarded. For this reason, the full tree, extending to 24 h ahead, must be solved at every time step. Operating reserve requirements are endogenously optimized within the model.
This model directly incorporates as constraints the inertia-dependent frequency response requirements from equations (2–10). However, the relationship between the transient response requirement and the capacity of synchronized generators (eq. 7) is a bilinear function. Given that our scheduling model is based on mixed integer linear programing formulation, it is necessary to linearize the functional relationship between the response requirement and the online capacity. This is done using three linear segments, as illustrated in Figure 6.
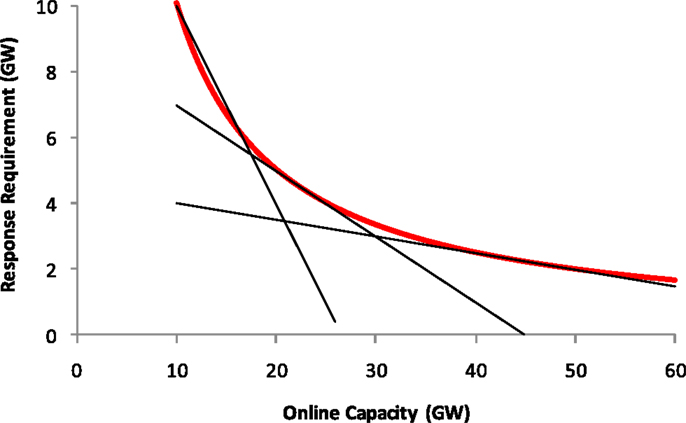
Figure 6. Linearized functional relationship between primary response requirement and capacity of online generators.
The model is capable of considering a variety of providers of frequency response services over short timescales from seconds to tens of minutes. These can include both conventional generators and alternative providers of frequency regulation, such as DSR. Given that the model captures the loss in efficiency, i.e., the increase in operating cost as the result of conventional generators providing frequency regulation, this modeling framework can be used to assess the value of alternative frequency response providers by reducing the need for conventional plants to supply these services. The resulting reduction in system operating cost is used to assess the value of DSR.
Simulated Scenarios for the GB System
Two different approaches are considered with respect to scheduling frequency response:
1. constant response requirements (without consideration of system inertia reduction);
2. inertia-dependent response requirements.
With constant response requirements, the inertia reduction driven by wind is not considered, and therefore frequency response required in the system does not vary much from hour to hour. This is similar to assuming that wind generation provides the similar level of inertia as synchronous conventional generation. Inertia-dependent response requirement on the other hand is quantified for each time interval in our study based on the level of synchronized conventional capacity in that hour, while assuming that no inertia is provided by wind generation. This approach therefore results in significant variations in response requirements across the day and between seasons of the year.
In addition to the above, several scenarios are considered with respect to the volume of primary frequency response provided by DSR:
1. primary response at the level of 1% of total demand at any given time;
2. primary response at the level of 5% of total demand at any given time;
3. primary response at the constant level of 1% of average demand (385 MW in 2020, 435 MW in 2030);
4. primary response at the constant level of 5% of average demand (1,923 MW in 2020, 2,180 MW in 2030).
Constant frequency response provision in scenarios 3 and 4 has been constructed so as to reflect the levels of 1 and 5% of average hourly demand on an annual basis. In contrast, in scenarios 1 and 2, the capability of DSR to provide frequency response varies from hour to hour according to the variations in instantaneous system demand.
Some previous studies in GB focused on the frequency response provision from some particular type of demand, and therefore assumed a limited maximum amount of frequency response contribution. For example, the studies in Aunedi et al. (2013) and Short et al. (2007) assumed the maximum frequency response contribution of refrigeration devices to be around 700 and 1,320 MW, respectively. As pointed out in both studies, the improved parameters of refrigeration DSR as well as the contribution from other types of demand (e.g., space and water heating) could increase the maximum amount of frequency response contribution from DSR. To further understand the market volume of DSR in providing frequency response, this paper therefore investigates a wide range of available frequency response contribution from DSR. The assumption of 1% of demand (or 385 MW in 2020, 435 in 2030) represents a conservative estimation of the available amount of DSR in providing frequency response, which is used to replace the most expensive resources of frequency response provision and therefore provides the information about the maximum value of DSR. While the assumption of 5% of demand (or 1923 MW in 2020, 2180 in 2030) corresponds to more than 80% of the total frequency response requirement in the system, which provides information about the total market volume and the average value for DSR in providing frequency response.
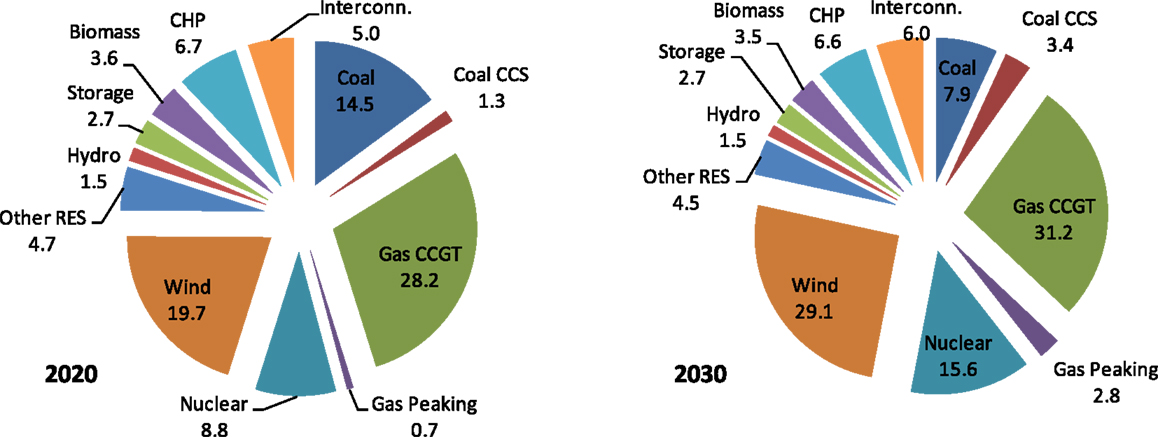
Assumptions on generation and demand background for future GB system have been based on the balanced EMR scenario analyzed by the Department of Energy and Climate Change (DECC) (Redpoint Energy, 2010). The assumed generation capacity in the GB system in 2020 and 2030 is presented in Figure 7. Generation capacity in 2020 is about 92 GW, of which some 20 GW is wind generation. Total installed capacity in 2030 is around 109 GW, a quarter of which is contributed by wind capacity. The penetration of wind with respect to meeting annual electricity demand is 21 and 26% in 2020 and 2030, respectively. The inertia constant of conventional generators is assumed to be 4.5s. Annual electricity demand in 2020 is assumed at the level of 337 TWh, while in 2030, this assumption is 381 TWh. Representative UK hourly profiles are used for wind and demand fluctuations. By analyzing the value in years 2020 and 2030, it is possible to broadly establish the evolution of the potential benefits of deploying DSR for frequency response across time.
Benefits of DSR in the GB System
In order to illustrate how the volumes of frequency response services change with the introduction of frequency response provision from DSR, Figure 8 presents the breakdown of the frequency regulation service provided by various generation, storage, or DSR technologies. The breakdown is calculated based on the scheduling decisions from the SUC model, and the annual contribution of each component is presented as percentage of the total amount of scheduled frequency response services; we note that the average constant response requirement is 1.8 GW, while for inertia-dependent requirement, this is around 2.7 GW.
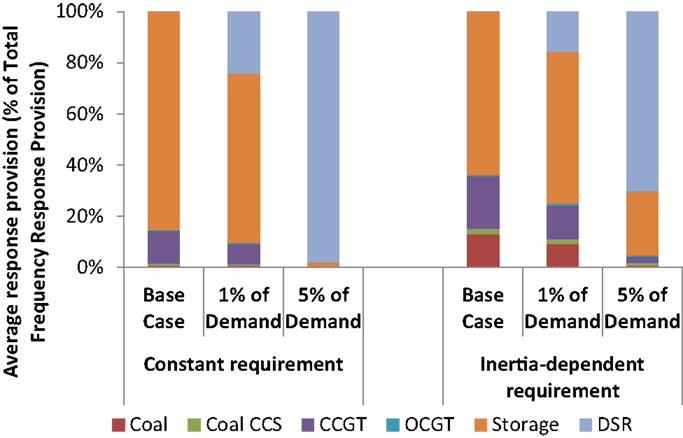
Figure 8. Composition of providers of frequency regulation for different responsive demand scenarios (2030).
In the constant response requirement case (Figure 8, left), storage and CCGT units provide the frequency response in the base case (i.e., without DSR), with the major part being contributed by storage (around 1.5 GW on average). Upon introducing DSR at the level of 1% of system demand, the provision of response by storage and CCGT drops. Increasing the DSR penetration to 5% almost completely eliminates the need to use other providers of frequency regulation.
In the inertia-dependent case (Figure 8, right), the system needs to deploy coal generation (both conventional and CCS) in order to provide sufficient levels of frequency response in the base case. Part-loaded generation will operate at reduced efficiency and will hence incur additional fuel and carbon cost. This leads to the conclusion that the provision of frequency response will be significantly more expensive in the case of inertia-dependent response requirement. The addition of DSR in that context therefore yields considerably higher benefits than with the fixed response requirement, We note that with 1% DSR penetration, the system still needs to rely on coal units to provide some frequency response, while it is only at 5% of DSR that the conventional generators can be almost completely released from providing frequency response.
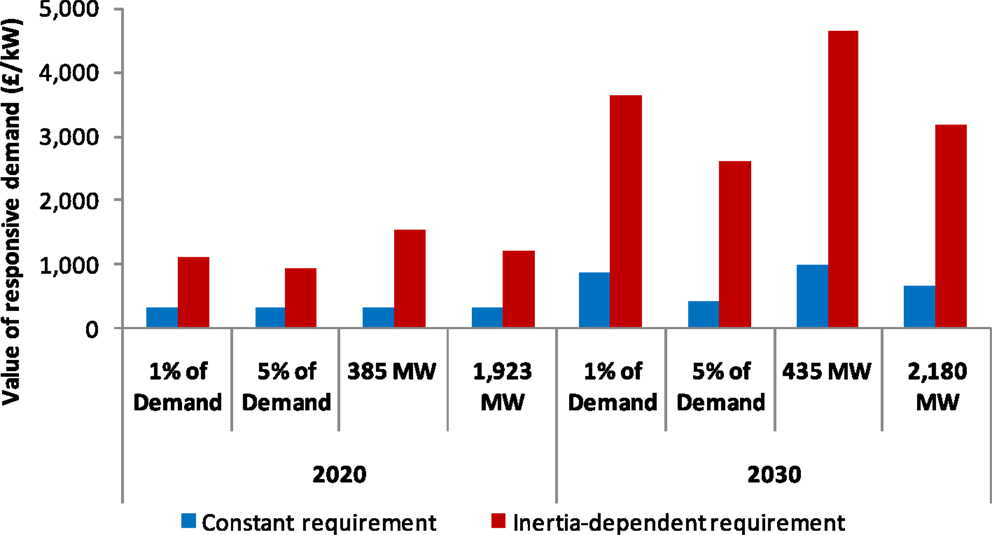
The economic value of DSR, calculated as described in the Section “Methodology,” is presented in Figure 9. The value of DSR is several times higher in the case of inertia-dependent response requirement. This is valid across all four responsive demand scenarios. We further note that the value of frequency response provision per kilowatt of DSR capacity reduces as the volume of DSR increases. In other words, there is a saturation effect, where the first megawatts of DSR generate the highest value for the system, while adding further DSR volume results in lower benefits. Nevertheless, the value per kilowatt in the inertia-dependent case is high for all scenarios, varying between £2,500/kW and £4,500/kW in 2030, with the volume of the frequency response market exceeding 5 GW. The value with constant response requirement is lower (up to £1,000/kW), although still significant. In both 1 and 5% cases, the values in 2020 are considerably lower than in the 2030 system (roughly half of the 2030 value). It should be noted, however, that the value in absolute terms is still quite significant, especially in the inertia-dependent case.
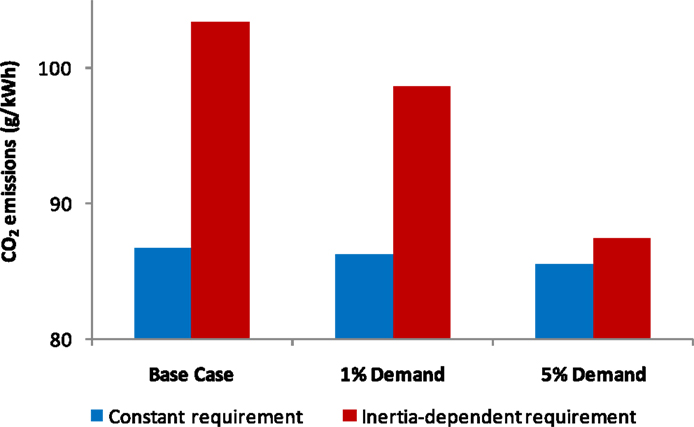
In addition to economic benefits, the benefits of frequency response provision from DSR will also be reflected in an improved performance of the electricity system in terms of carbon emissions. Based on the emission rate of each generation technology (Aunedi et al., 2013) and the actual dispatch decision from SUC model, the average system emission rate, or intensity, can be calculated by dividing the total system emissions by the total system demand. Figure 10 illustrates the impact of responsive demand on grid CO2 emissions from the 2030 GB system for different scenarios and for different approaches to response scheduling.
We note that the system CO2 emissions do not vary substantially in the constant response requirement case, where DSR is effectively displacing CCGT as the marginal frequency regulation provider, resulting in grid emissions changing very little from the level of around 86 g/kW h. A markedly different trend is observed in the inertia-dependent requirement case, where due to the fact that DSR is displacing coal generators in providing response, the resulting emission reductions are substantial, reaching about 15% in the case with 5% DSR.
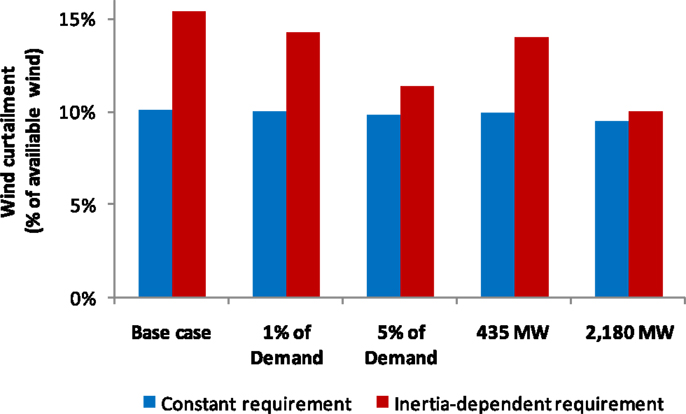
We further observe that DSR will enhance the ability of the system to accommodate wind generation and reduce the need to curtail its output. Figure 11 shows how the necessary wind curtailment in the 2030 GB system changes for different responsive demand scenarios. The results are calculated by using the hourly results for wind curtailment decisions from the SUC model. We note that in the inertia-dependent case, the responsive demand has the capability to avoid more than 5% of annually available wind energy being curtailed in order to balance the system. The levels of avoided wind curtailment are significantly higher in the inertia-dependent case, given that the base case wind curtailment is also higher. Reduction in the constant response requirement case is well below 1% in all DSR scenarios.
Diurnal and Seasonal Value of DSR
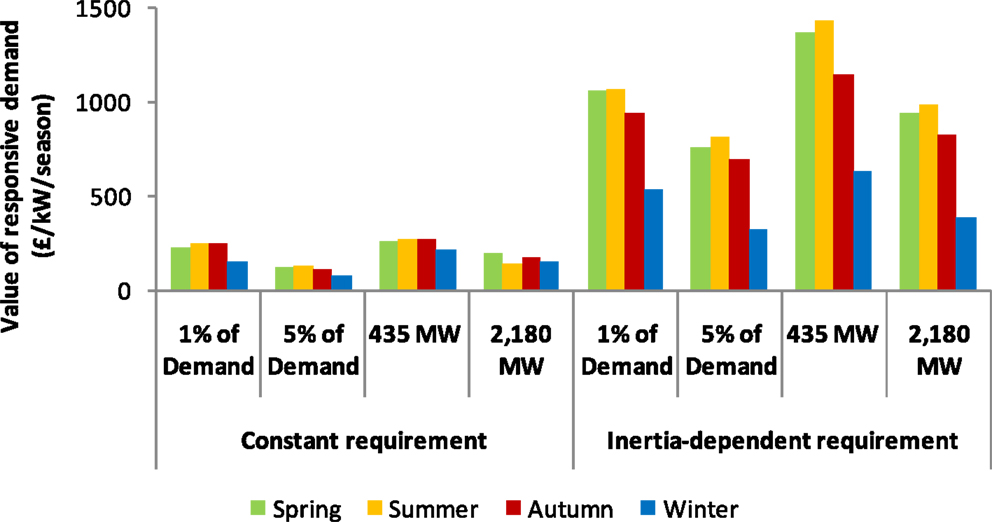
Figure 12 further disaggregates the value of responsive demand presented in Figure 9 into its components according to the season of the year where this value is generated.
We note that for the constant response requirement, the value of DSR tends to be the highest in autumn, which is driven by higher wind output in that season. On the other hand, if the response requirement is inertia-dependent, the value of DSR is the highest in summer when low demand requires high volumes of frequency response services. The value of DSR in both cases is the lowest in winter due to high demand.
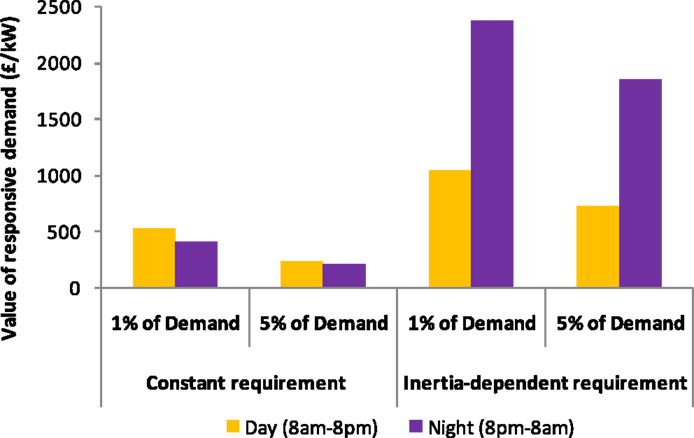
Similarly to seasonal values of DSR, it is also interesting to breakdown the value across different times of day. The relevant results for day and night periods are presented in Figure 13. We note that with constant response requirement the value of frequency responsive demand is slightly higher during daytime. The reason is that during night, the storage is normally pumping, which is sufficient to provide the bulk of the required response. With inertia-dependent response requirement on the other hand, the value of frequency responsive demand is much higher during night-time, when the synchronized capacity is low due to lower demand, thus requiring more frequency response.
Value of Provision of Instant Frequency Response from DSR
In the case studies presented so far, it is assumed that DSR is capable of providing primary frequency response, i.e., gradually reducing demand as the frequency drops following a generator outage, but in fact some DSR technology is capable to instantly delivery frequency response. Due to the reduced system inertia driven by integration of wind generation, faster delivery of frequency response could significantly reduce the system operation cost and wind curtailment (Teng et al., 2015). The instant delivery of frequency response from DSR is modeled as the reduction of the largest plant outage.
The value of instant delivery is quantified in Figure 14, where the value of the combined provision of conventional frequency response (75% of frequency responsive demand) and instant frequency response (25% of frequency responsive demand) is compared to previous results from cases where only conventional frequency response was provided by DSR. We note that the provision of instant frequency response creates significant additional benefits for the system. For instance, in the 2030 GB system and for the case where 1% of demand participate in DSR, the value increases the most, from £3,600/kW to £8,100/kW. Considerable increases are observed in other cases as well. These results suggest that the provision of instant frequency response by DSR could be an important source of value for the system and that the development of the necessary functionality of the technology to provide it may be of great interest for future research.
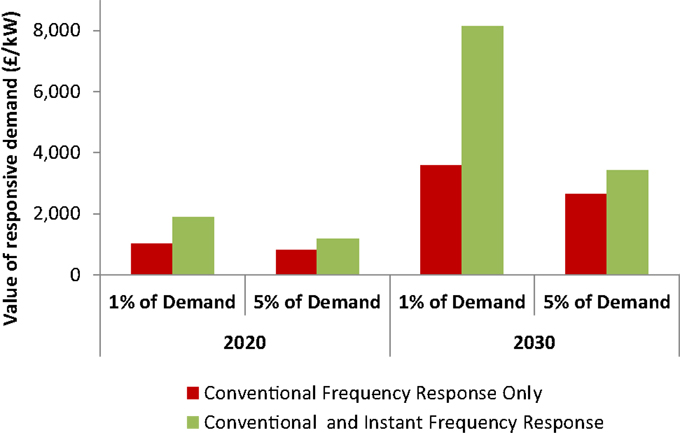
Figure 14. Value of simultaneous provision of conventional frequency response and instant frequency response by DSR.
Impact of Competing Technologies on the Value of DSR
In order to establish the competitiveness of frequency response provision from DSR, the value of its service should be estimated while also considering the contribution of other competing technologies that can contribute to the delivery of frequency response, including battery storage, interconnections, flexible generation, inertia response from wind turbines, other storage technologies, etc. Given that the size of the market for frequency regulation services is expected to increase significantly, it can be expected that a number of different providers may emerge and compete for a part of the market share.
This section focuses on the value of frequency response provision from DSR in the presence of two competing technologies: (i) battery storage and (ii) conventional generators with enhanced flexibility.
Battery Storage
Energy storage is capable to perform energy arbitrage (Bradbury et al., 2014) and ancillary services (Strbac et al., 2012). In particular, significant opportunity for battery storage is in the provision of frequency response service (He et al., 2015), due to the limited energy availability and life cycle degradation. By displacing the frequency response provided by conventional generators, battery storage could increase the overall efficiency of system operation, enhance the ability of the system accommodate renewable generation, and reduce carbon emissions as a result. It may at the same time compete with the frequency response provision from DSR.
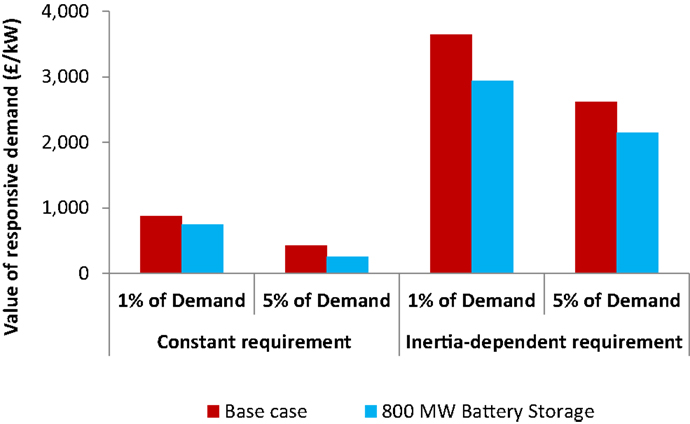
Figure 15 illustrates the impact on the value of DSR from competing battery storage. It has been assumed that 800 MW of frequency response from battery storage is continuously available in the system. In most cases, the value of frequency response provision from DSR does not reduce by more than 20% compared to the case without battery storage. However, in the case of 5% DSR with constant requirement, the value of DSR is roughly halved, indicating that the most favorable opportunities to displace costly provision of frequency response from part-loaded conventional generators have already been utilized by battery storage.
Enhanced Flexibility of Conventional Generators
A number of parameters could be used to characterize the flexibility of conventional generators (Teng et al., 2014), such as minimum stable output, ramp rates, minimum up and down times, etc. In this sub-section, we investigate the impact of enhanced capability of conventional generators to provide frequency response, and assess the resulting impact on the value of frequency response provision from DSR.
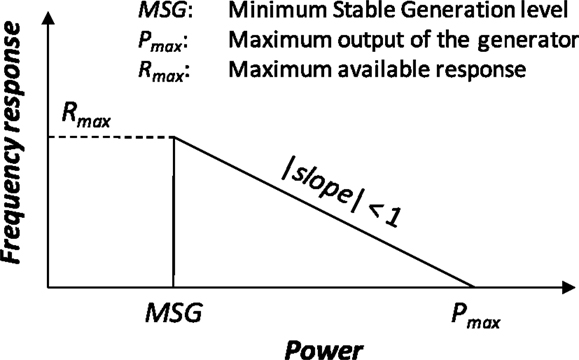
We introduce the response slope parameter, which is defined as the ratio of the amount of primary frequency response that a generator can provide and the reduction in generator output needed to ensure the provision of that amount of frequency response. This ratio is typically expressed as percentage. Given that primary frequency response requires delivery within the time window of 10 s, not all of the available headroom between constant generator output and the maximum output can be provided in the form of frequency response, resulting in response slope values of <100%. Figure 16 illustrates the response providing capability of a typical conventional generator. For instance, a 500 MW generator with a 40% slope (similar to today’s generator characteristics) could provide 120 MW of response if it reduces its output to its minimum stable output level of 200 MW. A generator of the same size with an 80% slope on the other hand could provide 240 MW at the same power output level, i.e., twice as much as the 40% generator.
In our case studies, we assume two levels of response capability for conventional generation:
• low-response capability (also used as base case in the previous studies): 40% response slope;
• high-response capability: 80% response slope;
Low capability is chosen to be similar to the capabilities of today’s generators, while the high capability case represents possible improvements in generation control resulting in the ability to provide more response at the same generation output. Given the expected increase in the volume of frequency response services in the future low-carbon GB system, as well as the escalating cost of providing these services, the high response capability might become an attractive proposition from the plant developer and operator perspective.
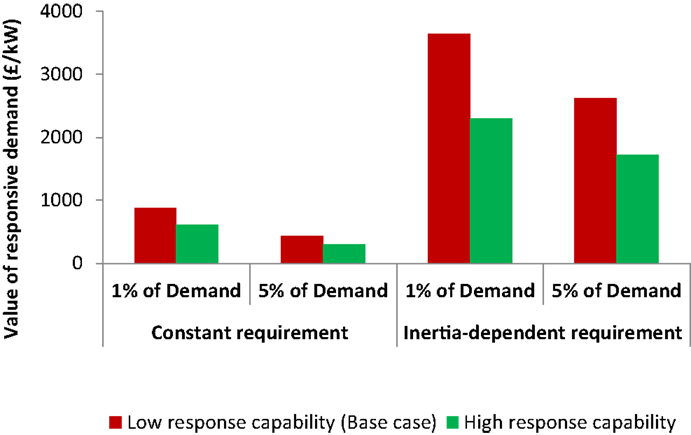
The value of frequency responsive demand is assessed in the presence of high-response capability generation. The results of the annual studies are presented in Figure 17 and compared against the case with low-response capability generation.
We note that high response capability of conventional generators eliminates about a third of the value generated by frequency responsive demand, and this reduction is fairly robust across the responsive demand scenarios and for different approaches to frequency regulation scheduling. A significant part of the value of responsive demand, however, remains even when highly flexible generators are deployed. Although flexible generators can provide more response for the same operating headroom, this response still comes at the cost of reduced operational efficiency, i.e., higher fuel and carbon cost, which still leaves significant scope for the provision of frequency regulation by DSR.
Discussion and Conclusion
This paper presented the case studies aimed at quantifying the frequency response requirements and the value of DSR in supporting frequency response in the GB low-carbon electricity system in 2020 and 2030. The results suggest that frequency response requirements could increase dramatically due to the integration of wind generation, and the contribution of DSR in the provision of frequency response could provide significant benefits to the system.
The value of DSR for frequency response is much higher in the case where the impact of reduced system inertia on the requirements for frequency response is recognized. The value of DSR is the highest in summer, when low electricity demand in conjunction with lower system inertia requires high volumes of frequency regulation services, while it is the lowest in winter due to high demand. Similarly, the value of DSR is much higher during the night, when the volume of synchronized capacity is generally low. These findings suggest that it may be particularly valuable to pursue those potentially flexible demand categories that would allow greater controllability during summer or night time. The analysis presented in this paper also shows that significant additional value could be provided to the future GB system if the DSR is capable of delivering instant frequency response in reaction to a fast decline in system frequency.
Competing technologies that can also provide frequency regulation, such as battery storage and (more) flexible conventional generators, were found to reduce the value of DSR. This reduction varied between 15 and 35% in the great majority of our sensitivity studies, still leaving significant scope for sourcing frequency response services from DSR in order to facilitate a more cost-efficient operation of the future low-carbon electricity system.
Conflict of Interest Statement
The authors declare that the research was conducted in the absence of any commercial or financial relationships that could be construed as a potential conflict of interest.
References
Angeli, D., and Kountouriotis, P. A. (2012). A stochastic approach to ‘dynamic-demand’ refrigerator control. IEEE Trans. Control Syst. Technol. 20, 581–592. doi: 10.1109/TCST.2011.2141994
Ashton, P. M., Saunders, C. S., Taylor, G. A., Carter, A. M., and Bradley, M. E. (2015). “Inertia estimation of the GB power system using synchrophasor measurements,” in Power Systems, IEEE Transactions, 701–709. doi:10.1109/TPWRS.2014.2333776
Aunedi, M., Kountouriotis, P.-A., Calderon, J. E. O., Angeli, D., and Strbac, G. (2013). Economic and environmental benefits of dynamic demand in providing frequency regulation. IEEE Trans. Smart Grids 4, 2036–2048. doi:10.1109/TSG.2013.2258047
Bradbury, K., Pratson, L., and Patiño-Echeverri, D. (2014). Economic viability of energy storage systems based on price arbitrage potential in real-time U.S. electricity markets. Appl. Energy 114, 512–519. doi:10.1016/j.apenergy.2013.10.010
Douglass, P. J., Garcia-Valle, R., Nyeng, P., Østergaard, J., and Togeby, M. (2013). Smart demand for frequency regulation: experimental results. IEEE Trans. Smart Grid 4, 1713–1720. doi:10.1109/TSG.2013.2259510
Erinmez, I. A., Bickers, D. O., Wood, G. F., and Hung, W. W. (1999). “NGC experience with frequency control in England and Wales – provision of frequency response by generators,” in Power Engineering Society 1999 Winter Meeting, IEEE, Vol. 1 (New York, NY: IEEE), 590–596.
He, G., Chen, Q., Kang, C., Pinson, P., and Xia, Q. (2015). Optimal bidding strategy of battery storage in power markets considering performance-based regulation and battery cycle life. IEEE Trans. Smart Grid. doi:10.1109/TSG.2015.2424314
Karangelos, E., and Bouffard, F. (2012). Towards full integration of demand-side resources in joint forward energy/reserve electricity markets. IEEE Trans. Power Syst. 27, 280–289. doi:10.1109/TPWRS.2011.2163949
Lu, N., and Hammerstrom, D. J. (2006). “Design considerations for frequency responsive grid friendly appliances,” in Transmission and Distribution Conference and Exhibition. Dallas, TX.
Energy Networks Association and National Grid. (2013). Frequency Changes during Large Disturbances and their Impact on the Total System. National Grid. Available at: http://www.nationalgrid.com/NR/rdonlyres/D3F18F81-BFE8-4BA1-8B82-CCD6CD0A0A4F/62018/GC0035IndustryConsultationv10.pdf
National Grid. (2014). “Security and quality of supply standards,” in GB Security and Quality of Supply Standard. Available at: http://www2.nationalgrid.com/UK/Industry-information/Electricity-codes/System-Security-and-Quality-of-Supply-Standards/
National Grid, U. K. (2015). National Grid: The Grid Code. National Grid Eletricity Transmission plc. Available at: http://www2.nationalgrid.com/UK/Industry-information/Electricity-codes/Grid-code/The-Grid-code/
Pearmine, R., Song, Y. H., Williams, T. G., and Chebbo, A. (2006). Identification of a load–frequency characteristic for allocation of spinning reserves on the British electricity grid. IEE Proceedings-Generation, Transmission and Distribution 153, 633–638. doi:10.1049/ip-gtd:20050404
Rautiainen, A., Repo, S., and Jarventausta, P. (2009). “Using frequency dependent electric space heating loads to manage frequency disturbances,” in PowerTech (Bucharest: IEEE), 1–6.
Redpoint Energy. (2010). Electricity Market Reform – Analysis of Policy Options. London: Redpoint Energy.
Samarakoon, K., Ekanayake, J., and Jenkins, N. (2012). Investigation of domestic load control to provide primary frequency response using smart.”. IEEE Trans. Smart Grid 3, 282–292. doi:10.1109/TSG.2011.2173219
Short, J. A., Infield, D. G., and Freris, L. L. (2007). Stabilization of grid frequency through dynamic demand control. IEEE Trans. Power Syst. 22, 1284–1293. doi:10.1109/TPWRS.2007.901489
Strbac, G. (2008). Demand side management: benefits and challenges. Energy Policy 36, 4419–4426. doi:10.1016/j.enpol.2008.09.030
Strbac, G., Aunedi, M., Pudjianto, D., Djapic, P., Teng, F., Sturt, A., et al. (2012). Strategic Assessment of the Role and Value of Energy Storage Systems in the UK Low Carbon Energy Future. London: Carbon Trust.
Tan, Y. T., and Kirschen, D. S. (2006). “Co-optimization of energy and reserve in electricity markets with demand-side participation in reserve services,” in Power Systems Conference and Exposition, 2006. PSCE’06. Atlanta: IEEE.
Teng, F., Pudjianto, D., Strbac, G., Ferretti, F., and Bove, R. (2014). “Assessment of the value of plant flexibility in low carbon energy system,” in Renewable Power Generation Conference (RPG 2014), 3rd (Naples).
Teng, F., Trovato, V., and Strbac, G. (2015). Stochastic scheduling with inertia-dependent fast frequency response requirements. IEEE Trans. Power Syst. doi:10.1109/TPWRS.2015.2434837
Keywords: demand-side response, wind generation, frequency response, stochastic generation scheduling, inertia
Citation: Teng F, Aunedi M, Pudjianto D and Strbac G (2015) Benefits of demand-side response in providing frequency response service in the future GB power system. Front. Energy Res. 3:36. doi: 10.3389/fenrg.2015.00036
Received: 24 June 2015; Accepted: 03 August 2015;
Published: 18 August 2015
Edited by:
Yun Seng Lim, University of Manchester, UKReviewed by:
Stella Morris, Universiti Tunku Abdul Rahman, MalaysiaSiong Lee Koh, Heriot-Watt University Malaysia, Malaysia
Copyright: © 2015 Teng, Aunedi, Pudjianto and Strbac. This is an open-access article distributed under the terms of the Creative Commons Attribution License (CC BY). The use, distribution or reproduction in other forums is permitted, provided the original author(s) or licensor are credited and that the original publication in this journal is cited, in accordance with accepted academic practice. No use, distribution or reproduction is permitted which does not comply with these terms.
*Correspondence: Fei Teng, Department of Electrical and Electronic Engineering, Imperial College London, Room 1109, London, UK,ZmVpLnRlbmcwOUBpbXBlcmlhbC5hYy51aw==
 Fei Teng
 Marko Aunedi
 Danny Pudjianto