 Bruno Panella
 Luigi Consalvo De Giorgi
 Mario De Salve
- Department of Energy, Politecnico di Torino, Torino, Italy
The study of the fluid dynamics of the windowless spallation target of an accelerator-driven system (ADS) is presented. Several target mockup configurations have been investigated: the first one was a symmetrical target, which was made by two concentric cylinders and the other configurations are not symmetrical. In the experiments, water has been used as hydraulic equivalent to lead–bismuth eutectic fluid. The experiments have been carried out at room temperature and flow rate up to 24 kg/s. The fluid velocity components have been measured by an ultrasound technique. The velocity field of the liquid within the target region either for the approximately axial–symmetrical configuration or for the not symmetrical ones as a function of the flow rate and the initial liquid level is presented. A comparison of experimental data with the prediction of the finite volume FLUENT code is also presented. Moreover, the results of a 2D–3D numerical analysis that investigates the effect on the steady state thermal and flow fields due to the insertion of guide vanes in the windowless target unit (TU) of the EFIT project ADS nuclear reactor are presented, by analyzing both the cold flow case (absence of power generation) and the hot flow case (nominal power generation inside the TU).
Introduction
The accelerator-driven system (ADS) is an interesting solution for incineration of long-lived nuclear waste coming from conventional nuclear reactors (Rubbia et al., 1995, 2001; Salvatores et al., 1997) and consists mainly of three parts: the subcritical core, the spallation target unit (TU), and the light particle accelerator (in most cases protons). The TU and the accelerator constitute the external neutron source that is necessary to sustain the fission chain in the subcritical core, as the accelerator provides an intense and energetic proton beam that impinges into the spallation fluid, a molten heavy metal, contained into the TU, generating the neutrons (Salvatores, 2006). The European R&D for nuclear waste management EUROTRANS Program has selected the XT-ADS, the EFIT (European Facility for Industrial Transmutation), and MYRRHA projects (Cinotti and Gherardi, 2002; Cinotti et al., 2003, 2004; Bianchi, et al., 2005; Knebel et al., 2006; Salvatores, 2006; Petrazzini, 2008; Aït Abderrahim et al., 2012; Mansani et al., 2012). The EFIT spallation TU is located in the center of the reactor where 800 MeV protons from the accelerator impinge on a free surface of lead exposed to vacuum (Mansani et al., 2012). Two types of connection between the accelerator tube and the target case are possible: window and windowless. In the windowless spallation target (WST) configuration, introduced by the Ansaldo Company nuclear division team for a demonstrative design (Cinotti and Gherardi, 2002; Bianchi, et al., 2005, 2008; Aït Abderrahim et al., 2012; Mansani et al., 2012), the proton beam impinges directly the target (lead or lead–bismuth eutectic) and the spallation region velocity field must be able to remove efficiently the rather high volumetric thermal power due to the proton interactions with the liquid metal nuclei (Abanades et al., 2008; Kumawat et al., 2008; Sordo et al., 2008). As regards the WST, a major issue is the study of the velocity and temperature fields because boiling phenomena are critical for a correct neutrons production: the spallation region velocity field must be able to remove the volumetric thermal power due to the proton interactions with lead–bismuth nuclei without the local boiling of the liquid. The flow rate should be able to remove a specific power of about 12.5 kW/cm3 at a temperature of about 670 K in the case of XT-ADS and 18.0 kW/cm3 in the case of EFIT at the same temperature. Material properties issues of Pb and T91 steel limit the maximum velocity near walls to 2.0–2.5 m/s and temperature to 950 K with oxygen control. Moreover, the WST limits the free surface temperature to around 900 K to avoid boiling or an excessive evaporation rate from the free surface at operating pressure, which is estimated to be in the range of 0.1–1 Pa. The shape of the interface, which should be stable with no vortex and/or other perturbations that could facilitate the evaporation, has to be carefully investigated. The flow is partially unconfined for the presence of a free surface (interface) at the top of the TU. The effective removal of the thermal power represents a major issue in the design of the windowless TU, as the metal vapors, which are produced either by the evaporation from the free surface or by local boiling into the bulk of the spallation fluid, can enter the proton beam tube with negative effects on the neutrons production and device integrity. In order to preserve high vacuum conditions into the accelerator tube, a thermal fluid-dynamic analysis of the flow in the TU must be performed, and, owing to the difficulty to perform thermal fluid-dynamic calculations at the free surface, experimental work is needed in order to simulate the flow of the molten lead or eutectic in the target region, for conditions similar to the real plant. In the present experimental research, three configurations of the windowless target, one symmetrical and two asymmetrical, have been experimented, using water as hydraulic equivalent to lead or lead–bismuth eutectic fluid, by maintaining the same velocity values (the same Froude number) and about the same Weber number, whereas the different Reynolds number (the ratio is of the order of 7) seems less important owing to the prevailing inertial and gravity forces. A comparison of experimental data with the prediction of the commercial code Fluent 6.3.26 (Fluent Inc, 2005) is also presented. As a result of the investigation of the flow characteristics inside several theoretical and experimental mock-ups that simulate the EFIT reactor WST, but operating with water, it has been shown that important geometrical modifications, such as insertion of guide vanes inside the target and proper modifications of the container geometry, have to be introduced in order to avoid flow recirculation, vortices and fluid detachment from the walls, and to get suitable flow conditions within the spallation target heat deposition region. Moreover, the results of a computational fluid dynamics (CFD) numerical analysis with reference to the EFIT WST geometry are presented with the aim of evaluating the steady state effects on the flow and thermal fields induced by the insertion of the vanes as a function of the vanes number, dimensions, shape, and position in the TU and of the profile of smoothed corners. The CFD method and a statistical approach to the problem allows the development of accurate analytical models capable to predict with adequate precision the turbulent flow and the thermal field inside the heat deposition region of the EFIT WST equipped with guide vanes and, to identify possible geometries consistent with imposed design constraints that depend on the adopted optimization design criteria. The presence of the free surface is neglected (closed tube approximation) by assuming that it produces a small perturbation on the flow structure. An algorithm has been developed to generate the modified geometry of the TU and the geometrical features of the vanes depend only on the value of a discrete number of input parameters, which constitutes the design space that is explored by applying the design of experiments (DOE) technique (Sacks et al., 1989; Morris and Mitchell, 1995; Santner et al., 2003) and the response surface methodology (RSM) (Myers and Montgomery, 2002). The study takes into account both the cold flow case (absence of power generation) and the hot flow case (nominal power generation inside TU). Two turbulence models available with the commercial CFD Fluent 6.3.26 code have been tested: standard k-ϵ model and reynolds stress model.
Symmetrical Test Section
The first target geometry that has been investigated is characterized by a flow with axial–symmetrical properties. The test facility is an open loop with a centrifugal pump, a Venturi flow meter, a heat exchanger, to control the fluid temperature, the axial–symmetrical test section, and an air separator tank. The test section (Figure 1) is made by two concentric cylinders with inner cylinder diameter equal to 200 mm and outer cylinder diameter equal to 290 mm. The overall height is equal to 1750 mm. Water flows up in the annular region and flows down in the central region. Further details of the facility can be found in De Salve et al. (2002).
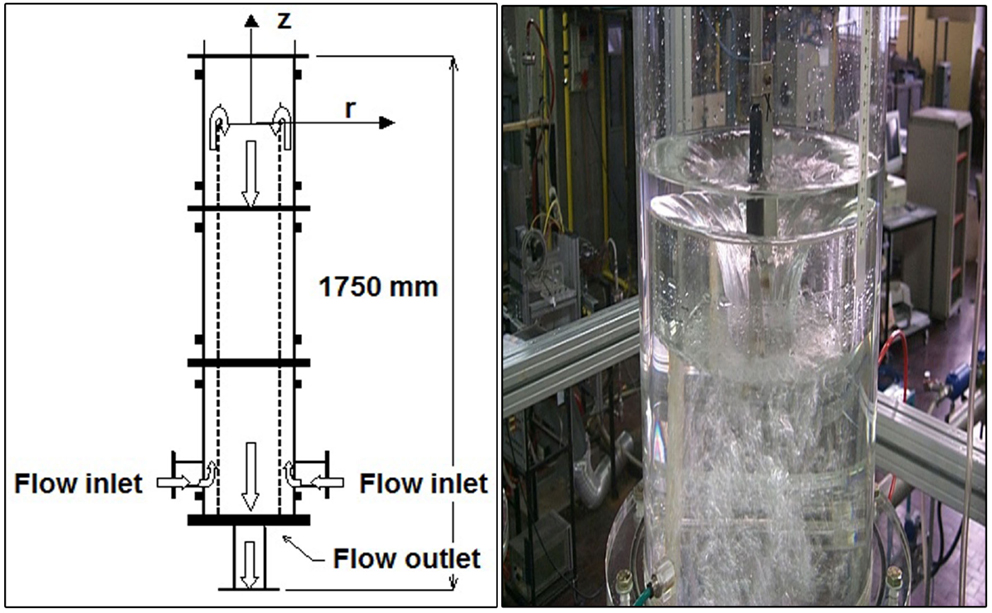
Figure 1. Symmetrical test section scheme and picture.
The most important experimental parameters are the imposed mass flow rate W (the Venturi flow rate measurement accuracy is 2%) and the initial fluid level h0 measured from the top edge of the inner cylinder. The experiments have been carried out at room temperature equal to 298 K in the following range: flow rate from 2.5 to 20 kg/s with the average velocity ranging from 0.07 to 0.64 m/s; inner pipe Reynolds number from 15,000 to 127,000; initial fluid level from −50 to 190 mm. The velocity measurement method is based on the pulsed echo ultrasound technique by detecting the Doppler shift of the ultrasound wave reflected from moving particles that are suspended in the fluid (ADV Acoustic Doppler Velocimeter) and the ADV SonTek probe (SonTek Co, 1997) has been used, with a velocity measurement uncertainty of 5%. At zero or lower liquid levels, the free surface assumes a typical funnel shape and an air entrainment into the liquid flow at the free surface can be seen; the air remains inside the test section only if the flow rate is sufficiently low; at higher flow rate, the air is entrained. Runs with high levels show a low air entrainment if the flow rate is less than about 17.5 kg/s; in this case, the free surface is about flat with some surface waves and few vortices. Figure 2A shows a typical free surface profile on a vertical radial section obtained by measuring the free surface level by means a metric rule. Figure 2B shows the effect of inlet mass flow rate on the free surface profile. It can be seen that at higher mass flow rates, the level reaches a maximum near the inner pipe radius, r = 100 mm.
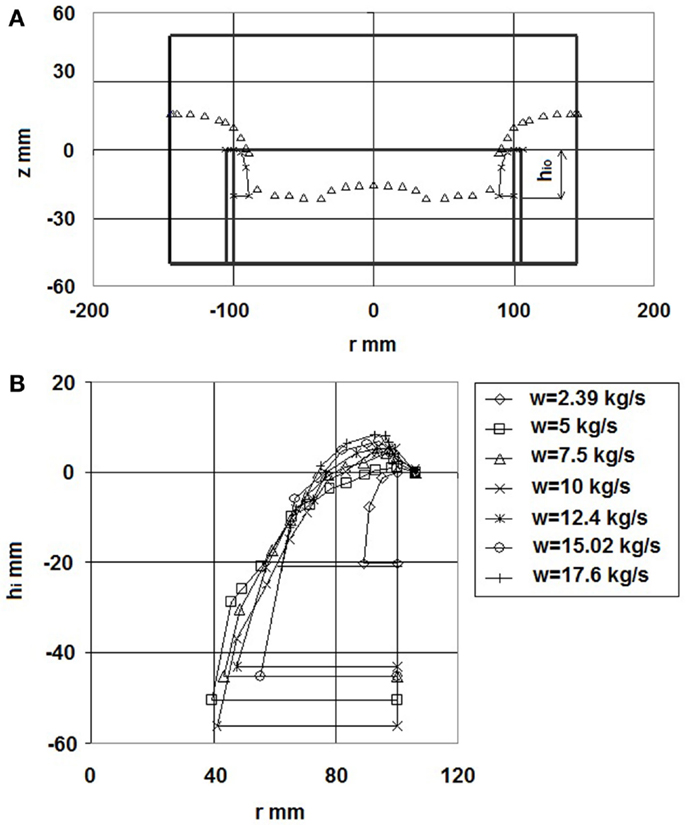
Figure 2. (A) Typical free surface profile on vertical radial section. (B) Free surface profiles vs. radial coordinate at different mass flow rates.
Figures 3A,B show the effect of the mass flow rate on velocity field: the average velocity axial component Vz vs. the radius r for different mass flow rates, from 5.5 to 15.3 kg/s, is presented in Figure 3A at initial water level h0 = 176 mm. The measuring plane elevation is z = 45 mm below the inner cylinder edge. These radial profiles show the Vz increase near the inner cylindrical wall in the region that is about 40 mm far from the wall, whereas the profile is rather flat within most of the channel; it seems that the maximum Vz value is reached about 60 mm far from the axis. It can be deduced that the flow is still developing in agreement with the measured velocities values, which are higher than the cross-averaged values that are derived from the measured flow rate. Figure 3B shows the velocity radial component Vr vs. the radius at different mass flow rates and for the same run conditions: the data show an increase in the radial component of the velocity as the flow rate increases; it can be deduced that the slight symmetry lack and the uncertainty of the probe position can cause rather high Vr values also on the axis, which are not very different from the values in correspondence of the other radial positions. As a conclusion, the main findings from experiments on the symmetrical target are that the axial velocity is very low (and even upward oriented) just above the inner pipe edge. The radial component velocity is dominant between z = −50 mm and z = + 30 mm. In this region, some recirculation phenomena are also observed. The investigated geometry does not meet the design objectives of the WST due to the presence of a stagnant region of the fluid in upper part of the target where the thermal power released by protons is higher. So, the symmetrical WST design was dropped by Ansaldo Company nuclear team.
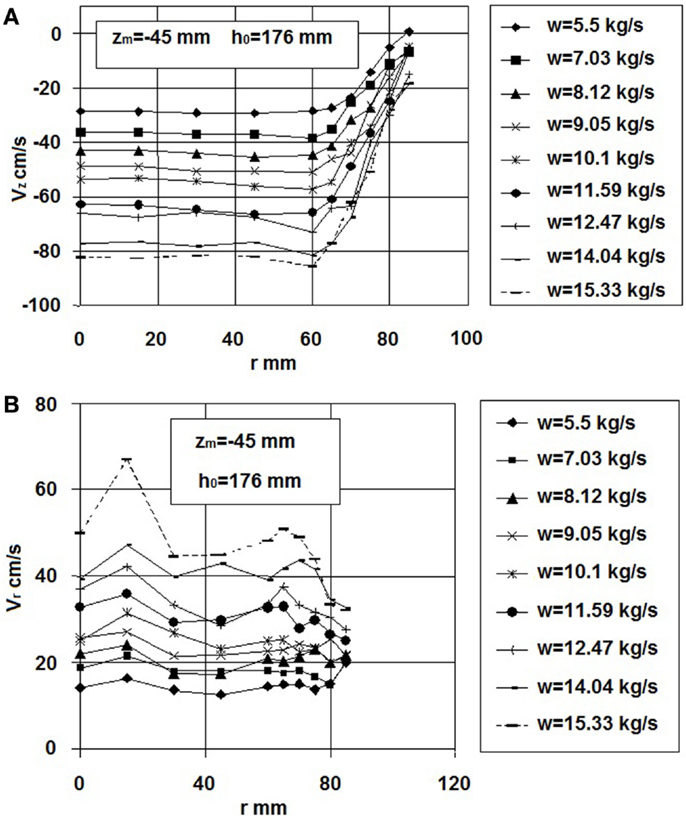
Figure 3. (A) Axial component of velocity Vz vs. radial coordinate at different mass flow rates. (B) Radial component of velocity Vr vs. radial coordinate at different mass flow rates.
Asymmetrical Test Sections
Two asymmetrical WST geometries have been experimentally investigated, by changing the test section in the same facility. The first one consists of a rectangular tank whose dimensions are: L = 760 mm, W = 360 mm, H = 500 mm. Figure 4 shows a scheme of the test section.
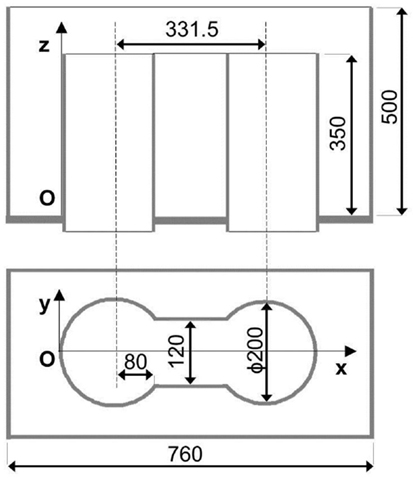
Figure 4. First asymmetrical test section scheme. Dimensions in millimeter.
Two vertical pipes with the inner diameter of 203 mm connect the bottom of the tank with the heat exchanger and the pump by means of several conic reductions. The test section dimensions are those of the Ansaldo reference XT-ADS: the distance between the axes of the cylindrical tubes of the spallation region is 330 mm, the width of the channel is 120 mm, the inner diameter of the feed and discharge pipe is 200 mm. The pump can provide a mass flow rate of 22 kg/s at 14 m head. Experimental runs have been carried out, at room temperature, in the range of mass flow rates from 5 to 22 kg/s at the initial level of 350 mm. Measurements were performed using either the ultrasounds ADV SonTek, or the instrument DOP2000 (Signal Processing S. A., 2004) developed by Signal Processing, based on the Doppler effect too. The probes used by DOP 2000 are non-intrusive if compared with other ultrasound probes. The results show that by raising the flow rate from about 5 kg/s to about 22 kg/s, the flatness of the interface tends to overfill at the feed exit, accompanied by a phenomenon of level growing and a vortex at the entrance of the discharge pipe. In the suction region, there is a depression of the liquid level. Fluid dynamics is complex due to the surface irregularities, as well as to the presence of oscillations of the interface and of the velocity.
Figure 5 presents the velocity components in x direction along the symmetry plan of the test section with the probe located at x0 = 110 mm, y0 = 0 mm, z0 = 290 mm at low mass flow rates (6.86 and 10.67 kg/s) and at high mass flow rates (17.59 and 22.08 kg/s). One can see that in the rectangular region of the test section for x between 119 and 350 mm, the velocity in x direction is high and constant enough. Around x = 350 mm at the inlet of the downcomer region, the component Vx is reduced and the flow changes direction.
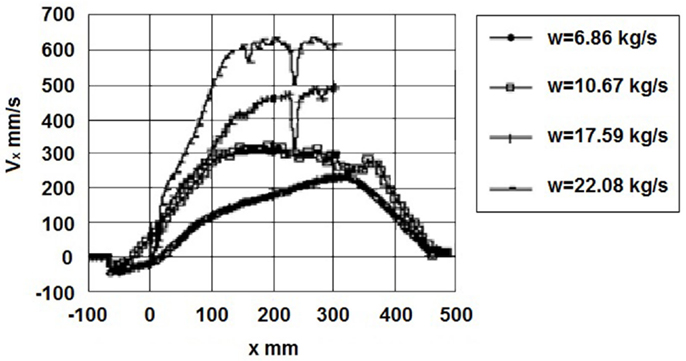
Figure 5. Horizontal component of velocity Vx vs. x coordinate at different mass flow rates.
Figure 6 shows the component Vx for a mass flow rate of 17.6 kg/s with the probe located at x0 = 0 mm, y0 = 0 mm, and for variable z0 with a 25 mm step: for the same x, Vx rises with z both in the feed pipe (x <105 mm) and in the rectangular zone of the test section. The reduction of Vx where the flow changes direction, as well as the existing maximum values for Vx in the region situated between z = 200 and 400 mm is significant. The position of the maximum depends on the flow rate as well as on the surface level. The analysis of these profiles shows that Vx increases with x and presents a high x derivative in the first 180 mm, whereas the variation between 180 and 220 mm is rather low. An abrupt variation occurs at approximately 240 mm, which probably characterizes the region of transition between two big vortices. Vx increases with z until about 269 mm and then decreases. At z = 294 mm, Vx is about 600 mm/s. The tests show that at flow rates higher than 15 kg/s, there is a little height difference of the interface between the region of flow feeding and the region of the target. The experimental results and the visual observation show: (a) characteristic behavior of the horizontal component of the velocity Vx in the exit region, reaching a maximum at about z = 200 mm, (b) recirculation near the tank walls and near the riser and downcomer pipe walls, (c) oscillations, which cannot be neglected at the interface at high mass flow rates.
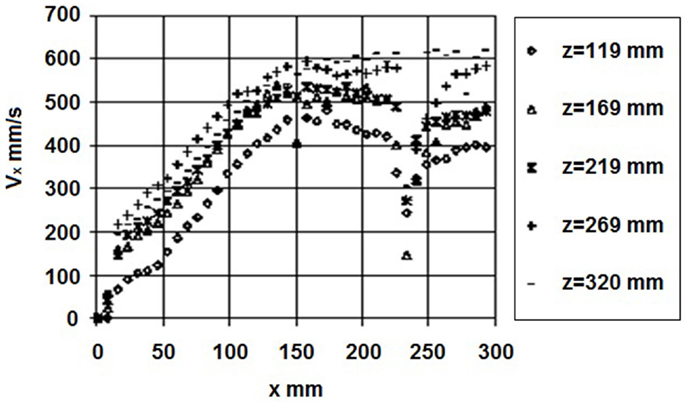
Figure 6. Horizontal component of velocity Vx vs. x coordinate at different elevations.
The second experimental section that has been investigated introduces two major modifications with respect to the first asymmetrical target: the first one concerns the dimensions that refers to EFIT target geometry design (scaled 1–1), the second concerns the geometry of the feed and discharge pipes, which are prismatic channels. The test section, which is sketched in Figure 7, consists of two Plexiglas prismatic channels. At the bottom, two conic reductions connect them to the rest of the loop. The target is located at the top between the two channels. During all the tests, a constant free surface liquid level 470 mm high (equal to the level of the interface of the reference reactor) has been fixed. The hydraulic circuit and instrumentation are the same as seen previously.
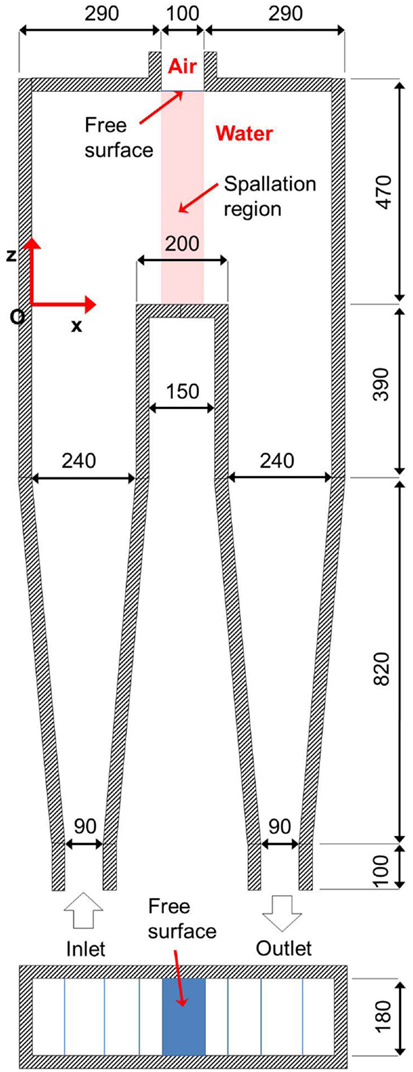
Figure 7. Second asymmetrical test section scheme. Dimensions in millimeter.
Experimental tests have been carried out, at room temperature, in the range of flow rates from 10 to 20 kg/s and initial level h0 of 470 mm. The ultrasound DOP2000 probe has been inserted on the outer surface of the Plexiglas walls at elevations of 50, 145, 240, and 420 mm. Figure 8A shows the mass flow rate (W = 10, 15, 20 kg/s) effect on x velocity component at the height z = 240 mm. It can be seen that, with good agreement, horizontal velocity is proportional to the flow rate. Figure 8B shows the horizontal component of flow field at the heights 50, 240, 420 mm: the flow is characterized by the presence of a vortex in the lower part of the spallation region that is determined by the separation of fluid vein in the feed pipe entering the spallation region. Moreover, the flow is characterized by low velocities near the interface.
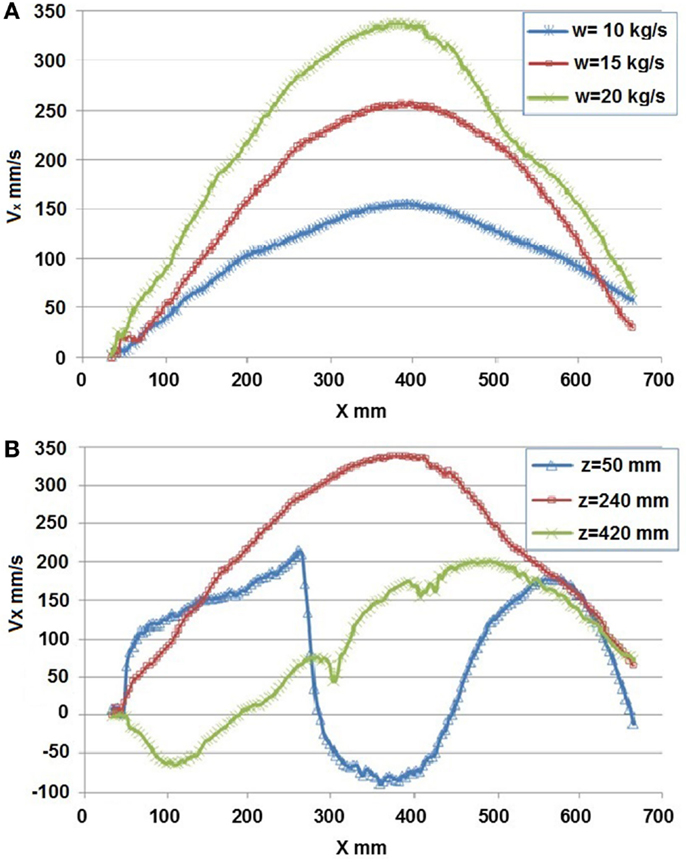
Figure 8. (A) Horizontal component of velocity vs. x coordinate at different mass flow rates and height z = 240 mm. (B) Horizontal component of velocity vs. x coordinate at different heights and mass flow rate W = 20 kg/s.
CFD Simulations
Numerical experiments have been carried out by means of the Fluent 6.3.26 code with the following main aims:
• validation of the numerical code with respect to the flow in the second asymmetrical test section (Figure 7) and identification of related issues in terms of flow characteristics;
• development of a statistical tool to be used to predict the flow characteristics in more complex geometries;
• identification of possible geometries, to get the desired flow conditions, once appropriate criteria have been adopted (numerical solution of an inverse Navier–Stokes problem).
Concerning the first goal, the flow into the second asymmetrical facility at the mass flow rate of 20 kg/s has been simulated. A 2D approximation of the test section presented in Figure 7, discretized with quadrilateral cells having a mean mesh size of 5 mm (which assures the grid independence of the solution), has been adopted. The simulated flow is isothermal, multiphase, for the presence of a free surface separating air and water, and turbulent. An initial level of the water equal to 470 mm has been chosen. A transient calculation has been performed and the steady solution depends upon the initial height of water in the target region. The interface between water and upper air has been tracked thanks to the geo-reconstruct scheme, which is an explicit method within the volume of fluid (VOF) implicit algorithm, a well known scheme for modeling multiphase flows. The average time step is of the order of 10−3 s. The k−ϵ “Realizable” model, widely used in industrial applications, has been used for modeling the turbulence. The second order accurate discretization scheme QUICK has been used for momentum and turbulence equations and PRESTO! for pressure evaluation. PISO algorithm has been adopted for velocity–pressure coupling. At inlet and outlet sections of uniform and equal velocity profiles have been imposed by assuming that water is the only phase that enters and exits the domain. For the operating feed condition of 20 kg/s, the value of velocity at inlet–outlet sections is 1.24 m/s. At the interface section, the static pressure equal to the atmospheric pressure has been imposed. The boundary conditions for turbulent quantities k and ϵ concern the specifications of intensity of turbulence. Standard wall functions have been used to model the flow near the wall. Residuals, which define the convergence within each time step, have been set equal to 10−5 for continuity, momentum, and turbulence equations. Figure 9 shows the interface profile at different times for an initial water level of 470 mm. A stable condition is reached after about 10 s.
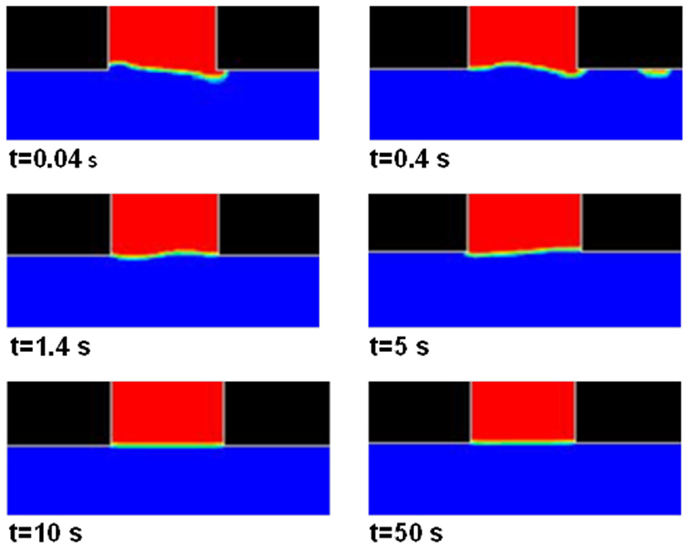
Figure 9. Interface profile at different times at flow rate = 20 kg/s and initial level = 470 mm.
Figure 10 presents the velocity field simulated at operating conditions and for z > −390 mm, which is the more interesting target subdomain. It can be seen that the flow field can be subdivided in three main regions with peculiar characteristics. The first region is a tube flux in which the entire mass flow rate is driven and at x = 340 mm (in correspondence of the plane of symmetry of the target), the horizontal velocity is higher in the lower part of this tube flux. The tube flux in the spallation region extends from 100 to 350 mm with respect to the z coordinate, whereas from 0 to 100 mm there is an asymmetric recirculating zone that is located at the bottom of the spallation region. It originates from the detachment of the fluid vein when the flow direction suddenly changes from vertical to horizontal one. Finally, the third region (at350 ≤ z ≤ 470 mm in the spallation region) is characterized by very low flow velocities and two weak recirculating fluid structures, placed at the upper corners of the target region, can be identified. Figures 11 and 12 show the comparison between the Fluent simulated profiles of the velocity horizontal component at the elevation z = 145 and z = 50 mm and the test data, which present a velocity range in each location due to the fluid turbulence (the thick blue line represent the average of the data).
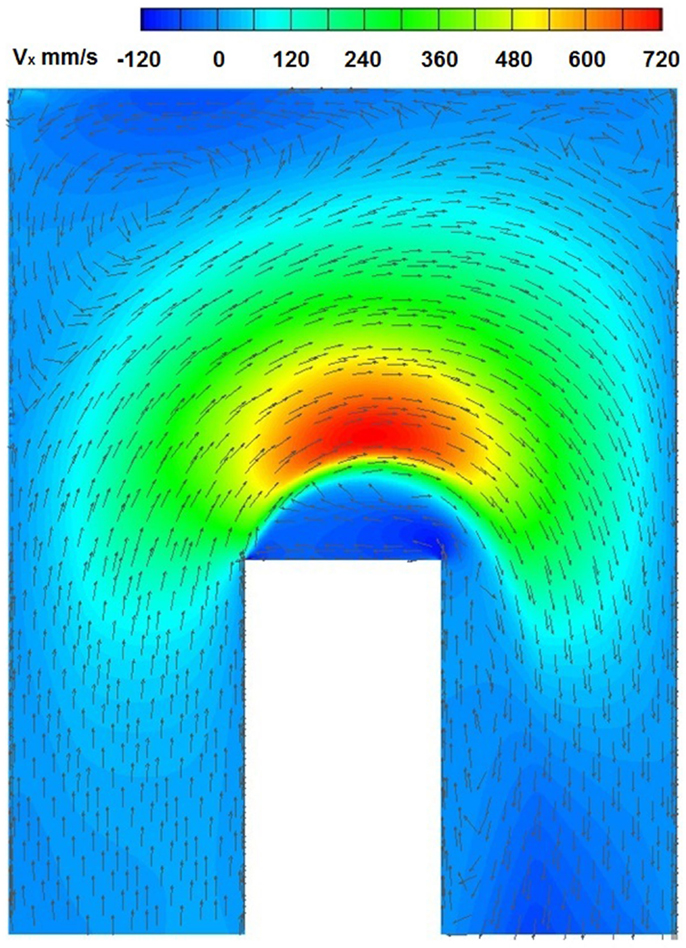
Figure 10. Horizontal component of velocity at flow rate = 20 kg/s and at initial level = 470 mm.
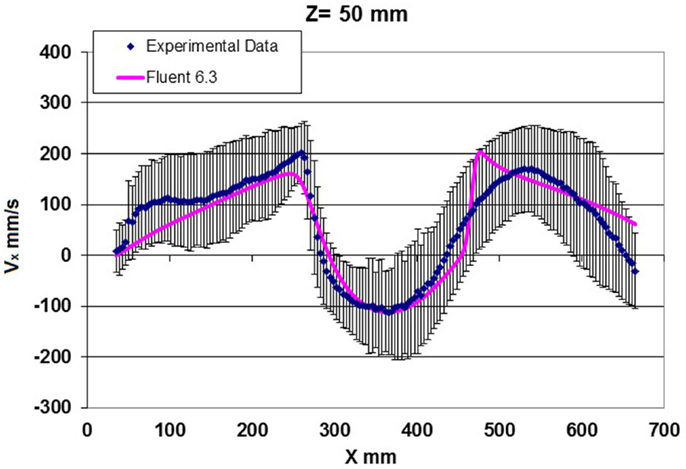
Figure 11. Test data vs. numerical simulation of the horizontal component of velocity vs. x coordinate at z= 50 mm.
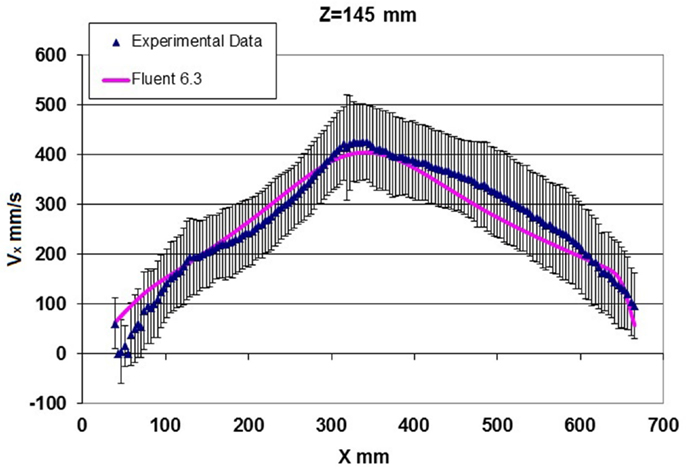
Figure 12. Test data vs. numerical simulation of the horizontal component of velocity vs. x coordinate at z= 145 mm.
The low velocities at the interface and the recirculating region at the bottom of the spallation region constitute the main drawback that characterizes the investigated geometry. In order to obtain a more suitable flow field, it is necessary to introduce some modifications on the target’s geometry, and the choice has been the introduction of internal vanes that drive the flow together with the rounding of target’s corners with a suitable profile. A numerical study has been performed to evaluate the effect of this type of modifications. The introduction of guide vanes produces higher velocities at the interface while smooth corners prevent the occurrence of recirculating regions. A first attempt has been done considering a vane’s profile geometrically designed starting from a basic elliptic arc (Figure 13) with the corners that are smoothed with elliptic arcs. Lower elliptic arcs have minor radius equal to 50 mm and major radius equal to 100 mm. Upper elliptic arcs have minor radius equal to 145 mm and major radius equal to 290 mm. The distribution of vanes is uniform in vertical direction and the distance between two contiguous vanes has been adopted equal to 78 mm. In order to redistribute more suitably in horizontal direction, the mass flow rate entering the spallation target, starting from the left lower corner as a reference origin and considering, the vanes are distributed according to a geometrical progression rule with ratio equal to 1.3. The modified geometry is discretized with a triangular mesh with mean size of 2 mm. All other settings in the code, which does not include multiphasic specifications, are taken as for the previous case.
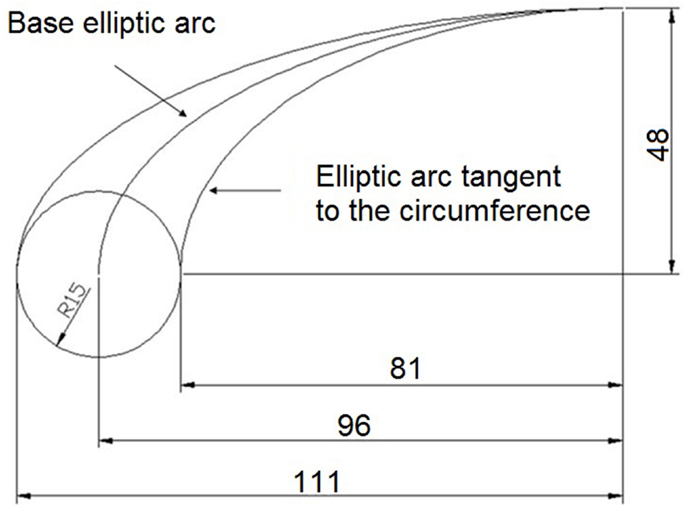
Figure 13. Vane’s profile. Dimensions in millimeter.
Figure 14 shows the flow field for the modified geometry that has been simulated by the Fluent code: it can be seen that the geometrical modifications produce significant effects on the velocity. In particular (Figure 15), the horizontal velocity in the upper part of the spallation region is much higher than the reference case and it is comparable with the mean velocity at the inlet section of the target that is equal to 470 mm/s at W = 20 kg/s.
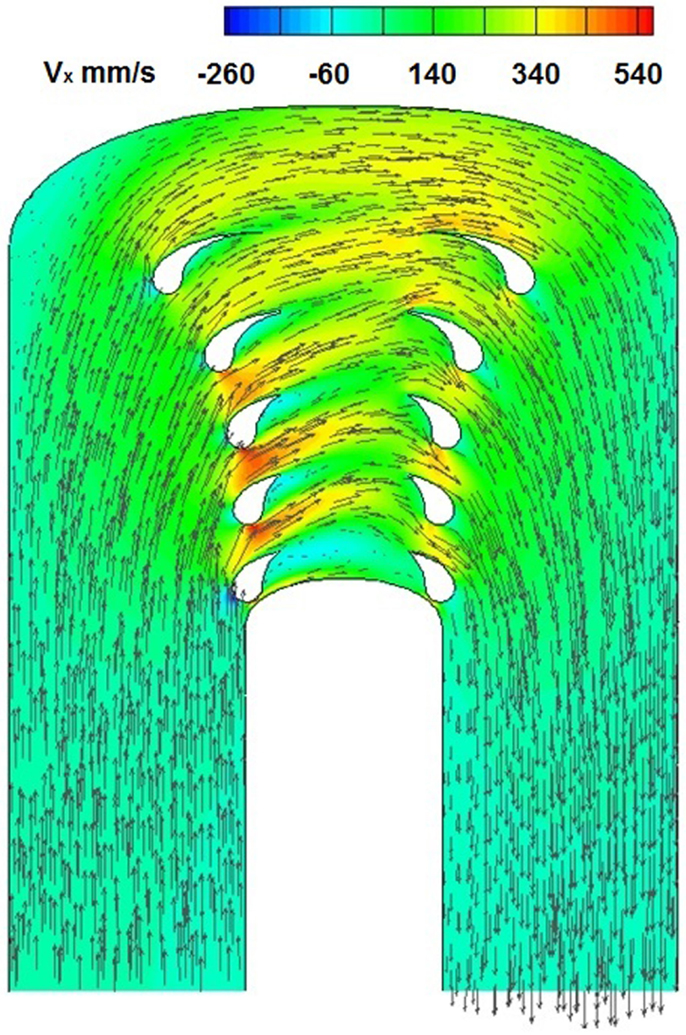
Figure 14. Horizontal component of velocity simulated in a geometry modified by insertion of internal vanes and rounding of the corners. Mass flow rate = 20 kg/s.
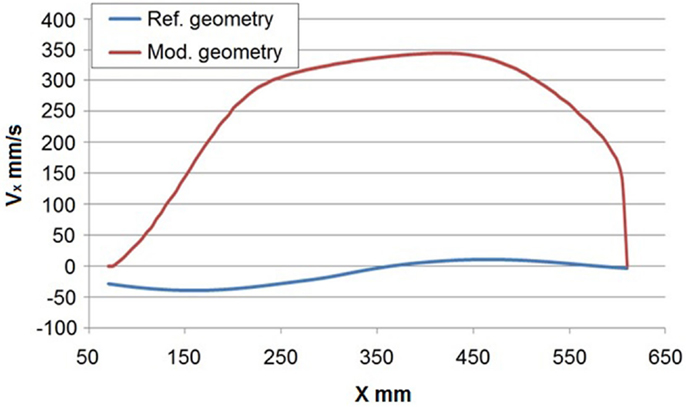
Figure 15. Comparison of simulated horizontal velocities near the interface at z= 430 mm between the reference facility geometry (lower blue line) and the modified geometry (upper red line) at W = 20 kg/s.
Optimization of the WST-Modified Geometry Applied to EFIT Project
In order to identify better solutions, a WST-modified geometry (for 2D–3D approximation) has been designed by means of an ad hoc algorithm implemented on a commercial CAD software. The geometrical features of the internal vanes and those of the target container are parameterized in terms of a limited number of input parameters whose range of variation is determined by preliminary simulations. The design space of the input parameters has been explored by generation of a sample of the population according to DOE methodology and successive refinement; over 1500 sample points have been generated for each number of guide vanes; three configurations of the WST geometry have been studied considering, respectively, 8, 6, and 4 internal guide vanes. Each point of the modified geometry has been simulated with the Fluent 6.3.26 code, considering nominal operating conditions of EFIT WST unit (Figure 16; Tables 1 and 2).
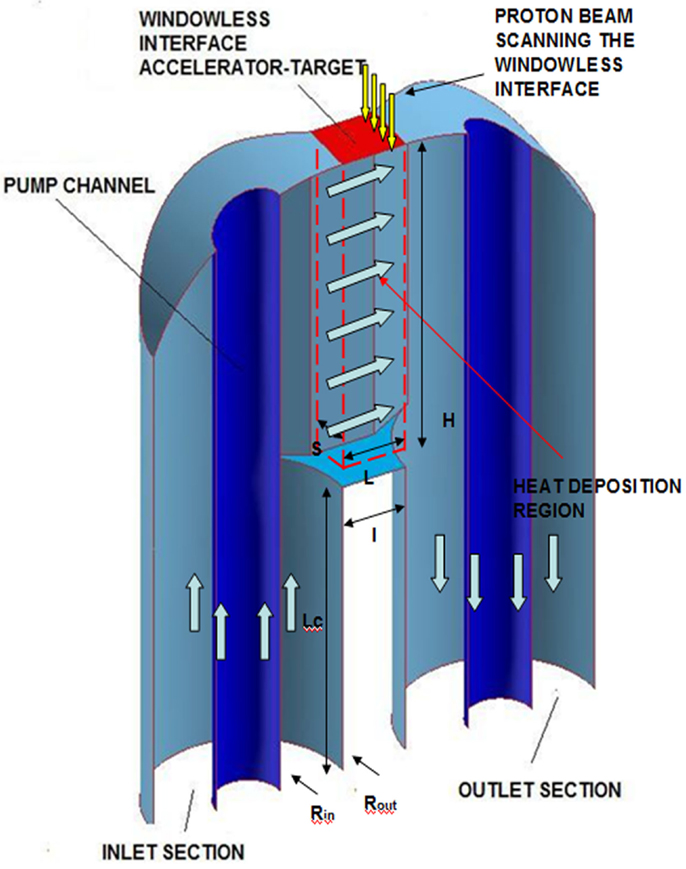
Figure 16. EFIT target unit (all dimensions in millimeter): H = 470, L = 100, S = 45, I = 140, Rin = 42, Rout = 152, Lc = 420.
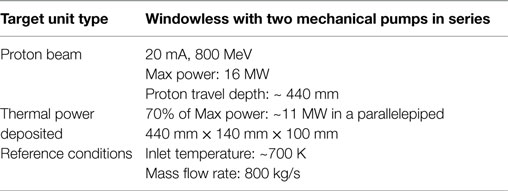
Table 1. Operating conditions and thermal source characteristics for EFIT TU (Mansani et al., 2012).
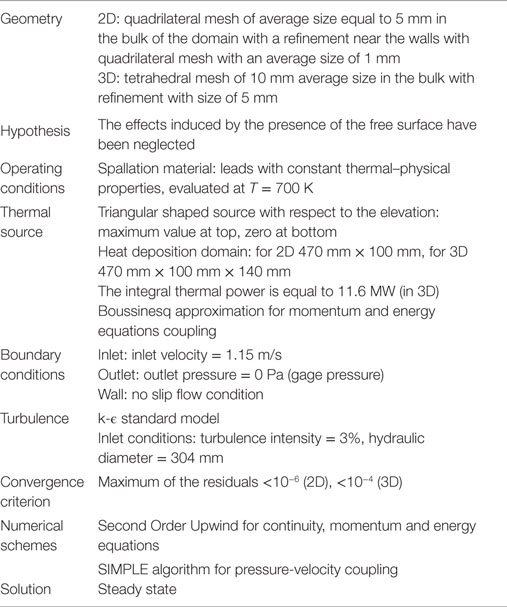
Table 2. Assumptions and boundary conditions in the numerical parametric study.
The thermal source has a characteristic trapezoidal profile with respect to the elevation, with higher values at higher height, as the Bragg peak at the operating 800 MeV proton beam energy is expected to be weak (Kumawat et al., 2008). In Table 1, the reference conditions and the main characteristics of the thermal source for the EFIT TU are reported.
Table 2 presents the boundary conditions and the main assumptions, which have been adopted in the CFD solver. The thermal source in the numerical study has been conservatively considered to have a triangular shape with an integral thermal power released into the heat deposition region (Figure 16) equal to 11.6 MW.
Output parameters (OP) have been defined to synthesize the physical information arising from the single CFD simulation. OP is user defined and can be local and/or integral quantities of interest of the turbulent flow and thermal fields in the thermal deposition region of the WST. Second order polynomial models, capable to predict the OP determinations in the design space of input parameters with a 15% of maximum relative error, have been adopted. One of the output parameter that can be chosen is the maximum temperature TMAX,H in the upper part of the exit section of the thermal deposition region, which is the most critical part of the WST (it extends from the free surface to about 5 cm below it). Another output parameter that can be considered is the pressure drop in the system. The performance objectives of the WST geometry design required the minimization of TMAX,H while keeping the pressure drop below the maximum allowable value of 20 kPa. The analytical models were used in the identification of a potential geometry that allows suitable flow conditions, expressed in terms of the given performance objectives within the thermal deposition region. Figure 17 shows the simulated temperature field, in 2D approximation of the flow for such an identified geometry in the case that eight internal guide vanes were adopted.
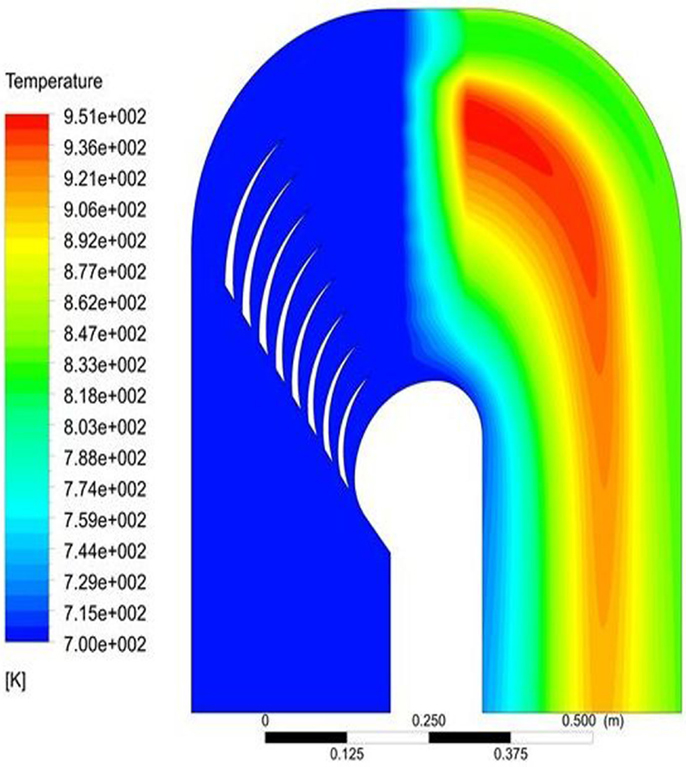
Figure 17. Temperature field in the modified 2D approximate geometry of the WST.
Figure 18 shows the effect of the 3D calculation on the temperature distribution in the mid-plane of the TU. The analysis of 2D vs. 3D simulations shows that 3D effects (pump channel, cylindrical geometry of the feed and return channels, restriction of the cross section area in the heat deposition region) are important but a 2D geometry approximation, which is computationally less expensive, is satisfactory.
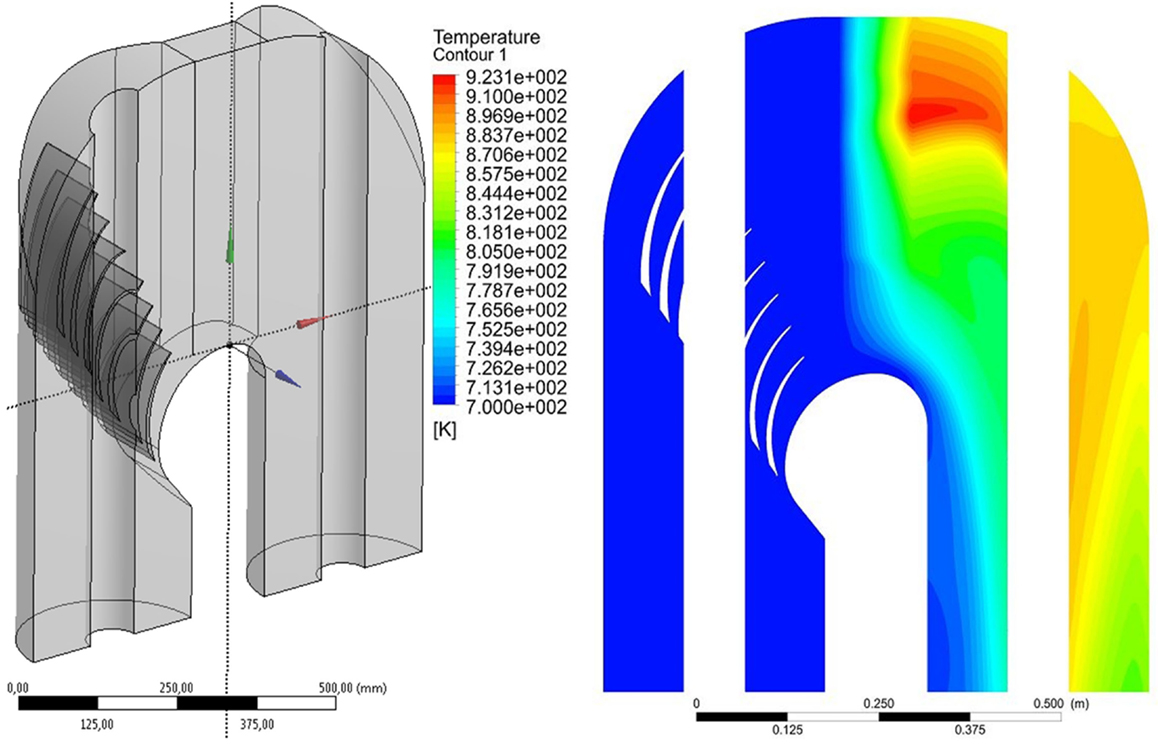
Figure 18. Temperature field in the mid-plane of the TU in the modified 3D geometry.
The 2D simulations results are conservative in terms of calculated TMAX,H, although with a little increase of pressure drop in the TU; this is true for all 3D simulated sample points. In a 2D approximation, the velocity field has been predicted, with the Table 2 assumptions, by investigating mainly the effect of the number of vanes on the velocity. In Figure 19, the horizontal component of the velocity evaluated at the symmetry section vs. the height is presented. The number of vanes, higher than 4, does not affect qualitatively the flow field and the calculated OP depend weakly on it. A benefit of using a lower number of vanes is that the pressure drop is lower for the same set of GIP parameters, but as a main drawback the control of the velocity profile by the insertion of a lower number of vanes is more difficult to be performed. In the case of 8 vanes and with heat generation, the turbulence Reynolds Stress Model has been adopted to investigate the effect of the turbulence models on the average velocity by comparison with k–ϵ model: there is a significant effect at lower heights, near the bottom wall (z < 100 mm), while at higher elevation, the curves shape and the numerical results are comparable. In Table 3, the calculated OP for the optimal configuration of geometrical input parameters is reported. The details of the algorithm that implements the DOE techniques and the RSM can be found in Ref. De Giorgi et al. (2011).
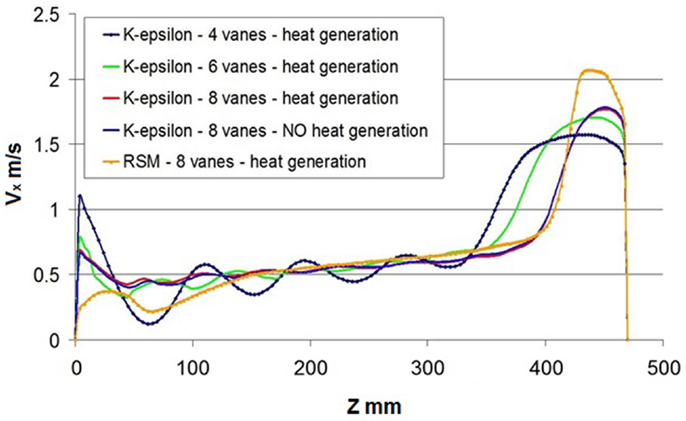
Figure 19. Horizontal velocity profiles at the symmetry section (x= 0 mm) vs. the height.
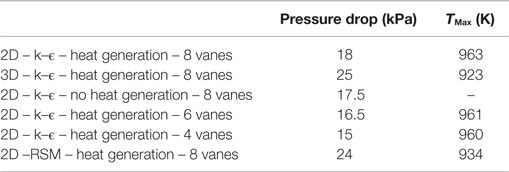
Table 3. Output parameters determinations for the optimal configuration of geometrical input parameters.
Conclusion
In the present paper, the results of experiments and CFD prediction on different test sections, which have been studied as possible solutions for the WST of an ADS, are presented. Both symmetrical and asymmetrical configurations have been investigated. The fluid dynamics of the symmetrical target shows the presence of a fluid stagnant region at the proton beam entrance, which suggests that a symmetrical configuration cannot be considered a suitable geometry for the windowless target design. The asymmetrical configuration fixes the problem of stagnant fluid in the spallation region, but the analysis of the flow field highlights that the required flow conditions inside the target, to efficiently remove the heat generated by spallation reactions, are not achieved. The presence of a recirculating region, where an important heat generation is expected, may potentially lead to boiling. Low velocities have been measured and simulated in proximity of the interface where velocities must be much higher since heat generation is higher at top of the target. So, experimental and numerical results suggest that the asymmetrical configuration is to be considered a promising geometry for a windowless target, but it should be carefully redesigned in order to face the investigated issues. The adopted solution has been to insert some guide vanes in the riser, upstream of the protons target, and the fluid dynamics into the EFIT TU equipped with guide vanes has been investigated. It has been shown that an effective heat removal of the power deposited by the proton beam is possible by means of proper shaping and positioning of the vanes into the TU. By means of an algorithm for the geometry generation, the issue of the fluid dynamics for a complex geometry has been addressed and the number and the position of the vanes have been changed in order to minimize the maximum temperature in the upper part of the exit section of thermal deposition region. The number of vanes can be lowered to a minimum value equal to four with a comparable performance, but, with less fine control of the velocity profile in the heat deposition region. The turbulence k–ϵ and Reynolds Stress models in such a complex geometry give results different but comparable. Preliminary experiments have been carried out with the same facility but with a test section (always scaled 1.1 to the real plant) similar to the one shown in Figure 18 equipped with guide vanes: the first results are encouraging.
Conflict of Interest Statement
The authors declare that the research was conducted in the absence of any commercial or financial relationships that could be construed as a potential conflict of interest.
References
Abanades, A., Sordo, F., Lafuente, A., and Marinez-Val, J. M. (2008). Thermal features of spallation window targets. Energy Convers. Manage. 49, 1934–1945. doi: 10.1016/j.enconman.2007.08.016
Aït Abderrahim, H., Baeten, P., De Bruyn, D., and Fernandez, R. (2012). MYRRHA – A multi-purpose fast spectrum research reactor. Energy Convers. Manag. 63, 4–10. doi:10.1016/j.enconman.2012.02.025
Bianchi, F., Artioli, C., Burn, K. W., Gherardi, G., Monti, S., Mansani, L., et al. (2005). “Status and trend of core design activities for heavy metal cooled accelerator driven system,” in Proceedings of the 12th International Conference on Emerging Nuclear Energy Systems (ICENES’2005); 2005 August 21-26. Brussels: CD-ROM.
Bianchi, F., Ferri, R., and Moreau, V. (2008). Thermo-hydraulic analysis of the windowless target system. Nucl. Eng. Des. 238, 2135–2145. doi:10.1016/j.nucengdes.2007.10.026
Cinotti, L., and Gherardi, G. (2002). The Pb-Bi cooled XADS status of development. J. Nucl. Mater. 301, 8–14. doi:10.1016/S0022-3115(01)00721-8
Cinotti, L., Giraud, B., and Ait Abderrahim, H. (2004). The experimental accelerator driven system (XADS) in the EURATOM 5th framework program. J. Nucl. Mater. 335, 148–155. doi:10.1016/j.jnucmat.2004.07.006
Cinotti, L., Saccardi, G., Traverso, M., Garbarini, M., Gherardi, G., Orden, A., et al.(2003). “XADS cooled by Pb-Bi system description,” in Proceedings of the International Workshop on P&T and ADS Development; 2003 October 6-8. Mol: SCK-CEN.
De Giorgi, L. C., De Salve, M., and Panella, B. (2011). “Thermal hydraulics in the ADS windowless target equipped with internal guide vanes,” in Proc. XXIX National Heat Transfer Conference (Torino: ETS Pisa), 359–365.
De Salve, M., Malandrone, M., and Panella, B. (2002). “Fluiddynamics in a windowless symmetrical target for accelerator driven hybrid nuclear reactors,” in Proceedings of the Twelfth International Heat Transfer Conference, Vol. 4; 2002 August 18-23. (Grenoble: Elsevier), 597–602.
Knebel, J., Aït Abderrahim, H., Cinotti, L., Mansani, L., Delage, F., Fazio, C., et al. (2006). EUROTRANS: European Research Programme for the Transmutation of High-level Nuclear Waste in Accelerator-driven System, 9th Information Exchange. Nimes.
Kumawat, H., Dutta, D., Mantha, V., Mohanty, A. K., Satyamurthy, P., Choudhury, R. K., et al. (2008). Heat deposition in thick targets due to interaction of high energy protons and thermal hydraulics analysis. Nucl. Instrum. Methods Phys. Res. 266, 604–612. doi:10.1016/j.nimb.2007.11.064
Mansani, L., Artioli, C., Schikorr, M., Rimpault, G., Angulo, C., and De Bruyn, D. (2012). The European Lead-cooled EFIT Plant: an industrial-scale accelerator-driven system for minor actinide transmutation. Nucl. Technol. 180, 241–263.
Morris, M. D., and Mitchell, T. J. (1995). Exploratory designs for computational experiments. J. Stat. Plan Inference 43, 381–402. doi:10.1016/0378-3758(94)00035-T
Petrazzini, M. (2008). Main components functional sizing of EFIT, Ansaldo EUROTRANS, 121 SMFX 007 Rev. 1, Work package 1.2, Id. No: D1.24.
Rubbia, C., Abderrahim, H. A., Björnberg, M., Carluec, B., Gherardi, G., and Romero, E. G. (2001). A European Roadmap for Developing Accelerator Driven Systems (ADS) for Nuclear Waste Incineration. Rome: ENEA.
Rubbia, C., Rubio, J. A., Buono, S., Carminati, F., Fieter, N., Galvez, J., et al. (1995). A Conceptual Design of a Fast Neutron Operated High Power Energy Amplifier. CERN/AT/95-44.
Sacks, J., Welch, W. J., Mitchell, T. J., and Wynn, H. P. (1989). Design and analysis of computer experiments. Stat. Sci. 4, 409–435. doi:10.1214/ss/1177012413
Salvatores, M. (2006). Fuel cycle strategies for the sustainable development of nuclear energy: the role of accelerator driven systems. Nucl. Instrum. Methods Phys. Res. 562, 578–584. doi:10.1016/j.nima.2006.02.013
Salvatores, M., Slessarev, I., Tchistiakov, A., and Ritter, G. (1997). The potential of accelerator driven systems for transmutation or power production using thorium or uranium fuel cycles. Nucl. Sci. Eng. 126, 333–340.
Santner, T., Williams, B., and Notz, W. (2003). The Design and Analysis of Computer Experiments. New York, NY: Springer.
Signal Processing, S. A. (2004). DOP 2000 Model 2125 User Manual. Switzerland: Signal Processing S.A.
Keywords: accelerator-driven system, proton beam target, windowless spallation target, fluid dynamics, thermal hydraulics
Citation: Panella B, De Giorgi LC, De Salve M, Bertani C and Malandrone M (2015) Thermal hydraulics of accelerator-driven system windowless targets. Front. Energy Res. 3:32. doi: 10.3389/fenrg.2015.00032
Received: 03 March 2015; Accepted: 15 June 2015;
Published: 08 July 2015
Edited by:
Muhammad Zubair, University of Engineering and Technology, PakistanReviewed by:
Yacine Addad, Khalifa University, UAEMaurizio Luigi Cumo, Sapienza University of Rome, Italy
Copyright: © 2015 Panella, De Giorgi, De Salve, Bertani and Malandrone. This is an open-access article distributed under the terms of the Creative Commons Attribution License (CC BY). The use, distribution or reproduction in other forums is permitted, provided the original author(s) or licensor are credited and that the original publication in this journal is cited, in accordance with accepted academic practice. No use, distribution or reproduction is permitted which does not comply with these terms.
*Correspondence: Bruno Panella, Department of Energy, Politecnico di Torino, Corso Duca degli Abruzzi 24, Torino 10129, Italy,YnJ1bm8ucGFuZWxsYUBwb2xpdG8uaXQ=