- 1Arizona State University, School for Engineering of Matter, Transport & Energy, Tempe, AZ, United States
- 2Phelan International LLC, Scottsdale, AZ, United States
The advent of global climate change and rising incomes, particularly in some developing countries such as Egypt, means that the use of air conditioning is poised for a dramatic increase over the next few decades. Although this anticipated increase appears inevitable, it is often associated with a negative connotation because of the increased energy demands and greenhouse gas emissions associated with expanded air conditioning use. Yet, the benefits of air conditioning are not often described in existing literature in conjunction with its associated negative externalities. For example, higher productivity in commercial buildings, and positive health benefits in all manner of buildings (residential, commercial, and industrial) could potentially offset the greater energy consumption and related disadvantages. A levelized cost of cooling (LCOC) analysis is presented to quantify under what circumstances building air conditioning provides benefits that exceed its costs, and vice versa. The LCOC is calculated for the application of air conditioning to a small office building located in either Phoenix, Arizona, United States, or in Cairo, Egypt. The electrical energy required for cooling is calculated with EnergyPlus software. The results indicate that the benefits of air conditioning far outweigh its disadvantages for the Phoenix location, largely because of the productivity benefits derived from maintaining the interior temperature at a comfortable setting. The results for Egypt are more nuanced, but still indicate the overall benefits of air conditioning in an office environment.
1 Introduction
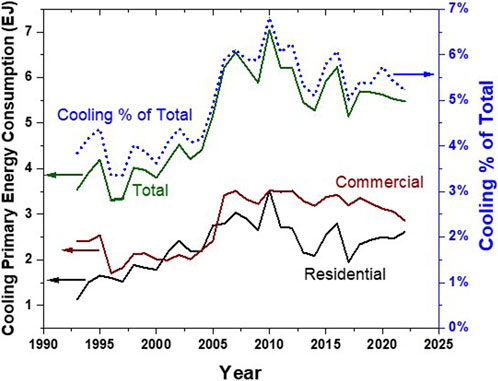
Air conditioning, i.e., the cooling of indoor air to maintain comfortable conditions, has become nearly ubiquitous around the world. Rising global temperatures (Change, 2024) indicate that the demand for air conditioning (AC) is not likely to decrease in the future, with especially large increases forecast for developing countries (India energy Outlook 2021 – analysis, 2024). In a developed nation like the United States, air-conditioning is the norm in most parts of the country for both residential and commercial buildings. A significant amount of energy in the United States is devoted to air conditioning, representing between 4% and 7% of the total annual primary energy consumption over the last 20 years (Figure 1). The annual data in Figure 1 were determined from the Annual Energy Outlook, with a one-year publication lag time for plotted annual values. Note that the values for commercial buildings include the energy required for both space cooling and for ventilation, while those for residential buildings are only for space cooling. The only discernible trend in the data appears to be a general increase around the year 2005, but it’s possible that this is due to a change in model assumptions around that time.
Air conditioning is largely provided by vapor-compression cycles that require electrical energy input. Because of the cost of electrical energy and the desire to reduce associated greenhouse gas (GHG) emissions, building owners may be inclined to increase the AC temperature setpoint during operating hours so as to reduce the amount of time the AC has to operate, or even to turn off the AC altogether. Although energy savings and GHG reductions will be realized, this may result in deleterious productivity and health impacts that may well offset any energy and GHG reductions. Here we therefore investigate the trade-offs between reduced AC usage resulting from higher thermostat setpoint temperatures and decreased productivity and health outcomes through calculating the Levelized Cost of Cooling (LCOC) for a small office building. The office building is situated in either Phoenix, Arizona, United States, or in Cairo, Egypt, in order to represent both developed and developing country situations. We make use of EnergyPlus software (EnergyPlus, 2024) to determine the annual electrical energy required for cooling, as well as the cooling energy delivered to the building. The results indicate that in the United States, it is far more advantageous to maintain a comfortable setpoint (75°F, or 23.9°C) rather than to increase the indoor temperature during the summer cooling season.
2 Approach
2.1 Levelized cost of cooling
The levelized cost of cooling (LCOC) was previously introduced as a means to compare the cost effectiveness of various cooling technologies, similar to how the levelized cost of energy (LCOE) is utilized to compare electricity-generating systems. One of the earliest reports of LCOC compared a variety of solar cooling technologies (Gabbrielli et al., 2016), and indeed this was the objective of a number of later studies [see, e.g., (Bellos and Tzivanidis, 2017), (Shirazi et al., 2018), (Altun and Kilic, 2020), (Mortadi and El Fadar, 2022), (Teles et al., 2023)]. Still others have employed the general concept of levelized costs to evaluate and compare polygeneration systems [see, e.g., (Leiva-Illanes et al., 2018), (Askari et al., 2019)), while others have evaluated district cooling (see, e.g., (Novosel et al., 2021)] and solar-assisted systems with thermal energy storage [see, e.g., (Jarimi et al., 2024)]. But, to our knowledge we have not seen an LCOC calculation that includes ancillary costs and benefits of air conditioning, such as productivity and health impacts (a benefit), GHG emissions (a cost), etc., in addition to the cost of energy (typically electricity) and the provided cooling. Therefore here we start with the definition of LCOC ($/kWhc) based on the definition of LCOE described by the Intergovernmental Panel on Climate Change (IPCC) (Krey, 2014):
where Ct is the cooling energy provided in year t (kWhc), n the lifetime of the cooling system (years), i the discount rate, Expensest the sum of all costs incurred by the cooling system in year t ($ or local currency), and Benefitst all the benefits incurred by the cooling system in year t ($ or local currency). Equation 1 can be solved for LCOC:
where the currency can be either US $ or a local currency. For the annual costs Expensest, here we consider the following:
where the initial capital cost is applied only during year 0, and the costs of energy, operations and maintenance (O&M), and the social cost of carbon (CO2 cost) are applied for all subsequent years
The social cost of carbon is defined as “the economic cost caused by an additional ton of carbon dioxide emissions or its equivalent” (Nordhaus, 2017). Since most jurisdictions do not have a carbon tax or other “real” cost associated with GHG emissions, here we employ the social cost of carbon as the CO2 cost, and take our initial value of $62/tonne CO2 as developed by the US federal government from (Notice of availability and request, 2024). In the results discussed below we also consider a higher value.
Finally we have the annual benefits of AC, Benefitst, which may be described as
where Productivity Gain ($) refers to increased economic output due to maintaining interior temperatures at comfortable conditions, and likewise Health Gain ($) refers to reduced health costs due to maintaining temperatures at comfortable conditions. As discussed later, since we found it difficult to quantify (i.e., monetize) health impacts due to interior temperatures we treat that qualitatively in this paper and instead focus on productivity impacts due to interior temperatures being higher than what are generally considered as comfortable conditions.
The role of ambient (i.e., exterior) temperatures on a society’s general level of productivity are well known (see (Heal and Park, 2015) for an interesting discussion), but our focus here is on the interior, or indoor temperature. Note that we are not addressing the effects of ventilation rates, which received a great deal of attention because of COVID-19 [see, e.g., (McLeod et al., 2022)], nor in general “green” buildings [see, e.g., (Cedeño-Laurent et al., 2024)], but instead just the interior temperature setpoint of a building’s AC system during the summer cooling season.
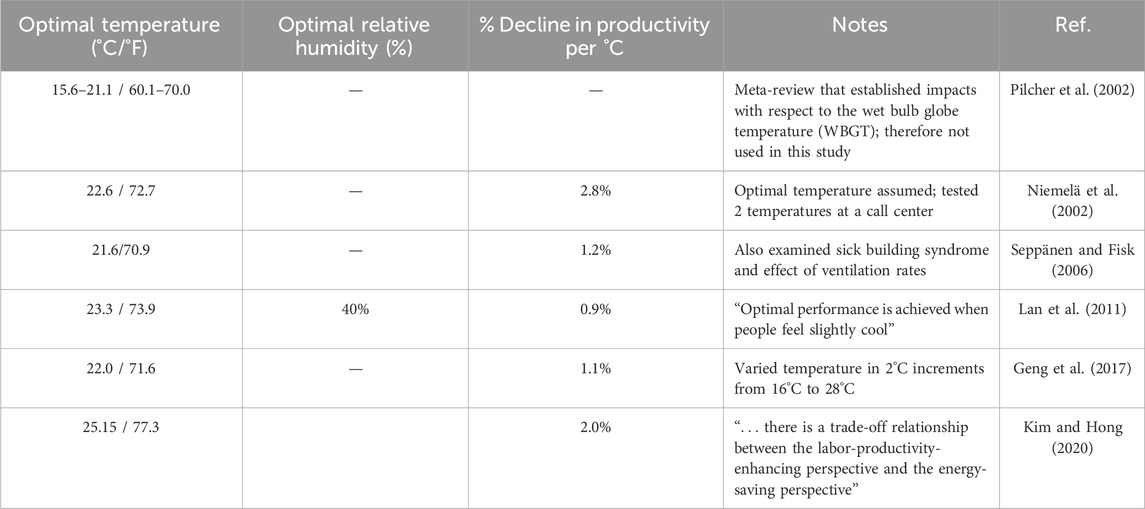
Table 1 provides a noncomprehensive summary of several studies that have examined how interior temperatures impact productivity, in an office setting. Most did not consider the effect of relative humidity, so here we choose to ignore that and instead focus on the dry-bulb temperature. Although there can be relatively large uncertainties in the data, and often the sample sizes are relatively small, as Table 1 indicates there is general agreement that as the temperature is increased above some optimum, typically 21–23°C (70–74°F) the measured productivity of the building occupants decreases at a rate as high as 2.8% per °C. Here, we choose to take the rate of productivity decrease as 1%/°C, and neglect any cultural or gender differences, noting how one study found that men are more productive at cooler temperatures, while women are more productive at warmer temperatures (Kawakubo et al., 2023).
Recognizing that most office buildings, at least in the United States, already have AC we consider here how the AC temperature setpoint affects productivity, and take as the maximum temperature setpoint Tmax 28.0°C (82.4°F), and reduce the AC temperature setpoint Tset by 0.56°C (1°F) down to the assumed optimal
where GDP/person is the gross domestic product per capita. Admittedly this is at best only a rough estimate of the productivity of the occupants inside the building, but it is a readily available number for countries around the world and thus enables easy inter-country comparisons. Finally, the Number of Occupants refers to the number of people occupying/working in the office building. For that we use the average number of occupants assumed by EnergyPlus in the building energy simulation, as described next.
2.2 Building energy simulation
We apply the above methodology to compute the LCOC for a small office building, for which we require the annual cooling energy delivered to the building by its AC system, Ct (kWhc/yr), and the annual electrical energy consumed by the AC system, Et (kWh/yr) on which both the annual energy cost ($/yr) and CO2 cost ($/yr) depend. Here we use EnergyPlus software (EnergyPlus, 2024) with the OpenStudio interface (OpenStudio, 2024) to compute both, and take the “small office building” from the list of commercial reference building models developed by the US Department of Energy (DOE) (Commercial reference buildings, 2024) to represent a typical office building. There are several versions of the small office building model to choose from, representing different building energy codes. Here we assume that the ASHRAE 90.1-2019 code (Update of Standard 90.1 ashrae.org, 2019) applies, indicating SEER = 14.0 for the AC system as described above. The average number of people in the building during working hours is given as 19.28 in the EnergyPlus building model, and so we apply that number in Equation 5 to compute the Productivity Gain. We assume the building is located in either Phoenix, Arizona, United States, or in Cairo, Egypt, and input the corresponding weather and design day files accordingly.
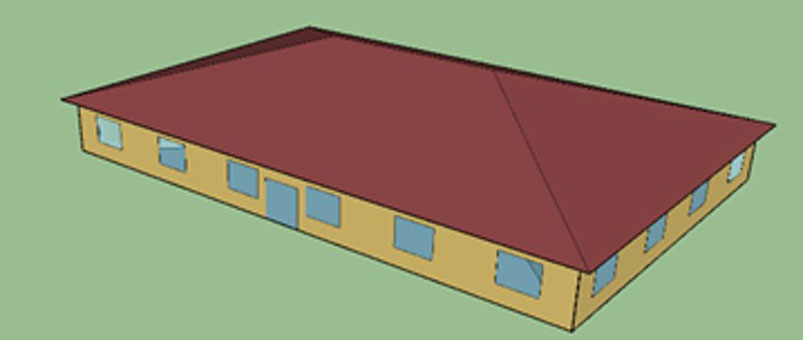
Figure 2 shows the small office building assumed in this analysis. It is a one-story building with a total area of 511 m2 (5,502 ft2), with a total of 5 cooling zones (the core and 5 perimeter zones). This is a wood-framed building with an attic roof, and a window-to-wall ratio of 21.2%. Interested readers are encouraged to consult (Commercial reference buildings, 2024) for all details regarding the building construction.
EnergyPlus readily calculates the annual electricity required for cooling, Et, and to calculate Ct we apply the definition of the SEER value:
which after appropriate unit conversions enables us to calculate Ct in kWhc/yr. EnergyPlus also determines the cooling capacity required for each zone, which we round up to standard sizes to calculate the installed AC cost.
The small office building shown in Figure 2 is assumed to have occupancy Monday–Friday such that the thermostat is maintained at the desired setpoint, Tset, from 6:00 a.m. to 6:00 PM. At all other times thermostat setback is assumed such that Tset = 29.44°C (85.0°F), including weekends.
3 Results and discussion
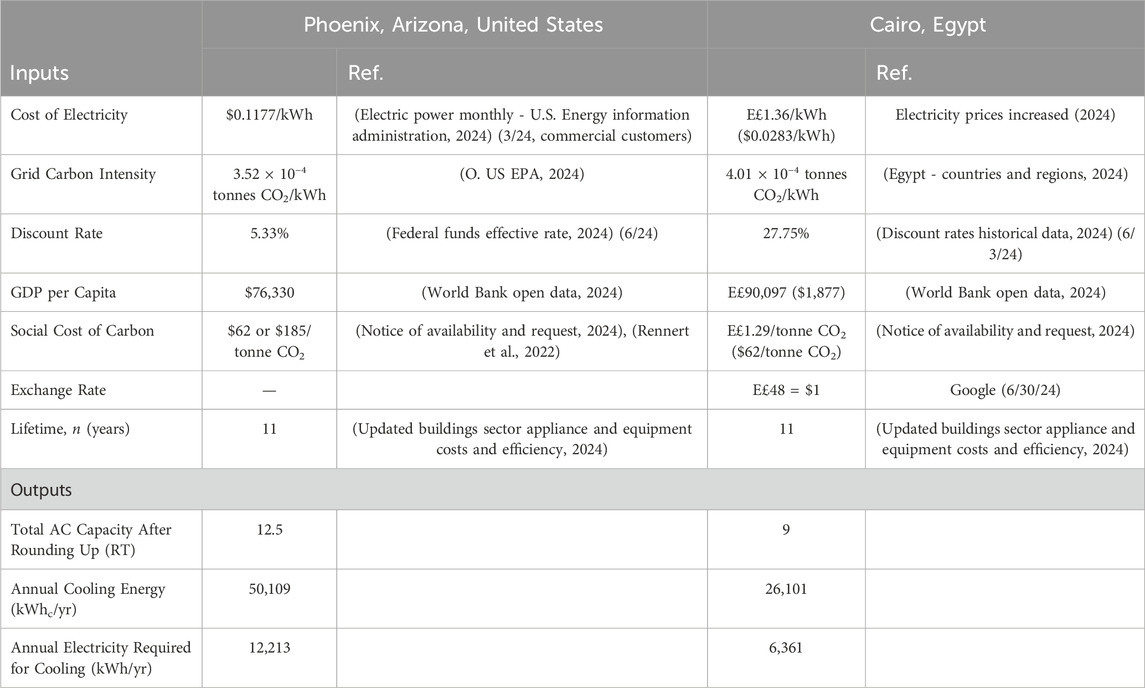
As discussed above, simulations were carried out for a small office building located in either Phoenix, Arizona, United States, or in Cairo, Egypt. Some key inputs and outputs from the simulations for both locations are presented in Table 2, where the outputs were computed in EnergyPlus/OpenStudio. Note that it is necessary to carry out the calculations in local currency because of the nonlinear nature of Equation 2.
3.1 LCOC for an office building in Phoenix, Arizona, United States
An example of the EnergyPlus/OpenStudio simulation is provided in Figure 3 for the small office building located in Phoenix, Arizona, United States. The temperature setpoint Tset was varied between 23.89°C and 28.00°C (75.0°F–82.4°F), in increments of 1°F (0.56°C), and the annual electricity required for cooling the building Et and the associated annual cooling energy delivered Ct were calculated for each setpoint. As expected, with increasing Tset both Et and Ct decreased, with the ratio between the two fixed by SEER = 14.0 (Equation 6).
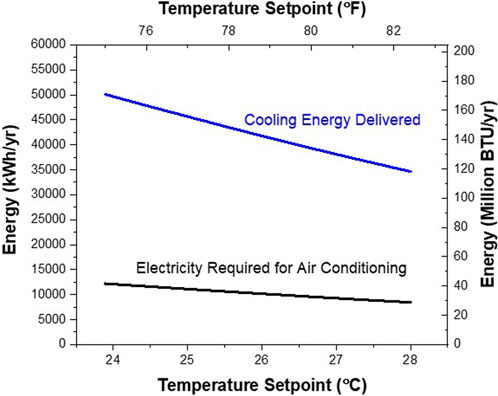
Figure 3. Annual electricity required for cooling, and cooling energy delivered, for a small office building in Phoenix, Arizona, United States
The levelized cost of cooling LCOC is presented in Figure 4 for the same building in Phoenix, Arizona, United States. Two curves for LCOC are presented: one for a social cost of carbon of $62/tonne CO2, and another much higher cost of $185/tonne CO2 as has been recently suggested (Rennert et al., 2022). Clearly, the social cost of carbon does not make much difference here, as those costs are overwhelmed by the increase in productivity predicted by Equation 5. For example, the net present value (NPV) of the total expenses (Equation 3) for Tset = 23.89°C (75.0°F) is $39,507, while the NPV of the total benefits Equation 4, with no health benefits taken into account) is $493,945! The expenses, by the way, include the purchase of the AC units. These results strongly suggest that any energy efficiency strategy which raises Tset above an optimal temperature is likely to lead to substantial productivity losses that will significantly outweigh any energy cost savings, even when the cost of CO2 is taken into account. Note that this finding holds true for an office environment (i.e., a commercial building) as has been reported elsewhere (Shi et al., 2024), but at this time we are not able to conclude if the same holds true for an industrial (i.e., manufacturing) environment. We therefore leave that analysis for future work.
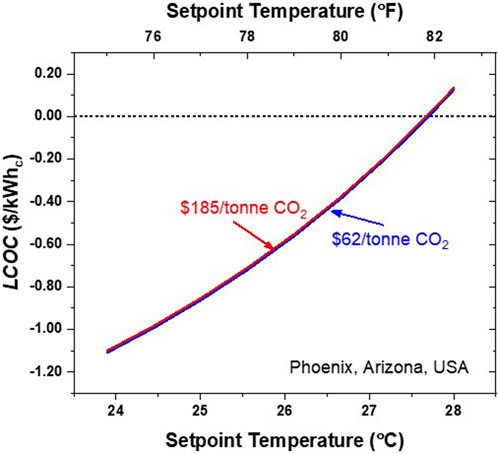
Figure 4. Levelized Cost of Cooling (LCOC) for a small office building in Phoenix, AZ as a function of temperature setpoint and the cost of carbon.
The negative values of LCOC for Tset < 27.7°C (81.9°F) indicate that the business is actually making money by keeping the temperature below 27.7°C, and losing money once Tset is increased above that point. This precise value of Tset, however, should be treated with caution since we arbitrarily assigned Tmax = 28.0°C (82.4°F) as the maximum temperature condition where zero productivity benefits would be realized. Still, the lesson appears to be clear: any increases in indoor temperature above the comfortable range should be treated with caution. Similarly, although it is not treated by our analysis, reducing Tset below the comfortable range will also have negative impacts on productivity, as will lack of consideration for gender, cultural, and other differences.
3.2 LCOC for an office building in Cairo, Egypt
It is clear from Figure 4 that productivity gains can be much larger than energy and CO2 costs, yet how much of that is because the GDP per capita in the United States is relatively large? We therefore conducted the same simulation, for the same building, but positioned in Cairo, Egypt. One of the key differences between the United States and Egypt, of course, is the per capita GDP ($76,330 in the United States vs. $1,877 in Egypt), as well as the cost of electricity ($0.1177/kWh in Arizona vs. E£1.36/kWh or $0.0283/kWh in Cairo) and the discount rate i (5.33% in the United States vs. 27.8% in Egypt). Note that the LCOC is not overly sensitive to i, since i appears in both the numerator and the denominator (Equation 2). But, in general as i increases the LCOC increases, albeit to a much greater extent in Egypt compared to the United States. For example, increasing i from 5.33% to 8.0% in the United States increased LCOC by less than 1%, whereas increasing i from 27.75% to 30.0% in Egypt increased LCOC by 8%.
Figure 5 shows two curves for the LCOC in Egypt: one in which the initial capital cost of the AC system is included, and the other where that initial capital cost is not included. We did this because the initial capital cost represents a large fraction of the NPV of the expenses, but it must be noted that we assumed the same AC capital cost in Egypt as we did for the United States. For Tset = 23.89°C (75.0°F), including those initial capital costs leads to expenses NPV = E£880,366, but neglecting those initial capital costs yields expenses NPV = E£115,726. Similar to the results in Figure 4 for Phoenix, Arizona, United States, the impact we’re trying to observe is the net benefits/costs of maintaining the indoor temperature at a comfortable level. If the AC system is already in place then the initial AC costs are not relevant anyway, only the energy, O&M, and CO2 costs. The lower curve in Figure 5 (where initial costs are neglected) suggests the break-even point in LCOC occurs around Tset = 26.2°C (79.2°F), but again this precise value is relatively uncertain. What appears to be certain is that, just like the building in the United States, it is advantageous to maintain a comfortable temperature inside an office building in Egypt, regardless of the expense of operating the AC. We reach this conclusion even without explicitly considering the detrimental health impacts of elevated temperatures, as discussed next.
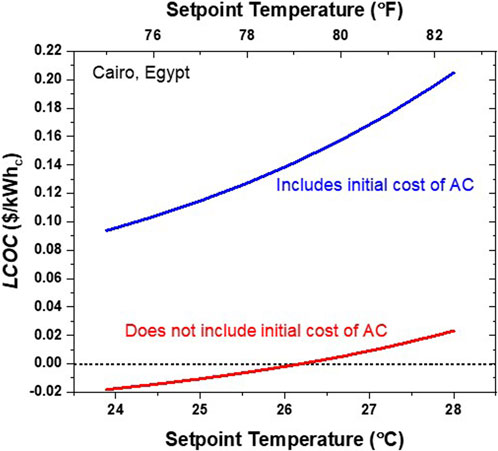
Figure 5. Levelized Cost of Cooling (LCOC) for a small office building in Cairo, Egypt, for a cost of carbon of $62/tonne.
3.3 Impact of elevated temperatures on health
Understanding the impact of high temperatures in outdoor and indoor environments is gaining attention from different scientific lenses such as healthcare, engineering, and environmental sciences. The rising concern of its impact is undeniable as recent severe temperature changes are manifested in life-changing experiences that present an unprecedented financial and economic burden both at the individual level and society at large. One may expect that these temperature changes and their associated costs will only increase in the future unless effective interventions are adopted.
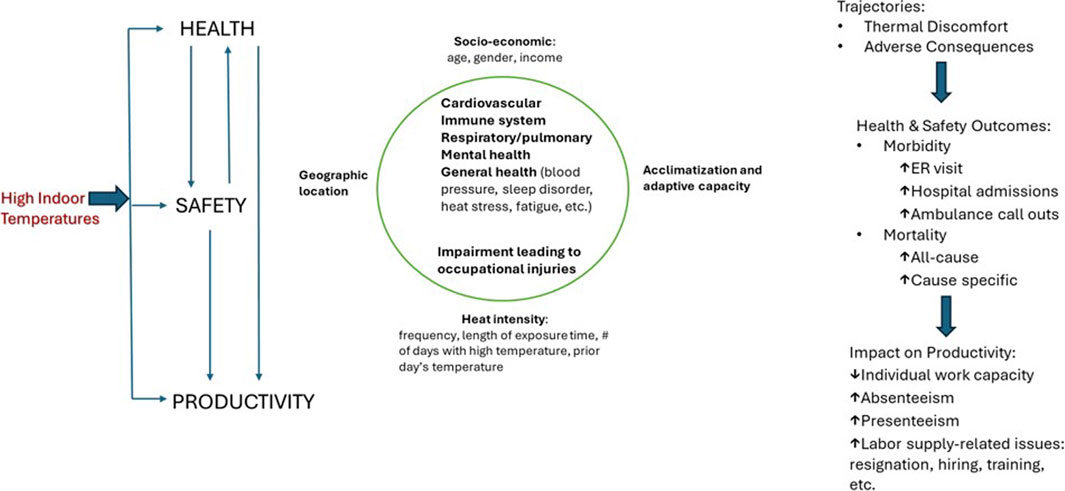
As shown in Figure 6, there are three pathways to examine high temperatures impact: through health, occupational safety, and productivity (Morrissey et al., 2021). While these three pathways are interconnected, the intensity and trajectory of the overall impact, however, may differ depending on other confounding factors present (Vaidyanathan et al., 2024). These factors include the socio-economic characteristics of the individual, heat intensity, geographic location, acclimatization, and adaptive capacity, the latter being dependent heavily on availability of adaptation strategies such as adequate cooling infrastructure.
A review of findings from studies using meta-analysis of existing literature [e.g., (De Sario et al., 2023), (Wondmagegn et al., 2019)] suggest that health impact of high heat is manifested through the strain on either an individual’s physical, physiological, psychological (mental health), or overall general health. The direct healthcare cost includes medical treatment, excess emergency department visits, excess hospital admissions, increased ambulance call outs, and mortality. In addition, when an individual experiences cognitive impairment, occupational safety is compromised. It could potentially lead to injuries, which could be monetized by increased occupational injury claims. Health deterioration and occupational injuries consequently result in a marginal cost in productivity changes through increased absenteeism, presenteeism, and potential labor supply-related issues due to heat-related workforce reductions.
Whether the topic of interest is specific to indoor or outdoor environment, according to a report published by the World Health Organization, “outside of regions where air conditioning is common, high indoor temperatures are associated with high outdoor temperatures. Studies of morbidity and mortality rates during periods of high outdoor temperatures can also be used to provide indirect evidence of the harmful health effects of high indoor temperatures in such regions” (WHO Housing and health guidelines, 2024).
Although not specifically measured for high indoor temperatures, a study by Yang estimated that for every 1°C increase above 29°C leads to about 3% more adult hospitalization (Yang et al., 2021). In the case of British Columbia, it was estimated that 30% of heat-stress claims in 2021 (when a heat wave was experienced) were primarily from workers who worked indoors compared to only 20% of indoor industry claims on average in 2020 (The case for adapting to extreme heat: costs of the 2021 BC heat wave, 2024).
These estimates only imply that the combined cost of high temperatures is substantial and not to be ignored. Studies isolating the high heat-specific cause impact in indoor work environments remain sparse. Extensive occupational research and monetization of the impact of high indoor temperatures, particularly in an office setting, is warranted. Most importantly, comparative studies that show variations in cost by controlling various confounding factors would be helpful in identifying and adopting appropriate mitigating strategies.
4 Conclusion
Air conditioning (AC) has benefits beyond simply human thermal comfort. Based upon previous literature, the impact of maintaining optimal dry-bulb temperature conditions (∼75°F or 23.9°C) is profound, resulting in ∼1% reduction in productivity for every 1°C increase above this optimum. Therefore, the impulse to increase thermostat setpoints above the optimum to reduce energy consumption and costs is misplaced. A levelized cost of cooling (LCOC) analysis for an office building in Phoenix, Arizona, suggests that in the United States, reductions in productivity far outweigh any cost savings from increased air conditioning energy consumption as the AC setpoint is increased, even when the social costs of CO2 are taken into account. A similar analysis of the same office building in Cairo, Egypt presents the same trend, although the lower electricity cost and lower economic output per worker there relative to the United States reduces the impact. Future analysis will also include the impact of AC setpoint temperatures on health, which will only exacerbate the trends observed here. It is clear that establishing and maintaining optimal comfort conditions inside commercial buildings, whether through air conditioning, improved building design and construction, or a combination of both, has to be a priority for economic output even at the expense of additional energy consumption and associated greenhouse gas emissions.
Data availability statement
The original contributions presented in the study are included in the article/supplementary material, further inquiries can be directed to the corresponding author.
Author contributions
PP: Conceptualization, Formal Analysis, Methodology, Supervision, Writing–original draft, Writing–review and editing. BP: Conceptualization, Methodology, Writing–original draft, Writing–review and editing. AS: Formal Analysis, Writing–review and editing.
Funding
The author(s) declare that no financial support was received for the research, authorship, and/or publication of this article.
Acknowledgments
This work was inspired by ongoing energy efficiency projects funded at the Arizona State University Energy Efficiency Center (https://eec.asu.edu/) by the US Department of Energy, Industrial Training and Assessment Center, and by the US Department of Agriculture, Rural Energy for America Program.
Conflict of interest
Author BP was employed by Phelan International LLC.
The remaining authors declare that the research was conducted in the absence of any commercial or financial relationships that could be construed as a potential conflict of interest.
Publisher’s note
All claims expressed in this article are solely those of the authors and do not necessarily represent those of their affiliated organizations, or those of the publisher, the editors and the reviewers. Any product that may be evaluated in this article, or claim that may be made by its manufacturer, is not guaranteed or endorsed by the publisher.
References
Update of Standard 90.1 ashrae.org (2019) (Accessed: July. 04, 2024. Available at: https://www.ashrae.org/news/hvacrindustry/2019-update-of-standard-90-1
Altun, A. F., and Kilic, M. (2020). Economic feasibility analysis with the parametric dynamic simulation of a single effect solar absorption cooling system for various climatic regions in Turkey. Renew. Energy 152, 75–93. doi:10.1016/j.renene.2020.01.055
Askari, I. B., Calise, F., and Vicidomini, M. (2019). Design and comparative techno-economic analysis of two solar polygeneration systems applied for electricity, cooling and fresh water production. Energies 12, 4401. doi:10.3390/en12224401
Bellos, E., and Tzivanidis, C. (2017). Energetic and financial analysis of solar cooling systems with single effect absorption chiller in various climates. Appl. Therm. Eng. 126, 809–821. doi:10.1016/j.applthermaleng.2017.08.005
Cedeño-Laurent, J. G., Williams, A., MacNaughton, P., Cao, X., Eitland, E., Spengler, J., et al. (2024). Building evidence for health: green buildings, current science, and future challenges. Annu. Rev. Public Health 39 (1), 291–308. doi:10.1146/annurev-publhealth-031816-044420
Change, N. G. C. (2024). Global surface temperature | NASA global climate change. Clim. Change Vital Signs Planet. Available at: https://climate.nasa.gov/vital-signs/global-temperature?intent=121 (Accessed: July 01, 2024).
Commercial reference buildings (2024). Energy. Gov. (Accessed: March. 13, 2020. Available at: https://www.energy.gov/eere/buildings/commercial-reference-buildings
De Sario, M., de'Donato, F. K., Bonafede, M., Marinaccio, A., Levi, M., Ariani, F., et al. (2023). Occupational heat stress, heat-related effects and the related social and economic loss: a scoping literature review. Front. Public Health 11, 1173553. doi:10.3389/fpubh.2023.1173553
Discount rates historical data (2024). Accessed: July. 05, 2024. Available at: https://www.cbe.org.eg/en/economic-research/statistics/discount-rates/historical-data
Egypt - countries and regions (2024). Paris, France: IEA. Accessed: July. 05, 2024. Available at: https://www.iea.org/countries/egypt
Electric power monthly - U.S. Energy information administration (EIA) (2024). Accessed: July. 04, 2024. Available at: https://www.eia.gov/electricity/monthly/epm_table_grapher.php
Electricity prices increased (2024). Accessed: July. 04, 2024. Available at: https://www.egypttoday.com/Article/3/129547/Electricity-prices-increased-effective-Jan-1-2024
EnergyPlus (2024). (Accessed: July 01, 2024. Available at: https://energyplus.net/
Federal funds effective rate (2024). (Accessed: July. 05, 2024. Available at: https://fred.stlouisfed.org/series/FEDFUNDS
Gabbrielli, R., Castrataro, P., and Del Medico, F. (2016). Performance and economic comparison of solar cooling configurations. Energy Procedia 91, 759–766. doi:10.1016/j.egypro.2016.06.241
Geng, Y., Ji, W., Lin, B., and Zhu, Y. (2017). The impact of thermal environment on occupant IEQ perception and productivity. Build. Environ. 121, 158–167. doi:10.1016/j.buildenv.2017.05.022
Heal, G., and Park, J. (2015). Goldilocks economies? Temperature stress and the direct impacts of climate change. Paris, France: National Bureau of Economic Research 21119. doi:10.3386/w21119
India energy Outlook 2021 – analysis (2024). IEA Accessed: July. 01, 2024. Available at: https://www.iea.org/reports/india-energy-outlook-2021
Jarimi, H., Zheng, T., Zhang, Y., Razak, T. R., Ahmad, E. Z., Wan Roshdan, W. N. A., et al. (2024). Solar photovoltaic-assisted DC vapour compression with a low-cost ice gel thermal battery for off-grid building cooling. J. Build. Eng. 91, 109350. doi:10.1016/j.jobe.2024.109350
Kawakubo, S., Sugiuchi, M., and Arata, S. (2023). Office thermal environment that maximizes workers’ thermal comfort and productivity. Build. Environ. 233, 110092. doi:10.1016/j.buildenv.2023.110092
Kim, H., and Hong, T. (2020). Determining the optimal set-point temperature considering both labor productivity and energy saving in an office building. Appl. Energy 276, 115429. doi:10.1016/j.apenergy.2020.115429
Krey, V. (2014). Annex II: metrics and methodology. United Kingdom and New York: Intergovernmental Panel on Climate Change. Available at: https://www.ipcc.ch/site/assets/uploads/2018/02/ipcc_wg3_ar5_annex-ii.pdf (Accessed: July 02, 2024).
Lan, L., Wargocki, P., and Lian, Z. (2011). Quantitative measurement of productivity loss due to thermal discomfort. Energy Build. 43 (5), 1057–1062. doi:10.1016/j.enbuild.2010.09.001
Leiva-Illanes, R., Escobar, R., Cardemil, J. M., and Alarcón-Padilla, D.-C. (2018). Comparison of the levelized cost and thermoeconomic methodologies – cost allocation in a solar polygeneration plant to produce power, desalted water, cooling and process heat. Energy Convers. Manag. 168, 215–229. doi:10.1016/j.enconman.2018.04.107
McLeod, R. S., Hopfe, C. J., Bodenschatz, E., Moriske, H., Pöschl, U., Salthammer, T., et al. (2022). A multi-layered strategy for COVID-19 infection prophylaxis in schools: a review of the evidence for masks, distancing, and ventilation. Indoor Air 32 (10), e13142. doi:10.1111/ina.13142
Morrissey, M. C., Brewer, G. J., Williams, W. J., Quinn, T., and Casa, D. J. (2021). Impact of occupational heat stress on worker productivity and economic cost. Am. J. Industrial Med. 64 (12), 981–988. doi:10.1002/ajim.23297
Mortadi, M., and El Fadar, A. (2022). Performance, economic and environmental assessment of solar cooling systems under various climates. Energy Convers. Manag. 252, 114993. doi:10.1016/j.enconman.2021.114993
Niemelä, R., Hannula, M., Rautio, S., Reijula, K., and Railio, J. (2002). The effect of air temperature on labour productivity in call centres—a case study. Energy Build. 34 (8), 759–764. doi:10.1016/S0378-7788(02)00094-4
Nordhaus, W. D. (2017). Revisiting the social cost of carbon. Proc. Natl. Acad. Sci. 114 (7), 1518–1523. doi:10.1073/pnas.1609244114
Notice of availability and request for comment on ‘technical support document: social cost of carbon, methane, and nitrous oxide interim estimates under executive order 13990 (2024). Fed. Regist. Accessed: July. 03, 2024. Available at: https://www.federalregister.gov/documents/2021/05/07/2021-09679/notice-of-availability-and-request-for-comment-on-technical-support-document-social-cost-of-carbon
Novosel, T., Grozdek, M., Domac, J., and Duic, N. (2021). Spatial assessment of cooling demand and district cooling potential utilizing public data. Sustain. Cities Soc. 75, 103409. doi:10.1016/j.scs.2021.103409
OpenStudio (2024). Accessed: July. 04, 2024. Available at: https://openstudio.net/
O. US EPA, (2024). “Power profiler.” Accessed: July. 05, 2024. Available at: https://www.epa.gov/egrid/power-profiler
Pilcher, J. J., Nadler, E., and Busch, C. (2002). Effects of hot and cold temperature exposure on performance: a meta-analytic review. Ergonomics 45 (10), 682–698. doi:10.1080/00140130210158419
Rennert, K., Errickson, F., Prest, B. C., Rennels, L., Newell, R. G., Pizer, W., et al. (2022). Comprehensive evidence implies a higher social cost of CO2. Nature 610 (7933), 687–692. doi:10.1038/s41586-022-05224-9
Seppänen, O. A., and Fisk, W. (2006). Some quantitative relations between indoor environmental quality and work performance or health. HVAC&R Res. 12 (4), 957–973. doi:10.1080/10789669.2006.10391446
Shi, Y., Lyu, J., Miao, J., Lian, Z., and Lan, L. (2024). Energy saving first or productivity first? — Maximize the economic benefits of urban office buildings. Energy Build. 320, 114629. doi:10.1016/j.enbuild.2024.114629
Shirazi, A., Taylor, R. A., Morrison, G. L., and White, S. D. (2018). Solar-powered absorption chillers: a comprehensive and critical review. Energy Convers. Manag. 171, 59–81. doi:10.1016/j.enconman.2018.05.091
The case for adapting to extreme heat: costs of the 2021 BC heat wave,(2024). Retooling Clim. Change. Accessed: July. 25, 2024. Available at: https://retooling.ca/resources/the-case-for-adapting-to-extreme-heat-costs-of-the-2021-bc-heat-wave/
Teles, M. P. R., Sadi, M., Ismail, K. A. R., Arabkoohsar, A., Silva, B. V. F., Kargarsharifabad, H., et al. (2023). Cooling supply with a new type of evacuated solar collectors: a techno-economic optimization and analysis. Environ. Sci. Pollut. Res. 31 (12), 18171–18187. doi:10.1007/s11356-023-25715-0
Updated buildings sector appliance and equipment costs and efficiency (2024). (Accessed: July. 03, 2024. Available at: https://www.eia.gov/analysis/studies/buildings/equipcosts/
Vaidyanathan, A., Gates, A., Brown, C., Prezzato, E., and Bernstein, A. (2024). Heat-related emergency department visits - United States, may-september 2023. MMWR Morb. Mortal. Wkly. Rep. 73 (15), 324–329. doi:10.15585/mmwr.mm7315a1
WHO Housing and health guidelines (2024). (Accessed: July 25, 2024. Available at: https://www.who.int/publications/i/item/9789241550376
Wondmagegn, B. Y., Xiang, J., Williams, S., Pisaniello, D., and Bi, P. (2019). What do we know about the healthcare costs of extreme heat exposure? A comprehensive literature review. Sci. Total Environ. 657, 608–618. doi:10.1016/j.scitotenv.2018.11.479
World Bank open data (2024). Accessed: July. 05, 2024. Available at: https://data.worldbank.org
Yang, Z., Yang, B., Liu, P., Zhang, Y., and Yuan, X.-C. (2021). Impact of temperature on physical and mental health: evidence from China. Weather, Clim. Soc. 13 (4), 709–727. doi:10.1175/WCAS-D-21-0038.1
Nomenclature
Benefitst Annual benefits derived from air conditioning in year t ($)
Ct Cooling energy provided in year t (kWhc)
Expensest Annual costs derived from air conditioning in year t ($)
i Discount rate (%)
LCOC Levelized cost of cooling ($/kWhc)
n Air conditioning equipment lifetime (years)
NPV Net Present Value ($)
SEER Seasonable Energy Efficiency Ratio (BTU Wh-1)
t Year
Tset Air conditioning dry-bulb temperature setpoint (°C)
Tmax Maximum air conditioning dry-bulb temperature setpoint (°C)
Keywords: cooling, buildings, productivity, health, heat, levelized cost of cooling
Citation: Phelan PE, Phelan BE and Sharma A (2024) The value of air conditioning. Front. Energy Effic. 2:1471628. doi: 10.3389/fenef.2024.1471628
Received: 28 July 2024; Accepted: 09 December 2024;
Published: 23 December 2024.
Edited by:
Tomasz Cholewa, Lublin University of Technology, PolandReviewed by:
Hasim Altan, Prince Mohammad bin Fahd University, Saudi ArabiaCaterina Brandoni, Ulster University, United Kingdom
Copyright © 2024 Phelan, Phelan and Sharma. This is an open-access article distributed under the terms of the Creative Commons Attribution License (CC BY). The use, distribution or reproduction in other forums is permitted, provided the original author(s) and the copyright owner(s) are credited and that the original publication in this journal is cited, in accordance with accepted academic practice. No use, distribution or reproduction is permitted which does not comply with these terms.
*Correspondence: P. E. Phelan, cGhlbGFuQGFzdS5lZHU=
 P. E. Phelan
 B. E. Phelan
 A. Sharma