- 1Electrical and Information Engineering Department, Covenant University, Ota, Nigeria
- 2Electrical and Electronics Engineering Science Department, University of Johannesburg, Johannesburg, South Africa
- 3Transmission Company of Nigeria, Abuja, Nigeria
Power quality is a global concern, particularly as electronic devices are increasingly supporting modern economies. This research evaluates and proposes improvements for power quality of the distribution network at Covenant University, Ota, Nigeria, where electrical equipment usage contributes to power quality challenges. Measurements and evaluations were carried out in three stages: first, measuring power quality at five campus powerhouses using a Circutor aR6 power analyzer; second, assessing these measurements with Power Vision software; third, simulating the evaluated network with NEPLAN software. The study was conducted during an active school session, with measurements taken at 500 kVA, 11 kV/415 V/230 V on the outgoing circuits for each transformer. The results were benchmarked against IEEE power quality standards and identified issues such as harmonics, total harmonic distortion (THD), overload, and a lagging power factor. The proposed improvements, derived from NEPLAN simulation, included active harmonic filters to reduce harmonics, a shunt capacitor for power factor correction, and load sharing for managing transformer overloads. Simulation results demonstrated that THD was significantly reduced across all powerhouses: CDS from 7.28% to 0.91%, EIE from 10.52% to 3.54%, CST from 16.03% to 0.58%, the Library from 11.92% to 0.12%, and the Male Hostel from 16.71% to 0.24%. These adjustments enhanced THD within specified limits. Additionally, the shunt capacitor increased the power factor to 0.96 from −0.96. These enhancements are expected to extend equipment life, reduce heat loss, and lower utility costs.
Introduction
Power quality has various definitions based on the differing perspectives of utilities, load aspects, the Institute of Electrical and Electronics Engineers (IEEE), end-users, and the International Electrotechnical Commission (IEC). According to the IEEE glossary, power quality is defined as “…the concept of powering and grounding sensitive equipment in a manner that is appropriate to the operation of the equipment” (Ogheneovo Johnson and Hassan, 2016; Liao et al., 2015; Kim et al., 2018). Another definition of power quality describes it as the ability of a machine to operate effectively when subjected to load. With advances in technology, machines and equipment have become highly sensitive due to the incorporation of artificial intelligence (AI) in applications such as medical labs, robotics, automated systems, communication devices, and laboratory equipment (Somefun et al., 2022; Alaba et al., 2020; Adetiba et al., 2017; Onaolapo et al., 2019; Adetiba et al., 2022). These systems may not function as expected if the required power quality is unstable (Yeotikar and Mohod, 2016).
Power quality issues encompass a wide range of problems such as voltage impulses, electrical surges, spikes, transients, harmonic distortion, frequency variations, unwanted frequencies, waveform variations, power losses, load imbalances, electromagnetic interference, improper grounding, and the presence of inductance and capacitance in electrical networks (Samudre, 2016). Over the years, power quality has been a significant concern for utility companies and commercial and industrial customers as electronic equipment is now the backbone of modern economies (Jamal and Salehin, 2021). Poor power quality in an electrical system can lead to overheating, malfunction, premature failure, and increased maintenance costs for electrical and mechanical equipment. Therefore, it is crucial to identify which equipment or devices are causing power quality issues as many of these problems originate from devices within buildings (Abozaed and Elrajoubi, 2014).
Power quality directly affects electricity consumption and demand. Poor power quality increases the load current in an electrical network, whereas good power quality stabilizes the load or equipment within its rated current. Techniques such as fast Fourier transform (FFT) and short-time Fourier transform (STFT) are generally used to detect different categories of power quality issues encountered in power systems. Advanced techniques like the S-transform and wavelet transform are the current methods used to identify power quality problems (Ogunjuyigbe et al., 2017). Power quality issues cause interruptions that are increasingly common and impact utility, commercial, and industrial processes. The energy efficiency of the distribution network directly affects the performance and output of equipment or machines. At Covenant University in Ota, Nigeria, the increased use of electronic equipment has significantly affected power quality. Power quality issues in any power system are generally unpredictable, and their effects can vary greatly in different parts of the same system due to varying frequency impacts. Electronic equipment tends to introduce high harmonic levels into the power network, which can negatively affect transformers and generators that supply other loads within the same microgrid.
The major victims of power quality issues are utilities and residential customers, who often bear the cost of replacing damaged equipment. Improving power quality within a distribution network enhances the overall reliability of the system. For example, Thajeel et al. (2016) addressed the total harmonic distortion (THD) problem by comparing a traditional PI controller with an adaptive zero-crossing detection method for a three-phase, six-switch voltage source inverter-based active power filter. They showed that the source-current’s THD percentage could be reduced within a few cycles to below 5%, meeting the IEEE-519 standard. Their results also indicated that the DC connection with AZCD exhibits better dynamic behavior than the traditional PI control strategy. In contrast, Samudre (2016) addressed voltage sags, swells, short-term interruptions, and harmonics by proposing a unified power quality controller (UPQC) to provide a cost-effective, multifunctional, and reliable solution for total power quality control in industrial and commercial applications.
UPQC can compensate for various voltage disturbances, avoid load current harmonics, and correct voltage fluctuations from affecting the power system. It is also designed to reduce disturbances that impact critical and sensitive loads. UPQC is suitable for voltage-sensitive and nonlinear loads, improving the quality of current utility and reducing harmonics in the supply current (Patel et al., 2018). It is a custom power device that mitigates disturbances that affect the efficiency of sensitive equipment. UPQC comprises two voltage-source inverters with a common DC connection, configured in single-phase, three-phase, or three-phase–four-wire setups. In the series active power filter (APF), one inverter acts as a variable voltage source, while another operates as a variable current source in the shunt APF. The series APF compensates for supply voltage irregularities, while the shunt filter addresses distortions in load current, reactive power, and DC-link voltage control (Chindris et al., 2017; Elbasuony et al., 2018; Gowtham and Shankar, 2018; Abu Arqub et al., 2012; Abo-Hammour et al., 2013).
Other studies have also explored different aspects of power quality. For instance, Vinayagam et al. (2016) examined voltage and frequency variations under different generation and load conditions in both on- and off-grid modes in a microgrid (MG) setup, providing insights into building a microgrid with improved power quality. Similarly, Şerban and Marinescu (2008) implemented a load-frequency control technique using a unique dump load (DL) device to enhance power efficiency in standalone microgrids. The proposed DL design shows improved harmonic performance and unbalanced compensation capabilities. Olatunde and Tola (2024) focused on optimizing power efficiency by positioning distributed generation and capacitor banks to enhance voltage stability and reduce line losses using a modified particle swarm optimization algorithm.
Bhonsle and Kelkar (2016) considered harmonics, voltage flicker, and imbalance problems. They compared and analyzed the output of the composite filter (CF) with that of the passive filter to increase the efficiency of power at the point of common coupling. A comparison of results reveals that the pro-positioned composite filter performs better than the passive filter alone for voltage flicker mitigation, harmonic compensation, and voltage unbalance clearing on the electric arc furnace load side.
Amini et al. (2019) considered the harmonics problem of power quality, proposing a non-iterative harmonic load flow (HLF) approach based on a reverse or forward sweep technique. Their proposed method can conduct harmonic analysis when considering the effects of linear loads and condenser banks on harmonic emissions in the distribution network. Their findings suggest that this approach is quicker and more detailed than traditional harmonic load flow methods. However, their results also show that the linear load modeling method affects the effects of reconfiguration.
By addressing the complexities of power quality problems and proposing various solutions, these studies contribute to the improvement of power quality in electrical networks. Improved power quality enhances system reliability, protects equipment, and ensures efficient energy usage.
Methodology
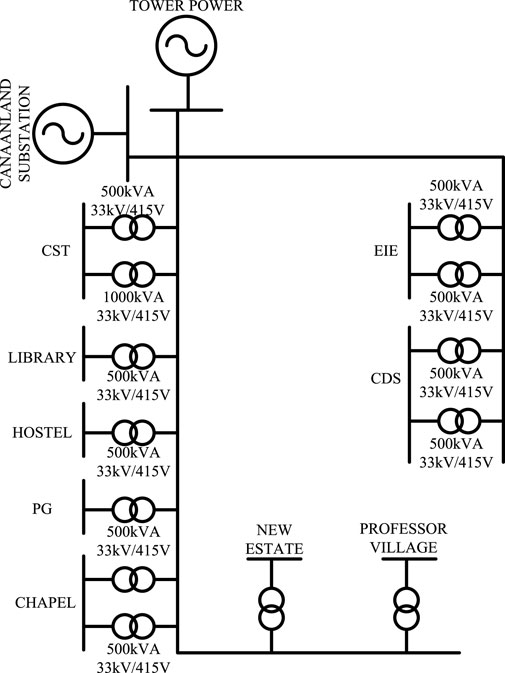
This section gives full details and a clear explanation of the materials and methods used in evaluating the power quality issues identified in the distribution network of Covenant University (Figure 1).
Data acquisition
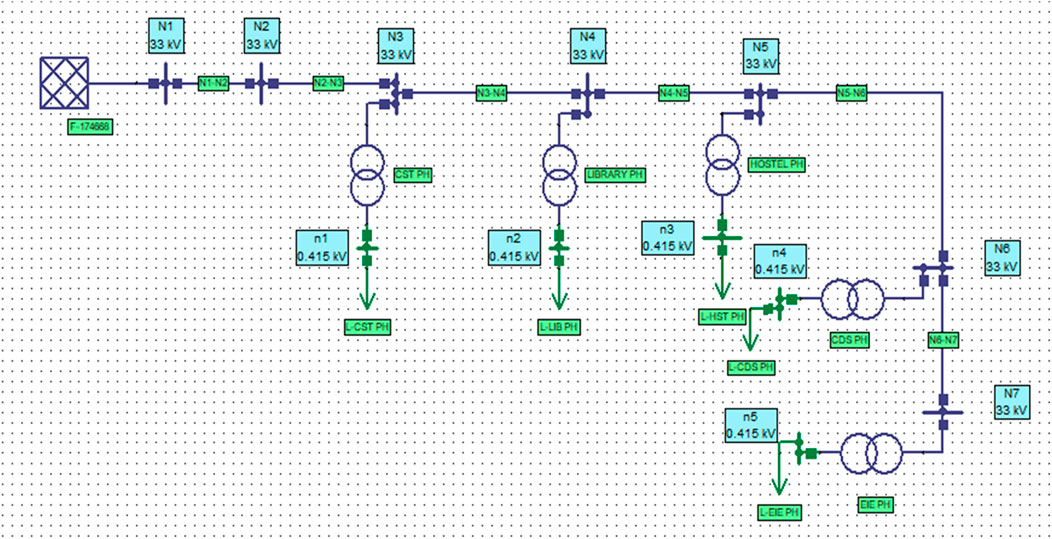
Five powerhouses at Covenant University were considered in this study. The line diagram for the powerhouses was designed using NEPLAN. Real-time data were collected from the identified powerhouses in Covenant University using a Circutor aR6 power analyzer. The five powerhouses considered are the following:
i. College of Development Studies (CDS)
ii. College of Science and Technology (CST)
iii. Library
iv. Male hostel
v. Electrical and Information Engineering (EIE) Department
The powerhouses were selected based on their functionality and accessibility. All the necessary data were obtained from the powerhouses using the Circutor aR6 power analyzer and Power Plus software. The data collected include the maximum and minimum voltage and current for each phase; waveforms of the voltage and current; the voltage and current total harmonics distortion; individual current and voltage harmonics; the true power factor on each phase; voltage and current imbalance; short-term (Pst) and long-term flickers (Plt); the real, apparent, and reactive power consumed by each phase.
To properly understand the network and simulation purpose, a single diagram of the distribution network using NEPLAN software is shown in Figure 2.
Three stages are considered in this study:
Stage 1: Primary data were obtained by measurements using the Circutor aR6 power analyzer from the five powerhouses. The result was analyzed using Power Vision Plus PC software. The measurement was performed at 500 kVA, 11 KV/415 V/230 V on the outgoing circuit for each transformer at the sub-stations.
Stage 2: The result was evaluated by comparing it with the power quality standard (Khan et al., 2017).
Stage 3: NEPLAN was used to simulate the network after applying the possible solutions to the identified problems.
The existing power quality standards are compared to the identified and calculated analysis obtained in the different powerhouses to achieve a comprehensive evaluation. The following formulas were used during the evaluation to compare with the power quality standards. Harmonic requirements restrict voltage deviations that are supposed to stay within the limit for 95% of the 10-min averages collected in 1 week, according to EN 50160. The root means square voltage (RMS) of an AC source which provides nonlinear load-producing harmonics is given by Dugan et al. (1996) as shown in (Equation 1):
V1, V2, Vh relate to the peak magnitudes of main, second, and higher-order harmonics of current. The current equivalent RMS value is given by Dugan et al. (1996) as shown in (Equation 2):
The fundamental values of voltage and currents are given total harmonic distortions (THDs). Voltage and current THDs are provided by Dugan et al. (1996) as shown in (Equations 3, 4):
Voltage and current harmonics range from h=2 to hmax, and V1 or I1 refers to fundamental voltage or current RMS values, respectively.
A distorted voltage’s RMS and current waveforms are given as shown in (Equations 5, 6):
where Vh and Ih are RMS values of harmonic components. The RMS values of current and voltages of distorted waveforms are linked to THD by Dugan et al. (1996) as shown in (Equations 7, 8):
The THD value can be in percentage in the first part of the second part per unit. The RMS values of currents and voltages in the digital data are assessed by (Equation 9)
Time-domain data are given in (Equation 10)
Frequency-domain data
IEEE Standard 519–2014 recommends returning THDi to the initial peak demand load current (IL) in the case of distorted current waveforms, instead of the original current sample, and naming it total demand distortion (TDD) as shown in (Equation 11):
The displacement power factor (DPF) is the angle cosine between voltage and current in sinusoidal tension. The power factor is the ratio of usable power for doing real work (P) to the apparent power (S) the utility supplies. The power factor for displacement is given by Dugan et al. (1996) as shown in (Equation 12)
In the case of a linear load, PF (P/S) is the same as the displacement power factor. However, in the case of a nonlinear load, the true power factor (TPF) considers the contribution of all active power for both basic and harmonic frequency. TPF is the average power (averaged in a line period) ratio to the product of the input voltage and current RMS values. These are expressed in (Equations 13–15):
Alternatively,
The distortion factor is provided in (Equation 16)
Fundamental positive sequence power factor (PF1 +) and true power factor (TPF) are defined as shown in (Equations 17, 18)
Common harmonic mitigation strategies involve isolation transformers, linear reactors, tuned passive harmonic filters, k-factor transformers, IGBT-based fast-switching harmonic filters, phase-shifting transformers, low-pass high-pulse rectifiers, and active harmonic filters.
A harmonic analyzer, as well as handheld meters, can estimate the K-factor. Harmonic loss in K-factor terms can be calculated by (Equation 19)
A harmonic analyzer can be used to classify K-Factor. Unbalanced voltage and current are big problems in the distribution network as regards power quality. Unbalanced current is the primary cause of unbalanced voltage in the network. The frequency is between 49.5 (-1%) and 50.5 (+1%) Hz; the voltage will be 90–110% of normal voltage. The negative sequence cannot assume a magnitude greater than 2% of the direct sequence in voltage imbalance.
Results and discussion
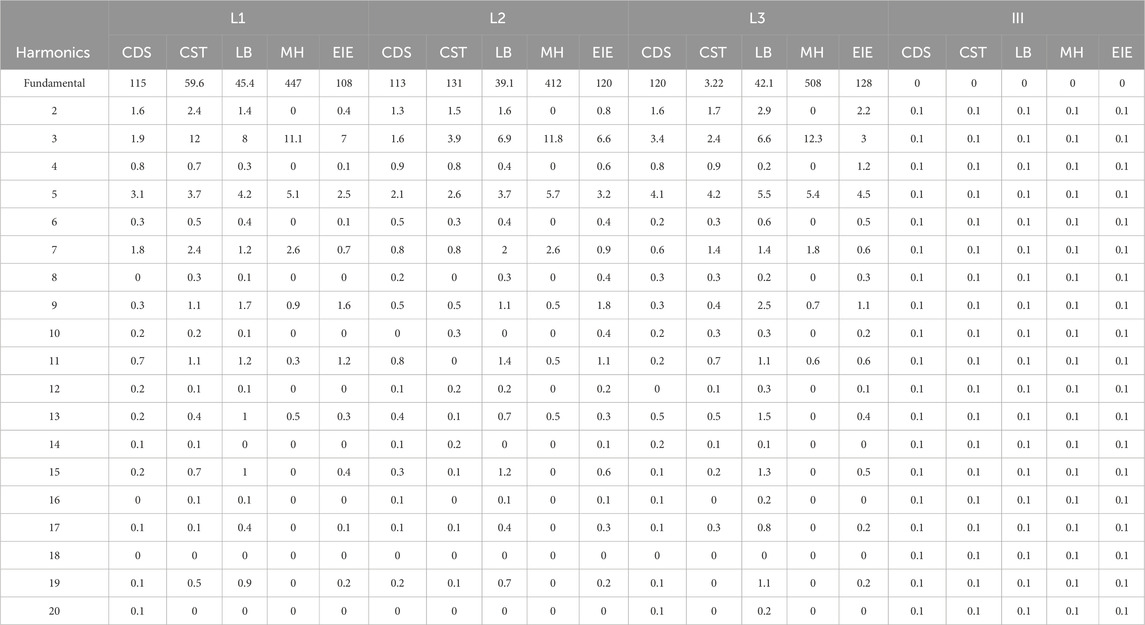
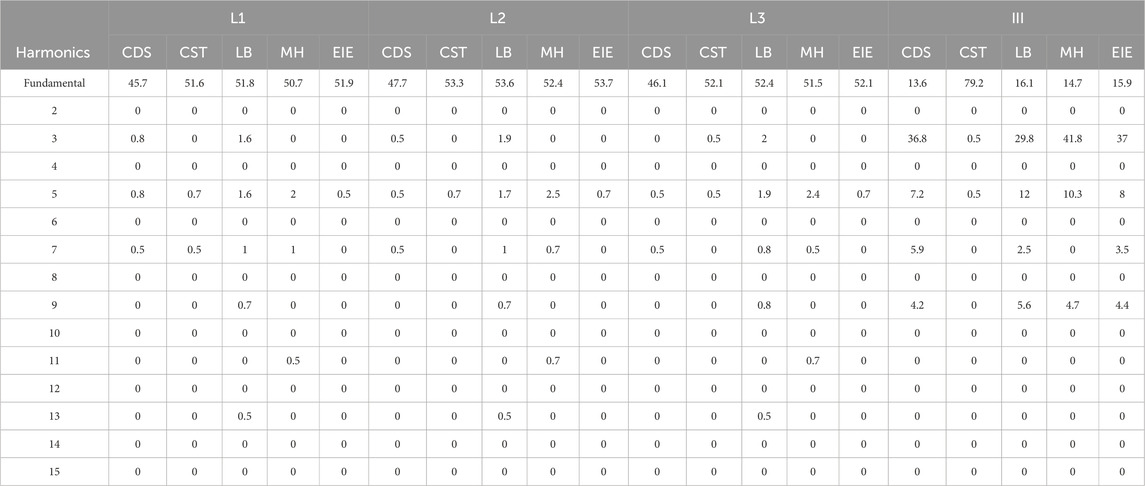
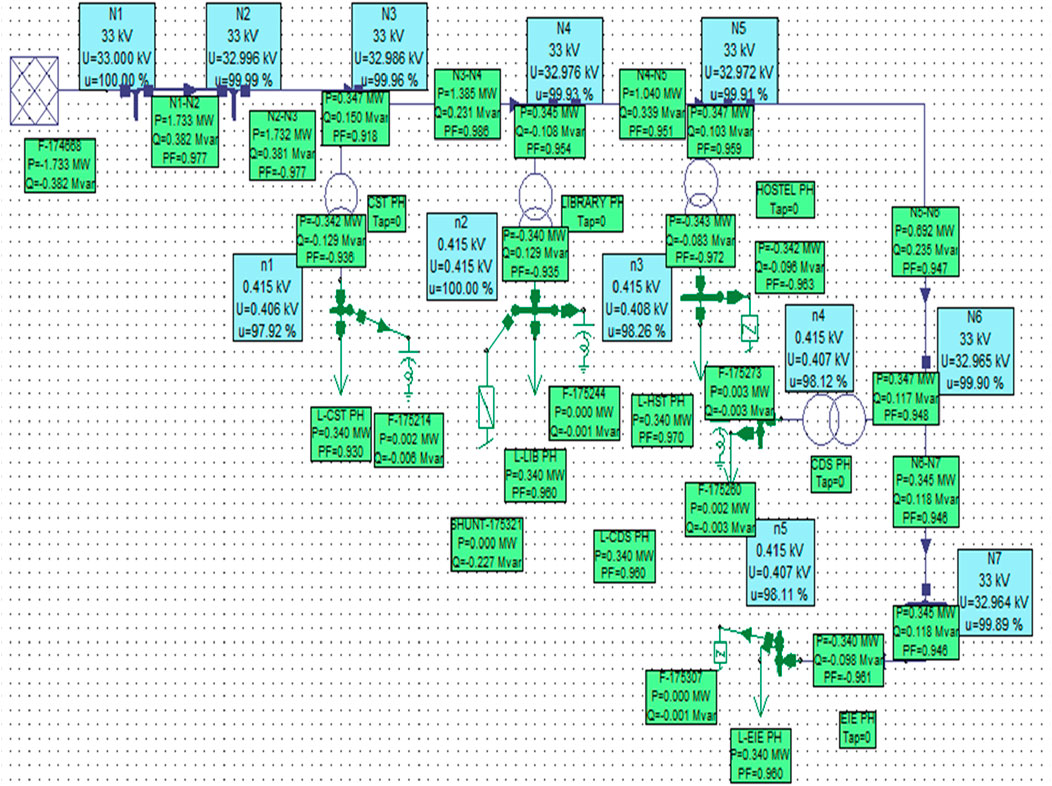
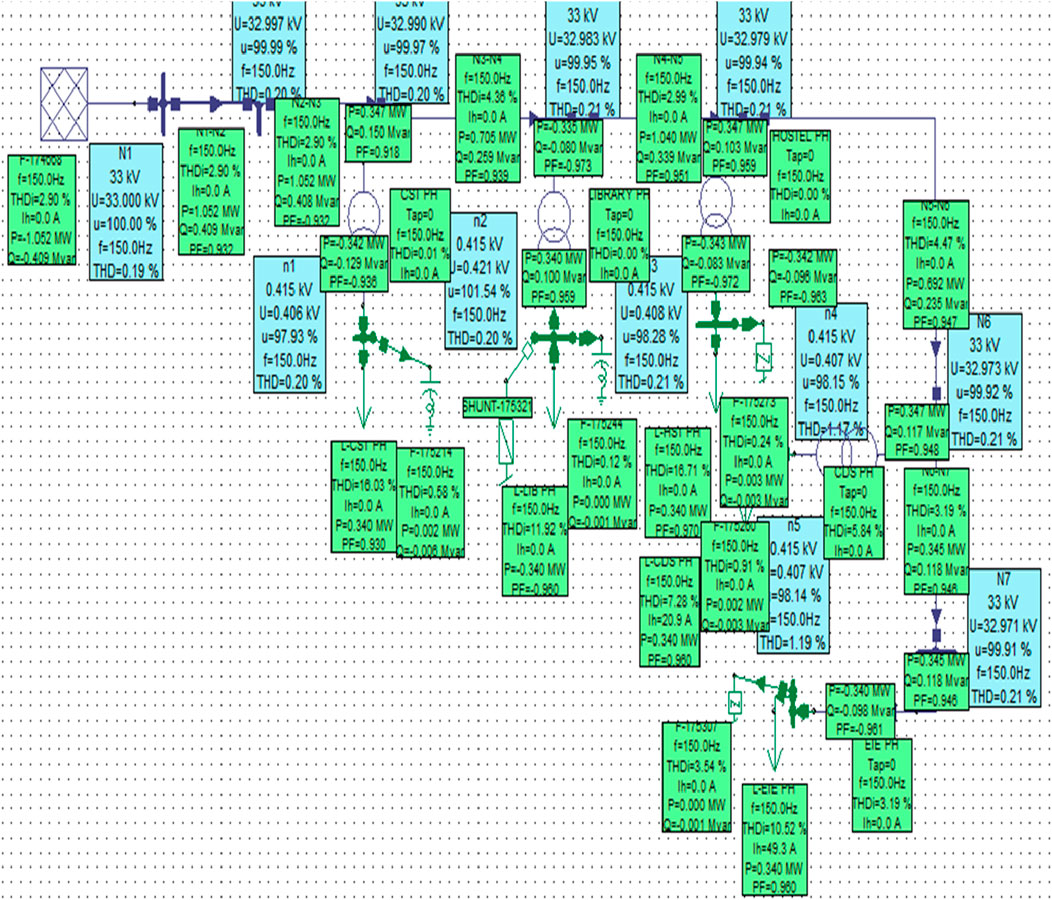
The results obtained from the five powerhouses using the Circutor aR6 power analyzer are presented in this section. The measurement was taken from 2:06 pm to 8:02 pm. Tables 1 and 2 give measured voltage and current, respectively, and the total power consumed for each phase is presented in Table 3, which comprises the active and apparent power. Tables 4 and 5 show the current and voltage harmonics of the five powerhouses: L1- Line 1; L2 - Line 2; L3 - Line 3; and III - Average/Neutral line. Figure 3 shows the load flow simulation with NEPLAN. The load flow was simulated to determine the effect of the shunt capacitor on the load in the Library powerhouse due to a lagging power factor. The shunt capacitor was connected to compensate for it, drawing current leading to the source voltage. Figure 4 shows the third harmonic analysis simulation on NEPLAN, which showed the effect of the active filters on the powerhouses’ load due to the high presence of harmonics on the neutral lines. The active filters were used to filter out current harmonics generated by nonlinear loads. The THD, now developed after the simulation, is all within standards.
College of Development Studies (CDS) powerhouse testing result analysis
The measurement was carried out on the 500-kVA transformer outgoing circuit on the consumer switchboard with a 2 s sampling rate of measurements and an output voltage of 415 V. Since the phase–phase voltage was 415 V and the phase-neutral voltage was
College of Science and Technology (CST) powerhouse testing results analysis
The measurement was taken in 1 h with a 4 s sampling rate. The average phase-neutral voltage of 231.30 V, phase–phase voltage of 400.6 V, and current of 165.2702 A were measured and were all within standard values. For the IEEE standard, the total voltage and current distortions should not exceed 5% and 8%, respectively, but current line 1 had a value of 9.7%. The total average power factor measured was 0.93, and the maximum current demand consumed was 180.3551 at the end of the measurement. The individual voltage harmonics did not exceed 3%, but on the neutral, 37.3%, 8.8%, 5.9%, and 4.5% were measured on the third, fifth, seventh, and ninth harmonics, exceeding the benchmark. The individual current harmonics did not exceed 7%, but 12% was measured for third harmonics on line 1. This evaluation showed that the transformer was not overloaded, and a voltage harmonics value of 37.3% was measured on the neutral line for third harmonics, exceeding the IEEE standard. The grid may thus be polluted with imported voltage harmonics; hence, the utility should be checked and rectified. An active filter can reduce the current harmonics measured in this powerhouse. A total current distortion of 9.8% was measured, which exceeded the 8% standard. This could cause equipment malfunction if not properly addressed.
Library powerhouse test result analysis
The measurement was taken in 30 min, and data were recorded every 2 s. The phase-neutral voltage of 231.22 V, phase–phase voltage of 400.36 V, and current of 217.50 A were measured. The total voltage distortion measured did not exceed 5% in all the lines. The total current distortion measured was 9%, 9.7%, and 10% in lines 1, 2, and 3, respectively, violating the 8% standard. The average power factor recorded was −0.96, and the maximum current demand consumed was 220.3362 A at the end of the measurement. The individual voltage harmonics did not exceed 3%, but on the neutral, 29.6%, 12.7%, 3.6%, and 5.2% were measured on the third, fifth, seventh, and ninth harmonics, respectively, exceeding the benchmark. The individual current harmonics should not exceed 7%, but on the third harmonic, 7.6% was measured on line 2, which is above the standard.
This evaluation showed that the transformer was not overloaded, and a voltage harmonics value of 29.6% was measured on the neutral line for third harmonics, exceeding the IEEE standard. The grid may thus be polluted with imported voltage harmonics; hence, the utility should be checked and rectified. An active filter can reduce the current harmonics measured in this powerhouse. The total current distortion measured on this powerhouse exceeded the standard on the three lines, which can cause a malfunction in the equipment; this should be addressed to ensure improvement. A negative power factor of −0.96 was measured, which can cause damage to power-generating devices and voltage-sensitive loads; this negative power factor is usually obtained when power flows from load to source. Reactive power should be controlled to compensate for the load on this transformer.
Male Hostel powerhouse test results analysis
The measurement was taken in approximately 20 min, with a 1-s sampling rate. The standard for the total voltage distortion was 5% for a PCC voltage
EIE power house testing results analysis
The measurement was carried out on the 500 kVA transformer outgoing circuit on the consumer switchboard with a 1 s sampling rate and an output voltage of 415 V. The measurement was taken in approximately 10 min. The phase-neutral and phase–phase voltage were suitable throughout the measurement, with values of 230.78 V and 399.74 V, respectively. The average load current of the distribution transformer (DT) was 211.39 A, indicating that the transformer was not overloaded, as the maximum current was 696 A. The total voltage distortion measured did not exceed 5%. The maximum current demand measured after the testing was 204.95A. The total average power factor measured was 0.96. Odd harmonics were identified in the measurement’s third, fifth, seventh, and ninth harmonics of 37.2%, 7.7%, 3.6%, and 3.6%, respectively, which were obtained on the neutral line. The result from the analysis gave a value below 3%, which indicates that the distortion in the voltage signal was within the acceptable standard, as specified in IEEE 519 Standard for Voltage Harmonics. The third harmonic in lines 2 and 3 had 7.2% and 8%; this showed a slight distortion in the current signal of lines 2 and 3 above the acceptable limit of 7%. This evaluation showed that the transformer was not overloaded, and a voltage harmonics value of 37.2% was measured on the neutral line for third harmonics, exceeding the IEEE standard. The grid may thus be polluted with imported voltage harmonics; hence, the utility should be checked and rectified. An active filter can reduce the current harmonics measured in this powerhouse. The total current distortion measured on this powerhouse exceeded the standard, which can cause a malfunction in the equipment; hence, this should be investigated to ensure correction.
The limiting value for flickers is 1.0; 0.14 was obtained as a constant value in all the powerhouses. Table 6 shows the power quality issues and proposed improvement obtained in this work.
The shunt capacitor in Figure 3 was connected to compensate for the lagging power factor, which draws current leading to the source voltage, giving a value of 0.96 from −0.96. The active filters were used to filter out current harmonics generated by nonlinear loads in Figure 4. The active filter connected to the CDS powerhouse gave a THD value of 0.91% from 7.28%, the THD for the EIE powerhouse had a value of 3.54% from 10.52%, the THD for the CST powerhouse had a value of 0.58% from 16.03%, the THD for the Library powerhouse had a value of 0.12% from 11.92%, and the THD for the Male Hostel powerhouse had a value of 0.24% from 16.71%, which was obtained from the third harmonic simulation on NEPLAN.
Conclusion
This study evaluated and proposed improvements to the quality of the distribution network power at Covenant University using a Circutor aR6 power analyzer on outgoing circuits across five major powerhouses (CDS, CST, Library, Male Hostel, and EIE). Power Vision Plus software facilitated real-time visualization and analysis of power quality data. Key issues identified included harmonics, total harmonic distortion (THD), overload, and a lagging power factor. To address these challenges, three targeted improvements were proposed and simulated with NEPLAN software: active harmonic filters to mitigate harmonics, power factor correction capacitors to rectify the lagging power factor, and load-sharing strategies to alleviate transformer overloads. These measures aim to enhance the network’s reliability and efficiency, thereby supporting stable and high-quality power delivery within the university.
Data availability statement
The original contributions presented in the study are included in the article/supplementary material; further inquiries can be directed to the corresponding author.
Author contributions
IS: visualization, writing–review and editing, conceptualization, investigation, supervision, and writing–original draft. DT: writing–original draft, writing–review and editing, data curation, methodology, and software. TS: writing–review and editing, validation, and visualization. AA: investigation, supervision, and writing–review and editing. SA-A: investigation, validation, visualization, and writing–review and editing.
Funding
The authors declare that no financial support was received for the research, authorship, and/or publication of this article.
Acknowledgments
The authors appreciate the support of Covenant University.
Conflict of interest
Author SA-A was employed by Transmission Company of Nigeria.
The remaining authors declare that the research was conducted in the absence of any commercial or financial relationships that could be construed as a potential conflict of interest.
Publisher’s note
All claims expressed in this article are solely those of the authors and do not necessarily represent those of their affiliated organizations, or those of the publisher, the editors, and the reviewers. Any product that may be evaluated in this article, or claim that may be made by its manufacturer, is not guaranteed or endorsed by the publisher.
References
Abo-Hammour, Z., Alsmadi, O., Momani, S., and Abu Arqub, O. (2013). A genetic algorithm approach for prediction of linear dynamical systems. Math. Problems Eng. 2013, 1–12. doi:10.1155/2013/831657
Abozaed, M. I. S., and Elrajoubi, S. M. (2014). Power quality evaluation of electrical distribution networks. Int. J. Electr. Comput. Eng. 8, 1587–1591.
Abu Arqub, O., Abo-Hammour, Z., Momani, S., and Shawagfeh, N. (2012). “Solving singular two-point boundary value problems using continuous genetic algorithm,” in Abstract and applied analysis.205391.
Adetiba, E., Akanle, M., Akande, V., Badejo, J., Nzanzu, V. P., Molo, M. J., et al. (2022). “FEDGEN Testbed: a Federated genomics private cloud infrastructure for precision medicine and artificial intelligence research,” in Informatics and intelligent applications: first international conference, ICIIA 2021, ota, Nigeria, november 25–27, 2021, revised selected papers, 78–91.
Adetiba, E., Iweanya, V. C., Popoola, S. I., Adetiba, J. N., and Menon, C. (2017). Automated detection of heart defects in athletes based on electrocardiography and artificial neural network. Cogent Eng. 4, 1411220. doi:10.1080/23311916.2017.1411220
Alaba, P. A., Popoola, S. I., Abnisal, F., Lee, C. S., Ohunakin, O. S., Adetiba, E., et al. (2020). Thermal decomposition of rice husk: a comprehensive artificial intelligence predictive model. J. Therm. Analysis Calorim. 140, 1811–1823. doi:10.1007/s10973-019-08915-0
Amini, M., Jalilian, A., and Pour Behbahani, M. R. (2019). Fast network reconfiguration in harmonic polluted distribution network based on developed backward/forward sweep harmonic load flow. Electr. Power Syst. Res. 168, 295–304. doi:10.1016/j.epsr.2018.12.006
Bhonsle, D. C., and Kelkar, R. B. (2016). Performance evaluation of composite filter for power quality improvement of electric arc furnace distribution network. Int. J. Electr. Power and Energy Syst. 79, 53–65. doi:10.1016/j.ijepes.2016.01.006
Chindris, M., Cziker, A., and Miron, A. (2017). “UPQC—the best solution to improve power quality in low voltage weak distribution networks,” in 2017 international conference on modern power systems (MPS), 1–8.
Dugan, R. C., McGranaghan, M. F., and Beaty, H. W. (1996). Electrical power systems quality. New York.
Elbasuony, G. S., Abdel Aleem, S. H., Ibrahim, A. M., and Sharaf, A. M. (2018). A unified index for power quality evaluation in distributed generation systems. Energy 149, 607–622. doi:10.1016/j.energy.2018.02.088
Gowtham, N., and Shankar, S. (2018). UPQC: a custom power device for power quality improvement. Mater. Today Proc. 5, 965–972. doi:10.1016/j.matpr.2017.11.172
Jamal, T., and Salehin, S. (2021). “Hybrid renewable energy sources power systems,” in Hybrid renewable energy systems and microgrids (Elsevier), 179–214.
Khan, S., Singh, B., and Makhija, P. (2017). 2017 innovations in power and advanced computing technologies (i-PACT), 1–7.A review on power quality problems and its improvement techniques.
Kim, D., Abu-Siada, A., and Sutinjo, A. (2018). State-of-the-art literature review of WPT: current limitations and solutions on IPT. Electr. Power Syst. Res. 154, 493–502. doi:10.1016/j.epsr.2017.09.018
Liao, W., Huang, X., Van Coillie, F., Gautama, S., Pižurica, A., Philips, W., et al. (2015). Processing of multiresolution thermal hyperspectral and digital color data: outcome of the 2014 IEEE GRSS data fusion contest. IEEE J. Sel. Top. Appl. Earth Observations Remote Sens. 8, 2984–2996. doi:10.1109/jstars.2015.2420582
Ogheneovo Johnson, D., and Hassan, K. A. (2016). Issues of power quality in electrical systems. Int. J. Energy Power Eng. 5, 148–154. doi:10.11648/j.ijepe.20160504.12
Ogunjuyigbe, A., Ayodele, T., Idika, V., and Ojo, O. (2017). “Effect of lamp technologies on the power quality of electrical distribution network,” in 2017 IEEE PES PowerAfrica, 159–163.
Olatunde, O., and Tola, A. T. (2024). Power quality improvement in electrical distribution network. IEEE Trans AJER 5, 224–227.
Onaolapo, A. K., Akindeji, K. T., and Adetiba, E. (2019). “Simulation experiments for faults location in smart distribution networks using ieee 13 node test feeder and artificial neural network,” in Journal of physics: conference series.032021.
Patel, A., Mathur, H., and Bhanot, S. (2018). An improved control method for unified power quality conditioner with unbalanced load. Int. J. Electr. Power and Energy Syst. 100, 129–138. doi:10.1016/j.ijepes.2018.02.035
Samudre, V. S. (2016). Power quality standards problems and their solutions. Int. J. Eng. Sci. \and Res. Technol. 5 (12), 219–227.
Şerban, I., and Marinescu, C. (2008). Power quality issues in a stand-alone microgrid based on renewable energy. Rev. Roum. Sci. Techn.–Électrotechn. Énerg 53, 285–293.
Somefun, T., Azubuike, C., Misra, S., and Adetiba, E. (2022). “Predictive analysis on customer churn using machine learning algorithms,” in Proceedings of third doctoral symposium on computational intelligence: DoSCI 2022, 193–203.
Thajeel, E. M., bin Daniyal, H., Sulaiman, M. H., and Mahdi, M. M. (2016). An analytical study of total harmonics reduction in apf using adaptive zero crossing detection techniques. Int. J. Eng. Sci. and Res. Technol. 5 (00), 48–55.
Vinayagam, A., Srungarakavi Venkata, S. K., Khoo, S. Y., and Stojcevski, A. (2016). Power quality analysis in microgrid: an experimental approach. J. power energy Eng. 4, 17–34.
Nomenclature
rms Root-mean-square
Vrms Root-mean-square voltage
Irms Root-mean-square current
DPF Displacement power factor
PF Power factor
DF Distortion factor
TDD Total demand distortion
THD Total harmonic distortion
THDv Voltage total harmonic distortion
THDi Current total harmonic distortion
TPF True power factor
Trms True root mean square
P Real power
S Apparent power
Keywords: power quality, distribution network, Circutor aR6 power analyzer, NEPLAN software, harmonics
Citation: Samuel IA, Toyin DA, Somefun TE, Awelewa AA and Abba-Aliyu S (2025) Evaluation and improvement of power quality of distribution network: a case study of Covenant University, Ota. Front. Energy Effic. 2:1389622. doi: 10.3389/fenef.2024.1389622
Received: 27 March 2024; Accepted: 05 December 2024;
Published: 09 January 2025.
Edited by:
Selvakumar Ponnusamy, PSN College of Engineering and Technology, IndiaReviewed by:
Omar Abu Arqub, Al-Balqa Applied University, JordanBen Christopher, PSN College of Engineering and Technology, India
Shiny Pradeepa, PSN College of Engineering and Technology, India
Rathika Ponpandi, PSN College of Engineering and Technology, India
Copyright © 2025 Samuel, Toyin, Somefun, Awelewa and Abba-Aliyu. This is an open-access article distributed under the terms of the Creative Commons Attribution License (CC BY). The use, distribution or reproduction in other forums is permitted, provided the original author(s) and the copyright owner(s) are credited and that the original publication in this journal is cited, in accordance with accepted academic practice. No use, distribution or reproduction is permitted which does not comply with these terms.
*Correspondence: Tobiloba E. Somefun, dG9iaS5zb21lZnVuQGNvdmVuYW50dW5pdmVyc2l0eS5lZHUubmc=
 Isaac A. Samuel
 Daudu Afah Toyin1
 Tobiloba E. Somefun
 Ayokunle A. Awelewa