 Xingqi Liu
 Xuan Liu
95% of researchers rate our articles as excellent or good
Learn more about the work of our research integrity team to safeguard the quality of each article we publish.
Find out more
ORIGINAL RESEARCH article
Front. Energy Effic. , 14 November 2023
Sec. Energy Efficiency Technologies
Volume 1 - 2023 | https://doi.org/10.3389/fenef.2023.1302121
This article is part of the Research Topic Technologies and Applications of Digital Twins to Enable Efficient Energy Systems View all articles
Non-intrusive load monitoring (NILM) is a technique used to monitor energy consumption in buildings without requiring hardware installation on individual appliances. This approach offers a cost-effective and scalable solution to enhance energy efficiency and reduce energy usage. Recent advancements in NILM primarily employ deep-learning algorithms for appliance identification. However, the substantial number of parameters in deep learning models presents challenges in quickly and effectively identifying appliances. An effective technique for appliance identification is analyzing the appliances’ voltage-current (V-I) trajectory signature. This research introduces a novel hashing method that learns compact binary codes to achieve highly efficient appliance V-I trajectory identification. Specifically, this paper uses a profound structure to acquire V-I trajectory image features by acquiring multi-level non-linear transformations. Subsequently, we merge these intermediary traits with high-level visual data from the uppermost layer to carry out the V-I trajectory image retrieval process. These condensed codes are subjected to three distinct standards: minimal loss in quantization, uniformly distributed binary components, and autonomous bits that are not interdependent. As a result, the network easily encodes newly acquired query V-I images for appliance identification by propagating them through the network and quantizing the network’s outputs into binary code representations. Through extensive experiments conducted on the PLAID dataset, we demonstrate the promising performance of our approach compared to state-of-the-art methods.
Smart grid has become a new strategy for global energy in the 21st centuryYu et al. (2014). Electric energy has gradually become the most important form of terminal energy in modern society Dennis (2015). In order to cope with the global energy and environmental crisis, realize low-carbonization and improve power supply reliability and power utilization efficiency, extensive and in-depth research on smart grids has been carried out worldwide. And practice. The development of technology and the increased use of electrical appliances and automated services have led to a steady growth in electric energy needs over the past century. In the last decade alone, there has been an annual growth rate of approximately 3.4% Yu et al. (2015). Currently, residential and commercial buildings account for approximately 36% of total electrical demand in the United States of America and 25% in the EU Elma and Selamoğullar (2017). Studies have shown that detailed analysis and real-time feedback on energy consumption can result in energy savings of up to 20% by detecting faulty devices and inefficient operational strategies He et al. (2013); Lee and Cheng (2016). As a result, extensive research has been conducted in the last few decades on smart grids, smart systems, and energy demand management, leading to the development of various optimization techniques aimed at reducing residential energy consumption Çimen et al. (2020). However, in order to effectively utilize these techniques, accurate and detailed monitoring of electrical energy consumption is necessary Chiş et al. (2016). A systematic review conducted by Kelly and Knottenbelt (2016) indicates that even providing real-time aggregated consumption data to households has a positive effect on consumer behavior, while Meziane et al. (2015) suggests that the greatest energy savings can be achieved by monitoring energy consumption at the device level.
However, closely monitoring the energy consumption of households at a detailed level can be expensive and intrusive, as it necessitates the use of multiple dedicated metering devices. Consequently, the research community has devised more efficient techniques to achieve the same goal, utilizing a single metering point known as Non-Intrusive Load Monitoring (NILM). The concept of NILM was originally introduced by Hart in 1980 Hart (1992), and it involves extracting information about the operation of appliances by solely measuring electrical parameters at the mains. In energy disaggregation, the objective is to directly estimate the individual active powers of the appliances Zhang et al. (2018), while classification entails determining their states and subsequently estimating the active power by employing average power values associated with each state Tabatabaei et al. (2016).
Since the publication of Hart’s influential paper Hart (1992), numerous energy disaggregation algorithms have emerged in the literature to enhance his findings. NILM techniques can be categorized into event-based or state-based methods Balletti et al. (2022). Based on the availability of ground truth data, NILM algorithms can be classified as supervised or unsupervised or semi-supervised Han et al. (2022). Event-based approaches employ edge detection techniques to capture significant statistical variations in the signal. The most common event-based methods involve unsupervised event detection in the aggregate signal and supervised or semi-supervised classification to assign known appliances to the detected events. Classification tools mentioned in the literature include Support Vector Machines (SVM) Hassan et al. (2013), Decision Trees Chowdhury and Hasan (2019), and combinations of various classification methods Lin and Tsai (2014). Furthermore, clustering techniques based on Dynamic Time Warping (DTW) are utilized to identify windows exhibiting similar consumption patterns and to extract representative load signatures Liu et al. (2017). Recent research in event-based NILM has explored Graph Signal Processing (GSP) algorithms He et al. (2016), both supervised and unsupervised, which identify spatio-temporal correlations in the data by embedding signals onto a graph.
Instead of using the traditional methods, state-based approaches analyze each appliance as a finite-state machine and divide the total power signal based on models of appliance load distribution. To explore all the potential combinations of different appliance state sequences, state-based approaches commonly employ Combinatorial Optimization (CO) and Hidden Markov Models (HMM) Kong et al. (2016); Bonfigli et al. (2017). However, as the number of appliances increases, the number of state combinations grows exponentially, making the problem more complex. Additionally, these approaches have limitations when dealing with unknown loads, often yielding unsatisfactory results. In Parson et al. (2012), differential HMMs are utilized with the expectation-maximization algorithm to generate state transition models in an unsupervised manner. Makonin et al. (2015) employs sub-metering measurements to construct super-state HMMs, and inference is carried out using a sparse Viterbi algorithm, resulting in an efficient estimation of energy consumption. Finally, Rahimpour et al. (2017) applies a non-negative matrix factorization technique to decompose the aggregated signal into appliance signatures.
For appliance identification, the extraction of distinct features from recorded data, such as current, voltage, power, or a combination of these attributes, is crucial. The effectiveness of any identification study depends on two main factors: the feature sets and the classifiers used. The remarkable progress in the field of Computer Vision (CV), coupled with the neural networks’ capacity to extract precise features and the introduction of innovative image encoding techniques, has empowered researchers to apply high-performance CV methods to various other tasks. When dealing with time series data, it becomes necessary to convert them into 2-dimensional representations by utilizing encoding techniques. Numerous studies Wang and Oates (2015); Sezer and Ozbayoglu (2018); Chen and Tsai (2020); Barra et al. (2020) have investigated encoding techniques for transforming time series into images, and three of them have gained widespread adoption: Gramian Angular Summation/Difference Fields (GASF/GADF), Markov Transition Fields (MTF), Recurrence Plot. While previous literature has focused more on enhancing the feature set De Baets et al. (2018); Liu et al. (2018); Chen et al. (2021); Heo and Kim, (2021); Han et al. (2023), rather than the classifiers employed Ghosh et al. (2021), Faustine et al. (2020), both aspects play a significant role in improving appliance identification. Regarding the feature set, initial approaches either considered images of voltage-current (V-I) trajectories of loads De Baets et al. (2018) or extracted statistical features directly from the load signature Liu et al. (2019). However, these methods yielded low identification accuracy De Baets et al. (2018), Liu et al. (2019), prompting various strategic enhancements in previous studies. One improvement was the implementation of color-encoded V-I trajectory analysis Liu et al. (2018) to enhance V-I trajectory images. Another approach involved generating weighted pixelated images of V-I trajectories using particle swarm optimization to determine thresholds Jia et al. (2021). In Chen et al. (2021), signal disaggregation was performed instead of directly considering V-I trajectories. This involved utilizing Fast Fourier transform (FFT) to obtain spectral features, which were then fused with temporal features and converted into images using recurrence graphs. The GADF encoding technique was examined in Kyrkou et al. (2019) to detect states in two residential datasets. This study marked the first utilization of an encoding technique on active power consumption data. Conversely, in Cavalca and Fernandes (2020), the Recurrence Plot method was employed on the aggregate signal, and comparisons were made with previously used techniques.
In recent years, end-to-end Deep Neural Networks (DNN) Han et al. (2022) have emerged as the leading approach among supervised methods, demonstrating state-of-the-art performance. However, a significant limitation of DNNs is their heavy dependence on a large number of training samples, encompassing both aggregated and disaggregated data, and the implementation of most DNN-based NILM approaches on commercial end-devices weight calculation and storage hinder their implementation on commercial end-devices. The study presented in reference Gopinath and Kumar (2023) is dedicated to crafting an efficient neural network tailored for edge computing, with its foundation resting upon the seq2point CNN model. In pursuit of this objective, the authors introduce an innovative multi-task learning-based architectural framework. They also delve into the realms of filter and neuron pruning techniques, meticulously fine-tuning the network to diminish both memory and computational overhead. Rigorous evaluation takes place against the REDD and UKDALE datasets to gauge its precision. Reference Athanasiadis et al. (2021) introduces a nimble and scalable approach to Non-Intrusive Load Monitoring (NILM). In this methodology, transient sequences are methodically segmented, primarily guided by the identification of turn-ON events. A sophisticated blend of Convolutional Neural Networks (CNN) and k-Nearest Neighbors (k-NN) algorithms is harnessed to discern various electrical loads. However, it is worth noting that the approach mandates high-rate measurements sampled at 100 Hz for power sequence extraction. In reference Ahmed and Bons (2020), an inventive MobileNet model is proposed, accompanied by the deployment of TensorFlow Lite, effectively optimizing its lightweight architecture for compression. This strategic maneuver is directed at mitigating memory consumption and reducing the training duration. Nonetheless, it is crucial to acknowledge that this compression drive does introduce a discernible performance drop in the system. Other works such as Chen et al. (2023); Zhang et al. (2021) have also made certain contributions to the lightweighting of NILM models. In this paper, we propose a deep supervised hashing for fast load identification based on V-I trajectory signature. We transform the problem of load identification into the problem of V-I trajectory image retrieval. At present, deep hash image retrieval is mainly applied in the field of large-scale image retrieval Liu et al. (2016); Yan et al. (2020); Liu et al. (2020); Zhai et al. (2020); Tian et al. (2023). In this paper, our idea comes from the process of hash image retrieval. For a query image, the result of hash image retrieval is the one or several images most similar to it in the output image library. When the V-I trajectory image is used for load identification, it is relatively easy for the appliances with only on and off working states because the V-I trajectory of these appliances is single and relatively stable. Each running state is different for multi-state appliances, and the V-I trajectory image corresponding to each state is also quite different. In addition, due to the limited amount of data in NILM, it is difficult for existing deep learning algorithms to identify these multi-state appliances correctly Liu et al. (2018); Han et al. (2022); He et al. (2023). Therefore, through the hash image retrieval algorithm, we can identify the appliance by returning the label of the image most similar to the queried image in the database. This method can effectively improve the accuracy and speed of load identification.
This work is organised as follows. The process of V-I trajectory extraction and the proposed algorithm are introduced in Section 2. Section 3 showcases the experimental dataset, evaluation criteria, results, discussion, and outlook of this work. Finally, section 4 draws the conclusion.
Firstly, we introduce the approach to extract V-I trajectory patterns from the merged data of terminal voltage and total current pertaining to a specific appliance. Subsequently, we offer a thorough elucidation of the suggested model structure.
Within the NILM framework, energy monitoring devices like smart meters, smart plugs, current sensors, and voltage sensors are used to acquire aggregated data on current, voltage, and power. Assuming that only one load is switched at a time, analyzing the variations in power and current allows us to detect and separate the switched load. By utilizing the current of a single appliance, we can extract its load signature and train a classifier to identify different appliance loads. To obtain the V-I trajectory of a single appliance, we initially divide the voltage and current waveforms into two segments: one during the steady state before load switching (denoted as Voff and Ioff) and another after load switching (denoted as Von and Ion). To ensure that the current waveforms Ioff and Ion can be directly subtracted in the time domain, it is necessary for their initial phase angles to be the same Wang et al. (2018). The phase angle of the fundamental voltage can be determined through spectrum analysis methods like fast Fourier transform, and the sampling point corresponding to a phase angle of zero can be used as the initial sampling point. We can acquire the voltage and current waveform of the switching appliance, and the calculation formulas are as follows:
A two-dimensional V-I trajectory image can be generated by using the voltage V and current I values of an appliance. To enhance the uniqueness information of each appliance in the V-I trajectory image, the method described in the reference is applied in this study to encode the color of the appliance’s V-I trajectory Liu et al. (2018). Figure 1 visualizes the V-I trajectories of different appliances in the PLAID dataset.
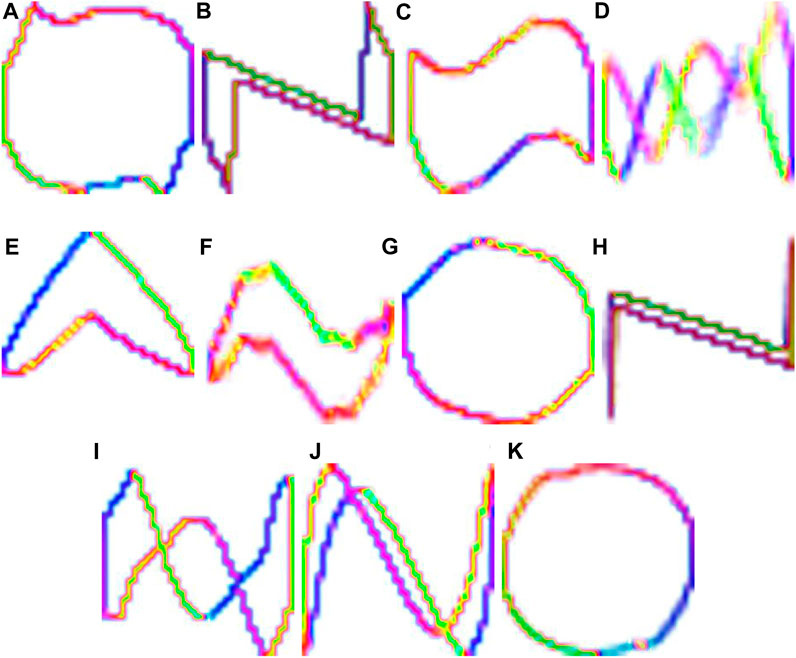
FIGURE 1. (A) Air Conditioner, (B) Compact Fluorescent Light, (C) Fan, (D) Refrigerator, (E) Hairdryer, (F) Heater, (G) Incandescent Light Bulb, (H) Laptop, (I) Microwave (J) Vacuum Cleaner (K) Washing Machine on PLAID dataset. (The x-axis represents normalized current data, and the y-axis represents normalized voltage data).
In this segment, we will elaborate on the envisaged supervised hashing methodology founded on a deep neural network. Our initial step involves constructing a profound architecture utilizing the renowned AlexNet and incorporating a hashing stratum within this structure. The primary objective of this stratum is to acquire hash codes that maintain similarity, thus enabling effective V-I trajectory image retrieval. To ensure the efficacy of our approach, these codes are required to encapsulate three key characteristics: Firstly, the V-I trajectory images of the same appliances must be translated into analogous hash codes, and conversely, the V-I trajectory images of different appliances should yield contrasting codes. Secondly, the binary codes must be uniformly disseminated across the spectrum. Lastly, we strive for maximal independence among distinct bits, enhancing the discriminative power of the codes.
Figure 2 displays the architectural configuration of our approach using a deep neural network. In this arrangement, a hashing layer (H), positioned between the second fully connected layer (F7) and the uppermost classification layer (F9) in AlexNet, is employed to produce concise feature representations. The inputs for this intricate structure comprise the original V-I trajectory image pixels alongside the corresponding appliance labels. During the training stage, our methodology commences by initializing the network parameters utilizing the pre-training model weights sourced from the extensive ImageNet dataset [28]. Subsequently, we employ the stochastic gradient descent (SGD) methodology to fine-tune the network parameters, ensuring optimal convergence. Transitioning to the retrieval phase, we harness the hashing layer’s representation in conjunction with the information from the top layer to jointly compute the degree of similarity.
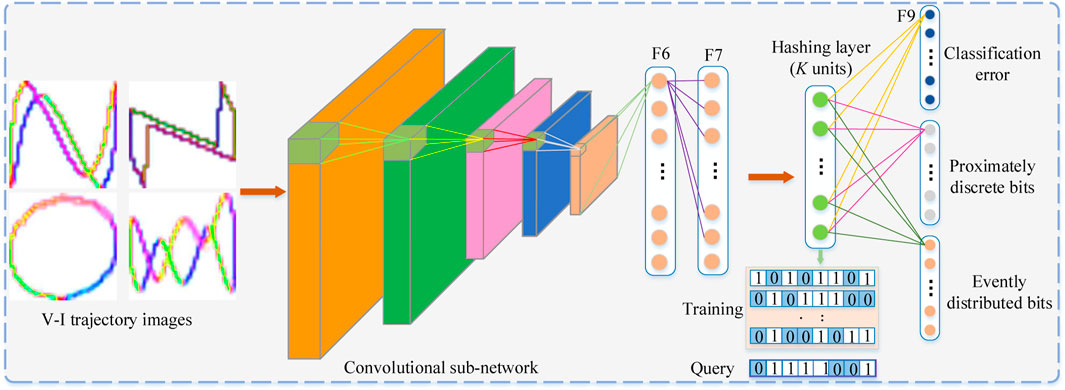
FIGURE 2. The fundamental structure of the proposed deep hashing technique.
In broad terms, a hash function is designed to map input data of D dimensions to a compressed vector of K dimensions. Consider
Consider
where sgn(s) = 1 if s > 0 and −1 otherwise, and sgn (⋅) executes element-wise operations on a vector or a matrix.
The middle strata comprise abundant and unique semantic characteristics, capable of portraying V-I trajectory visual content through amalgamations of features. In this context, we predominantly employ V-I trajectory visual annotations as the guiding data during the hash learning procedure. That implies we can enhance a loss function established on classification inaccuracies to transform images with similar meanings into corresponding hash codes. Additionally, this approach allows us to broaden the scope of semantically analogous images linked by comparable hash codes.
Suppose that
where f (⋅) represents the loss function aimed at mitigating classification errors, W embodies the weight matrix of the profound neural network, and λ assumes the role of a hyper parameter governing the significance of the regularization component.
Utilizing the previously mentioned loss functions, our profound framework will produce outcomes that bear a semantic resemblance. As expounded in reference (1), the neural units within the hashing layer (H) are set in motion by sigmoidal functions, consequently yielding continuous outputs spanning the interval [0, 1]. To achieve enhanced binary encodings, our aspiration revolves around minimizing the disparity between each activation value within the hash layer and the extremes of 0 or 1. In essence, we harbor the desire for the hash layer’s outputs to exclusively inhabit the set {0, 1}. To actualize this objective, we impose a restriction denoted as
Furthermore, drawing from information theory principles, heightened entropy can encapsulate more information. Hence, we aim to ensure an equiprobable assignment of 0 or 1 to every unit within the hashing layer. In simpler terms, we seek to evenly distribute compact codes evenly, thereby maximizing the entropy of the discrete distribution.
To accomplish this objective, we can execute the expression
where K represents the length of hash codes, the initial component ensures that every outcome from the hash layer approaches either 0 or 1. Simultaneously, the subsequent element empowers every activation within the hash layer modules to exhibit a probability distribution equally balanced between 0 and 1.
As mentioned earlier, the overall objective function for learning efficient hash codes is given as follow:
where α, β, γ are hyper parameters that control importance of each term.
Take note that L1, L2, L3 stand for three channels of the profound architecture, correspondingly, as is visually depicted in Figure 2. We employ model coefficients pre-learnedfrom the ImageNet to initialize the parameters in the convolutional sub-networks and the initial two fully connected strata (F6-F7). The residual layers are set in motion with random initialization. The network parameters are then updated through stochastic gradient descent (SGD) coupled with the backpropagation mechanism.
Alternative settings are configured subsequently. The V-I trajectory images are adjusted to 32 × 32 × 3. The fundamental learning rate is established at 0.001, while the momentum is defined as 0.9. Employing a ‘step’ protocol, the learning rate undergoes reduction after completing 25,000 iterations. The upper limit for iterations is capped at 50,000. Furthermore, as a precaution against overfitting, the dropout methodology with a 0.5 probability is integrated. Our approach constitutes an enhanced rendition of an existing technique. Consequently, the parameters α, β, γ are uniformly configured to 1.
Most prevailing deep hashing techniques initially capture the characteristics of the hash layer for all V-I trajectory images within the database. Subsequently, these feature representations are discretized into binary, commonly called hash codes. Ultimately, a provided query V-I trajectory image undergoes identical processing, yielding the appliance labels of similar V-I trajectory images through the computation of the Hamming distance amidst the query V-I trajectory images and the V-I trajectory images within the database. This method effectively establishes a means to retrieve resemblant V-I trajectory images based on their binary encodings.
Nonetheless, these strategies might achieve limited search precision as they solely rely on hash layer characteristics. Consequently, we introduced an innovative approach to measuring similarity. In this regard, we incorporate the insights from the classification layer as an ameliorative component, augmenting the computation of similarity distances. The ultimate computation of similarity is illustrated as follows:
where D (⋅) signifies the disparity existing between the query V-I trajectory image, denoted as Vi, and the V-I trajectory image pertaining to the ith entry within the database. Furthermore, DH (⋅) and DC (⋅) stand for the dissimilarity measures corresponding to the hash layer and the classification layer, respectively. It is important to note that μ serves as a hyper parameter that plays a crucial role in regulating the significance attributed to the second term.
This chapter begins with a description of the experimental data and evaluation indicators, followed by a detailed analysis and discussion of the experimental results. The experiments were conducted on a machine equipped with an Intel(R) Core(TM) i7-6700 CPU, 16.00 GB RAM, and NVIDIA Quadro P2000, using Python 3.6 as the programming language and Pytorch 1.8 as the basis for constructing the network architecture.
In order to verify the performance of the algorithm, we choose the PLAID dataset. The PLAID data set is a data set released by Carnegie Mellon University specifically for NILM research work. It collects the instantaneous voltage and current data of 11 electrical appliances in 56 households in Pittsburgh, Pennsylvania, United States within a few seconds before the switching event. The data sampling frequency is 30 kHZ. The PLAID data set used in this paper is the version released in 2017 De Baets et al. (2017). The data set includes the original voltage and current instantaneous values of 1793 devices, of which numbers 1–1,074 are data collected in June 2013, and numbers 1075–1793 are data collected in November 2014. The data collected in the month, the name of each electrical category in the data set and its abbreviation in this paper, and the sample data are shown in Table 1.
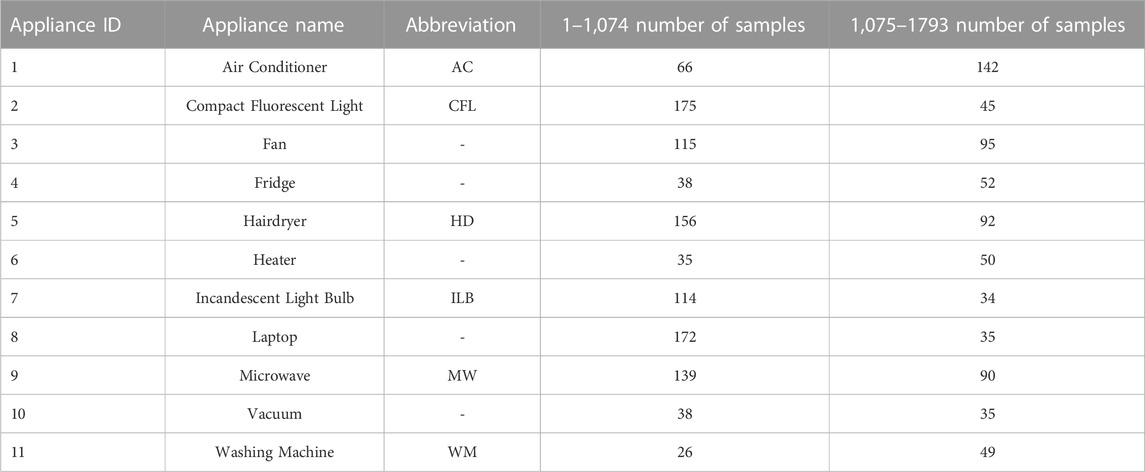
TABLE 1. Each load name abbreviation and its sample number in the PLAID dataset.
To ensure the deep learning model avoids overfitting and produces reliable results, we employ the repeated 5-fold cross-validation technique and establish appropriate stopping criteria prior to training. Cross-validation serves as a model validation method, assessing how statistical analysis outcomes will generalize to independent datasets. In K-fold cross-validation, the original dataset is randomly divided into K equally-sized subsets. One subset is used as the validation data for testing the model, while the remaining K-1 subsets are employed as the training data. This cross-validation process is repeated K times, with each subset used once as the validation data. Ultimately, the K results from the folds are averaged to obtain the K-fold cross-validation result. It is recommended to use 5 folds Kohavi et al. (1995), as altering this number can increase variance due to the inherent instability of the training sets themselves.
In order to evaluate the performance of the experimental results, we use Fscore as the evaluation index, and the specific calculation is as follows:
Where TP is true positive, FN is false negative, FP is false positive, TN is true negative. The larger the value of Fscore, the higher the accuracy of appliance identification and the better the identification effect. Fmacro is the mean of Fscore of all appliances, where N is the number of appliances in the data set, Fscore,i is the Fscore of the ith appliance.
To verify the effectiveness of the model, we compared the load identification results with state-of-the-art algorithms. Ref Han et al. (2021) is a V–I trajectory enabled asymmetric deep supervised hashing (ADSH) method, and De Baets et al. (2018) is a load identification method based on convolutional neural network. To verify the identification of the model. To enable a more comprehensive analysis beyond simple accuracy, a specialized table layout known as a confusion matrix Sadeghianpourhamami et al. (2017) is utilized to visualize the performance of the classification problem. As depicted in Figures 3–5, each row of the matrix represents the instances assigned to a predicted class, while each column represents the instances belonging to a true class. The diagonal cells display the number of correct predictions for each class, indicating how many instances match both the true and predicted classes. Values outside the diagonal indicate the classifier’s errors, allowing for visual inspection of prediction mistakes. The rightmost column of the plot represents the precision, indicating the accuracy for each predicted class, while the bottom row represents the recall, denoting the accuracy for each true class. The cell at the bottom right of the plot represents the overall accuracy.
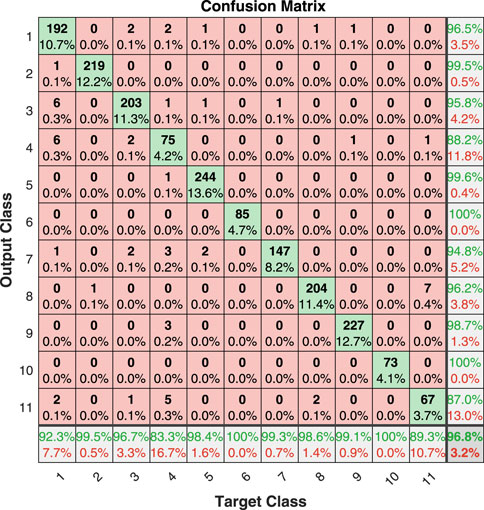
FIGURE 3. The confusion matrix for appliance loads using SPD method with 16-bit encoding results.
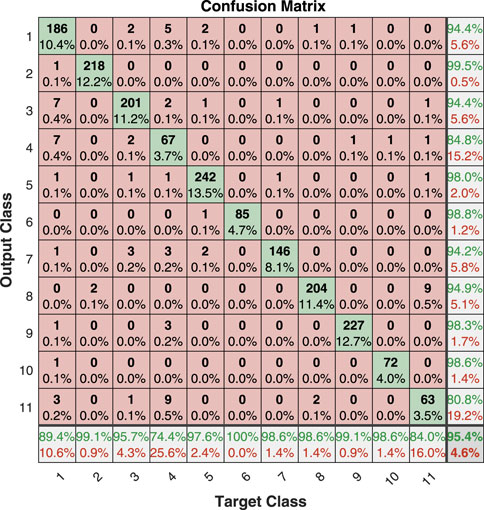
FIGURE 4. The confusion matrix for appliance loads using ADSH method with 16-bit encoding results.
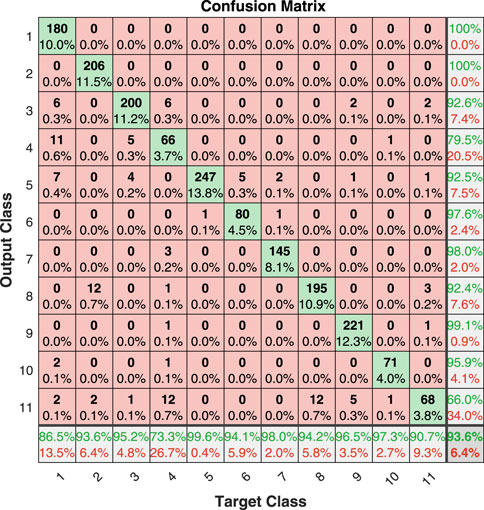
FIGURE 5. The confusion matrix for appliance loads using CNN method.
From Figures 3–5, it can be seen that the average accuracy of the proposed algorithm using 16-bit encoding results is 96.8%, the average accuracy of the ADSH algorithm using 16-bit encoding results is 95.4%, and the average accuracy of the CNN algorithm is 93.6%, the proposed algorithm has the best load identification results. Based on the confusion matrix presented in Figure 3, it is evident that the prediction results for fridge, air conditioners, and washing machines are prone to confusion with other electrical loads. Additionally, Figure 6 illustrates that only these three loads exhibit F1_scores lower than the F_macro (the average of f-scores for all appliances). It is worth noting that all three loads belong to the Type II category. As per the proposal outlined in Hart (1992) and the definition provided by Zoha et al. (2012), Type I loads typically have two working states, on and off, making them suitable for most household appliances like light bulbs, toasters, and water pumps. Conversely, Type II loads encompass multi-state equipment with a limited number of operating states, encompassing washing machines, stove burners, and others. Air conditioners, for instance, have multiple working states such as heating mode and ventilation mode, which can easily be mistaken for hair dryers and fans. Refrigerators consist of a cooling fan, compressor motor, and electronic circuits, making them susceptible to misprediction. Washing machines, on the other hand, have multiple working states such as washing and drying. Effectively representing these three appliances through a multi-state model remains an open problem in the field He et al. (2016). Therefore, our method is more suitable for Type I loads. In Figure 6, the F1_macro of the proposed algorithm is 0.9603, the ADSH is 0.9413, and the CNN is 0.9214. The proposed method has state-of-the-art load identification results.
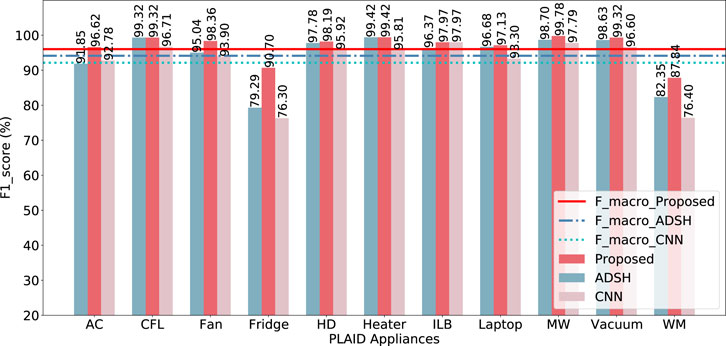
FIGURE 6. The F1-score (%) for appliances of the PLAID dataset.
The results of the proposed method on the PLAID dataset, utilizing a 16-bit encoding scheme, are presented in Table 2. The table showcases the appliance labels alongside their corresponding 16-bit encoded outcomes, arranged from left to right. Each distinct appliance is transformed into a unique binary hash code, which serves as a crucial foundation for appliance identification. By evaluating the Hamming distance between these hash codes, we can ascertain the appliance’s class. The Table demonstrates that the Hamming distance between different appliance codes is maximized, indicating a substantial number of differing bits in the hash code for distinct appliances. Conversely, the encoding results for the same appliance are either identical or exhibit only a few differing bits. This characteristic is also reflected in the color of the encoded bits. However, it should be noted that a single appliance label does not necessarily correspond to a sole encoding result. Notably, “fridge,” “air conditioners” and “washing machines” have multiple hash codes, as the trajectory shape of a load may fluctuate due to noise or other factors. In other words, a load does not exclusively correspond to one V-I trajectory. The encoding of such appliances into multiple similar hash codes effectively prevents identification errors. In conclusion, this approach resolves the curse of dimensionality issue associated with high-dimensional features, enhancing the method’s stability. Consequently, even when the V-I trajectory image of an appliance deviates due to fluctuations, the algorithm maintains a high level of accuracy in recognizing the appliance.
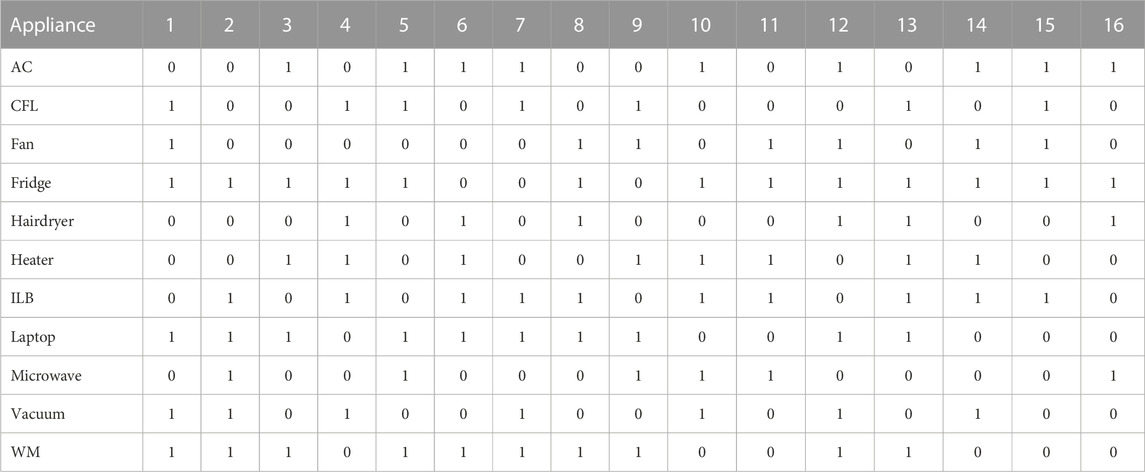
TABLE 2. The 16-bits hash code of different appliances.
In order to verify the identification results of the load when the model uses different hash code lengths, we use 8-bit, 16-bit, 32-bit, 64-bit, and 128-bit hash codes to identify the load, and compare it with the ADSH method. The experimental results are shown in Table 3, using different editing digits, the load identification results of the proposed method are all higher than the ADSH method. Longer encoding lengths generally provide better representations of V-I trajectory images, as they capture the details and features of V-I trajectory images more accurately. However, increasing the encoding length leads to increased computational and storage requirements, and also increases the computational complexity of image retrieval for V-I trajectories. The choice of encoding length requires a trade-off between accuracy, computational efficiency, and storage overhead. A shorter encoding length can provide higher computational and storage efficiency, but may result in information loss and lower retrieval accuracy of V-I trajectory image representation. Longer encoding lengths can provide more accurate image representations of V-I trajectories, but may increase computational and storage overhead. It can be seen from the table that as the code length increases, the load identification results will increase. When the code length is greater than 16 bits, the load identification effect does not increase significantly. Considering the balance between computational complexity and load identification results, We can actually use 16-bit encoding length to identify the V-I trajectory of the load. All in all, the longer the encoding length is not necessarily the better, the selection of encoding length needs to consider the accuracy, computing efficiency and storage overhead and other factors according to the specific situation.
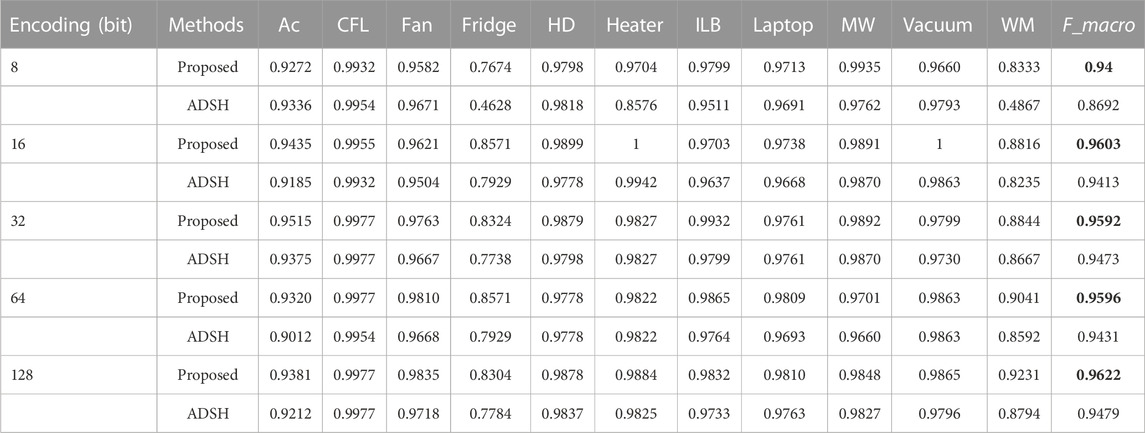
TABLE 3. The appliance identification performance of the proposed method is compared with that of ADSH method under different hash coding lengths.
In this paper, we introduce a novel hash technique for retrieving V-I trajectory images employing deep learning. The deep learning architecture acquires effective image depiction through point supervision. Moreover, the V-I trajectory image remains steady during appliance stable operation, rendering it suitable for substantial-scale image retrieval approaches for appliance identification. Furthermore, we incorporate a fresh similarity metric that integrates top-level data into the distance computation to retrieve similar instances of the queried V-I images. Empirical findings validate the superiority of our approach over the cutting-edge methodologies, affirming its swift and precise appliance identification capabilities.
Publicly available datasets were analyzed in this study. This data can be found here: http://plaidplug.com.
XiL: Writing–original draft. XuL: Software, Validation, Writing–review and editing. AZ: Methodology, Formal Analysis, Writing–original draft. HC: Writing–review and editing. JD: Supervision, Data curation, Writing–review and editing.
The author(s) declare financial support was received for the research, authorship, and/or publication of this article. This work is partly supported by National Key R&D Program (2022YFB2403800), the Science and technology projects from State Grid Corporation (5400-202255274A-2-0-XG).
This is a short text to acknowledge the contributions of specific colleagues, institutions, or agencies that aided the efforts of the authors.
The authors declare that the research was conducted in the absence of any commercial or financial relationships that could be construed as a potential conflict of interest.
All claims expressed in this article are solely those of the authors and do not necessarily represent those of their affiliated organizations, or those of the publisher, the editors and the reviewers. Any product that may be evaluated in this article, or claim that may be made by its manufacturer, is not guaranteed or endorsed by the publisher.
Ahmed, S., and Bons, M. (2020). “Edge computed nilm: a phone-based implementation using mobilenet compressed by tensorflow lite,” in Proceedings of the 5th International Workshop on Non-Intrusive Load Monitoring, New York, NY, USA, November, 2020, 44–48. doi:10.1145/3427771.3427852
Athanasiadis, C. L., Papadopoulos, T. A., and Doukas, D. I. (2021). Real-time non-intrusive load monitoring: a light-weight and scalable approach. Energy Build. 253, 111523. doi:10.1016/j.enbuild.2021.111523
Balletti, M., Piccialli, V., and Sudoso, A. M. (2022). Mixed-integer nonlinear programming for state-based non-intrusive load monitoring. IEEE Trans. Smart Grid 13, 3301–3314. doi:10.1109/tsg.2022.3152147
Barra, S., Carta, S. M., Corriga, A., Podda, A. S., and Recupero, D. R. (2020). Deep learning and time series-to-image encoding for financial forecasting. IEEE/CAA J. Automatica Sinica 7, 683–692. doi:10.1109/jas.2020.1003132
Bonfigli, R., Principi, E., Fagiani, M., Severini, M., Squartini, S., and Piazza, F. (2017). Non-intrusive load monitoring by using active and reactive power in additive factorial hidden markov models. Appl. Energy 208, 1590–1607. doi:10.1016/j.apenergy.2017.08.203
Cavalca, D. L., and Fernandes, R. A. (2020). “Recurrence plots and convolutional neural networks applied to nonintrusive load monitoring,” in Proceedings of the 2020 IEEE Power and Energy Society General Meeting (PESGM), Montreal, QC, Canada, August, 2020, 1–5.
Chen, J., Wang, X., Zhang, X., and Zhang, W. (2022). Temporal and spectral feature learning with two-stream convolutional neural networks for appliance recognition in nilm. IEEE Trans. Smart Grid 13, 762–772. doi:10.1109/tsg.2021.3112341
Chen, J.-H., and Tsai, Y.-C. (2020). Encoding candlesticks as images for pattern classification using convolutional neural networks. Financ. Innov. 6, 26–19. doi:10.1186/s40854-020-00187-0
Chen, S., Zhao, B., Zhong, M., Luan, W., and Yu, Y. (2023). Nonintrusive load monitoring based on self-supervised learning. IEEE Trans. Instrum. Meas. 72, 1–13. doi:10.1109/tim.2023.3246504
Chiş, A., Rajasekharan, J., Lunden, J., and Koivunen, V. (2016). “Demand response for renewable energy integration and load balancing in smart grid communities,” in Proceedings of the 2016 24th European Signal Processing Conference (EUSIPCO), Budapest, Hungary, August, 2016, 1423–1427.
Chowdhury, D., and Hasan, M. M. (2019). “Non-intrusive load monitoring using ensemble empirical mode decomposition and random forest classifier,” in Proceedings of the International Conference on Digital Image and Signal Processing (DISP), Oxford, UK, December, 2019, 29–30.
Çimen, H., Çetinkaya, N., Vasquez, J. C., and Guerrero, J. M. (2021). A microgrid energy management system based on non-intrusive load monitoring via multitask learning. IEEE Trans. Smart Grid 12, 977–987. doi:10.1109/tsg.2020.3027491
De Baets, L., Develder, C., Dhaene, T., Deschrijver, D., Gao, J., and Berges, M. (2017). “Handling imbalance in an extended plaid,” in Proceedings of the 2017 Sustainable Internet and ICT for Sustainability (SustainIT), Funchal, Portugal, December, 2017.
De Baets, L., Ruyssinck, J., Develder, C., Dhaene, T., and Deschrijver, D. (2018). Appliance classification using vi trajectories and convolutional neural networks. Energy Build. 158, 32–36. doi:10.1016/j.enbuild.2017.09.087
Dennis, K. (2015). Environmentally beneficial electrification: electricity as the end-use option. Electr. J. 28, 100–112. doi:10.1016/j.tej.2015.09.019
Elma, O., and Selamoğullar, U. S. (2017). “A survey of a residential load profile for demand side management systems,” in Proceedings of the 2017 IEEE International Conference on Smart Energy Grid Engineering (SEGE), Oshawa, ON, Canada, August, 2017, 85–89.
Faustine, A., Pereira, L., and Klemenjak, C. (2021). Adaptive weighted recurrence graphs for appliance recognition in non-intrusive load monitoring. IEEE Trans. Smart Grid 12, 398–406. doi:10.1109/tsg.2020.3010621
Ghosh, S., Chatterjee, A., and Chatterjee, D. (2021). An improved load feature extraction technique for smart homes using fuzzy-based nilm. IEEE Trans. Instrum. Meas. 70, 1–9. doi:10.1109/tim.2021.3095093
Gopinath, R., and Kumar, M. (2023). Deepedge-nilm: a case study of non-intrusive load monitoring edge device in commercial building. Energy Build. 294, 113226. doi:10.1016/j.enbuild.2023.113226
Han, Y., Li, K., Feng, H., and Zhao, Q. (2022). Non-intrusive load monitoring based on semi-supervised smooth teacher graph learning with voltage–current trajectory. Neural Comput. Appl. 34, 19147–19160. doi:10.1007/s00521-022-07508-7
Han, Y., Li, K., Wang, C., Si, F., and Zhao, Q. (2023). Unknown appliances detection for non-intrusive load monitoring based on conditional generative adversarial networks. IEEE Trans. Smart Grid 14, 4553–4564. doi:10.1109/tsg.2023.3261271
Han, Y., Xu, Y., Huo, Y., and Zhao, Q. (2021). Non-intrusive load monitoring by voltage–current trajectory enabled asymmetric deep supervised hashing. IET Generation, Transm. Distribution 15, 3066–3080. doi:10.1049/gtd2.12242
Hart, G. W. (1992). Nonintrusive appliance load monitoring. Proc. IEEE 80, 1870–1891. doi:10.1109/5.192069
Hassan, T., Javed, F., and Arshad, N. (2014). An empirical investigation of vi trajectory based load signatures for non-intrusive load monitoring. IEEE Trans. Smart Grid 5, 870–878. doi:10.1109/tsg.2013.2271282
He, D., Lin, W., Liu, N., Harley, R. G., and Habetler, T. G. (2013). Incorporating non-intrusive load monitoring into building level demand response. IEEE Trans. Smart Grid 4, 1870–1877. doi:10.1109/tsg.2013.2258180
He, J., Liu, J., Zhang, Z., Chen, Y., Liu, Y., Khoussainov, B., et al. (2023). Msdc: exploiting multi-state power consumption in non-intrusive load monitoring based on a dual-cnn model. https://arxiv.org/abs/2302.05565#:∼:text=11%20Feb%202023%5D-,MSDC%3A%20Exploiting%20Multi%2DState%20Power%20Consumption%20in%20Non%2Dintrusive,on%20A%20Dual%2DCNN%20Model&text=Non%2Dintrusive%20load%20monitoring%20(NILM,of%20blind%20source%20separation%20tasks.
He, K., Stankovic, L., Liao, J., and Stankovic, V. (2018). Non-intrusive load disaggregation using graph signal processing. IEEE Trans. Smart Grid 9, 1739–1747. doi:10.1109/tsg.2016.2598872
Jia, D., Li, Y., Du, Z., Xu, J., and Yin, B. (2021). Non-intrusive load identification using reconstructed voltage–current images. IEEE Access 9, 77349–77358. doi:10.1109/access.2021.3082432
Kelly, J., and Knottenbelt, W. (2016). Does disaggregated electricity feedback reduce domestic electricity consumption? a systematic review of the literature. https://arxiv.org/abs/1605.00962#:∼:text=version%2C%20v2)%5D-,Does%20disaggregated%20electricity%20feedback%20reduce%20domestic%20electricity%20consumption,systematic%20review%20of%20the%20literature&text=We%20examine%2012%20studies%20on,across%20these%20studies%20is%204.5%25.
Kohavi, R., (1995). A study of cross-validation and bootstrap for accuracy estimation and model selection. Ijcai Montr. Can. 14, 1137–1145.
Kong, W., Dong, Z. Y., Hill, D. J., Ma, J., Zhao, J., and Luo, F. (2018). A hierarchical hidden markov model framework for home appliance modeling. IEEE Trans. Smart Grid 9, 3079–3090. doi:10.1109/tsg.2016.2626389
Kyrkou, L., Nalmpantis, C., and Vrakas, D. (2019). “Imaging time-series for nilm,” in Engineering Applications of Neural Networks: 20th International Conference, EANN 2019, Xersonisos, Crete, Greece, May, 2019, 188–196.
Le, T. T. H., Heo, S., and Kim, H. (2021). Toward load identification based on the hilbert transform and sequence to sequence long short-term memory. IEEE Trans. Smart Grid 12, 3252–3264. doi:10.1109/tsg.2021.3066570
Lee, D., and Cheng, C.-C. (2016). Energy savings by energy management systems: a review. Renew. Sustain. Energy Rev. 56, 760–777. doi:10.1016/j.rser.2015.11.067
Lin, Y.-H., and Tsai, M.-S. (2014). Non-intrusive load monitoring by novel neuro-fuzzy classification considering uncertainties. IEEE Trans. Smart Grid 5, 2376–2384. doi:10.1109/tsg.2014.2314738
Liu, B., Luan, W., and Yu, Y. (2017). Dynamic time warping based non-intrusive load transient identification. Appl. energy 195, 634–645. doi:10.1016/j.apenergy.2017.03.010
Liu, C., Ma, J., Tang, X., Liu, F., Zhang, X., and Jiao, L. (2021). Deep hash learning for remote sensing image retrieval. IEEE Trans. Geoscience Remote Sens. 59, 3420–3443. doi:10.1109/tgrs.2020.3007533
Liu, H., Wang, R., Shan, S., and Chen, X. (2016). “Deep supervised hashing for fast image retrieval,” in Proceedings of the IEEE conference on computer vision and pattern recognition, Las Vegas, NV, USA, June, 2016, 2064–2072.
Liu, H., Wu, H., and Yu, C. (2019). A hybrid model for appliance classification based on time series features. Energy Build. 196, 112–123. doi:10.1016/j.enbuild.2019.05.028
Liu, Y., Wang, X., and You, W. (2019). Non-intrusive load monitoring by voltage–current trajectory enabled transfer learning. IEEE Trans. Smart Grid 10, 5609–5619. doi:10.1109/tsg.2018.2888581
Makonin, S., Popowich, F., Bajić, I. V., Gill, B., and Bartram, L. (2016). Exploiting hmm sparsity to perform online real-time nonintrusive load monitoring. IEEE Trans. smart grid 7, 2575–2585. doi:10.1109/tsg.2015.2494592
Meziane, M. N., Ravier, P., Lamarque, G., Abed-Meraim, K., Le Bunetel, J.-C., and Raingeaud, Y.(2015). “Modeling and estimation of transient current signals,” in 2015 23rd European Signal Processing Conference (EUSIPCO), Nice, France, August, 2015, 1960–1964.
Parson, O., Ghosh, S., Weal, M., and Rogers, A. (2021). Non-intrusive load monitoring using prior models of general appliance types. Proc. AAAI Conf. Artif. Intell. 26, 356–362. doi:10.1609/aaai.v26i1.8162
Rahimpour, A., Qi, H., Fugate, D., and Kuruganti, T. (2017). Non-intrusive energy disaggregation using non-negative matrix factorization with sum-to-k constraint. IEEE Trans. Power Syst. 32, 4430–4441. doi:10.1109/tpwrs.2017.2660246
Sadeghianpourhamami, N., Ruyssinck, J., Deschrijver, D., Dhaene, T., and Develder, C. (2017). Comprehensive feature selection for appliance classification in nilm. Energy Build. 151, 98–106. doi:10.1016/j.enbuild.2017.06.042
Sezer, O. B., and Ozbayoglu, A. M. (2018). Algorithmic financial trading with deep convolutional neural networks: time series to image conversion approach. Appl. Soft Comput. 70, 525–538. doi:10.1016/j.asoc.2018.04.024
Tabatabaei, S. M., Dick, S., and Xu, W. (2017). Toward non-intrusive load monitoring via multi-label classification. IEEE Trans. Smart Grid 8, 26–40. doi:10.1109/tsg.2016.2584581
Tian, X., Ng, W. W., and Xu, H. (2023). Deep incremental hashing for semantic image retrieval with concept drift. IEEE Trans. Big Data 9, 1102–1115. doi:10.1109/tbdata.2022.3233457
Wang, A. L., Chen, B. X., Wang, C. G., and Hua, D. (2018). Non-intrusive load monitoring algorithm based on features of v–i trajectory. Electr. Power Syst. Res. 157, 134–144. doi:10.1016/j.epsr.2017.12.012
Wang, Z., and Oates, T. (2015). Imaging time-series to improve classification and imputation. https://arxiv.org/abs/1506.00327.
Yan, C., Gong, B., Wei, Y., and Gao, Y. (2021). Deep multi-view enhancement hashing for image retrieval. IEEE Trans. Pattern Analysis Mach. Intell. 43, 1445–1451. doi:10.1109/tpami.2020.2975798
Yu, B., Tian, Y., and Zhang, J. (2015). A dynamic active energy demand management system for evaluating the effect of policy scheme on household energy consumption behavior. Energy 91, 491–506. doi:10.1016/j.energy.2015.07.131
Yu, Y., Qin, C., and Luan, W. (2014). Expatiation on the basic ideas of smart grid. Sci. China Inf. Sci. 44, 693–701. doi:10.1360/N112013-00232
Zhai, H., Lai, S., Jin, H., Qian, X., and Mei, T. (2021). Deep transfer hashing for image retrieval. IEEE Trans. circuits Syst. Video Technol. 31, 742–753. doi:10.1109/tcsvt.2020.2991171
Zhang, C., Zhong, M., Wang, Z., Goddard, N., and Sutton, C. (2018). “Sequence-to-point learning with neural networks for non-intrusive load monitoring,” in Proceedings of the AAAI conference on artificial intelligence, New Orleans Louisiana, USA, February, 2018. doi:10.1609/aaai.v32i1.11873Proc. AAAI Conf. Artif. Intell.32
Zhang, R., Luan, W., Liu, B., and Zhong, M. (2021). “A lightweight neural network for energy disaggregation employing depthwise separable convolution,” in Proceedings of the 2021 IEEE Sustainable Power and Energy Conference (iSPEC), Nanjing, China, December, 2021, 4109–4114. doi:10.1109/iSPEC53008.2021.9735713
Keywords: non-intrusive load monitoring, V-I trajectory, similarity preserving hashing, feature learning, hash-code learning
Citation: Liu X, Liu X, Zheng A, Chen H and Dou J (2023) Similarity preserving hashing for appliance identification based on V-I trajectory. Front. Energy Effic. 1:1302121. doi: 10.3389/fenef.2023.1302121
Received: 26 September 2023; Accepted: 02 November 2023;
Published: 14 November 2023.
Edited by:
Bo Liu, Tianjin University, ChinaReviewed by:
Lingling Wang, Shanghai Jiao Tong University, ChinaCopyright © 2023 Liu, Liu, Zheng, Chen and Dou. This is an open-access article distributed under the terms of the Creative Commons Attribution License (CC BY). The use, distribution or reproduction in other forums is permitted, provided the original author(s) and the copyright owner(s) are credited and that the original publication in this journal is cited, in accordance with accepted academic practice. No use, distribution or reproduction is permitted which does not comply with these terms.
*Correspondence: Xingqi Liu, eGluZ3FpMUAxMzkuY29t
Disclaimer: All claims expressed in this article are solely those of the authors and do not necessarily represent those of their affiliated organizations, or those of the publisher, the editors and the reviewers. Any product that may be evaluated in this article or claim that may be made by its manufacturer is not guaranteed or endorsed by the publisher.
Research integrity at Frontiers
Learn more about the work of our research integrity team to safeguard the quality of each article we publish.