 Wenlong Yin
 Wenjie Zhang
94% of researchers rate our articles as excellent or good
Learn more about the work of our research integrity team to safeguard the quality of each article we publish.
Find out more
REVIEW article
Front. Energy Effic., 01 September 2023
Sec. Energy Efficiency in Buildings and Urban Environments
Volume 1 - 2023 | https://doi.org/10.3389/fenef.2023.1219776
This article is part of the Research TopicEnergy-Efficient and Energy-Flexible Buildings Towards Net-Zero Carbon EmissionView all 6 articles
The carbon emissions from the building sector are one of the major sources of carbon emissions globally. In order to address global climate change, the Chinese government has proposed the 3,060 dual carbon goals. In this context, the government urgently needs a predictive model for calculating and forecasting the energy consumption and carbon emissions in the construction industry to help formulate decarbonization strategies. The review and analysis of a predictive model for the current total carbon dioxide emissions in the Chinese construction sector can provide a basis for calculating and predicting carbon emissions, as well as for formulating corresponding emission reduction policies. This article analyzes the Carbon emission factor and the methods of obtaining building energy consumption data, which are crucial for predicting carbon emissions. Furthermore, it examines the predictive models for total CO2 emissions in the Chinese construction sector and summarizes their respective advantages and limitations. Finally, it highlights the shortcomings of existing research in terms of carbon emission factors, energy consumption data, and accounting scope, while suggesting future research directions.
The various problems brought about by global warming have gradually begun to attract people’s attention. There is evidence to suggest that the global surface average temperature rose by 8.7°C between 2006 and 2015 (IPCC, 2019), compared to the period of 1850–1900. In 2020, the global average temperature increased by 1.2°C compared to the period of 1850–1900, making it one of the three hottest years on record worldwide (WMO, 2021). These data serve as a stark reminder of the severity of global climate change. Global warming has already caused significant disruptions to human society and ecosystems (Mihiretu et al., 2021; Jakučionytė-Skodienėand Liobikienė, 2021). One of the major contributors to global climate change is the emission of greenhouse gases, CO2 being a prominent example. As a result, reducing carbon emissions has become a global consensus (Pokhrel et al., 2021). Since the signing of the Paris Agreement in 2015, countries have significantly raised their long-term carbon emission reduction targets. Currently, more than 140 countries and regions worldwide have pledged their respective carbon neutrality targets (ECIU, 2023). In these countries, such as the European Union, the USA, Japan, and South Africa, the CO2 emissions have already peaked and are transitioning towards the goal of carbon neutrality. However, in October 2021, “the COP 26 UN Climate Change Conference” pointed out that if the current carbon emission reduction commitments of all countries are fully realized, the global temperature may rise by 2.2°C (UNEP, 2021) by the end of this century. The current progress is still not consistent with the objectives of the Paris climate agreement.
China is currently experiencing a period of rapid economic development, which has brought about issues of energy consumption and CO2 emissions. In 2005, China’s carbon emissions accounted for 18% of the global total. By 2017, this figure had increased to 27.2% of the global total. According to the 70th BP Energy Outlook, in 2020, China will account for 26.1% of global primary energy consumption and 30.7% of total global carbon emissions, far exceeding other countries (BP, 2021). Currently, China is facing dual pressures of rising fossil energy consumption due to economic growth and the need for energy conservation and emission reduction due to climate change. Nevertheless, China has set a dual carbon target to peak carbon emissions by 2030 and achieve carbon neutrality by 2060, in an effort to achieve sustainable development of the economy and environment.
The construction sector plays a significant role in both energy consumption and the direct and indirect generation of carbon emissions, accounting for approximately 40% of the global total carbon emissions (Mata et al., 2020; Robati et al., 2021). In line with the rapid pace of urbanization, the completed area of housing construction in China has witnessed a continuous increase. Moreover, with the increasing demand for indoor comfort and living standards, there has been a corresponding increase in the energy consumption intensity per unit area. This trend has consequently led to a rapid escalation in building energy consumption and carbon emissions. In 2019, the energy consumption of China’s building operation phase accounted for 21.2% of the total energy consumption of the whole society, and the share of carbon emissions reached 21.6% of the total carbon emissions. (China Association of Building Energy Efficiency, 2021; China Building Energy Efficiency Association, 2021). Therefore, whether China can achieve carbon peaking and carbon neutrality largely depends on the energy conservation and emission reduction efforts of the construction sector. Accurate calculation and reasonable prediction of building energy consumption and carbon emissions can provide a crucial foundation for formulating emission reduction strategies in the field of construction, holding significant importance for achieving the dual carbon goals in the building sector.
In China, buildings are classified into residential and public categories based on their usage characteristics. Residential buildings are further divided into urban and rural residences according to economic development levels. Due to the vast territory and climate differences in China, separate calculations for centralized heating in northern urban areas have been conducted. To guide building design, five climatic zones have been established based on temperature: Severely Cold, Cold, Hot summer and Cold Winter, Hot summer and Warm Winter, and Temperate Areas as shown in Figure 1. These zones help determine building envelope structures and air conditioning parameters for each area. However, this temperature-based classification does not consider the increasing urban heat island effect on building energy consumption, especially air conditioning. Therefore, it is crucial to further subdivide the climate zones.
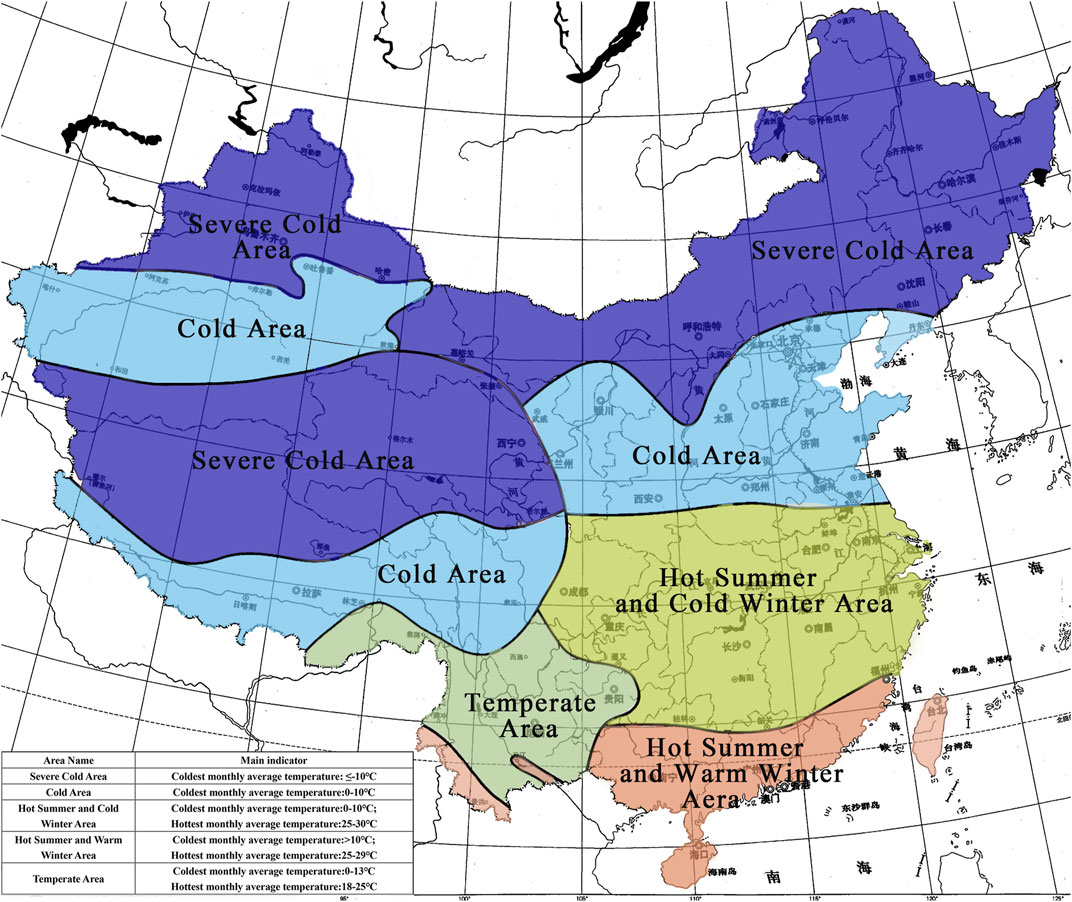
FIGURE 1. China building climate zone map.
Building energy use and CO2 emissions are mainly concentrated in the construction and operation phases, with a larger proportion in the operation phase (Azari and Abbasabadi, 2018). The “Classification and presentation of building energy use data (JG/T 358-2012)” explicitly defines building energy use as the operational energy use during the occupancy period of the building, including the energy consumption for maintaining the building environment and various activities inside the building (Ministry of Housing and Urban-Rural Development of the People’s Republic of China, 2012). During the operation of buildings, the energy required to maintain indoor environmental conditions includes the energy consumed by systems such as lighting, space cooling and heating. In addition, various indoor activities such as office work, teaching, cooking, and hot water use also consume energy (Cheng et al., 2018). Carbon emissions resulting from burning fossil fuels for heating, cooking, and hot water are considered direct carbon emissions. Carbon emissions resulting from electricity consumption for lighting, air conditioning, and electrical equipment are classified as indirect carbon emissions. Additionally, in northern urban areas with centralized heating systems, carbon emissions generated by cogeneration and coal-fired or gas-fired boilers are also considered indirect carbon emissions, with carbon emissions from cogeneration systems allocated based on the output of electricity and heat.
Studies on CO2 emission calculation methods can be categorized into two scales: micro and macro. Micro-scale carbon emission calculation for buildings mainly involves measuring individual buildings to evaluate their carbon emission levels and green building standards. Examples of such standards include the BEES standard in the United States, which uses ISO4044:2006 as its fundamental framework (NIST, 2018); the DGNB standard in Germany (DGNB, 2018); the domestic Tsinghua BEPAS (Zhang et al., 2006); and the “Building Carbon Emission Calculation Standard (GB/T51366-2019)” in China (Ministry of Housing and Urban-Rural Development of the People’s Republic of China, 2019), etc. Macroscopic calculation of building carbon emissions primarily pertains to the carbon emissions produced by buildings at the provincial, city, regional, national, continental, or even global level. The purpose of this approach is to assess the overall energy consumption and carbon emissions of buildings within a specific region and offer recommendations for the formulation of energy-efficient and emission-reducing policies. Examples of such models include the European ECCABS model (Mata et al., 2013), the RE-BUILDS model (Sandberg et al., 2016; Sandberg et al., 2021) and the American Scout model (Langevin et al., 2019) etc. The most commonly used carbon emission calculation methods, which can be applied at both micro and macro levels, include the Emission-Factor Approach, Mass-Balance Approach, and Experiment Approach (Liu et al., 2014). The strengths and weaknesses of these three calculation methods are presented in Table 1. The Emission-Factor Approach is the most widely used method at the macro level, as it estimates carbon emissions using activity data × emission factor. In the building operation phase, activity data refers to the emissions generated by energy use and other activities, while the Carbon Emission Factor mainly comprises the carbon emission factor associated with energy usage. At the macro level, the Emission-Factor Approach is a frequently employed method for estimating carbon emissions, which relies on activity data × emission factor. During the building operation phase, activity data pertains to the emissions produced by energy consumption and other activities, whereas the Carbon Emission Factor mainly encompasses the emission factor linked with energy use. The energy carbon emission factor and energy consumption data are two crucial parameters of building carbon emission prediction models, directly influencing the accuracy and rationality of building carbon emission results.
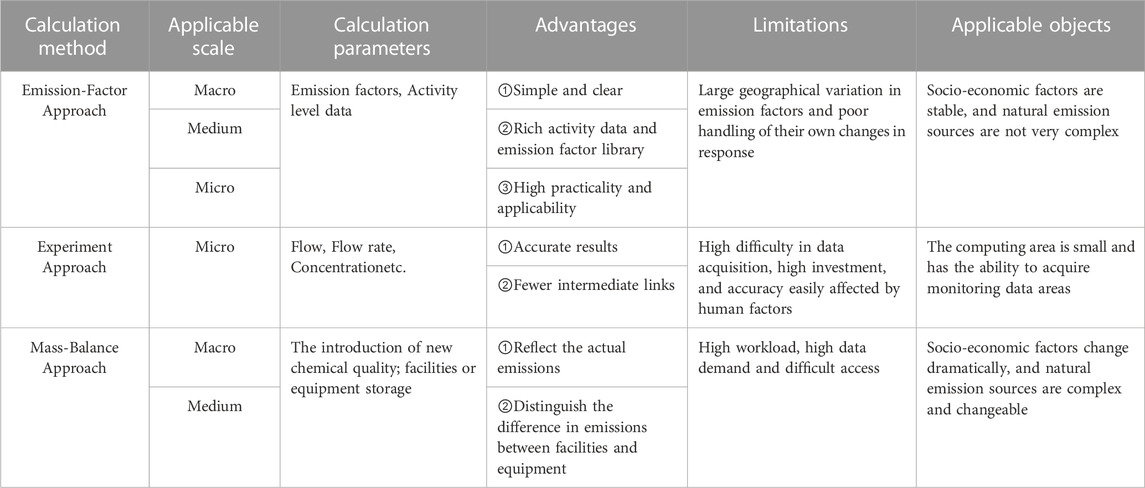
TABLE 1. Comparison of major carbon emission calculation methods.
In terms of study objectives related to carbon emissions, developed countries primarily focus on developing measures and technologies to reduce CO2 emissions at the macro scale. This involves studying the complex relationship between carbon emissions, economic development, and energy use. Studies on CO2 emissions in China has primarily focused on determining the timing and projections for carbon emissions peaking, exploring pathways to achieve this peak, and understanding the impact of reaching peak targets on the country’s economy and industry. CO2 emissions modeling in the building sector can be broadly categorized into three methods: bottom-up, top-down and hybrid approaches, which are utilized for data acquisition and prediction study purposes (Swan and Ugursal, 2009; Kavgic et al., 2010). The framework for predicting energy consumption and CO2 emissions in the Chinese building sector is shown in Figure 2.
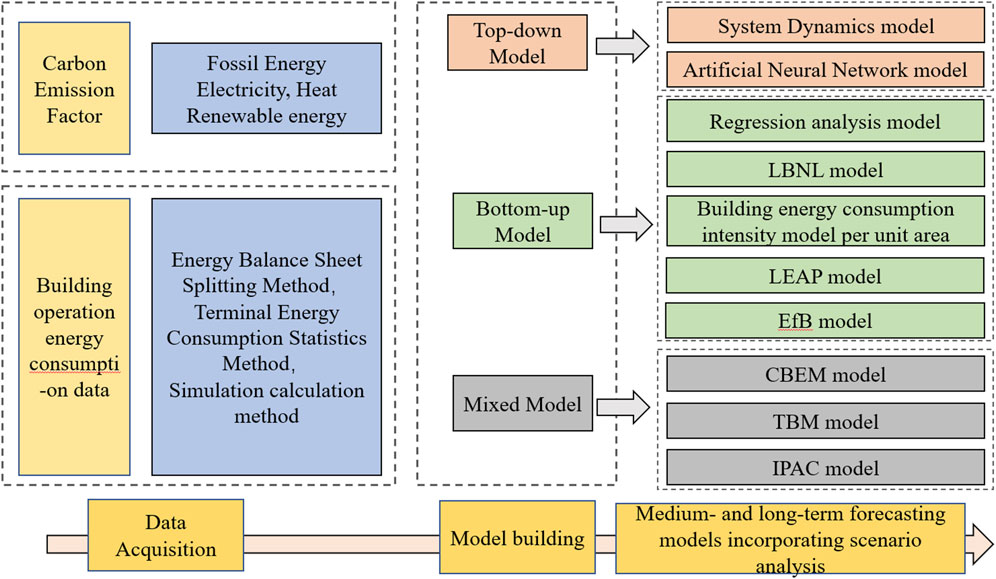
FIGURE 2. Model framework for building energy consumption and CO2 emissions in China.
Currently, there are numerous studies on predicting the total carbon emissions and emission reduction pathways in the civil building sector in China. These studies employ diverse modeling and calculation methods, and the calculation scope varies significantly. However, there is a lack of comprehensive literature reviews specifically focusing on this subject, resulting in a lack of standardized calculation criteria. In the context of carbon neutrality goals, Pan et al. (2021) classified carbon emission calculation models into two categories: bottom-up and top-down approaches. She conducted a comprehensive analysis of carbon emission models primarily used in European and American countries. Furthermore, she proposed recommendations for controlling the total carbon emissions and developing decarbonization pathways in the Chinese building sector using the China building carbon emission model (CBCEM). And his colleagues conducted a comprehensive analysis and review of carbon accounting methods and factors influencing carbon emissions in the Chinese building sector. They also examined the strengths and weaknesses of the IPAT series models, index decomposition analysis methods, and structural decomposition analysis methods in the analysis of carbon emission factors. However, the former review primarily focuses on the analysis of carbon emission calculation models used in Europe and America, lacking a comprehensive overview of China’s current practices in calculating and predicting building carbon emissions. The latter review, on the other hand, places emphasis on the analysis of research on carbon emission influencing factors. This study provides a comprehensive literature review of research achievements in the calculation and prediction of carbon emissions in the Chinese civil building sector. It explores the acquisition of calculation parameters for building carbon emissions and systematically summarizes current prediction models for building carbon emissions, considering aspects such as data collection and modeling approaches. It conducts in-depth analysis of the application scope and strengths and weaknesses of various models, aiming to offer valuable insights for further optimizing emission reduction efforts in the building sector.
This paper presents a 3-stage approach for predicting total carbon emissions in China’s civil buildings, as illustrated in Figure 3. The first stage is the plan review, where existing carbon emission stages and key calculation points are examined to establish the research question and review direction. The second stage is the implementation, which involves searching and organizing relevant literature from databases and websites like Web of Science, CNKI, Science Direct, IEEE, and Google Scholar. Keywords are formulated and associated to retrieve relevant documents, followed by organizing and screening them. The third stage is the aggregation, where the literature is studied, themes are summarized and organized, and the structure of the review is determined for completion.
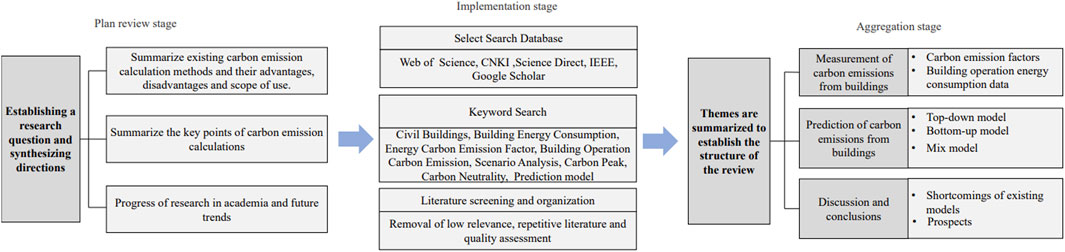
FIGURE 3. Methodology and process of the review. Comparison of CBEM and TBM model frameworks.
Buildings consume a considerable amount of energy during their operation, especially for heating, air conditioning, and lighting systems. However, the production and use of traditional energy sources such as fossil fuels and electricity often result in the emission of greenhouse gases like CO2. Therefore, the most crucial aspect of calculating and predicting carbon emissions is obtaining data on building energy consumption. Subsequently, by incorporating another important parameter, the energy carbon emission coefficient, it becomes possible to assess the carbon emissions in the building sector. Here, we have summarized the methods for obtaining these two significant parameters.
The energy use of buildings during operation mainly consists of fossil fuels, thermal energy, electricity, and renewable energy, and the energy carbon emission factor during this stage mainly refers to these types of energy. Many domestic and international institutions have established corresponding databases of CO2 emission factors for major fossil fuels and electricity. These institutions include the Intergovernmental Panel on Climate Change (IPCC, 1996), International Energy Agency (IEA, 2023), World Resources Institute (Song et al., 2013), US Department of Energy Information Administration (EIA, 2011), as well as domestic institutions such as the Energy Research Institute of national development and Reform Commission (2003) and the Carbon Emissions and Environmental Big Data Research Institute of Fudan University (Energy Research Center, 2014). In 1996, the IPCC compiled the “Guidelines for National Greenhouse Gas Inventories”, which established a basic consistent range for estimating greenhouse gas emissions. The default carbon emission factors and calculation methods for various types of energy provided in its “2006 IPCC G. for National Greenhouse Gas Inventories” (Eggleston et al., 2006; IPCC, 2019) have gained extensive acknowledgement and acceptance in the field of climate change research, both at national and international levels. These methods provide a standardized approach for estimating greenhouse gas emissions associated with different energy sources and have been widely utilized by researchers and policymakers alike. The specific calculation method is as follows:
Where: i is types of fossil energy;
The regional distinction in carbon emission factors often leads to discrepancies in the calculation results among various institutions, both domestic and international. Typically, local institutions exhibit greater accuracy in estimating emissions within their respective regions, while national institutions perform better at the national level, and international institutions generally exhibit lower accuracy.
In China, carbon emission factors for fossil fuels are primarily derived from the “G. for Provincial Greenhouse Gas Inventories (Trial)” which are developed by the Climate Department of the National Development and Reform Commission (2011). The Guidelines are calculated on the IPCC calculation method and further analyzed and modified to suit the Chinese context. The CO2 emission factors per unit of heat for major fossil fuels in China provided in the “Calculation Standard for Carbon Emissions of Buildings (GB/T51366-2019)” (Ministry of Housing and Urban-Rural Development of the People’s Republic of China, 2019a) are derived from the carbon content per unit of heat and the carbon oxidation rate information provided in the Guidelines. In addition, information on the average low heating value of commonly used fossil fuels in China can be found in the “General Rules for Comprehensive Energy Calculation (GB/T2589-2020)” (State Administration for Market Regulation and Standardization Administration, 2020) and the “China Energy Statistical Yearbook” (Department of energy statistics, National Bureau of Statistics, 2010).
Electricity is categorized as a secondary energy source, and its carbon emission factor is predominantly determined by the method of generation. It is imperative to consider the annual distribution of electricity sources while estimating carbon emissions. With the increasing contribution of renewable energy in electricity generation, there has been a progressive decline in the carbon emissions per unit of electricity produced. China’s most authoritative electricity carbon emission factors come from the “2010 Average CO2 Emission Factors for China’s Regional and Provincial Power Grids” and the “2011 and 2012 Average CO2 Emission Factors for China’s Regional Power Grids” published by the Climate Department of the National Development and Reform Commission (NCSC, 2013; NCSC, 2014) which provide carbon emission factors for six major regional grids in China, namely, North, Northeast, East, Central, Northwest, and South China. Renewable energy sources like biomass and solar power have a carbon-neutral attribute, which means they do not release CO2 during their usage stage.
There is currently no unified official data on thermal carbon emission factors in China. Cai and Cai. (2019) proposed three methods for calculating thermal emission factors: 1) the thermal enterprise survey method, which calculates emissions based on actual survey data of carbon emissions and heat supply from thermal enterprises; 2) the energy balance method, which computes the emission factor by relating the total carbon emissions generated by different energy sources consumed in the building sector, as obtained from the energy balance table, to the physical quantity of heat supplied by thermal power plants; and 3) the emission intensity calculation method, which is calculated by considering the energy consumption intensity of different heating technologies, such as cogeneration, coal-fired boilers or gas-fired boilers, and the corresponding proportion of heating area for each technology.
Data on energy consumption during the operational phase of a building is essential for calculating building CO2 emissions and making future projections. Operational consumption data can be obtained through methods such as energy balance sheet splitting and terminal energy consumption survey method. As the social economy and the factors affecting buildings and their environment become increasingly diverse, the operating conditions of buildings are becoming more complex. However, the development of computer technology has greatly improved our ability to process data, enabling us to establish more complex models to accurately simulate building energy consumption. Generally speaking, these models can be categorized into White-box models, Black-box models, and Gray-box models.
In building energy simulation, a white-box model refers to a detailed model based on the internal details and parameters of the building system. This type of model requires understanding of the building construction, equipment configuration, material properties, and other internal information. A white-box model can describe the building system using physical principles, equations, data, etc., and design corresponding algorithms based on specific simulation goals. White-box models generally provide accurate results but require extensive input information and expertise (Zhang et al., 2022). To create a white-box model, various parameters such as building geometry, envelope structure, indoor and outdoor conditions, and internal loads of typical buildings (such as residential, schools, offices, and shopping malls) are considered. Building hourly simulation software, such as De ST, DOE-2, eQUEST, EnergyPlus, is used to calculate the hourly energy consumption of typical buildings, which allows for obtaining the energy intensity of various typical buildings. Liu et al. (2021) from Tsinghua University proposed a DE ST-based urban building energy consumption simulation platform (De ST-urban), which automatically generates De ST energy consumption models for urban buildings from city 3D geometric data. The De ST-urban platform retrieves building information from City GML city models and generates De ST input databases using typical building models. It also considers factors such as pedestrian behavior, envelope structure parameters, and meteorological data to calculate area ratio coefficients for building exteriors obstructed by surrounding buildings. This allowed the platform to model De ST energy consumption for various types of typical building architecture within the city. A simulation analysis was carried out by (Wen-qian et al., 2018) to determine the energy consumption of passive ultra-low energy buildings, using EnergyPlus software. Lu (2020) established an energy consumption model for a high-rise office building using the DesignBuilder software based on the EnergyPlus kernel. Through simulation experiments, they determined the relationship between design parameters and building energy consumption, providing theoretical support and data basis for related green and energy-saving designs.
A gray-box model in building energy simulation is a combination of white-box and black-box models, taking into account both the internal details of the building system and its overall behavior. The gray-box model abstracts the complexity of the building system to a certain extent, aiming to enhance simulation efficiency through simplification and approximation. It allows for adjusting the accuracy and complexity of the model as needed, striking a balance between simulation result accuracy and computational costs (Zhang et al., 2023). Zhu et al. (2011) developed a building energy consumption database using the urban building Geographic Information System (GIS) of Hangzhou, China, and utilized the data to perform a macro-level analysis of energy usage across various types of typical buildings in the city. For GIS technology, the key factor is to integrate building geographic and physical information, and match building basic information with energy consumption data. The Canadian mixed residential terminal energy consumption and carbon emission model CHREM (Pan et al., 2015) consists of a physical model and a neural network model, where the neural network model is used to estimate the annual electricity consumption and domestic hot water usage of household appliances and lighting, and the estimation of heating and cooling loads is completed by a detailed energy consumption model built through the FSPr software. Please help me check the translation.
In building energy simulation, a black-box model refers to a simplified model based on the overall behavior and performance of the building. It focuses on the relationship between inputs and outputs of the building system, without considering internal details. Black-box models typically use statistical methods, empirical formulas, or other simplification techniques to estimate the energy consumption of the building system. This type of model is suitable for quickly assessing the overall energy consumption trends of buildings but may not provide precise detailed information. However, this model has poor flexibility and is difficult to reflect the energy-saving effects of various measures. Liu et al. (2019b) evaluated the energy consumption growth rate of a city by using a multiple linear regression model which was built on statistics related to urban structure, city size and industrial agglomeration. Employing principal component analysis and fixed effects models, Su and Liao. (2015) examined the impact of size, structure, and industrial agglomeration on the energy consumption growth rate in eastern, central, and western Chinese cities, identifying significant variations across the regions. Using statistical data that included building energy use information, building geographic category information, and regional energy consumption data, Magoulès and Zhao (2016) developed a multiple linear regression model to predict the energy consumption of both electricity and natural gas.
The energy consumption disaggregation method based on energy balance tables mainly uses macro statistical data from energy balance tables to disaggregate energy consumption related to buildings, and is a top-down estimation method.
The International Energy Agency’s (IEA) Energy Balance Data Statistics system is commonly used abroad to classify end-use energy use. This system separates the building sector and includes commercial and public facilities as well as residential use in the building energy use (Liu et al., 2019b). However, in China, energy balance data is divided into three major industries and four sectors, including household consumption, without specific energy end-use categories. As a result, building energy consumption is dispersed among the four sectors (Wang, 2007). To address this issue, some experts and scholars have attempted to disaggregate building energy consumption from the energy balance table. They use “wholesale and retail, catering industry”, “other” and “household consumption” as the base for building energy consumption. Transportation energy consumption can be deducted from the tertiary industry and household sectors based on a certain proportion (Wang, 2009), or it can be estimated based on the number of various types of vehicles and their average fuel consumption (Ministry of Housing and Urban-Rural Development of the People’s Republic of China, 2010). Finally, the building energy use is obtained by adding the remaining energy consumption.
Incomplete statistics on the illegal production and non-commercial circulation channels of coal, as well as the coal consumption for heating in boiler rooms in small urban areas in northern China, have led to underestimated statistical data for heating, cooking, and domestic hot water consumption (Gu and Yu, 2011), which accounts for approximately 100 million tce (Tsinghua University Building Energy Conservation Research Center, 2009; Wang, 2009). Therefore, Wei-guang Cai from Chongqing University (Cai et al., 2017; Cai et al., 2020; Huo et al., 2018) and others used the energy balance table to adjust heating energy consumption after deducting transportation energy consumption, and included energy use of factories, office, and staff dormitories in the building and agriculture sectors that were not independently accounted for. They further disaggregated various types of fossil energy, electricity, and thermal energy consumption according to different energy sources, providing a data foundation for calculating building carbon emissions.
The terminal energy consumption survey method involves conducting surveys and collecting data on energy consumption habits of different regions and building types through questionnaires, visits, and other means. The collected data is then combined to derive building energy consumption statistics that can be utilized to estimate energy usage patterns for different building types within a region or country-wide.
China’s building energy consumption statistics began late. The most comprehensive survey in 1989 by Tu (1999) sampled and surveyed various building types in four cities along the Yangtze River and in northern heating areas. The collected data was then used to calculate the unit energy consumption levels of buildings in each city. Chen Shuqin and colleagues (Chen et al., 2007) proposed a statistical framework in 2007 for estimating energy consumption in residential buildings in China. The framework considers various factors, such as thermal climate zones, climate conditions, social conditions, and heating/cooling methods. It includes data on residential building characteristics, household information, energy-consuming devices, and energy consumption. Using this framework, forms were developed to collect and compile data on residential building energy use at the municipal, provincial, and national levels. Between 2006 and 2018, Tsinghua University (Tsinghua University Building Energy Conservation Research Center, 2018) conducted on-site surveys to gather information on the energy consumption of different types of buildings across China. The surveys covered building information, basic household information, living habits and energy usage patterns, and annual consumption of commercial and non-commercial energy in 24 provinces, municipalities, and autonomous regions, as well as residential energy consumption patterns and equipment usage in five typical cities including Beijing. These surveys also include the heating energy consumption per unit area in winter in some typical towns and cities in northern China. These statistics are currently widely accepted as energy consumption data.
Starting from 2007, the Ministry of Housing and Urban-Rural Development initiated the “Statistical System for Energy Consumption of Civil Buildings” in 23 Chinese cities (Editorial Team, 2012). The system involves a complete survey of government and large public buildings, while a segmented and stratified sampling method is used for other residential buildings to collect data on energy consumption for statistical analysis. In 2009, the Chinese government implemented a nationwide system of building energy statistics, the first coordinated effort in this area. However, the current system is still incomplete. The current plan has only released basic information on energy consumption statistics for large public buildings and government office buildings in 2012, including the number of statistical samples, energy consumption structure, and typical building energy use intensity (Liu et al., 2013). By 2021, the Ministry of Housing and Urban-Rural Development’s Technology and Industrialization Development Center (Fan et al., 2021) utilized data from the SSBECCB to ascertain the energy intensity of public buildings, urban residential buildings, and central heating systems in China. These data are combined with the floor area data to calculate the current energy consumption data for the operational phase of buildings in China.
Moreover, the Technology and Industrialization Development Center of the Ministry of Housing and Urban-Rural Development (Ding et al., 2017) has initiated a demonstration project in major cities such as Beijing, Tianjin, and Shenzhen for the energy consumption monitoring system in national government offices and large public buildings. By 2017, a relatively complete system had been formed, from software development and installation to data collection and transmission, to platform operation and management. The system had covered over 11,000 buildings and directly promoted the formulation of energy consumption quotas in some provinces and cities of China.
Among these methods, Energy balance sheet splitting method is easy to obtain data from authoritative sources, but due to the problem of statistical classification in China, different organizations have different selection ranges for building energy consumption, which leads to certain differences in the calculation results. Terminal energy consumption survey method requires extensive field research and visits to ensure that the data and models are as comprehensive and accurate as possible. The first three methods can calculate building energy consumption more accurately and easily with the help of calculation software, taking into account the details of the indoor environment and the operation of terminal equipment; meanwhile, by establishing different typical buildings and combining them with meteorological files, the energy consumption of buildings at different scales can be estimated, which is also the most applied method at present.
After obtaining the building operation energy use data and energy CO2 emission factors, different ideas can be used to build the building CO2 emission prediction model. To forecast building CO2 emissions in the medium to long term, specific mathematical models such as time series-based regression analysis, artificial neural networks, and system dynamics can be employed to fit historical data and make direct predictions. To forecast construction carbon emissions in China, it is necessary to take into account the impact of emission reduction policies at a macro level. Therefore, many models are supplemented with scenario analysis methods, which involve setting several possible scenarios to conduct qualitative analysis.
When the scenario analysis method is used for prediction, the building energy consumption or CO2 emission is usually calculated by the bottom-up, top-down or combined methods, and the affecting elements affecting the future development trend of building energy consumption or CO2 emission are selected through analysis and research. Then continuously change the relevant parameters, simulate all possible scenarios, and compare and analyze these results. The scenario setting and carbon emission prediction results of typical models are shown in Table 2.
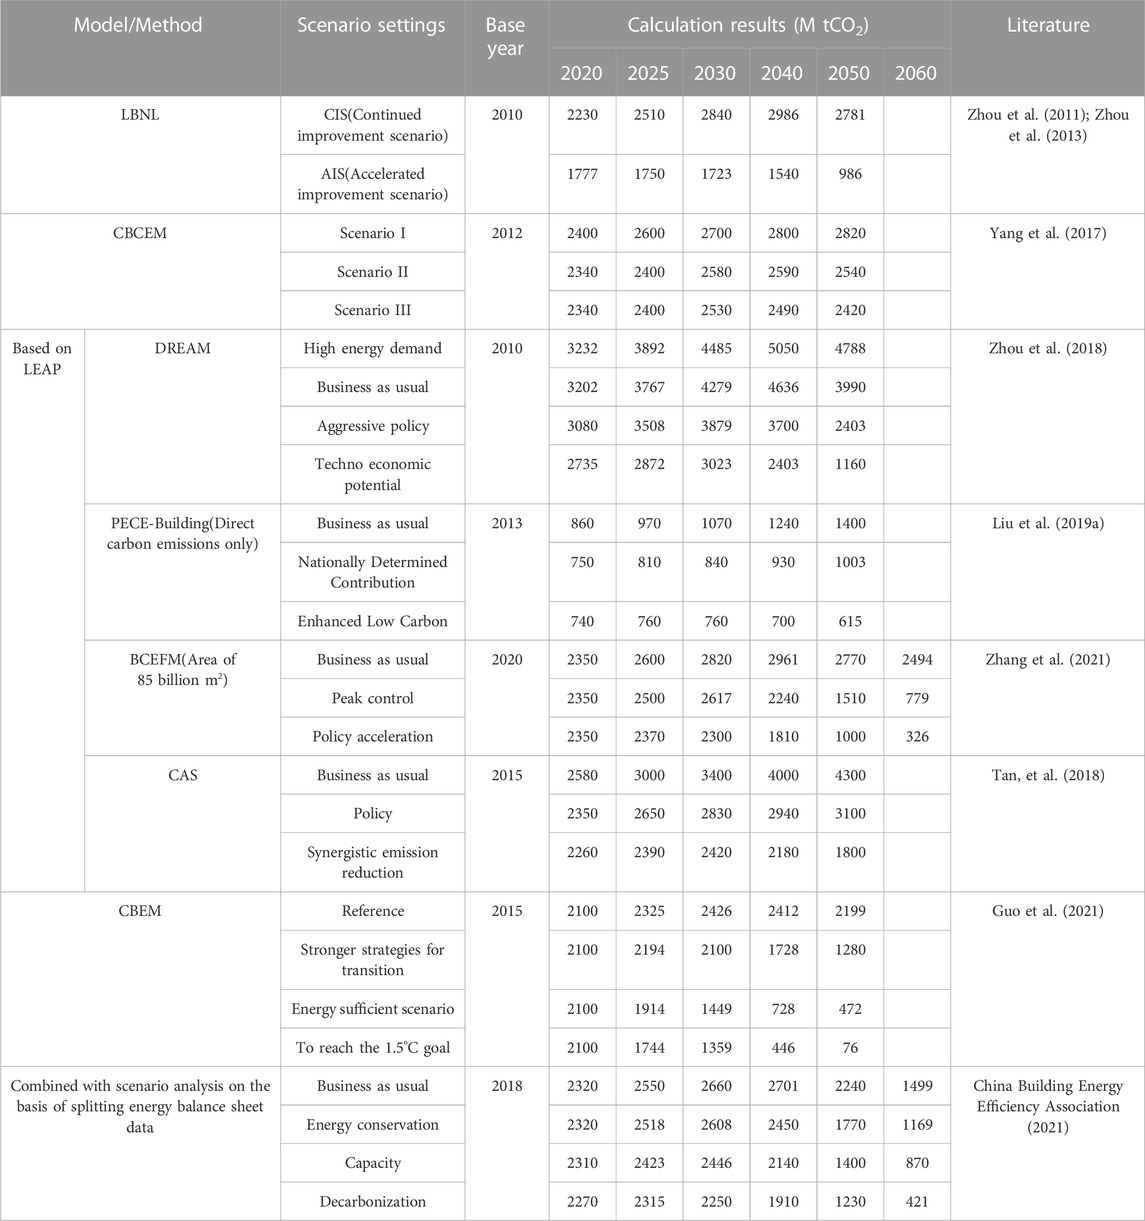
TABLE 2. Main model scenario settings and carbon emission calculation results.
The System Dynamics (SD) model utilizes the existing economic and social conditions as a basis for predicting future economic growth, energy consumption, and energy efficiency levels. This model can be used to assess the potential carbon emission trends. SD is based on feedback theory, with qualitative analysis as the leading approach and quantitative analysis as the support. It starts with the microstructure of the system’s internal dynamics and can be applied to study complex societal, economic, ecological, and other systemic issues (Feng et al., 2013).
Energy consumption of residential buildings involves many influencing factors, such as population, market share of room air conditioners with different energy efficiency levels, people’s willingness to buy, service time of air conditioners, social and economic development level, etc. In 2008, the application of system dynamics in the building field was introduced by Bai et al. (2008) from Tongji University. They integrated system dynamics with the scenario analysis method to forecast the energy use of residential buildings in Shanghai for the future.
Liu (2018) from Beijing Jiaotong University utilized system dynamics to construct five subsystems including society, carbon emissions, green building, economy, and technology to investigate the driving elements and impact mechanism of building CO2 emissions. Furthermore, a simulation of the CO2 emissions of the entire construction industry chain in China from 2000 to 2035 was conducted. The research shows that emission reduction policies have a multidimensional impact on building energy consumption and building CO2 emissions. Emission reduction paths need to be formulated in combination with the mutual constraints of various interest groups and the impact of each link. The findings suggest that emission reduction policies have diverse effects on building energy consumption and CO2 emissions, and emission reduction strategies should be developed based on the mutual constraints of various stakeholders and the impact of each stage.
Liu and Zhao (2018) further decomposed the carbon emission subsystem into four subsystems: building CO2 emission economic subsystem, energy subsystem, population subsystem, and environment subsystem. They drew system stock flow diagrams for each subsystem, fitted various influencing factors into equations, and explored the impact of each factor. Based on this, they made long-term predictions of building operational energy use and CO2 emissions in China from 2008 to 2025. Their results showed that economic, energy, and environmental systems all have a certain impact on building carbon emissions. To achieve a dynamic balance among the three systems, China’s energy-saving and CO2 emission reduction policies need to be formulated with consideration of their mutual constraints.
From a macro perspective, Shi and Liu (2023) utilized the KAYA identity equation to conduct a comprehensive analysis of the interplay between various factors that affect carbon emissions, including the economy, energy, population, and external environment. They established a simulation model for the CO2 emissions system of public buildings using system dynamics and simulated the trend of carbon emissions data from 2020 to 2040 using Venple software. In addition, they performed sensitivity analysis on carbon emission reduction pathways for public buildings, and put forward feasible suggestions for improving the implementation of these pathways.
Hu et al. (2019) developed a simulation model for predicting the energy use of rural residential buildings in Beijing from 2020 to 2050. The model was based on system dynamics and considered the current situation of energy use in the region. It included an economic subsystem, technical subsystem, and living subsystem, and was used to simulate the total energy consumption. By adhering to national and Beijing energy-saving standards, three distinct improvement scenarios for building energy efficiency were proposed: low control, central control, and strong control. These scenarios involved controlling different index variables, and were analyzed for their impact on energy structure and total consumption, highlighting the significance of varying intensities in building energy-saving policies.
Artificial neural network (ANN) is an automatic error correction mechanism derived from multidimensional mapping relationships (Magoulès and Zhao, 2016). This method shows promising capabilities for addressing complex environmental problems that involve numerous independent parameters and non-linear relationships. One approach to predicting building energy consumption or CO2 emissions is to view the building energy consumption system as a highly nonlinear system with respect to a time series. In this context, artificial neural network models can be utilized to address these complex problems (Li et al., 2014).
Zhang et al. (2020) focused on identifying the key factors that influence energy consumption in civil buildings, such as the total building area, urban productivity, and urbanization rate. They then developed three prediction models: a ridge regression analysis model, a grey GM (1,1) prediction model, and a BP neural network model, using data from the Shandong Statistical Yearbook between 2000 and 2017. Based on the analysis, it was found that the BP neural network model outperformed the other two models in terms of prediction accuracy. Therefore, the BP neural network model was employed to forecast the total energy use of civil buildings in Shandong Province for the years 2020–2022.
Lei (2008) established a BP neural network-based model to predict the energy use of residential buildings in Chongqing. The study examined the influence of 16 indicators, including population, urban residents’ disposable income, GDP, total social investment in fixed assets, construction industry GDP, total import and export value, and total retail sales of social consumer goods, on residential building energy use in Chongqing.
Wang et al. (2020) extended the STIRPAT model by selecting factors that influence carbon emission prediction and adding macro indicators as input variables to the WOA-ELM prediction model. By comparing the prediction results and error indicators of carbon emissions and carbon intensity obtained from various models for the period between 2013 and 2018, the researchers established the superior performance of the WOA-ELM prediction model. Subsequently, the model was utilized to forecast the future carbon emissions in China and provide recommendations based on the national context.
Regression analysis is a widely used method for establishing relationships between independent variables and dependent variables based on historical data trends. The approach involves estimating model parameters and using them to make predictions. It can be classified into several types, including univariate linear regression, multiple linear regression, and multiple nonlinear regression, each of which has its own unique characteristics and applicability. Regression analysis has been demonstrated to be a valuable tool for analyzing complex data sets and making accurate predictions across various fields, including economics, ecology, medicine, and architectural engineering, among others (Man and Yang, 2010).
Pu et al. (2012); Pu (2012) conducted a study on the key elements affecting residential building energy use in Chongqing. To do so, they collected energy use data from residents through a questionnaire survey and analyzed the data using both correlation and multiple regression analysis. Based on this, a multiple linear regression model for predicting residential building energy consumption was established. Through the implementation of a scenario analysis approach, they created energy-saving and non-energy-saving scenarios and made predictions for each influencing factor, thereby yielding valuable insights into the future of regional energy use. Yuan-zhao et al. (2021) employed the SVR (Support Vector Regression Machine) model to accurately correlate carbon emission calculations with various influencing variables. This led to the development of a comprehensive and robust predictive model for carbon emissions throughout the entire lifespan of high-rise office buildings. Additionally, they conducted meticulous carbon accounting to quantify the exact carbon emissions associated with the building. Wang et al. (2021) integrated the building area and energy consumption data of public buildings in Shanghai to establish a dual regression predictive model for building carbon emissions. They quantified the impact of parameters such as air conditioning systems and energy-saving retrofitting on carbon emissions, significantly enhancing the accuracy of the predictive model. Using this model, they successfully projected the carbon emissions of public buildings in Huangpu District from 2012 to 2025.
The Lawrence Berkeley National Laboratory developed the LBNL model, a cutting-edge global energy and carbon emission model that employs the diffusion level of end-use technologies. Zhou et al. (2011) utilized the LBNL China End-Use Energy Model to assess two energy efficiency policy scenarios aimed at curbing energy demand growth and reducing CO2 emissions in China. The two scenarios evaluated were the Continued Improvement Scenario (CIS) and the Accelerated Improvement Scenario (AIS). Comprised of both energy demand and supply modules, the LBNL China End-Use Energy Model takes into account the effects of various activity factors, such as population growth, urbanization, building and vehicle stock, and commodity production, as well as economic factors like GDP and national income, and energy intensity (i.e., energy efficiency of equipment) on end-use energy consumption and CO2 emissions. Zhou et al. (2013) have projected that China’s building sector will experience a steady increase in primary energy demand, peaking around 2030. The peak CO2 emissions, estimated to be around 12 billion tons (CIS) and 9.7 billion tons (AIS), are predicted to occur in 2033 and 2027, respectively, coinciding with the peak of energy demand.
The calculation of building energy consumption intensity per unit area is often estimated using a “bottom-up” approach, whereby the total energy consumption is derived by multiplying the building area by the energy consumption intensity per unit area. This method involves classifying and determining the energy consumption intensity of various types of buildings in different regions, based on the energy consumption characteristics. By combining this information with the building area data, the total energy consumption of buildings can be estimated.
The Research Institute of Standards and Norms Ministry of Housing and Urban-Rural Development (2016) classified buildings into three categories: public buildings, urban and rural residential buildings. By conducting extensive surveys of typical buildings in different climate zones, the institute applied this method to obtain the unit area energy consumption of the three building types in different climate zones across the country, as well as the heating energy consumption of buildings in northern Chinese cities. They integrated this method with scenario analysis, establishing four scenarios: Business as Usual (BAU), Low-Level Energy Efficiency and Emission Reduction, Medium-Level Energy Efficiency and Emission Reduction, and High-Level Energy Efficiency and Emission Reduction. Parameters such as population, urbanization process, building area, and energy intensity were taken into account as influencing factors to predict and analyze the energy consumption and carbon emissions of China’s building sector in 2050.
Yang et al. (2017) from Tongji University developed a bottom-up model for estimating CO2 emissions from buildings in China, utilizing the CO2 emission calculation formula suggested by IPCC. This formula calculates emissions as a product of activity level and activity factor, which is estimated by multiplying the building area with the energy use per unit building area and CO2 emission factor. Subsequently, the scenario analysis method is employed to forecast the future trend of carbon emission factors by taking into account the evolution of China’s energy structure. Based on this, the CO2 emissions from buildings in China are predicted.
The Long-Term Energy Alternatives Planning (LEAP) model was originally created as an econometric model by the Stockholm Environment Association and Boston University (SEI, 2015). It is an integrated model that combines economic, energy, and environmental factors and is built on scenario analysis LEAP can analyze energy demand, assess environmental impacts, and evaluate cost-benefit outcomes. In the building field, the LEAP model subdivides building energy consumption according to building types, climate zones, etc., taking the energy demand of the building end-use energy sector as the input parameter, considering the level of economic and social activities, making a multi scenario prediction of building carbon emission from both technology and policy.
Zhou (2003) from the Energy Research Institute of the National Development and Reform Commission used a scenario analysis approach to predict building energy consumption in China in 2020. In this method, parameters affecting building energy consumption, such as population, urbanization, living standards, science and technology, and policy implementation progress, were considered, and three energy saving scenarios were set. The simulation of the building energy consumption level in 2020 was analyzed using relevant software, and the future tendency of energy consumption and energy saving potential in the buildings sector were analyzed. Zhou et al. (2013); Zhou et al. (2018); Zhou et al. (2019) of Lawrence Berkeley Laboratory in the United States established Demand Resource Energy Analysis Model based on leap. From the scenario of high energy demand without new energy policy to the scenario of minimum energy demand based on technical and economic potential, four scenarios are established to analyze the peak time and peak value of CO2 in building field in China under different scenarios. The results show that the energy demand for buildings in 2050 is likely to increase by 20%–100% compared with that in 2010. In order to attain the 20% target, China must establish and execute policies that enhance energy efficiency and promote the utilization of renewable energy sources, while also giving greater consideration to the energy consumption behaviors of residents.
Liu et al. (2019a) combined the LEAP model with scenario analysis to set up three building energy consumption scenarios of business as usual (BAU), national required contribution (NDC) and enhanced low carbon (ELC), developed a bottom-up integrated energy-climate-economy building energy consumption prediction model, and predicted and analyzed the energy use and carbon emissions of the building sector under the three different scenarios from 2013 to 2050 trends. The research shows that under the ELC scenario, the cumulative emission reductions of energy efficiency technologies and new energy technologies account for 33.4% and 66.6% respectively. Urban heating in the north is the most important emission reduction field. Zhang et al. (2021) from the Academy of Construction Sciences, developed a long-term building carbon emissions forecasting model using the LEAP model. The model was used to project the long-term trend of carbon emissions in the building sector under three different scenarios: the baseline scenario, the peak control scenario, and the policy acceleration scenario. Zhang’s study highlights that indirect carbon emissions resulting from electricity consumption are the main driver of carbon emissions growth in the building sector. The study suggests two approaches to controlling carbon emissions in the sector: prioritizing strong energy-saving regulations and integrating economic and technological development levels.
In order to advance the adoption of clean energy in China, the Chinese government and the European Union established the European-China Clean Energy Centre (EC2) at Tsinghua University in 2010. As part of the Five Year Action Plan, EC2 collaborated with the LAME team from the Ministry of Energy at Politecnico di Torino and the Energy Research Institute (ERI) of the Development and Reform Commission to develop an energy demand projection model for China. For the building field, Delmastro et al. (2015) proposed a building energy model (EfB) based on EDPM-CN for forecasting and assessing the increase in energy demand of residential buildings in China until 2030.
The model consists of five modules. By considering the technological progress policies and measures, setting different scenarios, analyzing and predicting the parameters related to the macro-economic driving of the scenario, evaluating the changes of service demand such as heating, lighting and electrical appliances in the future, and then predicting the energy demand and carbon emission of various building types in various regions in the future. The calculation results of the above four modules are input into the first module respectively, and the Sankey diagram is drawn to evaluate the energy demand for services that meet all requirements. The EfB model only considers the relationship between energy and economy on the demand side, and does not involve the relationship between energy itself and the supply and demand sides, which has some limitations.
Tan et al. (2018) developed the CAS bottom-up model by integrating the EfB model. This model combines the LEAP model and is composed of four modules, including socio-economic factors, building energy consumption prediction model, CO2 emission reduction potential analysis model, and result model. The CAS model predicts energy consumption based on economic factors such as population, urbanization rate, and GDP, and considers technological progress and policy measures to predict future CO2 emissions in the building sector under different emission reduction scenarios.
China building energy consumption model (CBEM) is a hybrid model built on terminal statistics and macro-validated by energy balance sheets, which was established by Yang (2009) of the Building Energy Conservation Research Center of Tsinghua University according to the features of building energy use in China.
The model examines the historical trends and status of building energy usage by considering two elements, floor area and energy consumption intensity of various end uses. To achieve this, the model establishes two distinct modules: building area retention module and building energy consumption intensity module. Data on the population, number of households, and per capita building area released by the National Bureau of Statistics is utilized to obtain various building area data. Energy consumption intensity data for large-scale projects are obtained through extensive on-site building energy consumption surveys and monitoring by intelligent systems within the buildings, as well as micro-level analysis of specific projects using a building energy-saving model database. The energy balance sheet is used to verify the accuracy of the data. Furthermore, the CBEM model includes a technology and policy module to forecast the energy consumption of three building types, urban heating in the north, and urban residential heating in hot summer and cold winter regions from 2006 to 2030. This module also examines the energy-saving effect of new building energy-saving technologies in the future and provides policy recommendations (Building Energy Research Center of Tsinghua University, 2017).
To predict the carbon emission trends in China’s building sector up to 2050, Guo et al. (2021) from Tsinghua University combined the CBEM model with scenario analysis. Four scenarios were established based on the current energy-saving and emission reduction policies: Reference Scenario (RS), Strengthened Transformation Strategy Scenario (STS), Energy Sufficient Scenario (ESS), and 1.5°C Target Scenario (1.5 ds). The model analyzed and predicted two sources of carbon emissions: direct carbon emissions from fossil fuel combustion during building operation and indirect carbon emissions from the use of electricity, heat, and other energy sources.
However, the CBEM model ignores the influence of technical and behavioral parameters on building energy consumption. To address this limitation, Peng (2014) proposed a Technology and Behavior Model (TBM) based on the original model. The TBM was then used to analyze the energy consumption intensity trend of typical buildings under the control of total building energy consumption and propose energy-saving technology implementation pathways. The TBM model framework is similar to the CBEM model, but the affecting parameters of building energy use are optimized. Besides analyzing macro-influencing factors, the TBM model considers the influencing factors of building energy consumption, including technical factors such as envelope structure and equipment performance, behavioral factors such as equipment operation, management methods and user behavior, and natural and objective factors like climatic conditions. A comparison between the CBEM and TBM model frameworks is presented in Figure 4.
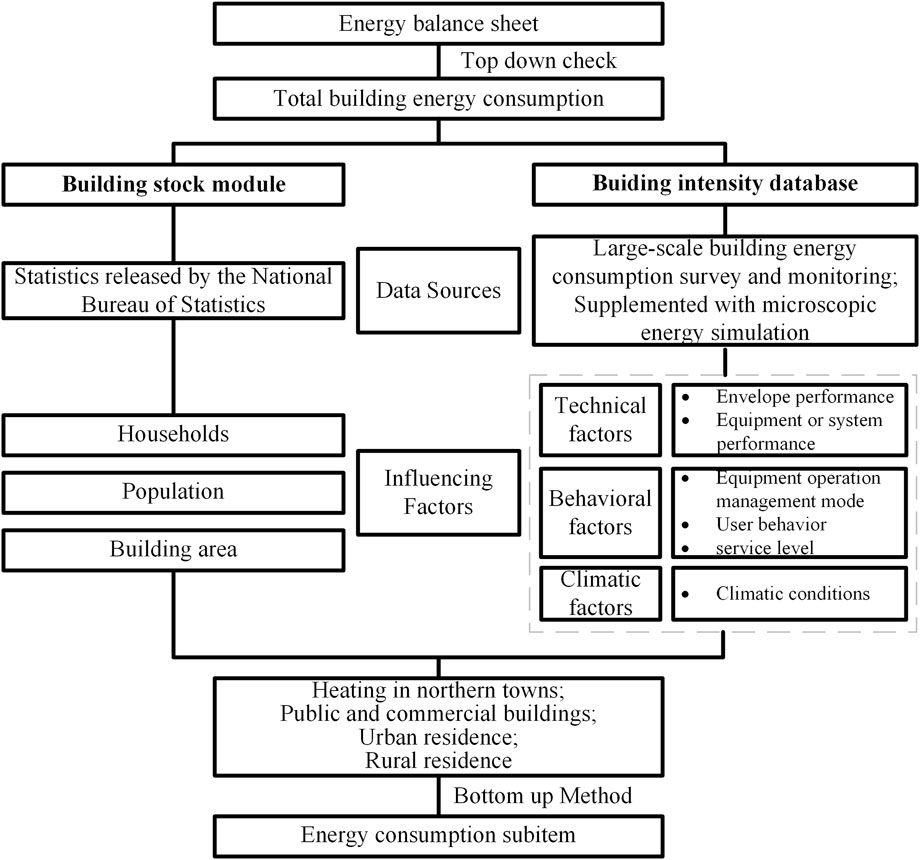
FIGURE 4. IPAC model framework.
The Energy Research Institute of the National Development and Reform Commission has developed the Integrated Policy Assessment model for China (IPAC) as a tool for long-term energy and environmental system analysis in China (Jiang et al., 2007), which aims to explore domestic energy consumption and carbon emissions. The IPAC model includes the “top-down” economic energy system model (IPAC-CGE model) and the “bottom-up” energy system model (IPAC-AIM/technology model), as shown in Figure 5. The CGE model mainly analyzes the impact of various energy and environmental policies on the economy, explores the future economic development structure, and can analyze medium and long-term energy and environmental scenarios. The AIM model is a regional model specifically for China (Hu and Jiang, 2010), including three sub-models: energy service demand forecast model, energy efficiency estimation model and technology selection model, which can be used to simulate China’s energy and emission reduction scenarios, energy demand and supply by sector.
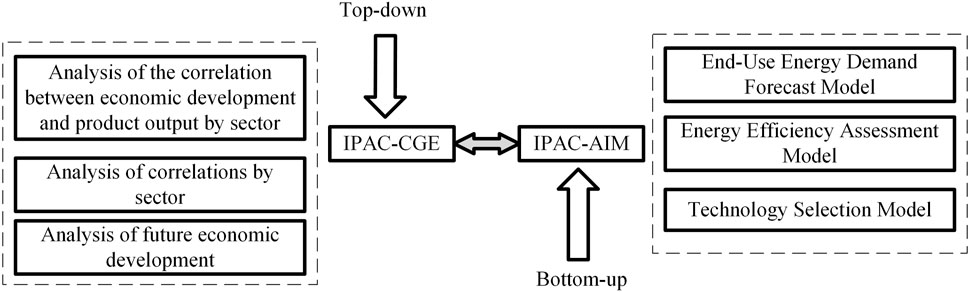
FIGURE 5. IPAC Model Framework.
Dai et al. (2010) combined the CGE model with AIM to calculate the CO2 emissions of China’s building sector. They first coupled the CGE model with economic development and product output relationships, as well as economic relationships among various sectors, to evaluate future economic development trends. They analyzed the impact of economic development on energy use and related CO2 emissions parameters, and then used the AIM model to analyze the end-use energy demand of the building sector. By setting energy-saving, low-carbo, and strengthened low-carbon scenarios in different contexts, they predicted China’s energy consumption structure, energy activities, and CO2 emissions in various sectors. Their research showed that in the strengthened low-carbon scenario, the proportion of CO2 emissions from China’s building sector was about one-third of the current level, approaching the level of developed industrial countries.
The choice of model depends on the specific objectives, available data, resources, and time constraints. A top-down model may be more suitable for initial assessments and long-term planning, while a bottom-up model is beneficial for detailed analysis of individual buildings. The hybrid model offers a compromise between accuracy and scalability, making it an attractive option for many energy consumption simulation scenarios. It is important to note that when applying ANN, system dynamics models, and regression analysis methods to the building carbon emission accounting model, the entire accounting model exhibits characteristics of both top-down or bottom-up approaches. This does not imply that these models themselves are exclusively top-down or bottom-up models. A comparative analysis of these prediction models was conducted, considering factors such as data sources, model characteristics, and limitations. The findings are summarized in Table 3.
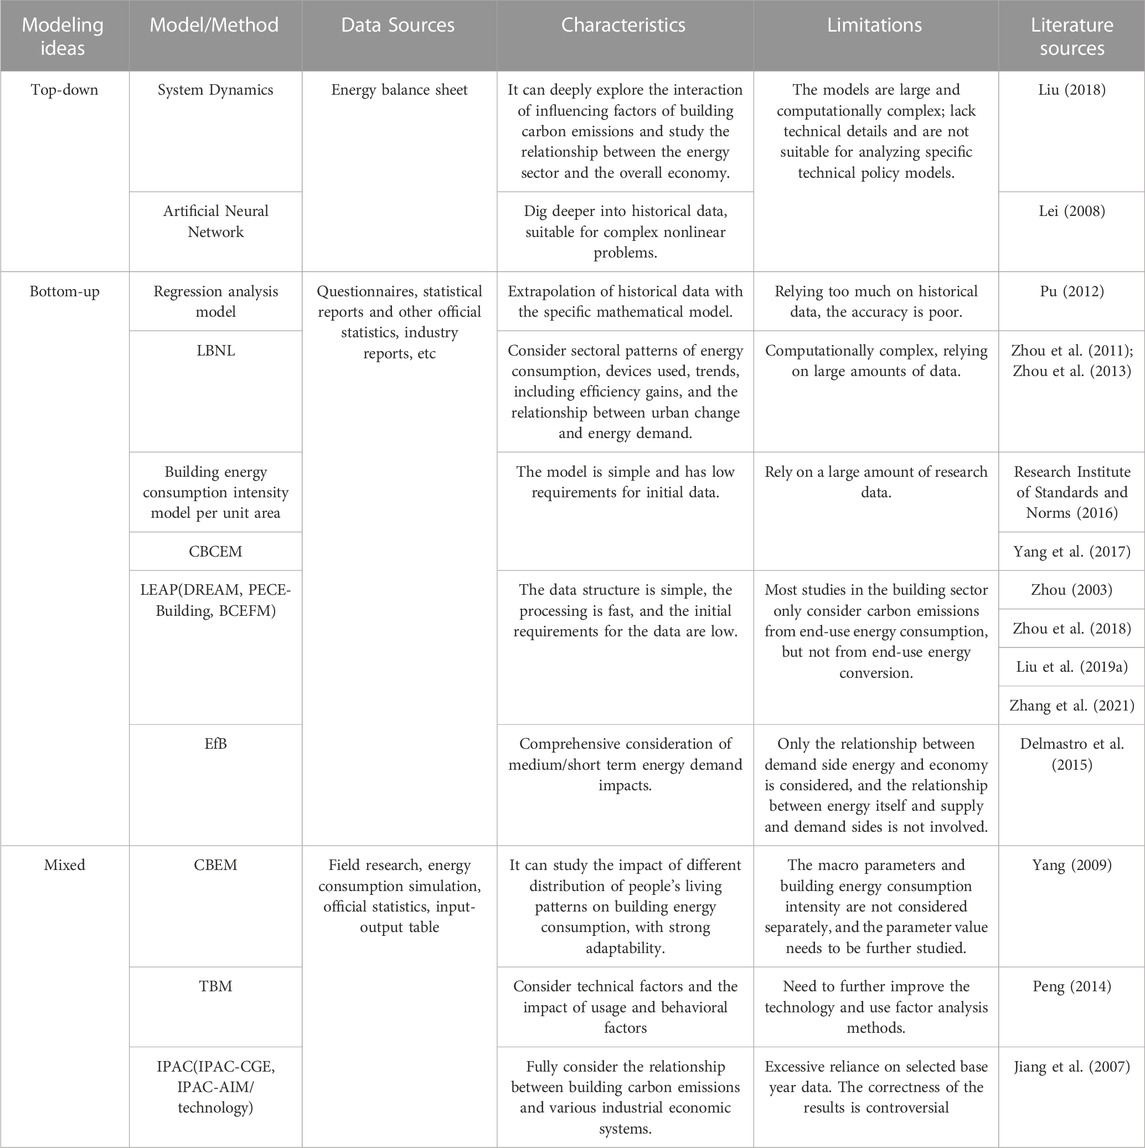
TABLE 3. Comparative analysis of models.
Based on a comprehensive review of the relevant literature, the following key findings have emerged.
1) China’s involvement in CO2 reduction efforts within the building sector commenced later compared to other countries. Presently, the emphasis lies on overall control stages. The data collection and modeling methods for macro-scale carbon emission prediction in the Chinese building sector are characterized by complexity and diversity, with no unified calculation method currently in place.
2) In terms of energy consumption data acquisition, the current public building energy consumption monitoring system has been effective, but due to the multi-source and decentralized nature of the monitoring data, the processing of the data is only simple statistics, and it is not possible to unify the regional data from the provincial and municipal levels or at a higher level to establish a regional database.
3) Compared with top-down models, bottom-up or hybrid models, which are based on modeling at the building detail level, are more helpful in reflecting the emission reductions of various energy-saving measures in a two-carbon context, and are helpful for building energy-saving and emission reduction path planning. Therefore, bottom-up or hybrid models are mostly used for calculations and projections in this area.
Based on this analysis, the paper suggests that the prediction of building carbon emissions in China is relatively mature and diverse in terms of data acquisition methods and model construction, but could be further improved in several aspects.
1) In northern China, there is a significant and prolonged demand for heating in winter. The carbon emissions generated by heating systems, such as cogeneration and regional central heating, cannot be overlooked. Currently, there is no standardized method for calculating thermal carbon emission factors. Among the existing methods, the enterprise survey method is suitable for determining small-scale carbon emission factors, while the energy balance sheet method and emission intensity method are more suitable for macro-level analysis. However, the former fails to accurately separate industrial heat from residential heat, and the latter relies on data regarding energy consumption intensity of different heating technologies. The accuracy of factor is closely tied to heating energy consumption data in northern China. Future research can focus on establishing relevant databases to address these issues.
2) The accounting scope for calculating carbon emissions in the building sector lacks clarity and unified standards. Currently, predictive models mainly focus on emissions during the operational phase of buildings. There is no consensus on including the construction phase, maintenance, updates, and demolition in the calculations. It is crucial to establish clear boundaries for accounting and predicting carbon emissions in the building sector.
3) Given the vast territory of China and regional disparities in economic and social development, as well as resource endowments, there are variations in energy consumption data and carbon emission factors within the building sector. To enable detailed analysis and identification of emission reduction potential and pathways at national, regional, and provincial levels, it is necessary to establish a unified database for building energy consumption data and energy carbon emission factors.
WY: Writing–Original Draft; Investigation WZ: Conceptualization; Supervision TG: Data Curation XL: Formal Analysis KL: Visualization. All authors contributed to the article and approved the submitted version.
This study was supported by the National Natural Science Foundation of China (Grant No. 51908287), and supported by the Opening Funds of State Key Laboratory of Building Safety and Built Environment and National Engineering Research Center of Building Technology (Grant No. BSBE 2020-7).
The authors declare that the research was conducted in the absence of any commercial or financial relationships that could be construed as a potential conflict of interest.
All claims expressed in this article are solely those of the authors and do not necessarily represent those of their affiliated organizations, or those of the publisher, the editors and the reviewers. Any product that may be evaluated in this article, or claim that may be made by its manufacturer, is not guaranteed or endorsed by the publisher.
BCEFM, Building carbon emission forecasting model; CGE, The computable equilibrium model; CBCEM, China building carbon emission model; CBEM, China building energy model; EIA, Energy Information Administration; RS, Reference scenario; BAU, Business as Usual; IPCC, Intergovernmental Panel on climate change; IEA, International Energy Agency; WRI, World Energy Institute; GIS, Geographic Information System; LBNL, Lawrence Berkeley National Laboratory; LEAP, Long-range Energy Alternative Planning system; DREAM, Demand Resource Energy Analysis Model; NDC, Nationally Determined Contribution; ELC, Enhanced Low CarbonPECE-Building, Program of Energy and Climate Economics-Building; EfB, Energy for buildings model; EC2, Europe-China Clean Energy Centre; ERI, Energy Research Institute; EDPM-CN, Energy demand projection model for China; CAS, CAS bottom-up model; STS, Scenario with stronger strategies for transition; ESS, Energy sufficient scenario; 1.5DS, Scenario to reach the 1.5°C goal; TBM, Technology and Behavior Model; IPAC, Integrated Policy Assessment model for China; IPAT, Environmental Impact=Population*Affluence*Techology.
Azari, R., and Abbasabadi, N. (2018). Embodied energy of buildings: a review of data, methods, challenges, and research trends. Energy Build. 168, 225–235. doi:10.1016/j.enbuild.2018.03.003
Bai, W., Long, W., and Liu, Z. (2008). Prediction of energy consumption of residential buildings in Shanghai in the future. Proceedings of the 2008 National Academic Conference on HVAC and refrigeration.308. (in Chinese).
BP.(2021). BP statistical review of World energy 2021. Available at: https://www.bp.com.cn/zh_cn/china/home/news/reports/statistical-review-2021.html (Accessed March 05 2023).
Building Energy Research Center of Tsinghua University (2017). China building energy use 2017. Beijing: China Architecture and Building Press. (in Chinese).
Cai, W., and Cai, Y. (2019). National construction carbon emission calculation method research and data analysis. Constr. Manag. Res. 02, 61–76. (in Chinese).
Cai, W., Li, X., Wang, X., Chen, M., Wu, Y., and Feng, W. (2017). Split model and application of building energy consumption based on energy balance table. Heat. Vent. Air Cond. 47 (11), 27–34. (in Chinese).
Cai, W., Pang, T., Lang, N., Zhao, Y., and Wu, Y. (2020). Calculation and analysis of provincial building energy consumption in China. Heat. Vent. Air Cond. 50 (02), 66–71+116.
Chen, S., Li, N., Fu, X., and Liu, J. (2007). Statistical methods of energy consumption for residential buildings. Heat. Vent. Air Cond. 03, 44–48+95. (in Chinese).
Cheng, P., Jiang, Y., and Qin, Y. (2018). Low carbon buildings and low carbon cities. Beijing: China Environment Publishing Group. (in Chinese).
China Association of Building Energy Efficiency (2021). 2021 research report on building energy consumption and carbon emission in China: assessment of provincial building carbon peak situation. Available at: https://mp.weixin.qq.com/s/tnzXNdft6Tk2Ca3QYtJT1Q (Accessed December 08, 2022).
China Building Energy Efficiency Association (2021). China building energy consumption annual report 2020. Build. Energy Effic. 49 (02), 1–6. (in Chinese).
Climate change response Department of national development and Reform Commission (2011). Guidelines for compiling provincial greenhouse gas inventories (for trial implementation). Available at: http://www.cbcsd.org.cn/sjk/nengyuan/standard/home/20140113/download/shengjiwenshiqiti.pdf (Accessed March 09, 2023).
Dai, Y., Zhu, Y., and Bai, Q. (2010). China's low-carbon development road in 2050-analysis of energy demand and carbon emission scenarios. Rev. Econ. Res. 26, 2–22+33. (in Chinese).
Delmastro, C., Lavagno, E., and Mutani, G. (2015). Chinese residential energy demand: scenarios to 2030 and policies implication. Energy Build. 89, 49–60. doi:10.1016/j.enbuild.2014.12.004
Department of energy statistics, National Bureau of Statistics (2010). China energy statistical Yearbook. Beijing: China Statistics Press. (in Chinese).
DGNB (2018). DGNB criteria "Building life cycle assessment. Available at: https://www.dgnb-system.de/en/buildings/new-construction/criteria/building-life-cycle-assessment/(Accessed April 01, 2022).
Ding, H., Liu, H., and Yin, S. (2017). Research on the current situation and trend of the construction of public building energy efficiency supervision platform in China. Constr. Sci. Technol. 23, 10–11. (in Chinese).
ECIU (2023). Net zero emissions race. Available at: https://eciu.net/netzerotracker (Accessed March 09, 2023).
Editorial Team (2012). Do a good job of statistical investigation and scientifically manage building energy conservation - the newly revised “Civil Building Energy Consumption and Energy Conservation Information Statistical Statement System” released. Constr. Sci. Technol. 10, 22. (in Chinese).
Eggleston, H. S., Buendia, L., Miwa, K., Ngara, T., and Tanabe, K. (2006). IPCC guidelines for national greenhouse gas inventories. Geneva, Switzerland: IPCC.
EIA (2011). Voluntary reporting of greenhouse gases. Available at: https://www.eia.gov/environment/pdfpages/0608s(2009)index.php (Accessed March 10, 2023).
Energy Research Center (2014). Data from: fudan university. Energy flows and carbon emissions dataverse. China: Fudan University Social Science Data Repository.
Energy Research Institute of national development and Reform Commission (2003). Comprehensive report on scenario analysis of energy and carbon emissions for sustainable development in China. Energy China 06, 5–11. (in Chinese).
Fan, P., Qi, R., and Ding, H. (2021). Research on energy consumption and carbon emission in construction field in China. Constr. Sci. Technol. 11, 19–22. (in Chinese).
Feng, Y. Y., Chen, S. Q., and Zhang, L. X. (2013). System dynamics modeling for urban energy consumption and CO2 emissions: a case study of Beijing, China. Ecol. Model. 252, 44–52. doi:10.1016/j.ecolmodel.2012.09.008
Gu, L., and Yu, C. (2011). Status of building energy use data and analysis of energy use statistics in China. Energy China 33 (02), 38–41. (in Chinese).
Guo, S., Yan, D., Hu, S., and Zhang, Y. (2021). Modelling building energy consumption in China under different future scenarios. Energy 214, 119063. doi:10.1016/j.energy.2020.119063
Hu, X., and Jiang, K. (2010). Selection and countermeasure evaluation of greenhouse gas emission reduction technology in China. Beijing: China Environmental Science Press. (in Chinese).
Hu, Y., Liu, J., Ding, H., and Fan, P. (2019). Energy consumption prediction of Beijing rural residential buildings based on system dynamics. Build. Energy Effic. 47 (09), 123–129+135. (in Chinese).
Huo, T., Ren, H., Zhang, X., Cai, W., Feng, W., Zhou, N., et al. (2018). China's energy consumption in the building sector: a statistical yearbook-energy balance sheet based splitting method. J. Clean. Prod. 185, 665–679. doi:10.1016/j.jclepro.2018.02.283
IEA (2023). Data from: greenhouse gas emissions from energy. Available at: https://www.iea.org/data-and-statistics/data-product/greenhouse-gas-emissions-from-energy#ghg-emissions-from-fuel-combustion.
IPCC (2019a). 2019 refinement to the 2006 IPCC guidelines for national greenhouse gas inventories. Available at: https://www.ipcc.ch/report/2019-refinement-to-the-2006-ipcc-guidelines-for-national-greenhouse-gas-inventories/(Accessed April 05, 2022).
IPCC (2019b). Impacts of 1.5°C global warming on natural and human systems. Available at: https://www.ipcc.ch/site/assets/uploads/sites/2/2019/02/SR15_Chapter3_Low_Res.pdf (Accessed July 10, 2023).
Jakučionytė-Skodienė, M., and Liobikienė, G. (2021). Climate change concern, personal responsibility and actions related to climate change mitigation in EU countries: cross-cultural analysis. J. Clean. Prod. 281, 125189. doi:10.1016/j.jclepro.2020.125189
Jiang, K., Hu, X., Zhu, X., Garg, A., Halsnaes, K., and Liu, Q. (2007). Balancing development, energy and climate priorities in China. Roskilde: UNEP Risø Centre.
Kavgic, M., Mavrogianni, A., Mumovic, D., Summerfield, A., Stevanovic, Z., and Djurovic-Petrovic, M. (2010). A review of bottom-up building stock models for energy consumption in the residential sector. Build. Environ. 45 (7), 1683–1697. doi:10.1016/j.buildenv.2010.01.021
Langevin, J., Harris, C. B., and Reyna, J. L. (2019). Assessing the potential to reduce US building CO2 emissions 80% by 2050. Joule 3 (10), 2403–2424. doi:10.1016/j.joule.2019.07.013
Lei, Y. (2008). Study on methodology for forecasting residential energy consumption in chongqing. Master's thesis. Chongqing: Chongqing University. (in Chinese).
Li, R. R., Zhang, Y. J., Liu, C., and Wang, S. S. (2014). Prediction of building electricity consumption based on BP neural network. J. Shandong Jianzhu Univ. 2, 162–165. (in Chinese).
Liu, H., Ding, H., and Zeng, D. (2013). Statistical analysis report on energy consumption of civil buildings in 2012. Constr. Sci. Technol. 18:34–37. (in Chinese).
Liu, J., Gandhi, P. J., Pavuluri, R., Shelkar, G. P., and Dravid, S. M. (2018). Glutamate delta-1 receptor regulates cocaine-induced plasticity in the nucleus accumbens. Transl. psychiatry 8 (09), 219–226. doi:10.1038/s41398-018-0273-9
Liu, J., Shang, Y., Zhu, Q., Zhang, X., and Zheng, J. (2019a). A voltammetric immunoassay for the carcinoembryonic antigen using silver(I)-terephthalate metal-organic frameworks containing gold nanoparticles as a signal probe. Mikrochim. acta 186 (03), 509–520. doi:10.1007/s00604-019-3638-8
Liu, J., Yang, T., Zhao, J., Fan, P., Ding, H., and Qi, R. (2019b). Comparative study of building energy consumption of city-level: sino-US case-based. Energy China 41 (07), 25–30+17. (in Chinese).
Liu, J. (2018). Study on the carbon emission measurement method and emission reduction policies of China’s construction industry chain from the perspective of carbon footprint. Master's thesis. Beijing: Beijing Jiaotong University. (in Chinese).
Liu, J., and Zhao, J. (2018). Building Carbon Emissions Prediction Research Based on System Dynamics. Sci. Technol. Manag. Res. 38 (09), 219–226.
Liu, M., Meng, J., and Liu, B. (2014). Progress in the studies of carbon emission estimation. Trop. Geogr. 34 (02), 248–258.
Liu, Z., Yan, D., Wu, R., Sun, H., Gui, C., Jin, Y., et al. (2021). Development of a platform of urban building energy modeling based on DeST. Build. Sci. 37 (10), 16–23. (in Chinese).
Lu, Y. (2020). Study on energy consumption of high-rise office buildings in zhengzhou based on design builder simulation. J. Shandong Agric. Univ. 51 (02), 355–359. (in Chinese).
Magoulès, F., and Zhao, H. X. (2016). Data mining and machine learning in building energy analysis. New Jersey, United States: John Wiley and Sons.
Man, J., and Yang, W. (2010). Based on multiple collinearity processing method. Math. Theory Appl. 30 (02), 105–109.
Mata, É., Kalagasidis, A. S., and Johnsson, F. (2013). A modelling strategy for energy, carbon, and cost assessments of building stocks. Energy Build. 56, 100–108. doi:10.1016/j.enbuild.2012.09.037
Mata, É., Korpal, A. K., Cheng, S. H., Jiménez Navarro, J. P., Filippidou, F., Reyna, J., et al. (2020). A map of roadmaps for zero and low energy and carbon buildings worldwide. Environ. Res. Lett. 15 (11), 113003. doi:10.1088/1748-9326/abb69f
Mihiretu, A., Okoyo, E. N., and Lemma, T. (2021). Causes, indicators and impacts of climate change: understanding the public discourse in goat based agro-pastoral livelihood zone, Ethiopia. Heliyon 7 (3), e06529. doi:10.1016/j.heliyon.2021.e06529
Ministry of Housing and Urban-Rural (2019a). Development of the people's Republic of China. GB/T51366-2019 Standard for building carbon emission calculation. Beijing: China Construction Industry Press. (in Chinese).
Ministry of Housing and Urban-Rural (2019b). Development of the people's Republic of China. GBT51366-2019 Standard for building carbon emission calculation. Beijing: China Architecture and Building Press. (in Chinese).
Ministry of Housing and Urban-Rural Development of the People's Republic of China (2010). Notice on the “issuance of the statistical reporting system for energy consumption and energy conservation information of civil buildings. Available at: http://www.gov.cn/gzdt/2010-03/17/content_1557474.htm (Accessed March 09, 2023).
NCSC (2013). 2010 Average carbon dioxide emission factors for regional and provincial power grids in China. Available at: https://www.ccchina.org.cn/archiver/ccchinacn/UpFile/Files/Default/20131011145155611667.pdf (Accessed March 09, 2023).
NCSC (2014). 2011 and 2012 Average carbon dioxide emission factors for regional power grids in China. Available at: https://www.docin.com/p-1015189485.html (Accessed March 09, 2023).
NIST (2018). Bees. Available at: https://www.nist.gov/services-resources/software/bees (Accessed December 08, 2022).
Pan, Y., Cui, Y., Baloch, A. R., Fan, J., He, J., Zhang, Y., et al. (2015). Association of heat shock protein 90 with the developmental competence of immature oocytes following Cryotop and solid surface vitrification in yaks (Bos grunniens). Cryobiology 71 (03), 33–39. (in Chinese). doi:10.1016/j.cryobiol.2015.06.005
Pan, Y., Liang, Y., and Zhu, M. (2021). Review of building carbon emission calculation models in context of carbon neutrality. Heat. Vent. Air Cond. 51 (07), 37–48. (in Chinese).
Peng, C. (2014). Research on roadmap for China building energy conservation based on total amount control. Master's thesis. Beijing: Tsinghua University. (in Chinese).
Pokhrel, S. R., Hewage, K., Chhipi-Shrestha, G., Karunathilake, H., Li, E., and Sadiq, R. (2021). Carbon capturing for emissions reduction at building level: a market assessment from a building management perspective. J. Clean. Prod. 294, 126323. doi:10.1016/j.jclepro.2021.126323
Pu, Q., Li, B., and Yu, W. (2012). Energy consumption forecast model of urban residential buildings in Chongqing. J. Central South Univ. 43 (04), 1551–1556. (in Chinese).
Pu, Q. (2012). Research on prediction model and influencing factors of urban residential building energy consumption. Master's thesis. Chongqing: Chongqing University. (in Chinese).
Research Institute of Standards and Norms Ministry of Housing and Urban-Rural Development (2016). Control strategy of total energy consumption of civil buildings in China-Top-level design of energy conservation of civil buildings. Beijing: China Architecture and Building Press. (in Chinese).
Robati, M., Oldfield, P., Nezhad, A. A., Carmichael, D. G., and Kuru, A. (2021). Carbon value engineering: a framework for integrating embodied carbon and cost reduction strategies in building design. Build. Environ. 192, 107620. doi:10.1016/j.buildenv.2021.107620
Sandberg, N. H., Næss, J. S., Brattebø, H., Andresen, I., and Gustavsen, A. (2021). Large potentials for energy saving and greenhouse gas emission reductions from large-scale deployment of zero emission building technologies in a national building stock. Energy Policy 152, 112114. doi:10.1016/j.enpol.2020.112114
Sandberg, N. H., Sartori, I., Heidrich, O., Dawson, R., Dascalaki, E., Dimitriou, S., et al. (2016). Dynamic building stock modelling: application to 11 European countries to support the energy efficiency and retrofit ambitions of the EU. Energy Build. 132, 26–38. doi:10.1016/j.enbuild.2016.05.100
SEI (2015). Long-range energy Alternatives planning system (LEAP). Available at: https://ledsgp.org/resource/long-range-energy-alternatives-planning-system/(Accessed March 09, 2023).
Shi, X., and Liu, Y. (2023). Energy conservation and emission reduction path of public buildings based on system dynamics. Build. Energy Effic. 51 (02), 137–144. (in Chinese).
Song, R. P., Yang, S., and Sun, M. (2013). GHG protocol tool for energy consumption in China. Version 2.1. United States: World Resources Institute. (WRI).
State Administration for Market Regulation, Standardization Administration (2020). GB/T2589-2020 General rules for calculation of the comprehensive energy consumption. Beijing: Standards Press of China. (in Chinese).
Su, S., and Liao, B. (2015). Urban scale, urban structure, industrial agglomeration and urban energy consumption. J. Industrial Technol. Econ. 34 (04), 153–160.
Swan, L. G., and Ugursal, V. I. (2009). Modeling of end-use energy consumption in the residential sector: a review of modeling techniques. Renew. Sustain. energy Rev. 13 (8), 1819–1835. doi:10.1016/j.rser.2008.09.033
Tan, X., Lai, H., Gu, B., Zeng, Y., and Li, H. (2018). Carbon emission and abatement potential outlook in China's building sector through 2050. Energy Policy 118, 429–439. doi:10.1016/j.enpol.2018.03.072
Tsinghua University Building Energy Conservation Research Center. (2009). Annual report on China building energy efficiency. Beijing: China Architecture and Building Press. (in Chinese).
Tsinghua University Building Energy Conservation Research Center (2018). Annual report on China building energy efficiency. Beijing: China Architecture and Building Press. (in Chinese).
Tu, F. (1999). Research on economic and technological policy of building energy conservation. Beijing: China Architecture and Building Press. (in Chinese).
UNEP (2021). Updated climate commitments ahead of COP26 summit fall far short, but net-zero pledges provide hope. Available at: https://www.unep.org/news-and-stories/press-release/updated-climate-commitments-ahead-cop26-summit-fall-far-short-net (Accessed March 04, 2023).
Wang, K., Ge, M., Liu, L., Lv, H., Wang, S., Jia, F., et al. (2021). Birth weight and the risk of overall breast cancer, premenopausal and postmenopausal breast cancer in adulthood: a dose-response meta-analysis of observational studies. Menopause (New York, N.Y.) 29 (09), 114–124. (in Chinese). doi:10.1097/GME.0000000000001885
Wang, K., Xu, L., Zhang, J., Wang, D., and Sun, K. (2020). Relationship between perfectionism and attitudes toward doping in young athletes: the mediating role of autonomous and controlled motivation. Subst. abuse Treat. Prev. policy 15 (08), 20–27. doi:10.1186/s13011-020-00259-5
Wang, Q. (2009). Final energy consumption and energy efficiency of China in 2007 (Part 1). Energy Conservation Environ. Prot. 02, 14–17.
Wang, Q. (2007). Research on statistics and calculation of building energy consumption in China. Energy Conservation Environ. Prot. 08, 9–10.
Wen-qian, Z., Xiang-li, L., and Wang, Q. (2018). Simulation analysis of passive and ultra-low energy building energy consumption based on EnergyPlus. Build. Energy& Environ. 11, 59–62.
Word Meteorological Organization (2021). State of the global climate 2020. Available at: https://library.wmo.int/doc_num.php?explnum_id=10618 (Accessed July 10, 2023).
Yang, T., Pan, Y., Yang, Y., Lin, M., Qin, B., Xu, P., et al. (2017). CO2 emissions in China's building sector through 2050: a scenario analysis based on a bottom-up model. Energy 128, 208–223. doi:10.1016/j.energy.2017.03.098
Yang, X. (2009). Study of China's building energy efficiency based on energy data. PhD's thesis. Beijing: Tsinghua University. (in Chinese).
Yuan-zhao, L., Wu, Y-T., Yu, J., Lu-heng, B., and Wang, L. (2021). Prediction model for carbon emission of life cycle assessment of high-rise office building based on SVR: take Tianjin as an example. Build. Energy Effic. 49 (09), 25–30. (in Chinese).
Zhang, L., Mi, S., Liu, R., Sang, Y., and Wang, X. (2020). Evaluation of volatile compounds in milks fermented using traditional starter cultures and probiotics based on odor activity value and chemometric techniques. Mol. (Basel, Switz. 25 (09), 1129–1134. doi:10.3390/molecules25051129
Zhang, S., Wang, K., Yang, X., and Xu, W. (2021). Research on emission goal of carbon peak and carbon neutral in building sector. Build. Sci. 37 (08), 189–198. (in Chinese).
Zhang, X., Rasmussen, C., Saelens, D., and Roels, S. (2022). Time-dependent solar aperture estimation of a building: comparing grey-box and white-box approaches. Renew. Sustain. Energy Rev. 161, 112337. doi:10.1016/j.rser.2022.112337
Zhang, X., Saelens, D., and Roels, S. (2023). Impact of solar gain estimation on heat loss coefficient determination using in-situ data: comparing co-heating test with B-splines integrated grey-box modelling. Build. Environ. 243, 110417. doi:10.1016/j.buildenv.2023.110417
Zhang, Z., Wu, X., Yang, X., and Zhu, Y. (2006). BEPAS—A life cycle building environmental performance assessment model. Build. Environ. 41 (5), 669–675. doi:10.1016/j.buildenv.2005.02.028
Zhou, D. (2003). 2020 China sustainable energy scenario. Beijing: China Environmental Science Press. (in Chinese).
Zhou, N., Fridley, D., Khanna, N. Z., Ke, J., McNeil, M., and Levine, M. (2013). China's energy and emissions outlook to 2050: perspectives from bottom-up energy end-use model. Energy Policy 53, 51–62. doi:10.1016/j.enpol.2012.09.065
Zhou, N., Fridley, D., McNeil, M., Zheng, N., Ke, J., and Levine, M. (2011). China's energy and carbon emissions outlook to 2050 (No. LBNL-4472E). Berkeley, CA (United States): Lawrence Berkeley National Lab.
Zhou, N., Khanna, N., Feng, W., Ke, J., and Levine, M. (2018). Scenarios of energy efficiency and CO2 emissions reduction potential in the buildings sector in China to year 2050. Nat. Energy 3 (11), 978–984. doi:10.1038/s41560-018-0253-6
Zhou, N., Price, L., Yande, D., Creyts, J., Khanna, N., Fridley, D., et al. (2019). A roadmap for China to peak carbon dioxide emissions and achieve a 20% share of non-fossil fuels in primary energy by 2030. Appl. Energy 239, 793–819. doi:10.1016/j.apenergy.2019.01.154
Keywords: civil buildings, building energy consumption, energy carbon emission factor, building operation carbon emission, scenario analysis
Citation: Yin W, Zhang W, Gong T, Li X and Liu K (2023) A review of prediction models of total carbon emission for civil buildings in China. Front. Energy Effic. 1:1219776. doi: 10.3389/fenef.2023.1219776
Received: 09 May 2023; Accepted: 11 August 2023;
Published: 01 September 2023.
Edited by:
Rui Guo, KU Leuven, BelgiumReviewed by:
Pei Peng, Wuhan Textile University, ChinaCopyright © 2023 Yin, Zhang, Gong, Li and Liu. This is an open-access article distributed under the terms of the Creative Commons Attribution License (CC BY). The use, distribution or reproduction in other forums is permitted, provided the original author(s) and the copyright owner(s) are credited and that the original publication in this journal is cited, in accordance with accepted academic practice. No use, distribution or reproduction is permitted which does not comply with these terms.
*Correspondence: Wenjie Zhang, emhhbmd3ZW5qaWUwMDFAMTM5LmNvbQ==
Disclaimer: All claims expressed in this article are solely those of the authors and do not necessarily represent those of their affiliated organizations, or those of the publisher, the editors and the reviewers. Any product that may be evaluated in this article or claim that may be made by its manufacturer is not guaranteed or endorsed by the publisher.
Research integrity at Frontiers
Learn more about the work of our research integrity team to safeguard the quality of each article we publish.