
94% of researchers rate our articles as excellent or good
Learn more about the work of our research integrity team to safeguard the quality of each article we publish.
Find out more
ORIGINAL RESEARCH article
Front. Endocrinol., 26 March 2025
Sec. Bone Research
Volume 16 - 2025 | https://doi.org/10.3389/fendo.2025.1566424
This article is part of the Research TopicImaging-Based Methods for Fracture Risk AssessmentView all 9 articles
 Jana Hummel1
 Klaus Engelke1*
 Sandra Freitag-Wolf2
 Eren Yilmas3Stefan Bartenschlager1Sigurdur Sigurdsson4Vilmundur Gudnason4
 Claus-C. Glüer3
 Oliver Chaudry1,5
Introduction: Vertebral fractures (VFs) significantly increase risk of subsequent fractures. Areal bone mineral density (BMD) assessed by DXA and volumetric BMD by QCT, are strong predictors of VF. Nevertheless, risk prediction should be further improved. This study used data from the Age, Gene/Environment Susceptibility Reykjavik (AGES-Reykjavik) cohort to evaluate whether trabecular texture and paraspinal muscle assessments improve the prediction of the first incident VF.
Methods: CT scans of the L1 and L2 vertebrae of 843 elderly subjects; including 167 subjects with incident, VFs occurring within a 5-year period and 676 controls without fractures. Image analysis included measurement of BMD, cortical thickness and of parameters characterizing trabecular architecture and the autochthonous muscles. Fifty variables were used as predictors, including a BMD, a trabecular texture and a muscle subset. Each included age, BMI and corresponding parameters of the QCT analysis. The number of variables in each subset was reduced using stepwise logistic regression to create multivariable fracture prediction models. Model accuracy was assessed using the likelihood ratio test (LRT) and the area under the curve (AUC) criteria. Bootstrap analyses were performed to assess the stability of the model selection process.
Results: 96 women and 78 men with prior VF were excluded. Of 50 initial predictors, 17 were significant for women and 11 for men. Bone and texture models showed significantly better fracture prediction in women (p<0.001) and men (p<0.01) than the combination of age and BMI. The muscle model showed better fracture prediction in men only (p<0.03). Compared to the BMD model alone, LRT showed a significantly improved VF prediction of the combinations of BMD with texture (women and men) (p<0.05) or with muscle models (men only) (p=0.03) but no significant increases in AUC values (AUC women: Age&BMI: 0.57, BMD: 0.69, combined model: 0.69; AUC men: Age&BMI: 0.63, BMD: 0.71, combined models 0.73-0.77)
Discussion: Trabecular texture and muscle parameters significantly improved prediction of first VF over age and BMI, but improvements were small compared to BMD, which remained the primary predictor for both sexes. Although muscle measures showed some predictive power, particularly in men, their clinical significance was marginal. Integral BMD should remain the focus for fracture risk assessment in clinical practice.
Vertebral fractures (VF) are the most common type of osteoporotic fracture (1–3) and significantly increase the risk of subsequent vertebral and other osteoporotic fractures (4, 5). Therefore, risk prediction and prevention of VF is an important goal in osteoporosis (3, 6). Areal bone mineral density (BMD) assessed by Dual X-ray Energy Absorptiometry (DXA) and volumetric BMD assessed by Quantitative Computed Tomography (QCT) are strong predictors of VF. Standardized risk ratios of approximately 2-3 have been determined (7–9), but risk prediction still should be improved and several QCT-based strategies have been developed toward this aim. One successful approach is the determination of vertebral strength by finite element analysis (FEA) (10, 11). Another is the measurement of additional parameters from the QCT scans, such as cortical thickness, trabecular texture and paraspinal muscle characteristics (12).
This study addresses two key questions: (1) Can fracture risk prediction be improved beyond standard BMD measurement? (2) Are additional parameters that would improve fracture risk prediction are easy to measure and applicable across different CT scanners and can they be measured with precision errors of 1-2% (13). From a clinical perspective the first question is most important but from a pathophysiological perspective it may be more interesting to determine whether muscle density, muscle volume and parameters characterizing the muscle fat infiltration predict fractures independently of BMD. Of further interest are the separate contributions of trabecular and cortical bone and of the trabecular architecture to the prediction of the first incident VF.
As shown by a recent meta-analysis there is an increasing number of studies evaluating the ability of QCT to discriminate prevalent VF (14). However, prospective studies using QCT to predict incident VF are rare. A number of different analyses using FEA and lumbar and thoracic BMD parameters have been reported for the AGES-Reykjavik study (7, 15). Thoracic trabecular BMD also predicted incident VF in a large multiethnic MESA study of 6800 subjects with atherosclerosis (16). However, a multivariable approach has not been reported so far.
The relevance of paraspinal, thigh and pelvic muscles and also of soft tissue characteristics for hip (17–21), vertebral (22–24) or multiple (25) fractures has been addressed in several recent CT studies. However, most of these studies focused on the hip and most of them were cross-sectional in design with limited sample size, making the interpretation of multivariable results difficult. As summarized in a recent review (26), other studies have used magnetic resonance imaging to investigate the associations between paraspinal muscle characteristics and osteoporotic fracture, but these studies did not obtain BMD data and MR studies are too time consuming and expensive for wide spread use.
In this study we used a subset of the prospective Age, Gene/Environment Susceptibility Reykjavik (AGES-Reykjavik) study, a large epidemiologic study from Iceland (27) to compare the prognostic power of various CT assessments, including BMD, trabecular texture and paraspinal muscle characteristics in univariate and multivariable models, hypothesizing that prediction of the first incident VF occurrence based on vertebral BMD by QCT may be improved by these additional assessments. The same subset of the AGES-Reykjavik study has been analyzed previously (8), allowing to put our results in perspective with vertebral strength measurement by FEA.
This study utilizes a retrospective analysis of CT scans of the lumbar vertebrae L1 and L2 from a subset of subjects of the study AGES‐Reykjavik (27) of over 5,000 elderly subjects from Iceland. In summary, in a previous study (8) a case-control design was employed to select a subset of 843 subjects (497 women and 346 men). 167 subjects had sustained an incident spine fracture within a 5-year period. Spine fractures were confirmed on CT scout scans covering T6-L4, which were obtained at 5 years after baseline, using the Genant SQ scoring system (28). CT scout scans from the baseline CT scans were used to identify prior vertebral fractures, i.e., those that were already present at the time of the baseline scan. By excluding those, incident vertebral fractures were identified. The 676 subjects of the control group were randomly selected from the AGES cohort without fractures.
All CT scans were performed using the same CT scanner (Sensation 4, Siemens, Erlangen, Germany) with the same CT acquisition and reconstruction protocol (120 kV, tube current modulation with 150 effective mAs, 50 cm FOV, 1 mm slice thickness, 1 mm reconstruction increment, B30s reconstruction kernel). An Image Analysis type 4 phantom (Image Analysis, Inc., Columbia, KY) was utilized for the purpose of simultaneous calibration of CT to BMD values. In the majority of subjects, the CT scan encompassed L1 and L2 vertebrae. However, in cases of fracture or other conditions that resulted in the exclusion of one of these vertebrae from the analysis, T12 and L1 or L2 and L3 vertebrae were scanned instead. The QCT analysis was performed using MIAF-Spine version 6.0.7 (Figure 1, Supplementary Figure S1). All QCT parameters that were analyzed were averaged over the two vertebrae that were covered by the CT scan. It should be noted that DXA scans were not obtained.

Figure 1. CT of the lumbar spine covering L1 and L2. The images show cropped axial and sagittal views. The green cylinders show the volumes of interest (VOIs) used to analyze the 4 different density compartments of the Image Analysis type 4 phantom. The red and blue contours delineate the integral and trabecular VOIs resulting from the 3D segmentation of L1 and L2. The yellow contours delineate the autochthonous muscle VOIs for L1 and L2.
A comprehensive investigation was conducted, encompassing the measurement of three distinct QCT subsets (S1–S3). The first subset, designated as S1 - BMD set, involved a conventional analysis of integral, cortical, and trabecular BMD, BMC, and volume, complemented by an assessment of cortical thickness (13). The second set (S2 - texture set) involved parameters that characterized the trabecular architecture of the vertebral body. The third set (S3 - muscle set) involved parameters that characterized the autochthonous muscles at the vertebral levels present in the CT scan (Figure 1). A detailed description of the parameters used in this study is given in the Supplement. These muscles were not further subdivided. The psoas was not assessed because in comparison to the autochthonous muscles the percentage of intermuscular adipose tissue of the psoas is much lower and the distribution of the muscle tissue is more homogeneous. To enhance the reproducibility of the autochthonous muscle parameters, the outer edges of the muscles were excluded from the segmentation process (29). The distribution of muscle fat infiltration was subsequently measured once more via texture parameters. Further details can be found in the Supplement (Figure S2).
The initial data set comprised age, BMI, and 50 variables that were analyzed by MIAF-Spine. These variables served as predictors for the assessment of the first incident VF. Specifically, S1 comprised 18 predictors, S2 contained 7 predictors and S3 comprised 25 predictors. Detailed descriptions can be found in the Supplement. The z-transformation was employed to standardize all predictors. Subsequent analyses were conducted in two distinct groups: men and women. Sex-specific standard deviations of the control group were utilized for standardization purposes. Standardized age- and BMI-adjusted univariate odds ratios (OR) were calculated for each parameter.
For each subset S1-S3, stepwise logistic regression was used to obtain multivariable fracture prediction models. The initial number of predictors was reduced by minimizing the Akaike information criterion (30). The bidirectional stepwise selection was initiated with a model comprising only age and BMI, and it iteratively evaluated the inclusion or exclusion of predictors. Irrespective of their statistical significance, age and BMI were retained in all models. Other non-significant predictors (p > 0.05) were excluded. The variance inflation factor (VIF) was employed to assess multicollinearity. Predictors with VIF values greater than 5 were systematically eliminated, beginning with the predictor that exhibited the highest VIF. Subsequent to each elimination, a re-evaluation of the model ensued, resulting in the exclusion of further nonsignificant predictors. This iterative process was repeated until all VIF values were below 5, thereby ensuring minimal collinearity among the final predictors of each subset’s model.
The BMD model S1 was selected as the reference model. Significant predictors from another subset model, e.g. the muscle model, were added to S1 to create combined models. The fracture prediction of the combined models was compared with that of S1 using nested logistic regression following the approach suggested by Harrell (30). To ascertain whether the combined model significantly improved fracture prediction compared to S1, the likelihood ratio test (LRT) was used. The LRT adheres to a chi-squared (χ2) distribution and provides p-values for the comparison of nested models. Receiver operator characteristic (ROC) curves and their area under the curve (AUC) values, also used as performance metric, were compared using bootstrap confidence intervals (CI) and tests (31).
The same procedure was applied to compare fracture prediction of individual subsets S1-S3 with that of age and BMI. To assess the stability of the stepwise model selection process, a bootstrap analysis was performed with 1,000 resampled data sets. For each bootstrap sample, the stepwise procedure was repeated, and the frequency of predictor inclusion in the resulting models was recorded. Furthermore, the AUC values were calculated for each bootstrap iteration to assess the variability of model performance.
Finally, the combined models were also calculated in women with fracture SQ grades of 2 and 3, thereby excluding the mild SQ 1 fractures. All statistics were performed using R (R Core Team, version 4.3.2, functions ‘stepAIC’ [package: MASS] and ‘roc.test’ [package: pROC]).
A total of 826 CT data sets (486 women and 340 men) of the original subsample of 843 subjects were analyzed. The analysis of CT scans from 17 subjects was not possible, for the majority of cases due to the presence of excessive osteophyte formation and substantial bone sclerosis in the vicinity of the endplates. At baseline, 96 of the 486 women and 78 of the 340 men had prior VF (Figure 2). These subjects were excluded from the analysis of the current study with the objective of determining the risk prediction of the first incident VF.

Figure 2. Sankey plots illustrating the populations of female and male subjects with prevalent, incident, and no vertebral fractures (VF). QCT images corresponding to the central blue and orange bars were available, while fracture status information for the right blue and pink bars was also included. Black numbers indicate the number of patients in each bar, while white numbers denote the contributions from other bars. It is important to note that subjects with prevalent fractures (orange) were excluded from the analysis in this study; thus, only patients represented in the central blue bar (controls and those with first incident VF) were included for analysis.
Patient characteristics and significant univariate predictors for fracture occurrence in women are shown in Table 1 and in men in Table 2. All univariate ORs were adjusted for age and BMI, which are also included in the aforementioned tables. In women, 17 of the initial 50 predictors were found to be significant predictors of future fractures, while in men, 11 of the initial 50 predictors were found to be significant. The non-significant predictors (p < 0.05) are not displayed in the tables.
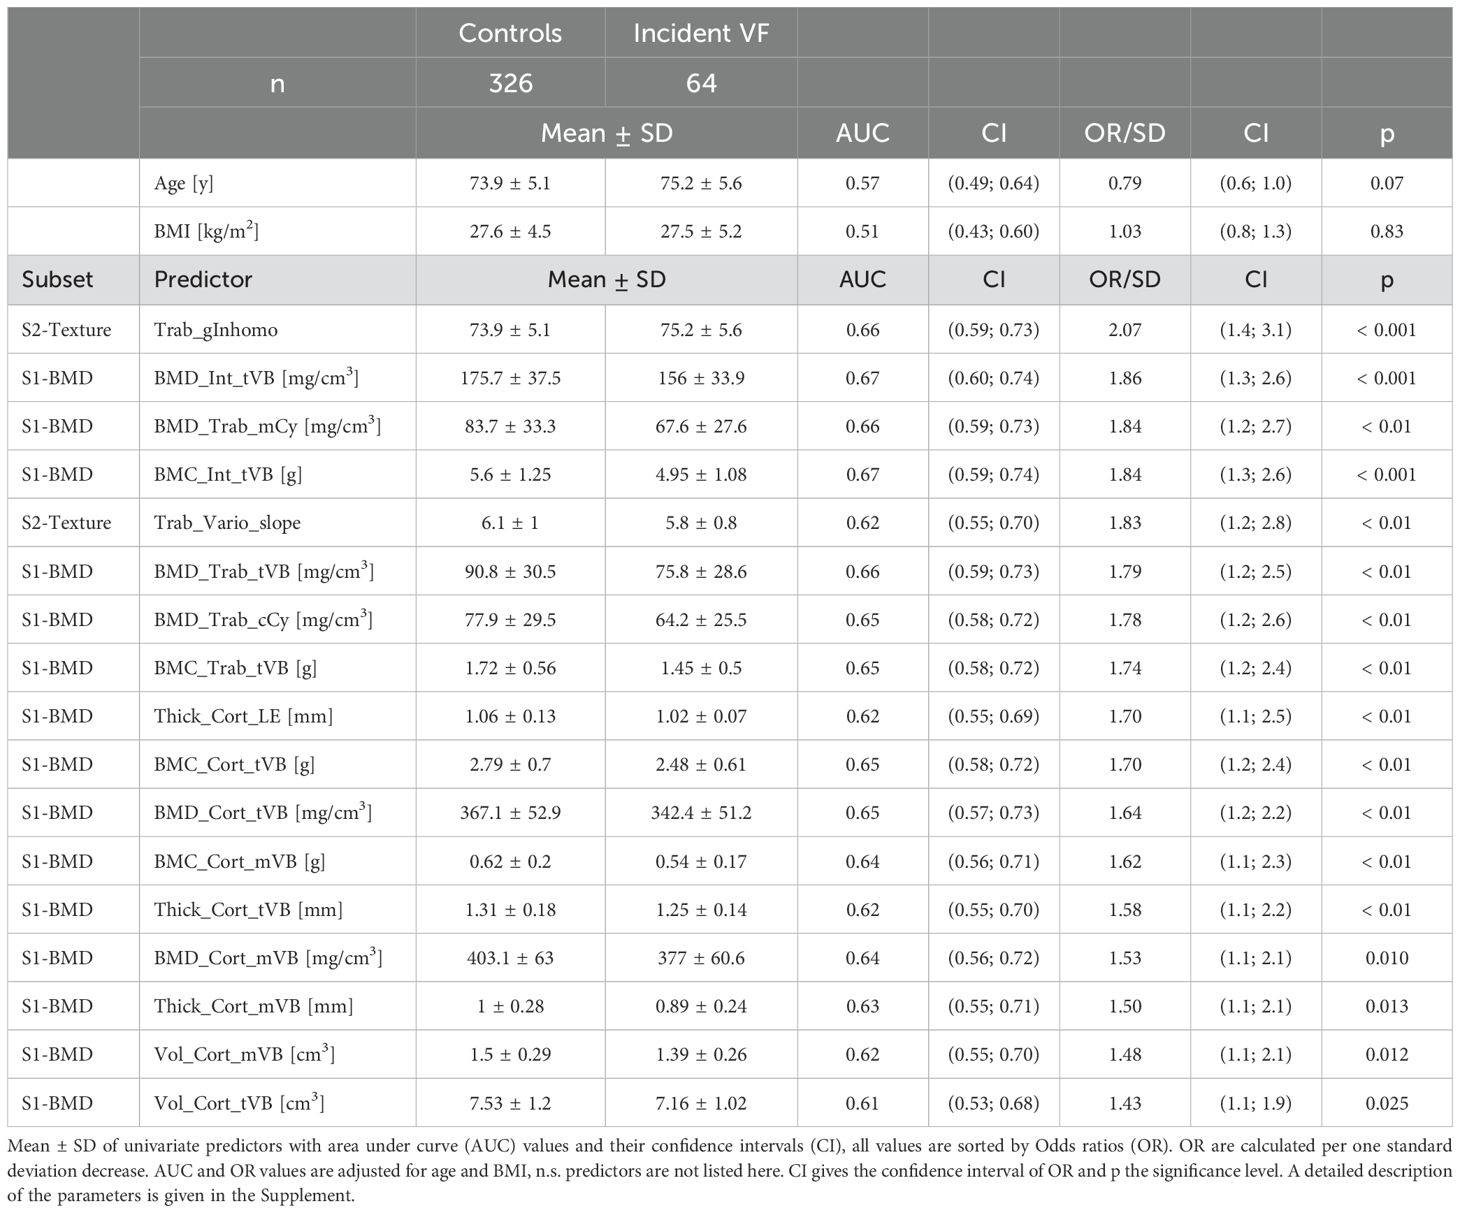
Table 1. Significant univariate predictors of the first incident vertebral fracture in women.
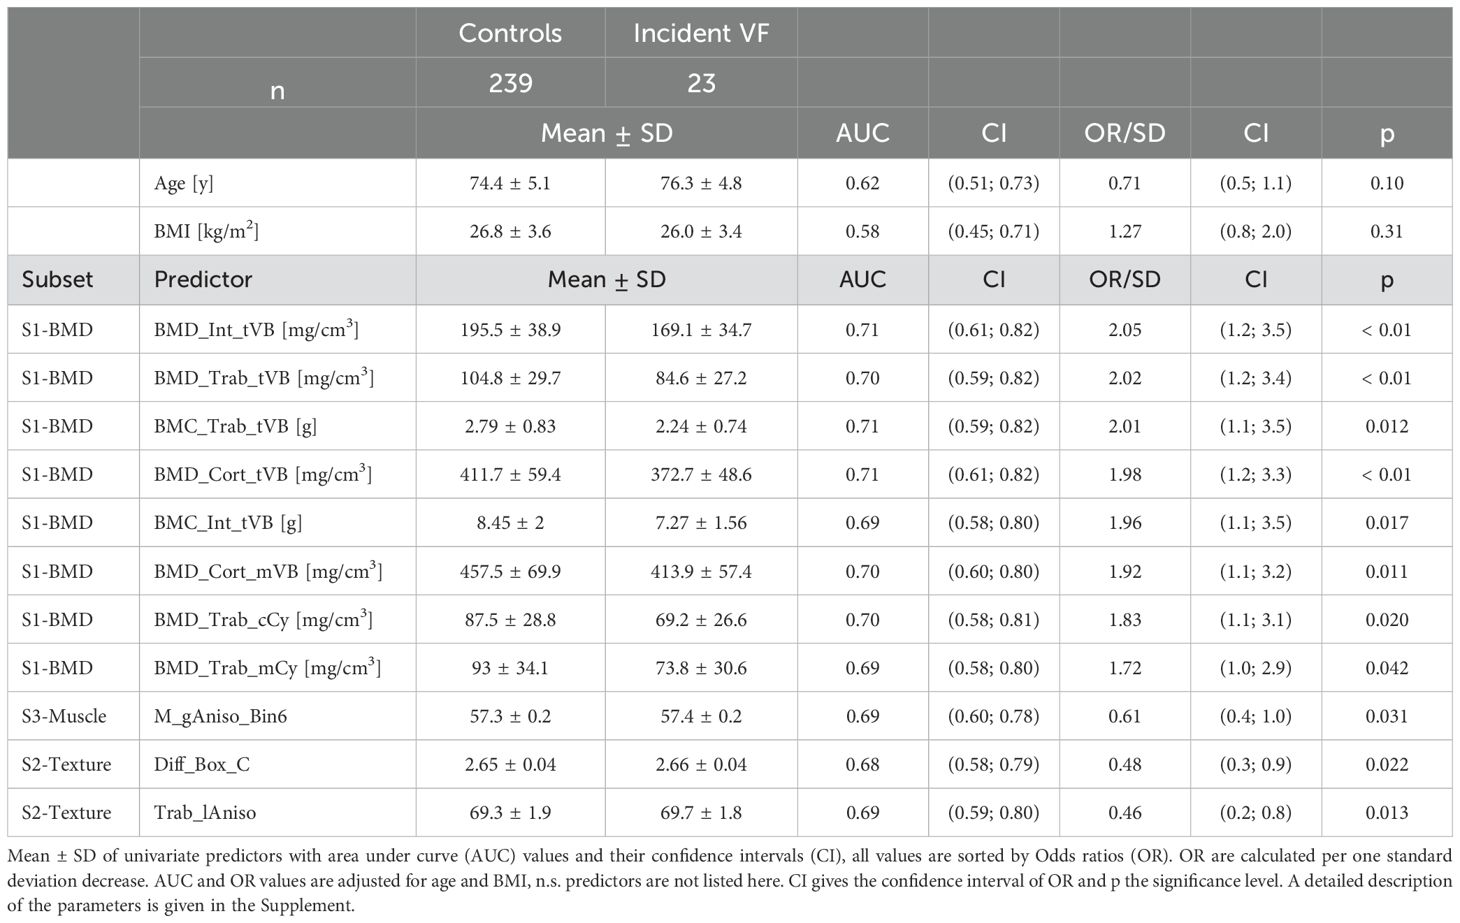
Table 2. Significant univariate predictors of the first incident vertebral fracture in men.
In both sexes, a trabecular texture predictor demonstrated the numerically highest OR for the first incident VF. However, the confidence intervals of ORs for all significant predictors largely overlapped. It is noteworthy that among women, no muscle parameters exhibited statistically significant ORs for the first incident VF, while among men, only one muscle parameter demonstrated a statistically significant OR for the first incident VF. However, the means of this predictor did not differ significantly between male control and fracture cases (p = 0.42).
Table 3; Supplementary Tables S2, S3 present the results of the subset-specific stepwise logistic regressions. The AUC results are presented in Table 3. The predictors that remained in the S1, S2 and S3 models are listed in Supplementary Tables S2, S3. In addition to age and BMI, in the final models only one or two predictors remained of each subset, indicating a high correlation among the parameters analyzed of a given subset. For the sake of comparison, Table 3 also shows results of the model of age and BMI. From LRT results, the models based on S1 and S2 exhibited significantly (p ≤ 0.01) higher fracture prediction than the combination of age and BMI alone (Table 4). This was also the case for S3 in men (p = 0.03) but not in women. Combinations of S2 and S3 models with S1 showed a significant improvement in VF prediction compared to S1 alone (p < 0.05), except for S3 in women.
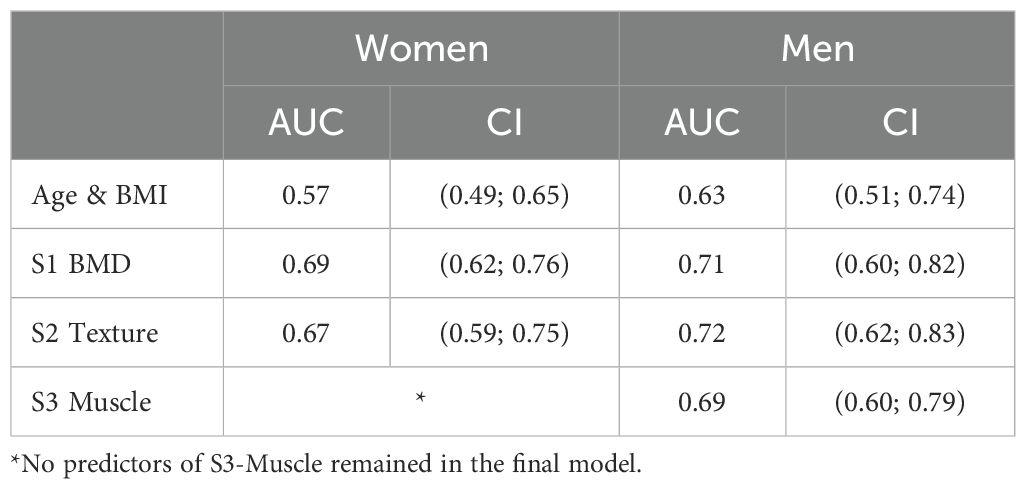
Table 3. AUC values for a combination of age and BMI and for the subset specific models (that are also adjusted for age and BMI).
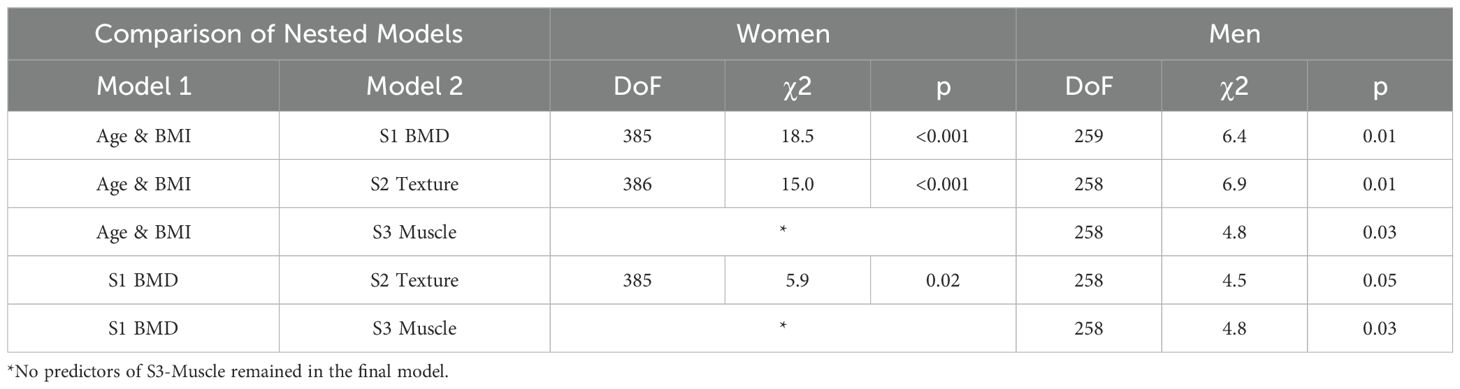
Table 4. Performance of combinations of nested models tested by LRT: Model 1, which is the base model, and Model 2, which represents the combined model.
ROC curve plots are summarized in Figure 3. For women, AUC values of S1 (0.69) and of the S1-S2 combination (0.69) were significantly (p < 0.05) higher than for the combination of age and BMI (0.57) but AUC values of the S1-S2 combination were not significantly higher than for the S1 model. For men, only the S1-S3 combination (0.77) was significantly (p < 0.05) higher than the combination of age and BMI (0.63), no other significant differences were detected.
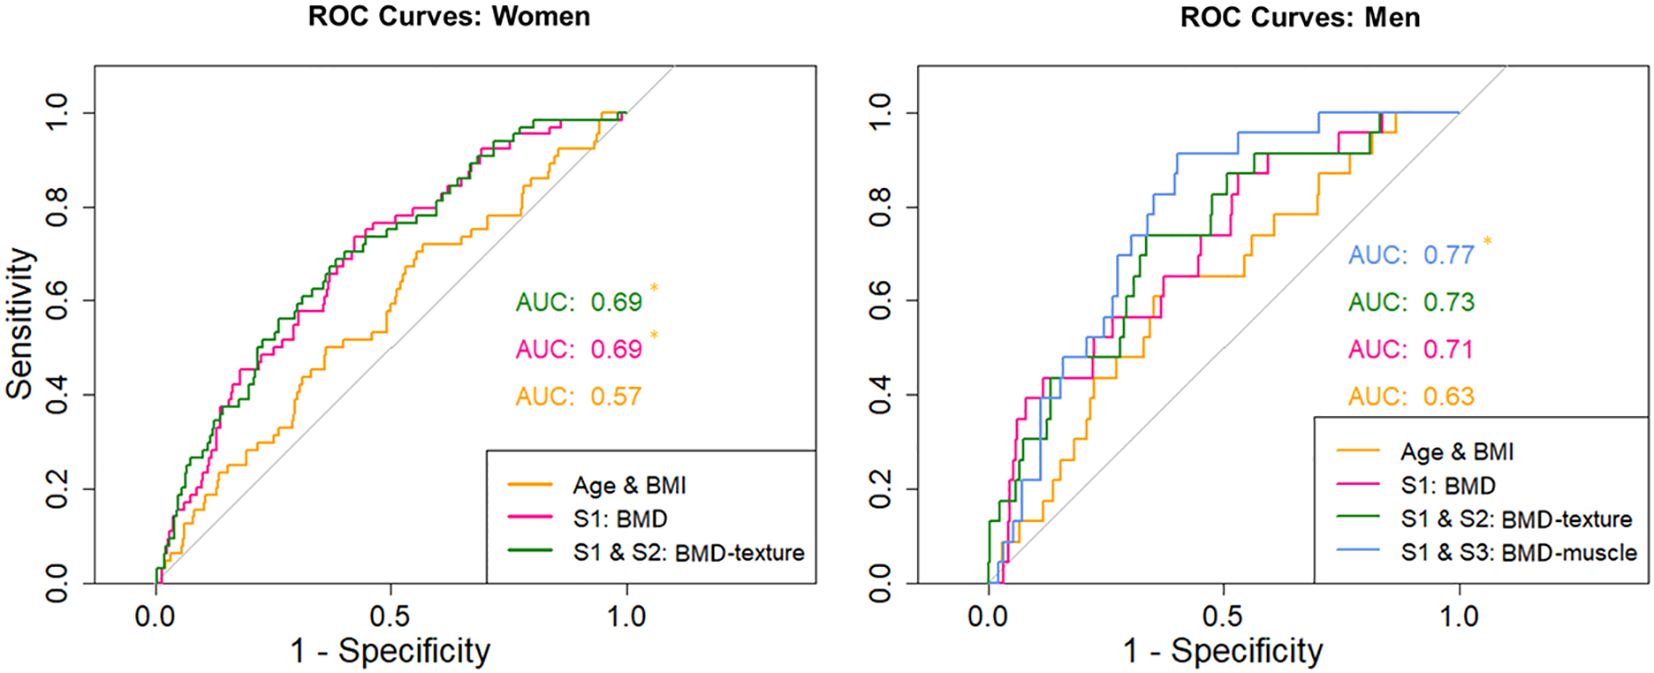
Figure 3. Receiver operator curves for women - for age/BMI, S1 and combinations of S1 with S2. Receiver operator curves for men - for age/BMI, S1 and combinations of S1 with S2 and S1 with S3. Asterisk marks significant difference (p < 0.05) in the AUC values against the model only including age and BMI.
Integral BMD of the vertebral body remained a significant predictor for both men and women in S1, the reference model utilized in this study. In women, the cortical thickness of the lower endplate also persisted as a significant predictor in S1. The bootstrap procedure demonstrated that, including age and BMI, on average 5.4 (CI 3-9) predictors remained significant in women, with a mean AUC of 0.72 (CI 0.65 – 0.79). In men, an average of 5.7 (CI 3-11) predictors remained significant, with a mean AUC of 0.8 (CI 0.71 – 0.92). The frequency of predictors that remained significant in each of the 1,000 resampled datasets is documented in Supplementary Table S4.
For the sake of comparison, the AUC values were also calculated for a manually selected model based on clinical expertise. This model, in addition to age and BMI, consisted of integral BMD of the total vertebral body (BMD_Int_tVB) and cortical thickness measured at the midsection of the vertebral body (Thick_Cort_mVB). However, the latter variable did not emerge as a significant predictor in the previous analysis for both men and women. The AUC results were found to be 0.67 (CI 0.60 – 0.74) for women and 0.72 (CI 0.61 – 0.83) for men.
In women, 34 first incident VFs were diagnosed with SQ 1, while an additional 30 were diagnosed with SQ 2 or SQ 3. Excluding SQ 1 fractures, the AUC values increased to 0.72 for S1, 0.7 for S2, and 0.73 for S3 compared to the values in Table 3. The LRT of S3 exhibited a borderline significant increase (p = 0.05) in comparison to that of age and BMI. The performance of the combined models is shown in Supplementary Table S5. In contrast to the subset encompassing SQ1 to SQ3 fractures, the combination of S2 and S1 no longer was statistically superior in comparison to S1. However, the incorporation of a muscle predictor enhanced the prediction of VF, surpassing the performance of S1. The AUC values remained significantly different for the comparison against age and BMI. For men there were too few cases to perform such an analysis.
In this study, the performance of 50 parameters obtained from QCT scans of the spine was assessed to predict the first incident VF univariately or in combination. Volumetric BMD based models significantly predicted the first incident VF with AUCs at about the same level as those reported for FEA in previously published studies on a sample very similar to ours (8). The analysis revealed that independent of BMD, parameters of trabecular texture and with limitations also of autochthonous muscle significantly improved the prediction of vertebral fractures (VF), compared to age and BMI alone. However, when compared to BMD, the enhancement was minimal and likely to be of negligible clinical significance. Thus age and BMI adjusted volumetric BMD, that can easily be measured with QCT and with excellent precision is the parameter of choice for prediction of incident fractures in clinical routine.
QCT of the spine is typically used to measure average trabecular and integral BMD of L1 and L2 (32). Therefore, the reference model (S1) extracted from 18 different BMD and cortical thickness measures was used as ‘QCT gold standard’ for prediction of the first incident VF. After the reduction of variables in the stepwise logistic regression, only integral BMD of the vertebral body remained for both sexes and in addition, cortical thickness of the lower endplate for women. As age and BMI alone are important predictors of incident VF and in order to be consistent with most publications on fracture prediction that typically report age and BMI adjusted risk ratios or AUC values, age and BMI were retained in all models, even if these two parameters were not significant in the regression step.
The term ‘gold standard’ implies that there is an optimum set of variables that should be used for fracture prediction. However, the bootstrap analysis demonstrated that S1 models with different predictor combinations exhibited average AUCs that were analogous to the reference S1 model utilized in this study. It is noteworthy that parameters of cortical thickness were more frequently incorporated into the models resulting from the bootstrap process than BMD. However, with the exception of cortical thickness of the lower endplate, none of the 18 input predictors occurred in more than 30% of the 1,000 models. While it is unlikely that the S1 reference model of this study overestimated fracture risks due to overfitting, a common problem in multivariable analyses, there is no unique best set of S1 QCT variables to be used for fracture prediction. Conducting a separate analysis of a distinct subset of the AGES population, or even a different study, is likely to yield a different S1 reference model. This phenomenon is also evident in the univariate results, where the adjusted ORs for many variables were found to be highly comparable, despite adjustments for age and BMI.
From a clinical perspective, this is favorable news because a combination of rather esoteric predictor combinations will most likely not predict the first incident VF risk better than a standard set of predictors. Integral BMD, a variable that can easily be measured with high precision (13), is an adequate predictor of incident VF. Cortical thickness of the lower endplate may more reflect sclerotization of the trabecular bone due to vertebral disk impairments than actual cortical thickness of the endplate. Segmentation in this case is challenging and disk impairments were frequent in the AGES population. Nevertheless, the observation that degenerative features of the vertebrae may also be predictive of the first incident VF should be further pursued.
Therefore for the handpicked S1 model cortical thickness of the mid vertebral body was selected, which is less affected by degenerative changes (33–35). AUC values of the handpicked model were well in the range of the bootstrapping results. The addition of mid cortical thickness did only marginally improve VF prediction compared to integral BMD alone.
A notable finding is the observation that the S2 texture model predicted VF independently of the S1 BMD model. In scenarios where a BMD assessment is not feasible, for example in MRI scans, VF prediction is still possible using parameters of trabecular texture, at least in principle. Recent studies have shown that an MRI based texture analysis can be used to discriminate subjects with and without prevalent vertebral fractures (36, 37). However, it is important to remember that texture assessments depend on noise and spatial resolution (38). Thus, MRI texture results will vary significantly among MRI sequences. It should also be noted that all scans analyzed in this study were obtained from the same CT scanner using the same CT protocol. Texture measurements from different scanners may not be directly comparable.
Several other studies have demonstrated the ability of histomorphometry or texture parameters to improve the discrimination of vertebral fractures when compared with BMD (39–43), but none have investigated the ability to predict incident osteoporotic vertebral fractures. Therefore, it is an important finding of this study that texture parameters can be used to predict incident vertebral fractures. Of course, there are many different texture parameters and a radiomics approach may more systematically exploit the potential of texture parameters than the heuristic approach chosen in this study.
A substantial body of research has demonstrated a correlation between muscle metrics and spinal fractures (26, 44, 45). However, the majority of these studies were cross-sectional in design, investigating the associations of muscle metrics with prevalent conditions rather than the prediction of incident VF. In this study the predictive value of paraspinal muscle characteristics was weak, questioning their utility in clinical practice. Muscle parameters significantly predicted VF in women only after excluding the SQ 1 mild fractures and even then, the improvement of fracture prediction compared to age and BMI was only borderline significant. This finding is particularly noteworthy given the comprehensive array of parameters that were examined, encompassing muscle density, fat fraction, and a multitude of texture parameters that characterized the distribution of muscle tissue and intermuscular adipose tissue. In men, a modest effect was observed for muscle tissue anisotropy. However, the clinical interpretation of this finding is challenging, as the anisotropy did not differ significantly between men with and those without incident VF.
In the event of confirmation, the implications are substantial. The role of paraspinal muscle exercise in preventing vertebral fractures remains uncertain. Actually, a recent 12-month study in men demonstrated that exercise had no effect on paraspinal muscles, despite significant training effects on spinal BMD and thigh muscle parameters (46). Further research is needed to determine whether muscle deterioration is a cause or a consequence of fractures.
The multivariable analysis is a big advantage of this study. Instead of just presenting univariate odds or hazard ratios after adjustment for age and BMI (7, 8) the advanced statistical approach of comparing nested combinations of predictors provided the possibility to compare the performance of fracture prediction of different models. The use of the log-likelihood ratio as performance criterion guarantees statistical rigor in identifying the set of predictors that best fit the pattern of incident fractures (30, 47) but beyond the result whether fracture prediction differs, the clinical interpretation of the magnitude of improvement of fracture prediction is difficult. Therefore, we also calculated AUC values as established performance characteristic, which, however, offers less statistical power to test which model is better than others.
As shown in Table 4 and Supplementary Table S5 compared to S1 the inclusion of S2 predictors, which characterize trabecular architecture significantly improved prediction of VF in men and women. However, in women this was no longer the case once mild fractures were excluded. Compared to S1 the inclusion of S3 predictors, which characterize muscle significantly improved prediction of VF in men and after exclusion of SQ 1 fractures also in women. However, the ROC graphs show that AUC values of the combined models did not significantly increase AUC values. Thus, the clinical benefit is rather limited and may not be worth the effort of an advanced QCT analysis. It is a limitation of the study that the number of incident vertebral fractures with grade 2 or 3 was too small in men to perform a separate analysis.
It is another limitation of this study that FEA was not performed and therefore it was not possible to test whether a strength determination would have increased fracture prediction beyond that of BMD. Such an analysis was also not performed in the earlier study that analyzed the same cohort (8). While in that study strength showed the highest OR for fracture prediction, integral BMD was not measured and CI of the OR largely overlapped. OR calculation may be strongly affected by the distribution of the data but no test of normal distribution has been reported in the earlier study. Judging the performance based on ROC analysis showed our QCT results at the same level as the FEA data reported earlier Whether from clinical perspective the advanced method of FEA is worth the additional effort compared to a standard QCT analysis still has to be determined.
While our results do not provide a definitive solution for predicting the first incident VF, they offer valuable insights that may guide future advancements in addressing this inherently complex and unresolved challenge. Surprisingly even with our comprehensive analysis of texture, muscle and bone parameters, none of the parameters or a combination of parameters gave an outstanding improvement over established predictors, namely age and BMI adjusted volumetric BMD. Even muscle parameters that are known to perform well in cross-sectional studies did not perform extraordinary for the prediction of incident VF. The analyzed dataset is exceptionally rare and one of the few that enable such an in-depth analysis. Unfortunately, less than a handful of datasets exist for the prospective analysis of VF using QCT. Nevertheless, it would be highly valuable to validate these findings in future studies.
The datasets presented in this article are not readily available because they were used under license. Restrictions also apply to the availability of data generated or analyzed during this study to preserve patient confidentiality. Data from the AGES-Reykjavik study are available through collaboration under a data usage agreement with the Icelandic Heart Association. Requests to access the datasets should be directed to QUdFU19kYXRhX3JlcXVlc3RAaGphcnRhLmlz.
The studies involving humans were approved by National Institute on Aging, National Bioethics Committee (VSN: 00-063) and the Data Protection Authority. The studies were conducted in accordance with the local legislation and institutional requirements. The participants provided their written informed consent to participate in this study.
JH: Formal analysis, Investigation, Writing – original draft, Writing – review & editing. KE: Conceptualization, Funding acquisition, Investigation, Project administration, Supervision, Writing – original draft, Writing – review & editing. SF-W: Formal analysis, Methodology, Writing – review & editing. EY: Methodology, Validation, Writing – review & editing. SB: Formal analysis, Investigation, Software, Writing – review & editing. SS: Data curation, Resources, Writing – review & editing. VG: Data curation, Resources, Writing – review & editing. CG: Funding acquisition, Project administration, Supervision, Writing – review & editing. OC: Conceptualization, Formal analysis, Methodology, Software, Supervision, Visualization, Writing – original draft, Writing – review & editing.
The author(s) declare that financial support was received for the research and/or publication of this article. This study was in part supported by the Bundesministerium für Bildung und Forschung (BMBF) Project ARTEMIS - Artificial intelligence musculoskeletal disorders study (reference 01EC190B).
The present work was performed in partial fulfilment of the requirements to obtain the degree Dr. med./Dr. med. dent. at Friedrich-Alexander-Universität Erlangen-Nürnberg.
The authors declare that the research was conducted in the absence of any commercial or financial relationships that could be construed as a potential conflict of interest.
The author(s) declare that no Generative AI was used in the creation of this manuscript.
All claims expressed in this article are solely those of the authors and do not necessarily represent those of their affiliated organizations, or those of the publisher, the editors and the reviewers. Any product that may be evaluated in this article, or claim that may be made by its manufacturer, is not guaranteed or endorsed by the publisher.
The Supplementary Material for this article can be found online at: https://www.frontiersin.org/articles/10.3389/fendo.2025.1566424/full#supplementary-material
1. Ballane G, Cauley JA, Luckey MM, El-Hajj-Fuleihan G. Worldwide prevalence and incidence of osteoporotic vertebral fractures. Osteoporos Int. (2017) 28:1531–42. doi: 10.1007/s00198-017-3909-3
2. Clark P, Cons-Molina F, Deleze M, Ragi S, Haddock L, Zanchetta JR, et al. The prevalence of radiographic vertebral fractures in Latin American countries: the Latin American Vertebral Osteoporosis Study (LAVOS). Osteoporos Int. (2009) 20:275–82. doi: 10.1007/s00198-008-0657-4
3. Kendler DL, Bauer DC, Davison KS, Dian L, Hanley DA, Harris ST, et al. Vertebral fractures: clinical importance and management. Am J Med. (2016) 129:221 e1–10. doi: 10.1016/j.amjmed.2015.09.020
4. Lorentzon M, Litsne H, Axelsson KF. The significance of recent fracture location for imminent risk of hip and vertebral fractures-a nationwide cohort study on older adults in Sweden. Osteoporos Int. (2024) 35:1077–87. doi: 10.1007/s00198-024-07072-x
5. Kanis JA, Johansson H, McCloskey EV, Liu E, Akesson KE, Anderson FA, et al. Previous fracture and subsequent fracture risk: a meta-analysis to update FRAX. Osteoporos Int. (2023) 34:2027–45. doi: 10.1007/s00198-023-06870-z
6. Allam AK, Anand A, Flores AR, Ropper AE. Computer vision in osteoporotic vertebral fracture risk prediction: A systematic review. Neurospine. (2023) 20:1112–23. doi: 10.14245/ns.2347022.511
7. Johannesdottir F, Allaire B, Kopperdahl DL, Keaveny TM, Sigurdsson S, Bredella MA, et al. Bone density and strength from thoracic and lumbar CT scans both predict incident vertebral fractures independently of fracture location. Osteoporos Int. (2021) 32:261–9. doi: 10.1007/s00198-020-05528-4
8. Kopperdahl DL, Aspelund T, Hoffmann PF, Sigurdsson S, Siggeirsdottir K, Harris TB, et al. Assessment of incident spine and hip fractures in women and men using finite element analysis of CT scans. J Bone Miner Res. (2014) 29:570–80. doi: 10.1002/jbmr.2069
9. Johansson L, Johansson H, Axelsson KF, Litsne H, Harvey NC, Liu E, et al. Improved fracture risk prediction by adding VFA-identified vertebral fracture data to BMD by DXA and clinical risk factors used in FRAX. Osteoporos Int. (2022) 33:1725–38. doi: 10.1007/s00198-022-06387-x
10. Wang X, Sanyal A, Cawthon PM, Palermo L, Jekir M, Christensen J, et al. Prediction of new clinical vertebral fractures in elderly men using finite element analysis of CT scans. J Bone Miner Res. (2012) 27:808–16. doi: 10.1002/jbmr.1539
11. Zysset P, Qin L, Lang T, Khosla S, Leslie WD, Shepherd JA, et al. Clinical use of quantitative computed tomography-based finite element analysis of the hip and spine in the management of osteoporosis in adults: the 2015 ISCD official positions-part II. J Clin Densitom. (2015) 18:359–92. doi: 10.1016/j.jocd.2015.06.011
12. Engelke K, Museyko O, Wang L, Laredo JD. Quantitative analysis of skeletal muscle by computed tomography imaging-State of the art. J Orthop Translat. (2018) 15:91–103. doi: 10.1016/j.jot.2018.10.004
13. Engelke K, Mastmeyer A, Bousson V, Fuerst T, Laredo JD, Kalender WA. Reanalysis precision of 3D quantitative computed tomography (QCT) of the spine. Bone. (2009) 44:566–72. doi: 10.1016/j.bone.2008.11.008
14. Ma HY, Zhang RJ, Zhou LP, Wang YX, Wang JQ, Shen CL, et al. Comparative effectiveness of four techniques for identifying vertebral fragility fractures among elderly patients. Eur Radiol. (2024). doi: 10.1007/s00330-024-11292-4
15. Johannesdottir F, Allaire B, Bouxsein ML. Fracture prediction by computed tomography and finite element analysis: current and future perspectives. Curr Osteoporos Rep. (2018) 16:411–22. doi: 10.1007/s11914-018-0450-z
16. Li D, Mao SS, Budoff MJ. Trabecular bone mineral density as measured by thoracic vertebrae predicts incident hip and vertebral fractures: the multi-ethnic study of atherosclerosis. Osteoporos Int. (2024) 35:1061–8. doi: 10.1007/s00198-024-07040-5
17. Lang T, Cauley JA, Tylavsky F, Bauer D, Cummings S, Harris TB, et al. Computed tomographic measurements of thigh muscle cross-sectional area and attenuation coefficient predict hip fracture: the health, aging, and body composition study. J Bone Miner Res. (2010) 25:513–9. doi: 10.1359/jbmr.090807
18. Lang T, Koyama A, Li C, Li J, Lu Y, Saeed I, et al. Pelvic body composition measurements by quantitative computed tomography: association with recent hip fracture. Bone. (2008) 42:798–805. doi: 10.1016/j.bone.2007.12.002
19. Muhlberg A, Museyko O, Bousson V, Pottecher P, Laredo JD, Engelke K. Three-dimensional distribution of muscle and adipose tissue of the thigh at CT: association with acute hip fracture. Radiology. (2019) 290:426–34. doi: 10.1148/radiol.2018181112
20. Wang L, Yin L, Yang M, Ge Y, Liu Y, Su Y, et al. Muscle density is an independent risk factor of second hip fracture: a prospective cohort study. J Cachexia Sarcopenia Muscle. (2022) 13:1927–37. doi: 10.1002/jcsm.12996
21. Wang L, Yin L, Zhao Y, Su Y, Sun W, Liu Y, et al. Muscle density discriminates hip fracture better than computed tomography X-ray absorptiometry hip areal bone mineral density. J Cachexia Sarcopenia Muscle. (2020) 11:1799–812. doi: 10.1002/jcsm.12616
22. Sollmann N, Franz D, Burian E, Loffler MT, Probst M, Gersing A, et al. Assessment of paraspinal muscle characteristics, lumbar BMD, and their associations in routine multi-detector CT of patients with and without osteoporotic vertebral fractures. Eur J Radiol. (2020) 125:108867. doi: 10.1016/j.ejrad.2020.108867
23. Zhang Y, Dilixiati Y, Jiang W, Cao X, Chen Y, Guo H. Correlation of psoas muscle index with fragility vertebral fracture: A retrospective cross-sectional study of middle-aged and elderly women. Int J endocrinol. (2022) 2022:4149468. doi: 10.1155/2022/4149468
24. Zhang J, Xia L, Zhang X, Liu J, Tang J, Xia J, et al. Development and validation of a predictive model for vertebral fracture risk in osteoporosis patients. Eur Spine J. (2024) 33:3242–60. doi: 10.1007/s00586-024-08235-4
25. Wong AK, Cawthon PM, Peters KW, Cummings SR, Gordon CL, Sheu Y, et al. Bone-muscle indices as risk factors for fractures in men: the Osteoporotic Fractures in Men (MrOS) Study. J Musculoskelet Neuron Interact. (2014) 14:246–54.
26. Chen Z, Shi T, Li W, Sun J, Yao Z, Liu W. Role of paraspinal muscle degeneration in the occurrence and recurrence of osteoporotic vertebral fracture: A meta-analysis. Front endocrinol. (2022) 13:1073013. doi: 10.3389/fendo.2022.1073013
27. Harris TB, Launer LJ, Eiriksdottir G, Kjartansson O, Jonsson PV, Sigurdsson G, et al. Age, Gene/Environment Susceptibility-Reykjavik Study: multidisciplinary applied phenomics. Am J Epidemiol. (2007) 165:1076–87. doi: 10.1093/aje/kwk115
28. Genant HK, Wu CY, van Kuijk C, Nevitt M. Vertebral fracture assessment using a semi-quantitative technique. J Bone Miner Res. (1993) 8:1137–48. doi: 10.1002/jbmr.5650080915
29. Engelke K, Museyko O, Günzel D, Meier A, Laredo J eds. A new CT based approach to quantify adipose tissue in paraspinal muscle. Montreal, Canada: JBMR (2018).
31. Davison AC, Hinkley D. Bootstrap Methods and Their Application. New York, NY, USA: Cambridge University Press (1997).
32. Engelke K, Adams JE, Armbrecht G, Augat P, Bogado CE, Bouxsein ML, et al. Clinical use of quantitative computed tomography and peripheral quantitative computed tomography in the management of osteoporosis in adults: the 2007 ISCD official positions. J Clin Densitom. (2008) 11:123–62. doi: 10.1016/j.jocd.2007.12.010
33. Grams AE, Rehwald R, Bartsch A, Honold S, Freyschlag CF, Knoflach M, et al. Correlation between degenerative spine disease and bone marrow density: a retrospective investigation. BMC Med Imag. (2016) 16:17. doi: 10.1186/s12880-016-0123-2
34. Guglielmi G, Floriani I, Torri V, Li J, van Kuijk C, Genant HK, et al. Effect of spinal degenerative changes on volumetric bone mineral density of the central skeleton as measured by quantitative computed tomography. Acta Radiol. (2005) 46:269–75. doi: 10.1080/02841850510012661
35. Wang Y, Battie MC, Boyd SK, Videman T. The osseous endplates in lumbar vertebrae: thickness, bone mineral density and their associations with age and disk degeneration. Bone. (2011) 48:804–9. doi: 10.1016/j.bone.2010.12.005
36. Dash AS, Breighner R, Gonzalez FQ, Blumberg O, Koff MF, Billings E, et al. Individuals with heterogenous trabecular bone texture by clinical MRI have lower bone strength and stiffness by QCT based finite element analysis. J Bone Miner Res. (2024) 40(3):339–47. doi: 10.1093/jbmr/zjae207
37. Zaworski C, Cheah J, Koff MF, Breighner R, Lin B, Harrison J, et al. MRI-based texture analysis of trabecular bone for opportunistic screening of skeletal fragility. J Clin Endocrinol Metab. (2021) 106:2233–41. doi: 10.1210/clinem/dgab342
38. Lowitz T, Museyko O, Bousson V, Kalender WA, Laredo JD, Engelke K. Characterization of knee osteoarthritis-related changes in trabecular bone using texture parameters at various levels of spatial resolution-a simulation study. BoneKEy Rep. (2014) 3:615. doi: 10.1038/bonekey.2014.110
39. Ito M. Assessment of bone quality using micro-computed tomography (micro-CT) and synchrotron micro-CT. J Bone Miner Metab. (2005) 23 Suppl:115–21. doi: 10.1007/BF03026335
40. Saravi B, Zink A, Tabukashvili E, Guzel HE, Ulkumen S, Couillard-Despres S, et al. Integrating radiomics with clinical data for enhanced prediction of vertebral fracture risk. Front Bioeng Biotechnol. (2024) 12:1485364. doi: 10.3389/fbioe.2024.1485364
41. Yadav RN, Oravec DJ, Drost J, Flynn MJ, Divine GW, Rao SD, et al. Textural and geometric measures derived from digital tomosynthesis discriminate women with and without vertebral fracture. Eur J Radiol. (2025) 183:111925. doi: 10.1016/j.ejrad.2025.111925
42. Poullain F, Champsaur P, Pauly V, Knoepflin P, Le Corroller T, Creze M, et al. Vertebral trabecular bone texture analysis in opportunistic MRI and CT scan can distinguish patients with and without osteoporotic vertebral fracture: A preliminary study. Eur J Radiol. (2023) 158:110642. doi: 10.1016/j.ejrad.2022.110642
43. Nagarajan MB, Checefsky WA, Abidin AZ, Tsai H, Wang X, Hobbs SK, et al. Characterizing trabecular bone structure for assessing vertebral fracture risk on volumetric quantitative computed tomography. Proc SPIE Int Soc Opt Eng. (2015) 9417. doi: 10.1117/12.2082059
44. Huang W, Cai XH, Li YR, Xu F, Jiang XH, Wang D, et al. The association between paraspinal muscle degeneration and osteoporotic vertebral compression fracture severity in postmenopausal women. J Back Musculoskelet Rehabil. (2023) 36:323–9. doi: 10.3233/BMR-220059
45. Kim HJ, Yang JH, Chang DG, Suk SI, Suh SW, Song KS, et al. Significance of paraspinal muscle quality in risk between single and multiple osteoporotic vertebral fractures. Eur Spine J. (2023) 32:1763–70. doi: 10.1007/s00586-023-07670-z
46. Ghasemikaram M, Chaudry O, Nagel AM, Uder M, Jakob F, Kemmler W, et al. Effects of 16 months of high intensity resistance training on thigh muscle fat infiltration in elderly men with osteosarcopenia. Geroscience. (2021) 43:607–17. doi: 10.1007/s11357-020-00316-8
Keywords: fracture prediction, vertebral fracture, computed tomography, BMD, muscle, trabecular texture
Citation: Hummel J, Engelke K, Freitag-Wolf S, Yilmas E, Bartenschlager S, Sigurdsson S, Gudnason V, Glüer CC and Chaudry O (2025) Trabecular texture and paraspinal muscle characteristics for prediction of first vertebral fracture: a QCT analysis from the AGES cohort. Front. Endocrinol. 16:1566424. doi: 10.3389/fendo.2025.1566424
Received: 24 January 2025; Accepted: 05 March 2025;
Published: 26 March 2025.
Edited by:
Egon Burian, Zurich University Hospital, SwitzerlandReviewed by:
Ram Naresh Yadav, Henry Ford Hospital, United StatesCopyright © 2025 Hummel, Engelke, Freitag-Wolf, Yilmas, Bartenschlager, Sigurdsson, Gudnason, Glüer and Chaudry. This is an open-access article distributed under the terms of the Creative Commons Attribution License (CC BY). The use, distribution or reproduction in other forums is permitted, provided the original author(s) and the copyright owner(s) are credited and that the original publication in this journal is cited, in accordance with accepted academic practice. No use, distribution or reproduction is permitted which does not comply with these terms.
*Correspondence: Klaus Engelke, a2xhdXMuZW5nZWxrZUBmYXUuZGU=
Disclaimer: All claims expressed in this article are solely those of the authors and do not necessarily represent those of their affiliated organizations, or those of the publisher, the editors and the reviewers. Any product that may be evaluated in this article or claim that may be made by its manufacturer is not guaranteed or endorsed by the publisher.
Research integrity at Frontiers
Learn more about the work of our research integrity team to safeguard the quality of each article we publish.