 Dan Zhao
 Yawen Bo1†
- 1Department of Endocrinology, The Second People’s Hospital of Changzhou, The Third Affiliated Hospital of Nanjing Medical University, Changzhou, Jiangsu, China
- 2Department of Geriatrics, The Second People’s Hospital of Changzhou, The Third Affiliated Hospital of Nanjing Medical University, Changzhou, Jiangsu, China
Background: Multiple studies have indicated that the minimal model of hip structure can enhance hip fracture risk assessment. This study aimed to investigate the independent association between minimal model variables and hip fracture risk in Han Chinese individuals.
Methods: This cross-sectional study included 937 Han Chinese patients (248 with hip fractures). Minimal model variables were calculated from the hip structural analysis, including bone mineral density (BMD), femoral neck width (FNW), and Delta and Sigma values.
Results: This study included 937 patients (293 men; mean age = 68.3 years). In logistic regression analyses, BMD increase (per 0.1 g/cm2) correlated with a 45% reduction in the hip fracture risk (odds ratio [OR] = 0.55; 95% confidence interval [CI]: 0.45–0.68) after adjusting for all covariates. However, FNW (per 0.1 cm) and Sigma (per 0.01 cm) and Delta values (per 0.01 cm) were associated with increased risks (OR = 1.28; 95% CI: 1.18–1.37; OR = 1.06; 95% CI: 1.03–1.09; OR = 1.06; 95% CI: 1.03–1.09, respectively). When the Delta was >0.17 cm, the risk of hip fracture rose considerably by 13% (OR = 1.13; 95% CI: 1.08–1.18) for every 0.01 cm that the Delta value increased. The area under the curve (AUC) for hip fracture prediction from BMD alone was significantl lower than those of minimal model (0.781 vs 0.838, p <0.05).
Conclusion: Large increases in FNW, Sigma and Delta values and notable declines in BMD were individually and significantly linked to a high hip fracture risk in Han Chinese adults. Our findings suggest that the minimal model of hip structure may improve hip fracture risk assessments.
1 Introduction
Hip fracture is a significant public health concern worldwide. The projected total annual incidence of hip fractures in many countries will nearly double between 2018 and 2050 (1). In 2019, the incidence and prevalence of hip fractures in China were approximately 2.0 million and 2.6 million, respectively, each representing approximately 1/9 of the global total cases (2). As China’s population continues to age in the forthcoming years, the country will encounter an increasing number of hip fracture-related issues.
Approximately 40 years after its inception, two-dimensional dual-energy X-ray absorptiometry (DXA), which measures the areal bone mineral density (aBMD) in the proximal femora, remains the most clinically used predictor of fracture risk (3, 4). However, academics are beginning to pay attention to the biomechanical implications of bone structural geometry on bone fragility (5–7). To capture the bone structure in cross sections at the femoral neck, Beck et al. created an eight-variable structural model known as hip structural analysis (HSA) using typical DXA imaging data (8). Rathbun et al. have reported that the proximal femur experiences a decline in bone structure and strength during hip fracture recovery that is significantly greater than that observed in older Caucasian men during normal aging (9). In native Chinese women, cortical thickness reduction or an increase in the buckling ratio may independently predict the risk of femoral neck fragility fractures, regardless of BMD (10).
However, the eight metrics typically documented using Beck’s HSA approach at each anatomical location were not autonomous (11). Utilizing HSA variables, Khoo et al. investigated the beam theory to develop a novel formulation, termed the minimum model (MM), which encompasses information equivalent to the eight structural geometric measures typically supplied at the femoral neck using the HSA technique. The MM consists of four parameters as follows: BMD and femoral neck width (FNW), along with two novel summary measures of internal bone distribution: Sigma and Delta (11). Prince et al. concluded that the clinical prediction of hip fractures was significantly enhanced by adding Delta measurements to hip BMD and age in elderly women (12). However, studies regarding the independent correlation between MM variables and the risk of hip fractures in Chinese adults are scarce.
This study aimed to investigate whether MM variables are significantly related to hip fracture risk in Han Chinese individuals, while controlling for all confounders. Furthermore, we implemented a receiver operating characteristic (ROC) analysis to compare the discriminative ability of MM against the use of femoral neck BMD alone.
2 Materials and methods
2.1 Study population
This retrospective cross-sectional study was performed at the Department of Orthopedics of the Second People’s Hospital of Changzhou, Changzhou, Jiangsu, China. The inclusion and exclusion criteria for the participants were previously delineated (13). Participants with malignant tumors, poliomyelitis, renal failure, hormone use, elevated serum liver enzyme activity, or increased serum creatinine levels (n = 54) were excluded. Hip fractures were confirmed through a physician’s examination of the radiology reports, and the analysis included 937 participants, comprising 248 with hip fractures (Figure 1).

Figure 1. Flow diagram of the screening and enrollment processes of study participants. AST, aspartate aminotransferase; ALT, alanine aminotransferase.
2.2 Measurements of clinical and laboratory parameters
Previous reports have documented the measurements of clinical and laboratory parameters (13). Weight (kg) and height (m) were assessed using a weighing scale, with the participants wearing light clothing and no shoes (RGZ-120-RT; Hengqi Inc., China). Body mass index (BMI; kg/m2)was calculated by dividing weight (kg) by height squared (m2). A glycosylated hemoglobin type-A1c (HbA1c) level > 6.5%, fasting glucose level > 7.0 mmol/L, and a self-reported history of a medical diagnosis of diabetes were considered indicators of diabetes.
Blood samples were collected from all participants within 24 h of admission following an overnight fast of at least 8 h. White blood cells (WBC), red blood cells (RBC), and platelets (PLT) were counted using a self-service hematology analyzer (XN-2800, Sysmex Inc.). Further biomarkers measured using a Siemens ADVIA-2400 included ALT, AST, alkaline phosphatase (ALP), albumin (ALB), blood urea nitrogen (BUN), creatinine (CCR), triglycerides (TG), high-density lipoprotein cholesterol (HDL-C), low-density lipoprotein cholesterol (LDL-C), fasting plasma glucose (FPG), and C-reactive protein (CRP). HbA1c levels were evaluated using the TOSOH G8-90SL. An ALIFAX TEST1-2730 device was used to assess the erythrocyte sedimentation rate (ESR).
2.3 BMD measurements
DXA scans of the hips were acquired using the Hologic Discovery Wi (Hologic Inc., Bedford, MA, USA). All scanners were operated by certified personnel. The bone density analyzed was defined as the projected aBMD of the left femoral neck in participants without fractures. The contralateral femoral neck was measured in patients with hip fractures.
The HSA program used in this study was created at Johns Hopkins University and incorporated into Hologic’s APEX product. As previously described (8), the HSA algorithm calculates structural parameters directly from the mass profiles: the total mineralized bone surface in the cross-section (CSA, cm2), cross-sectional moment of inertia (CSMI, cm4), section modulus (SM, cm3), and FNW (cm), the femoral neck area divided by the width of the neck box (the width of the femoral neck region was standardized at 1.5 cm).
2.4 Minimal model of hip structure
After revisiting the beam theory, the MM was conceived by KB and developed by Khoo et al. (11). The standard deviation of this mineral mass projection profile was Sigma (σ, cm), which is a measure of the variability of the mineral mass distribution along the mineral mass projection profile. Delta (δ, cm) represents the distance between the center of mass and the center of geometry for the mineral mass projection profile, indicating the section’s asymmetry. These two variables, in addition to BMD and FNW, constitute MM. Calculated from HSA measures, σ (Equation 1) and δ (Equation 2) can be defined as follows:
2.5 Statistical analysis
Patients were categorized into two groups according to the incidence of hip fractures: normally distributed continuous variables are expressed as means ± standard deviations (SDs), whereas skewed continuous variables are reported as medians with interquartile ranges. Categorical variables are presented as percentages (%). The chi-squared test, independent samples t-test, and Kruskal–Wallis test were used for categorical, normally distributed variables, and skewed distributions, respectively. For continuous variables with missing values of <2%, missing values were substituted with means or median values.
The independent association between MM variables and risk of hip fracture was assessed using multivariate logistic regression analysis. Both non-adjusted and multivariate-adjusted models were used, with the results presented as odds ratios (ORs) and 95% confidence intervals (CIs). These confounders were selected based on expert judgment, previous scientific literature, and all significant covariates identified in univariate analysis. Two models were developed; model I was adjusted for age, BMI, and gender, and model II was adjusted for model I + diabetes, WBC, RBC, PLT, ALT, ALP, ALB, CCR, TG, LDL-C, FPG, CRP, and ESR.
Interaction and stratified analyses were performed based on gender, the presence of diabetes mellitus, age, and BMI. To measure the subgroup heterogeneity, we multiplied the two predictor variables and added a new term to the model. We assessed the potential effect of the modification of diabetes and Sigma on hip fracture risk by calculating the interactions on both multiplicative and additive scales. Sigma was categorized into two groups (dichotomized). A cross-product interaction term was incorporated into the logistic regression model to evaluate the multiplicative interactions. The additive interaction was evaluated using two indices: the relative excess risk due to the interaction (RERI) and the attributable proportion due to the interaction (AP) (14). Both the RERI and AP were 0 if there was no additive interaction.
Generalized additive models (GAM) were used to discern nonlinear relationships, considering that the MM variables were continuous, and potential confounders were adjusted for. Utilizing smoothed curves, a two-segment linear regression model was developed to ascertain the threshold effects. The threshold levels of Delta were established through a recursive methodology that included identifying turning points in conjunction with predefined intervals as well as selecting turning points that produced a maximum likelihood model. A log-likelihood ratio test was used to evaluate the two-segment linear regression model against a nonlinear linear model.
The evaluation of each model’s predictive capability was conducted through receiver operating characteristic (ROC) curve analysis. The area under the ROC curve (AUC) served as a metric to assess the risk of hip fractures. The AUC of minimal model of hip structure was compared to the AUC of femoral neck BMD alone.
The R statistical software (version 4.2.2, http://www.R-project.org, The R Foundation) and Free Statistics Analysis Platform (version 1.9, Beijing, China, http://www.clinicalscientists.cn/freestatistics) were used to conduct all analyses (15). Free Statistics is a software program that provides user-friendly interfaces for common analysis and data visualization. The software uses R as the core statistical engine with a graphical user interface created in Python. Statistical significance was defined as a two-sided p < 0.05.
3 Results
3.1 Baseline characteristics of the study participants
This study included 937 Han Chinese individuals (293 men and 644 women). The baseline clinical and biochemical features of the patients stratified according to the incidence of hip fractures are presented in Table 1. The age of the participants ranged from 31 to 99 years, with a mean age of 68.3 years (SD = 10.5). Participants with fractures exhibited older age and greater height, FNW, and Sigma and Delta values than those without fractures. Additionally, they demonstrated significantly lower CSA, SM, BMI, and BMD values.
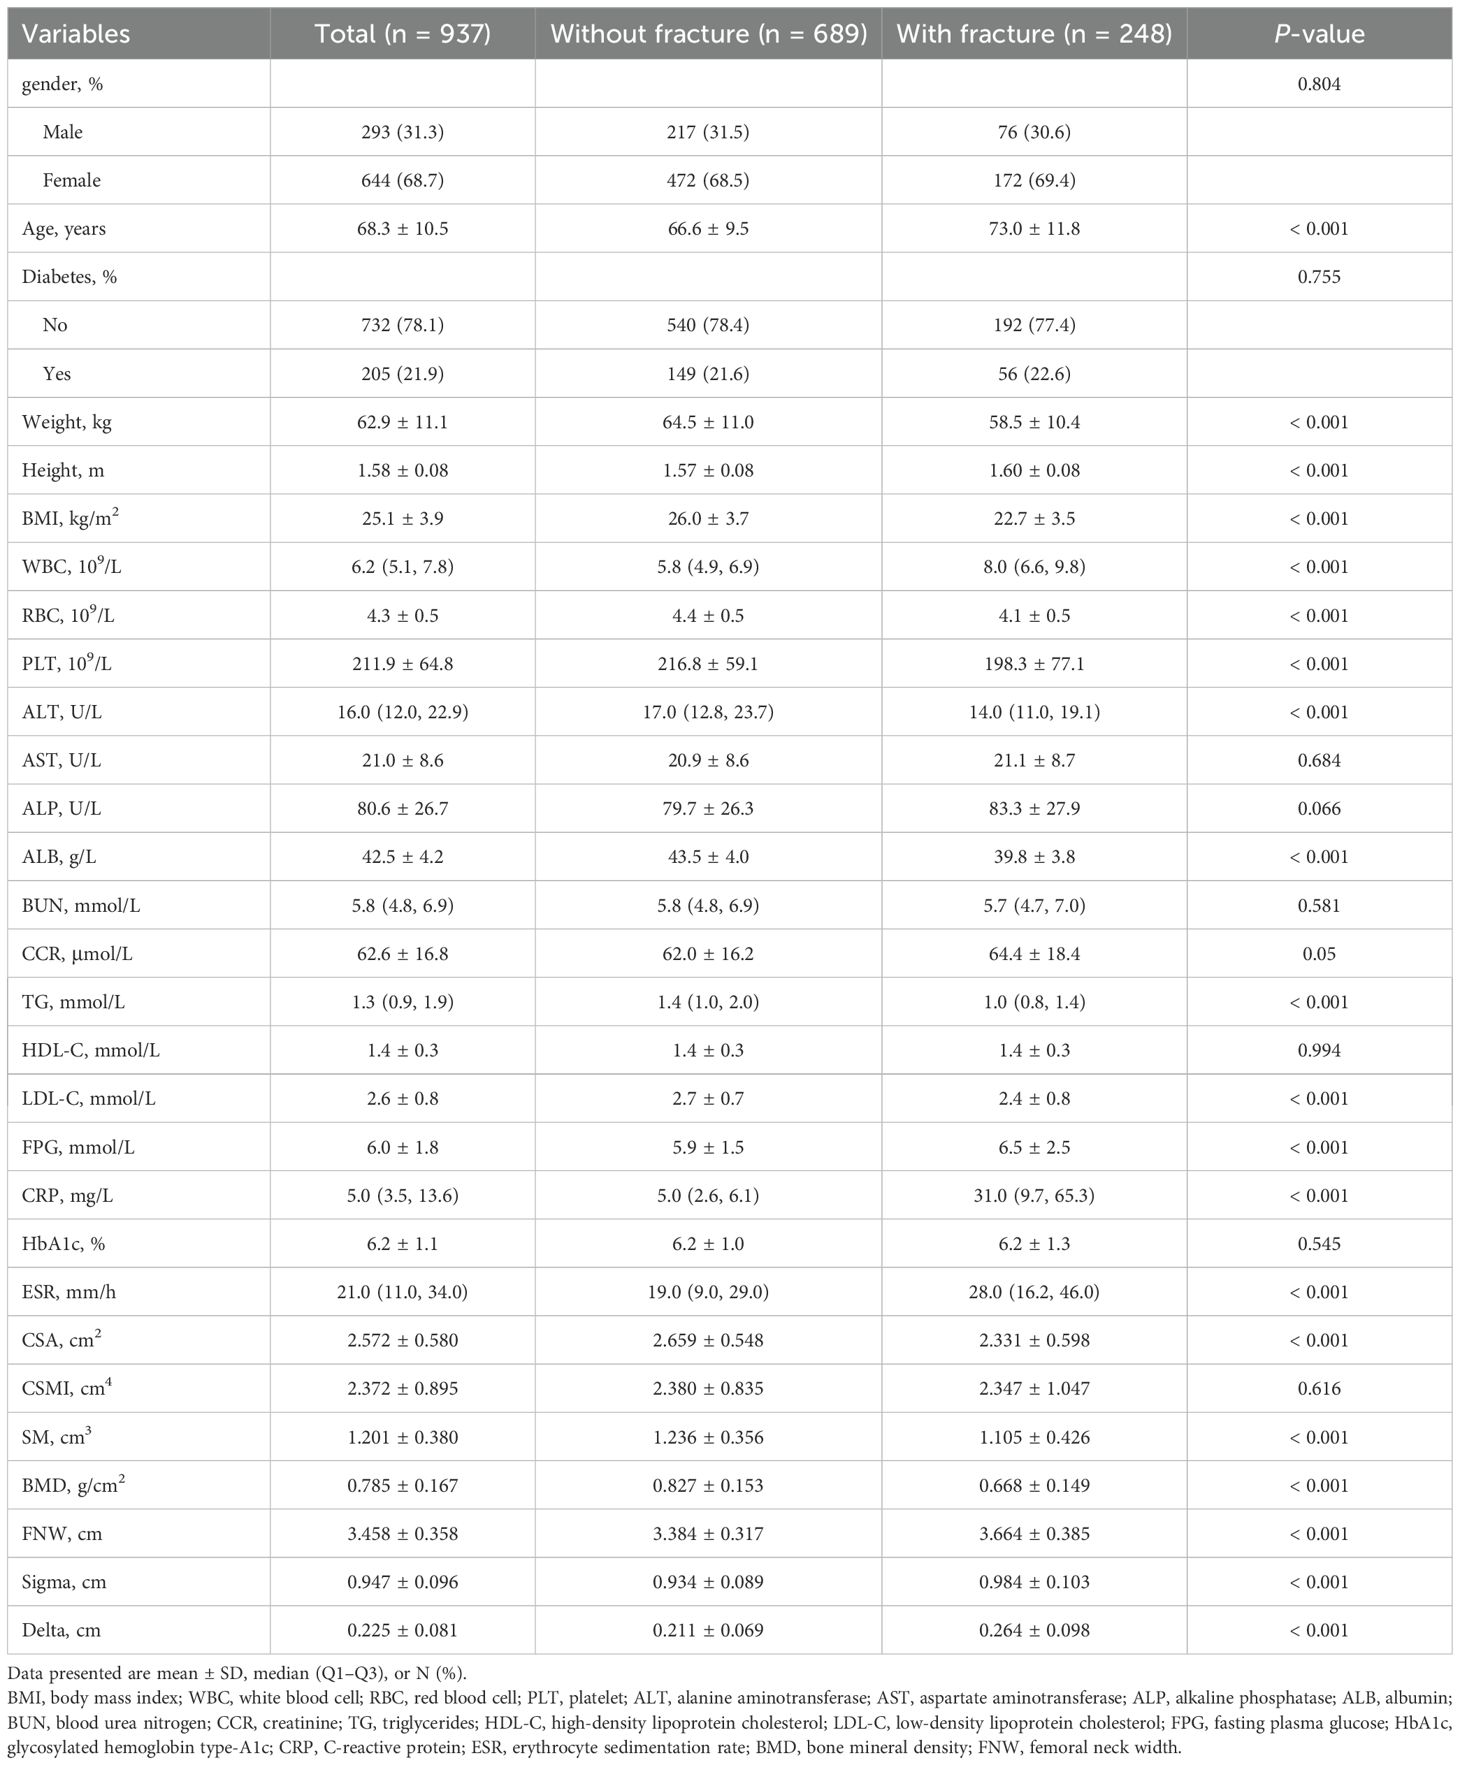
Table 1. Baseline characteristics of participants.
3.2 Logistic regression analyses
The risk of hip fracture increased with higher FNW (OR = 1.26; 95% CI: 1.20–1.32), Sigma values (OR = 1.06; 95% CI: 1.04–1.07), and Delta values (OR = 1.09; 95% CI:1.07–1.11) in the univariate logistic regression analyses. Additionally, a negative correlation was identified between the risk of hip fracture and BMD (OR = 0.47; 95% CI: 0.42–0.54). Age, BMI, WBC, RBC, PLT, ALT, ALP, ALB, CCR, TG, LDL-C, FPG, and CRP levels, and ESR were correlated with the risk of hip fracture, as adjusted in model II. Other factors such as AST, BUN, HDL-C, and HbA1c levels did not show significant associations (Supplementary Table 1).
The results of the multivariate logistic regression analysis are presented in Table 2. The association remained significant after controlling for age, BMI, and gender. In model II, BMD increase (per 0.1 g/cm2) was associated with a 45% decrease in the risk of hip fracture (OR = 0.55; 95% CI: 0.45–0.68); however, FNW (per 0.1 cm), Sigma (per 0.01 cm), and Delta (per 0.01 cm) measurements were associated with an increased risk of hip fracture (OR = 1.28; 95% CI: 1.18–1.37; OR = 1.06; 95% CI: 1.03–1.09; OR = 1.06; 95% CI: 1.03–1.09).

Table 2. Association between simplified hip structure analysis method and the risk of hip fracture.
3.3 Subgroup analyses
Subgroup analyses were conducted to further investigate the impact of age, gender, BMI, and diabetes on study outcomes. The results of these analyses are shown in Figure 2. The effect sizes of BMD, FNW, and Delta on the risk of hip fractures remained robust and reliable. Nevertheless, the association between Sigma and the risk of hip fracture was not statistically significant in the patients aged <65 years (OR = 1.04; 95% CI: 0.98–1.11) and diabetes (OR = 1.0; 95% CI: 0.94–1.07) groups. No interactions were detected, except for the impact of diabetes and Sigma on the risk of hip fracture (p for multiplicative interaction < 0.05). Subsequently, we analyzed additive interaction and observed no interactions between diabetes and Sigma regarding the risk of hip fractures (all p > 0.05; Supplementary Table 2).

Figure 2. Association between BMD, FNW, Sigma, Delta, and the risk of hip fracture in Subgroup analyses based on gender, diabetes, age, and BMI. Each stratification adjusted for all factors (age, BMI, gender, diabetes, white blood cells, red blood cells, platelets, alanine aminotransferase, alkaline phosphatase, albumin, creatinine, triglycerides, low-density lipoprotein cholesterol, fasting plasma glucose, C-reactive protein, erythrocyte sedimentation rate) except the stratification factor itself. BMI, body mass index; BMD, bone mineral density; FNW, femoral neck width.
3.4 GAM
A multivariate logistic regression model based on restricted cubic splines was used to fit the data with confounders adjusted in accordance with model II. The estimated dose–response curve revealed a substantial linear association between BMD, FNW, Sigma, and the risk of hip fracture (Supplementary Figure 1; p for nonlinearity > 0.05). A curved rather than a linear relationship was observed between the Delta measurement and risk of hip fracture after adjusting for all covariates. Using a two-segment linear regression model, the Delta value was 0.17 cm (Figure 3).

Figure 3. (a) A curved relationship between Delta and the risk of hip fracture. Adjustment factors included age, body mass index, gender, diabetes, white blood cells, red blood cells, platelets, alanine aminotransferase, alkaline phosphatase, albumin, creatinine, triglycerides, low-density lipoprotein cholesterol, fasting plasma glucose, C-reactive protein, and erythrocyte sedimentation rate. (b) Threshold levels of Delta were determined using a recursive approach that involved selecting turning points along with predefined intervals and selecting turning points that yielded a maximum likelihood model.
3.5 Threshold effect analysis
Above the threshold, the risk of hip fracture was significantly increased by 13% (OR = 1.13; 95% CI: 1.08–1.18) for every 0.01 cm Delta increase. When Delta was <0.17 cm, a decrease in Delta was linked to a higher risk of hip fracture; however, this association was not statistically significant (p > 0.05) (Table 3).

Table 3. Threshold effect analysis of the association between Delta values and the risk of hip fracture.
3.6 ROC analysis
Figure 4 presents the C-statistic for sensitivity and specificity regarding hip fracture risks. The area under the curve for predicting hip fractures based on BMD was 0.781 (0.747, 0.816). The AUC2 for minimal model of hip structure was significantly greater than that of BMD (0.838 vs 0.781, p < 0.05).

Figure 4. ROC analysis and AUC for hip fracture prediction. AUC1: BMD; AUC2: Minimal Model. BMD, FNW, Delta, and Sigma values comprised the minimal model variables. C statistics for the difference between AUC1 (0.781) and AUC2 (0.838), P < 0.001. BMD, bone mineral density; FNW, femoral neck width.
4 Discussion
This retrospective cross-sectional study included 937 Han Chinese adults, of whom 248 had hip fractures. Large increases in FNW and Sigma and Delta values and notable declines in BMD were separately and significantly linked to a higher risk of hip fracture after adjusting for age, BMI, gender, and clinical risk factors. The subgroup and additive interaction analyses confirmed the robustness of these associations. Apart from Delta measurement, we observed a linear association between BMD, FNW, Sigma, and the risk of hip fracture in the GAM analysis.
An increased Delta value indicates a downward shift in the center of mass, suggesting a decrease in bone mass in the upper region of the femoral neck cross-section (16). This deficiency in the superior segment is commonly acknowledged to contribute to hip fractures by facilitating buckling, a type of compressive failure (17). Prince has reported that each SD increment of Delta corresponded to a hazard ratio (HR) of 1.51 for the risk of femoral neck fracture (95% CI: 1.17–1.94) (12), aligning with findings reported by Khoo et al. (18, 19). In our study, an increase in Delta (per 0.01 cm) was linked to a 6% higher risk of hip fracture (OR = 1.06; 95% CI: 1.03–1.09).
Interestingly, the Delta value and risk of hip fracture showed a curved link. A decrease in Delta value was associated with a lower hip fracture risk (OR = 0.89; 95% CI: 0.76–1.04) when the Delta value decreased to <0.17 cm. Above the threshold, the risk of hip fracture increased considerably by 13% (OR = 1.13; 95% CI: 1.08–1.18) for every 0.01 cm increase in the Delta value. To the best of our knowledge, this study is the first to comprehensively elucidate the dose–response relationship, providing new insights into the prediction and treatment of femoral neck fractures.
However, the relationship between Sigma and fracture risk remains unclear. In a study involving elderly women from Beijing, Khoo et al. indicated a low Sigma (per SD) as a risk factor (OR = 0.70; 95% CI: 0.54–0.92) (19). However, Prince did not identify a significant association in the Perth Longitudinal Study of Aging in Women Sigma [(per SD); HR = 0.72; 95% CI: 0.46–1.10] (12). In Khoo’s study, each SD increment of Sigma corresponded to a 116% increase in the risk of hip fracture among Chinese men (OR = 2.16; 95% CI: 1.24–3.78) (18). Our data indicate a significant association between Sigma and the risk of hip fractures [Sigma (per 0.01 cm); OR = 1.06; 95% CI: 1.03–1.09], applicable to both genders. Greater Sigma values reflect a reduction in trabecular bone mass near the center of mass of the femoral neck cross-section because they indicate a larger mineral mass distribution (17).
In this study, we observed a lower BMD, greater FNW, wider mineral mass distribution around the center of mass, and an inferomedial shift in the center of mass, which were significantly associated with a higher risk of hip fractures, which is consistent with previous research findings (20–22). Structural inadequacy of the femoral neck may be correlated with the prevalent remodeling imbalance associated with aging (7, 23, 24). The limited mechanical requirements of middle and old age may be accommodated by the retention of the inferomedial femoral neck cortex and preferential loss of the superolateral cortex (25). This alteration may confer a protective effect during physiological stance loading as demonstrated by Fox et al. Conversely, it should reduce strength during bending during falls (26).
Multiple studies indicate that low BMD is the most sensitive predictor of hip fractures among clinical risk factors (27, 28). However, the present study demonstrated that minimal model of hip structure had a much greater prediction ability for hip fractures compared to BMD alone (AUC: 0.838 vs 0.781, p < 0.05). Our findings indicate that minimal model of hip structure may improve hip fracture risk assessments.
Our study has several limitations. First, this study was conducted on Han Chinese individuals; therefore, the findings may not apply to other ethnic groups. Second, the cross-sectional retrospective design prevented us from confirming a causal relationship between hip MM variables and risk of hip fractures. Third, we cannot rule out the possibility that unmeasured confusing elements could be responsible for the observed correlations, even after adjusting for confounding factors to the fullest extent possible. Finally, the two groups revealed some differences in baseline characteristics, and the participants with hip fractures were older than those without hip fractures. Nevertheless, we managed the most pertinent variables in the logistic regression models. Consequently, multicenter randomized controlled trials with robust designs are essential to validate our findings.
5 Conclusions
Large increases in FNW, Sigma and Delta values, and notable declines in BMD were separately and significantly linked to a high risk of hip fractures in Han Chinese adults. The Delta value and risk of hip fracture showed a curved link. Thus, our findings suggest that the minimal model of hip structure may improve hip fracture risk assessments.
Data availability statement
The datasets presented in this article are not readily available because the data contains sensitive patient information that is subject to strict confidentiality and ethical guidelines. The data includes personal health records and identifiable information, which cannot be shared publicly to protect patient privacy and comply with data protection regulations. Requests to access the datasets should be directed to Dan Zhao, Z2xlYW0yMDI0QDE2My5jb20=.
Ethics statement
The studies involving humans were approved by Ethics Review Board of Changzhou Second People’s Hospital (approval number: KY017-01; April 24, 2023). The studies were conducted in accordance with the local legislation and institutional requirements. Written informed consent for participation was not required from the participants or the participants’ legal guardians/next of kin in accordance with the national legislation and institutional requirements.
Author contributions
DZ: Conceptualization, Formal Analysis, Methodology, Software, Writing – original draft, Writing – review & editing. YB: Investigation, Supervision, Writing – original draft. HB: Data curation, Investigation, Writing – original draft. CZ: Investigation, Methodology, Writing – original draft. XY: Conceptualization, Project administration, Supervision, Writing – review & editing.
Funding
The author(s) declare that no financial support was received for the research and/or publication of this article.
Acknowledgments
We thank the Free Statistics team for providing technical assistance and valuable tools for data analysis and visualization. In addition, DZ wishes to thank all the members of the team of Clinical Scientists who have provided her with powerful spiritual support and encouragement.
Conflict of interest
The authors declare that the research was conducted in the absence of any commercial or financial relationships that could be construed as a potential conflict of interest.
Generative AI statement
The author(s) declare that no Generative AI was used in the creation of this manuscript.
Publisher’s note
All claims expressed in this article are solely those of the authors and do not necessarily represent those of their affiliated organizations, or those of the publisher, the editors and the reviewers. Any product that may be evaluated in this article, or claim that may be made by its manufacturer, is not guaranteed or endorsed by the publisher.
Supplementary material
The Supplementary Material for this article can be found online at: https://www.frontiersin.org/articles/10.3389/fendo.2025.1558622/full#supplementary-material
References
1. Sing C-W, Lin T-C, Bartholomew S, Bell JS, Bennett C, Beyene K, et al. Global epidemiology of hip fractures: Secular trends in incidence rate, post-fracture treatment, and all-cause mortality. J Bone Miner Res. (2023) 38:1064–75. doi: 10.1002/jbmr.4821
2. Yang W, Li G, Liu J. The incidence, prevalence, and health burden of hip fractures in China: Data from the global burden of disease study 2019. Prev Med Rep. (2024) 38:102622. doi: 10.1016/j.pmedr.2024.102622
3. Marshall D, Johnell O, Wedel H. Meta-analysis of how well measures of bone mineral density predict occurrence of osteoporotic fractures. BMJ. (1996) 312:1254–9. doi: 10.1136/bmj.312.7041.1254
4. Nordin BEC, Prince RL, Tucker GRR. Bone density and fracture risk. Med J Aust. (2008) 189:7–8. doi: 10.5694/j.1326-5377.2008.tb01885.x
5. Nurzenski MK, Briffa NK, Price RI, Khoo BCC, Devine A, Beck TJ, et al. Geometric indices of bone strength are associated with physical activity and dietary calcium intake in healthy older women. J Bone Miner Res. (2007) 22:416–24. doi: 10.1359/jbmr.061115
6. Kaptoge S, Beck TJ, Reeve J, Stone KL, Hillier TA, Cauley JA, et al. Prediction of incident hip fracture risk by femur geometry variables measured by hip structural analysis in the study of osteoporotic fractures. J Bone Miner Res. (2008) 23:1892–904. doi: 10.1359/jbmr.080802
7. Poole KES, Mayhew PM, Rose CM, Brown JK, Bearcroft PJ, Loveridge N, et al. Changing structure of the femoral neck across the adult female lifespan. J Bone Miner Res. (2010) 25:482–91. doi: 10.1359/jbmr.090734
8. Beck TJ. Extending DXA beyond bone mineral density: Understanding hip structure analysis. Curr Osteoporos Rep. (2007) 5:49–55. doi: 10.1007/s11914-007-0002-4
9. Rathbun AM, Magaziner J, Shardell MD, Beck TJ, Yerges-Armstrong LM, Orwig D, et al. Differences in geometric strength at the contralateral hip between men with hip fracture and non-fractured comparators. Bone. (2020) 132:115187. doi: 10.1016/j.bone.2019.115187
10. Li L, Shen Y, Tan L-H, Zhang H, Dai R-C, Yuan L-Q, et al. Association of osteoporotic fractures of femoral neck and femoral neck geometric parameters in native Chinese women. BMC Musculoskelet Disord. (2024) 25:349. doi: 10.1186/s12891-024-07483-1
11. Khoo BCC, Brown K, Zhu K, Price RI, Prince RL. Effects of the assessment of 4 determinants of structural geometry on QCT- and DXA-derived hip structural analysis measurements in elderly women. J Clin Densitom. (2014) 17:38–46. doi: 10.1016/j.jocd.2013.03.009
12. Prince R, Khoo B, Brown K, Lewis J. Differences in femoral neck and trochanteric structure in elderly women prior to hip fracture: role in hip fracture prediction. J Bone Miner Res. (2023) 38:869–75. doi: 10.1002/jbmr.4789
13. Zhao D, Bai H, Bo Y. Association between composite indices of femoral neck strength and odds of hip fracture. Arch Osteoporos. (2024) 19:76. doi: 10.1007/s11657-024-01436-w
14. Assmann SF, Hosmer DW, Lemeshow S, Mundt KA. Confidence intervals for measures of interaction. Epidemiology. (1996) 7:286–90. doi: 10.1097/00001648-199605000-00012
15. Yang Q, Zheng J, Chen W, Chen X, Wen D, Chen W, et al. Association between preadmission metformin use and outcomes in intensive care unit patients with sepsis and type 2 diabetes: A cohort study. Front Med (Lausanne). (2021) 8:640785. doi: 10.3389/fmed.2021.640785
16. Khoo BCC, Lewis JR, Brown K, Prince RL. Evaluation of a simplified hip structure analysis method for the prediction of incident hip fracture events. Osteoporosis Int. (2016) 27:241–8. doi: 10.1007/s00198-015-3282-z
17. Thomas CDL, Mayhew PM, Power J, Poole KE, Loveridge N, Clement JG, et al. Femoral neck trabecular bone: Loss with aging and role in preventing fracture. J Bone Miner Res. (2009) 24:1808–18. doi: 10.1359/jbmr.090504
18. Khoo BCC, Wang L, Lewis JR, Brown K, Cheng X, Prince RL. Structural factors associated with femoral neck fractures and its prediction in Chinese males. J Clin Densitometry. (2021) 24:597–602. doi: 10.1016/j.jocd.2021.01.002
19. Khoo BCC, Wang L, Lewis JR, Brown K, Cheng X, Prince RL. Anatomical factors associated with femoral neck fractures of elderly beijing women. Arch Osteoporos. (2020) 15:112. doi: 10.1007/s11657-020-00780-x
20. Rivadeneira F, Zillikens MC, De Laet CE, Hofman A, Uitterlinden AG, Beck TJ, et al. Femoral neck BMD is a strong predictor of hip fracture susceptibility in elderly men and women because it detects cortical bone instability: the Rotterdam study. J Bone Miner Res. (2007) 22:1781–90. doi: 10.1359/jbmr.070712
21. Ensrud KE, Schousboe JT, Crandall CJ, Leslie WD, Fink HA, Cawthon PM, et al. Hip fracture risk assessment tools for adults aged 80 years and older. JAMA Netw Open. (2024) 7:e2418612. doi: 10.1001/jamanetworkopen.2024.18612
22. Tobias JH, Nethander M, Faber BG, Heppenstall SV, Ebsim R, Cootes T, et al. Femoral neck width genetic risk score is a novel independent risk factor for hip fractures. J Bone Mineral Res. (2024) 39:241–51. doi: 10.1093/jbmr/zjae002
23. Johannesdottir F, Poole KES, Reeve J, Siggeirsdottir K, Aspelund T, Mogensen B, et al. Distribution of cortical bone in the femoral neck and hip fracture: A prospective case-control analysis of 143 incident hip fractures; the AGES-REYKJAVIK study. Bone. (2011) 48:1268–76. doi: 10.1016/j.bone.2011.03.776
24. K B, B K, L JR, P E, P Rl. Ageing effects on 3-dimensional femoral neck cross-sectional asymmetry: Implications for age-related bone fragility in falling. J Clin densitometry. (2019) 22(2):153–61. doi: 10.1016/j.jocd.2018.08.001
25. Mayhew PM, Thomas CD, Clement JG, Loveridge N, Beck TJ, Bonfield W, et al. Relation between age, femoral neck cortical stability, and hip fracture risk. Lancet. (2005) 366:129–35. doi: 10.1016/S0140-6736(05)66870-5
26. Jc F, Tm K. Trabecular eccentricity and bone adaptation. J Theor Biol. (2001) 212(2):211–21. doi: 10.1006/jtbi.2001.2371
27. Johnell O, Kanis JA, Oden A, Johansson H, De Laet C, Delmas P, et al. Predictive value of BMD for hip and other fractures. J Bone Miner Res. (2005) 20:1185–94. doi: 10.1359/JBMR.050304
Keywords: hip structure, minimal model, delta, sigma, hip fracture
Citation: Zhao D, Bo Y, Bai H, Zhao C and Ye X (2025) Association between the minimal model of hip structure and risk of hip fracture in Chinese adults. Front. Endocrinol. 16:1558622. doi: 10.3389/fendo.2025.1558622
Received: 10 January 2025; Accepted: 28 February 2025;
Published: 18 March 2025.
Edited by:
Nico Sollmann, Ulm University Medical Center, GermanyReviewed by:
David Paglia, Rutgers University, Newark, United StatesQiang Jiao, Second Hospital of Shanxi Medical University, China
Copyright © 2025 Zhao, Bo, Bai, Zhao and Ye. This is an open-access article distributed under the terms of the Creative Commons Attribution License (CC BY). The use, distribution or reproduction in other forums is permitted, provided the original author(s) and the copyright owner(s) are credited and that the original publication in this journal is cited, in accordance with accepted academic practice. No use, distribution or reproduction is permitted which does not comply with these terms.
*Correspondence: Xinhua Ye, Y3p5eGgyMDAwQDE2My5jb20=; Cuiping Zhao, TG55eGsyMDIxQDE2My5jb20=
†These authors have contributed equally to this work and share first authorship
‡These authors have contributed equally to this work and share last authorship
§ORCID: Dan Zhao, orcid.org/0000-0003-1911-6559