 Bingbing Shen
 Yu Zhang2
- 1Division of Thyroid Surgery, Department of General Surgery, Laboratory of Thyroid and Parathyroid Diseases, Frontiers Science Center for Disease-Related Molecular Network, West China Hospital, Sichuan University, Chengdu, China
- 2Laboratory of Aging Research and Cancer Drug Target, State Key Laboratory of Biotherapy and Cancer Center, National Clinical Research Center for Geriatrics, West China Hospital, Sichuan University, Chengdu, China
- 3Department of Biotherapy, Cancer Center, West China Hospital, Sichuan University, Chengdu, China
Background: Papillary thyroid carcinoma (PTC) is a common endocrine tumor with a rapidly increasing incidence. While surgery and radioactive iodine treatment are effective for most patients, they impose significant economic and psychological burdens. Metabolic dysregulation, particularly in fatty acid metabolism (FAM), plays a critical role in cancer progression and immune responses. Identifying key FAM-related genes in PTC may provide valuable biomarkers and potential treatment candidates.
Materials and methods: We analyzed 309 FAM-related genes to build a prognostic signature. DEGs were identified and a multivariate Cox regression model was utilized to establish a robust prognostic signature, which was validated by evaluating its associations with clinical features, immune responses, and tumor progression. Lastly, we examined the expression of key FAM-related genes in PTC cell lines and assessed that silencing SCD disturbs the proliferation, invasion, and migration of PTC cells.
Results: We identified three key FAM-related genes, ACACB, ADH1B, and SCD, as significant prognostic markers. Immunological analysis uncovered that low-risk patients exhibited higher immune cell abundance and increased expression of immune checkpoints, indicating a better response to immunotherapy. In contrast, high-risk patients showed lower immune cell abundance and immune checkpoint expression, suggesting poorer immunotherapy outcomes. Experimental validation demonstrated that ACACB and ADH1B were downregulated, while SCD was upregulated in PTC cell lines. Furthermore, silencing SCD inhibited PTC cell proliferation, migration, and invasion.
Conclusion: Our study underscores the pivotal role of FAM-related genes, particularly ACACB, ADH1B, and SCD, in the progression and immune regulation of PTC. The prognostic signature derived from these genes represents a valuable tool for predicting clinical outcomes and guiding personalized treatment strategies. Among these, SCD stands out as a promising therapeutic target for PTC, warranting further research to validate these findings and uncover its underlying molecular mechanisms.
Introduction
Thyroid cancer is a prevalent endocrine malignancy, with papillary thyroid cancer (PTC) being the most common subtype, representing approximately 90% of all thyroid cancer (1). The incidence of thyroid cancer is rising rapidly worldwide in large part because of the increasing incidence of PTC (2). Although the prognosis of thyroid cancer patients is better than that of other malignant tumors, 47,485 patients still died from thyroid cancer in 2022 (3). So, it is vital to explore the key molecular markers that influence the progression of PTC.
Fatty acid metabolism (FAM) plays an important role in maintaining cellular homeostasis, as it is complexly involved in membrane synthesis, energy storage, and signal transduction (4). FAM upregulation may represent an adaptive response to the metabolic demands of tumor cells and is involved in multiple cellular processes, including cancer cell growth (5). In cancer cells, FAM upregulation not only provides the necessary lipids for membrane synthesis but also supports tumor initiation, progression, and resistance to therapy (6, 7). FAM reprogramming in cancer includes some key enzyme upregulation as well as enhanced fatty acid uptake and oxidation (4, 6, 8). These processes can promote tumor cell growth and proliferation by overcoming the lack of nutrients and a hypoxic environment (9). Recently, multiple studies have highlighted the significance of FAM in thyroid cancer, particularly PTC. Chu J. et al. found that circPCNXL2 enhanced tumor cell growth by influencing the de-novo synthesis of fatty acids (10). Lu J. et al. demonstrated through multi-omics analyses that fatty acid metabolism, including hydrolysis, transport, and oxidation, is significantly upregulated in PTC (11). These studies provided novel directions for therapy by targeting dysregulated FAM-related genes in PTC. So, exploring the specific roles of FAM-related genes could provide valuable insights into disease mechanisms and novel biomarkers for the diagnosis, prognosis, and treatment of PTC.
In this study, the FAM-related genes originated from the Molecular Signatures Database (MSigDB). Furthermore, we constructed a polygenic prognostic model based on a TCGA cohort for PTC. A comprehensive analysis was employed to evaluate the relationship between the prognostic model and immune and clinical features. Finally, we performed experiments to validate the impact of FAM-related genes on PTC progression. We concluded that further investigation is essential to elucidate the underlying mechanisms by which FAM-related genes influence PTC progression. The flowchart of this study is shown in Figure 1A.
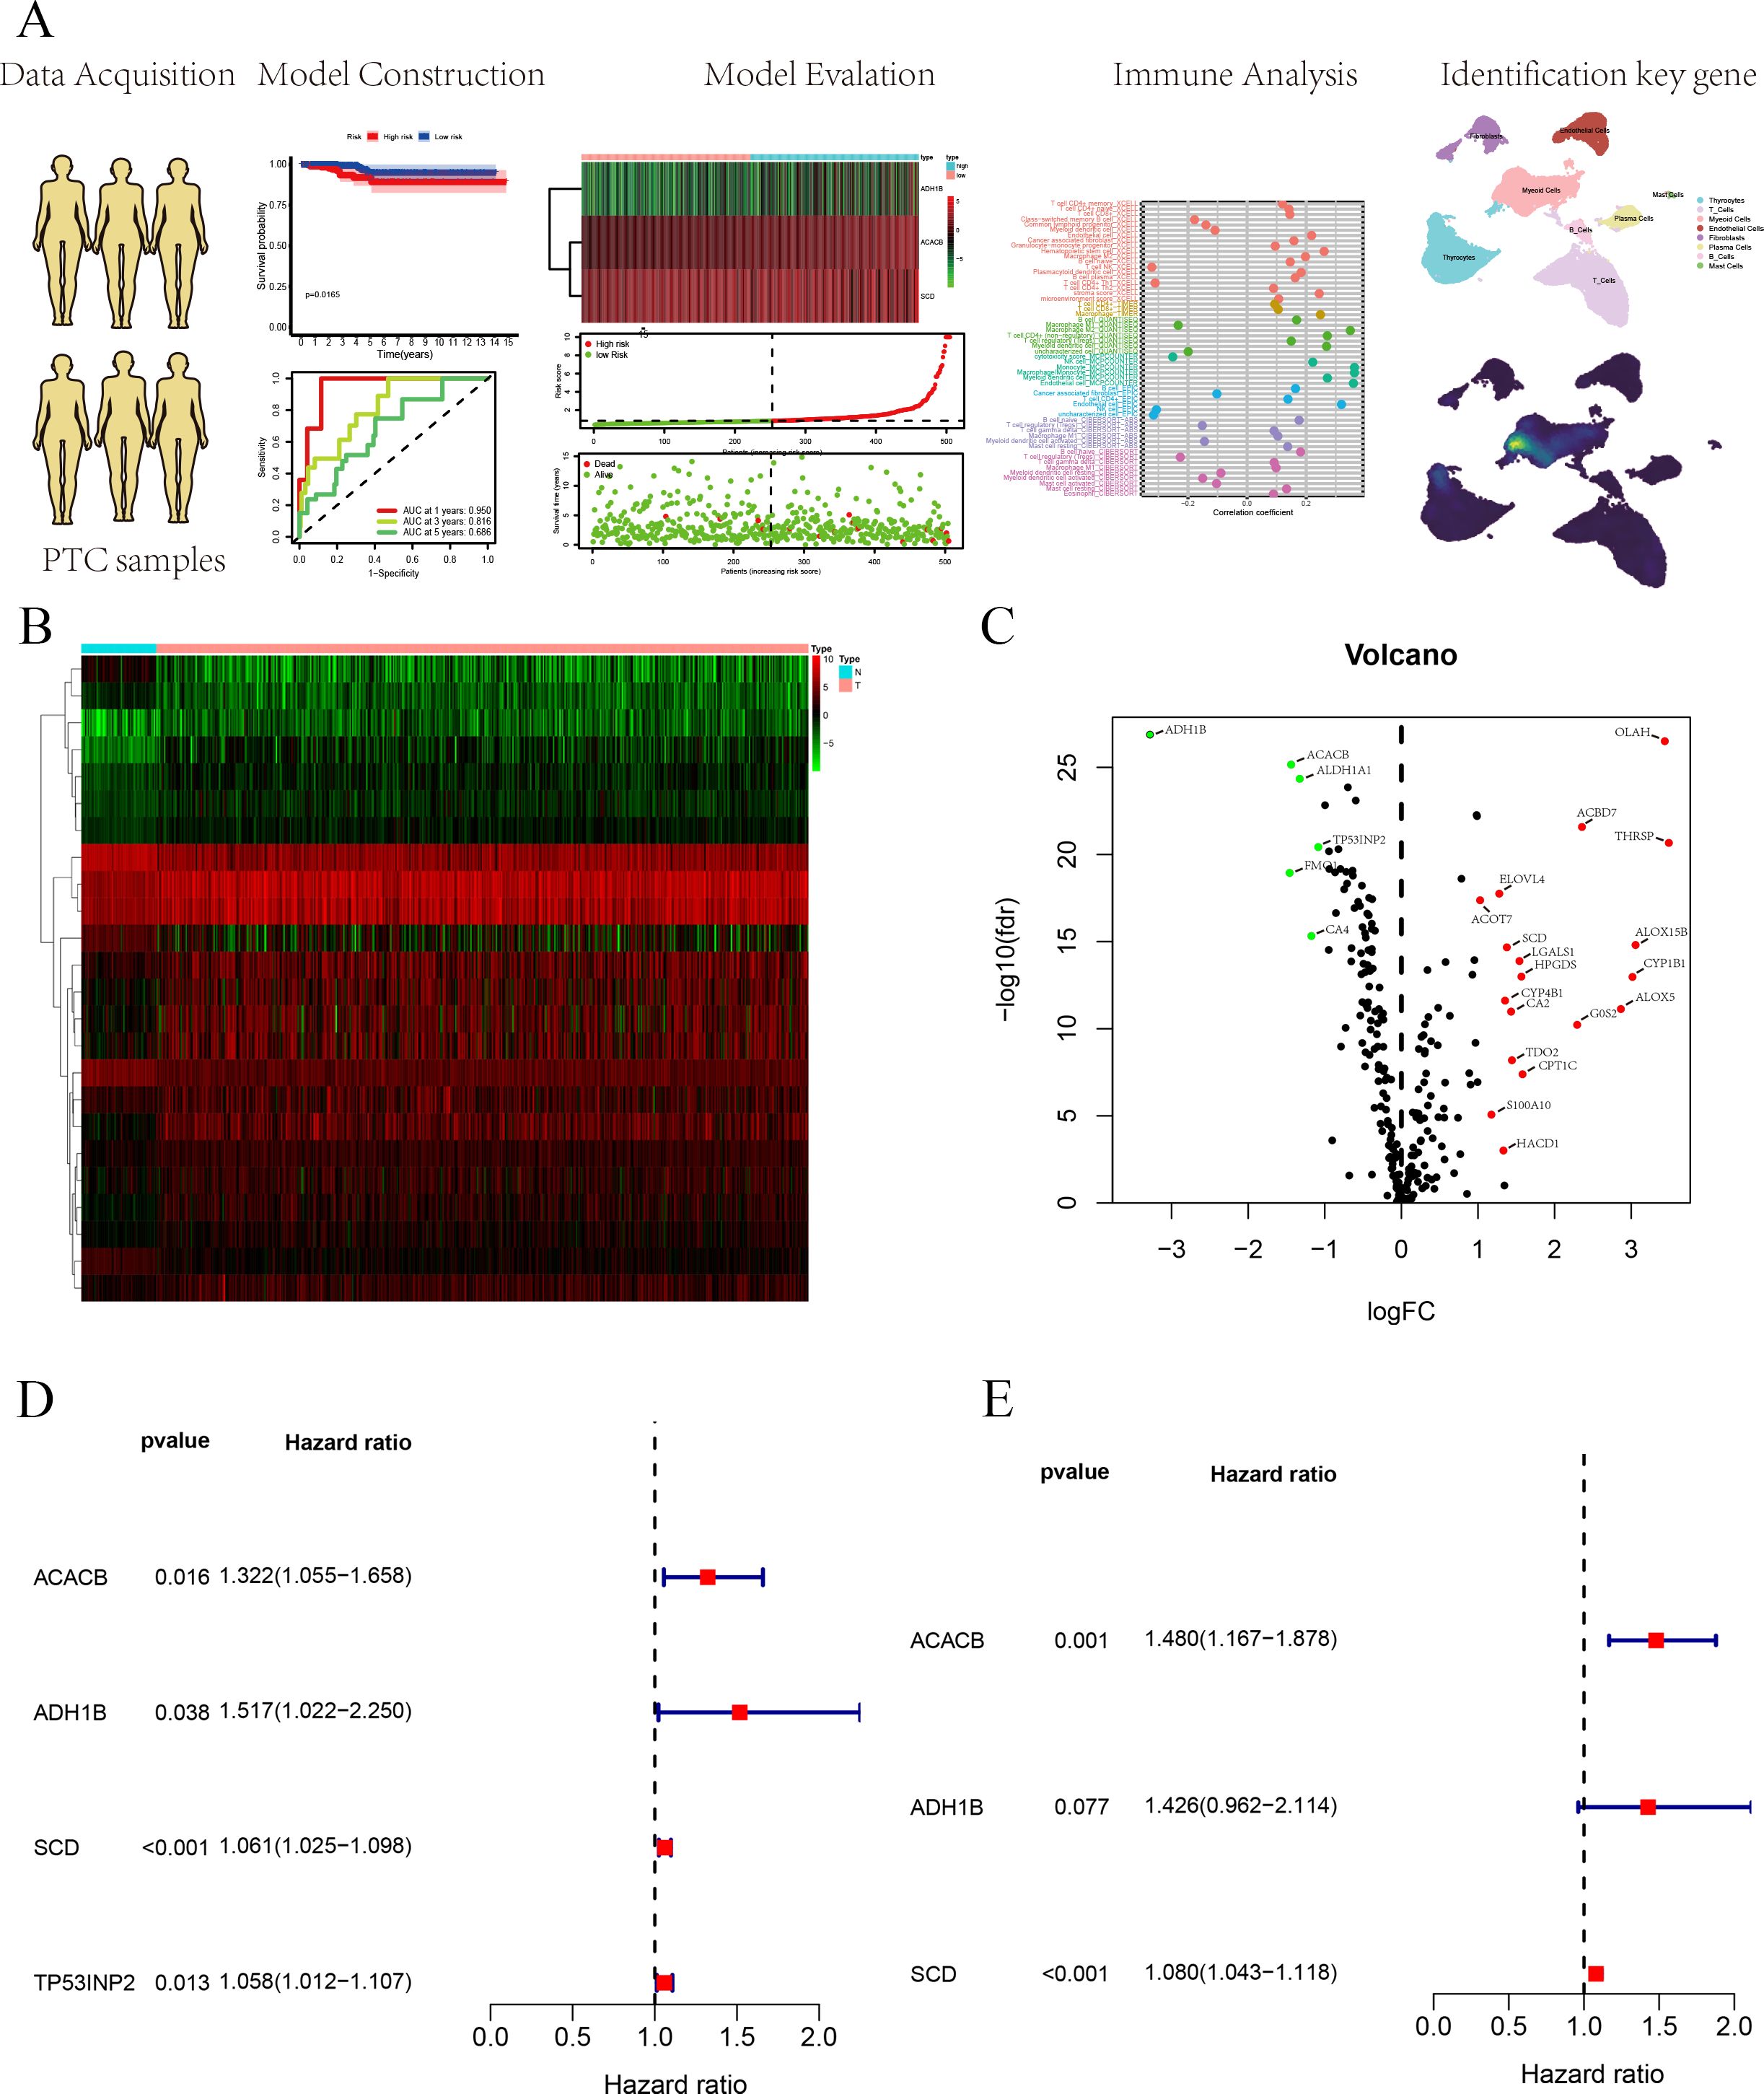
Figure 1. (A) Flowchart of this study. (B) The heatmap of DEGs based on FAM-related genes. (C) Volcano plot of DEGs based on FAM-related genes. (D) Univariate Cox regression analysis for survival-related genes. (E) Construction of the prognostic signature based on the three FAM-related genes using multivariate Cox regression analysis.
Materials and methods
Data acquisition
FAM-related genes were sourced from the MSigDB available at https://www.gsea-msigdb.org/gsea/msigdb, a comprehensive resource that curates gene sets to facilitate functional enrichment analysis and the biological interpretation of genomic data (12–15). The Cancer Genome Atlas (TCGA) is a comprehensive database that integrates genomic and clinical data across various cancer types, serving as a valuable resource for cancer research (16). The TCGA cohort includes 59 normal thyroid tissues and 513 PTC tissues. We used survival, clinical features, and expression data in the TCGA cohort. Gene Expression Omnibus (GEO) is a public repository designed for the storage and sharing of gene expression and functional genomics data from high-throughput experiments. We used the GSE29265 and GSE33630 cohorts. The GSE29265 cohort includes 20 normal and 20 PTC tissues (17). The GSE33630 cohort includes 45 normal and 49 PTC tissues (18, 19).
The scRNA-seq data of GSE232237 were obtained from the GEO, which included three normal thyroid, seven PTC, and five anaplastic thyroid cancer (ATC) cases (20). In this study, we selected seven PTC samples to perform our analysis. The R package “Seruat” was utilized to perform the single-cell analysis. According to cell-specific markers, we isolated eight types of cells, namely, thyrocytes (“TG,” “EPCAM,” “KRT18”), T cells (“CD3D,” “CD3E,” “CD8A”), B cells (“CD79A,” “MS4A1,” “IGHG1”), myeloid cells (“CD68,” “CD163,” “LYZ”), endothelial cells (“PECAM1,” “VWF,” “CLDN5”), plasma cells (“MZB1,” “SDC1,” “CD79A”), mast cells (“CST3,” “KIT,” “CPA3”), and fibroblasts (“FGF7,” “COL1A1,” “COL1A2”).
Construction and verification of the FAM-related gene prognostic signature
The RStudio (Version 4.4.1) software was used to construct the FAM-related gene prognostic signature. In this study, we employed several R packages, including “survival,” “survminer,” “heatmap,” “survivalROC,” “ComplexHeatmap,” “ggplot2,” “ggpubr,” “ggExtra,” and “limma.” To build the prognostic signature, the “survival” R package was employed for multivariate Cox regression analysis. Survival analysis utilized the “survival” and “survminer” R packages. Additionally, the “survival” R package was also used for both univariate and multivariate Cox regression analyses. A heatmap of three FAM-related genes was generated utilizing the “heatmap” R package. The ROC curve was plotted employing the “survivalROC” R package. The “ComplexHeatmap” R package was used to depict the association between clinical features and risk scores.
Functional analysis and somatic mutation landscape
Gene set enrichment analysis (GSEA) is a computational method that evaluates whether predefined gene sets exhibit significant changes in expression across distinct biological states or conditions. In this study, the GSEA software was utilized to carry out function analysis. The plots for multiple GSEA were generated using the “plyr,” “ggplot2,” “grid,” and “gridExtra” R packages.
Mutation data were downloaded from the TCGA database. Mutation analysis mainly employed the “maftools” R package to generate waterfall plots, which visually represented the mutation frequency and types across samples, displaying gene-wise and sample-wise mutation distributions to highlight common mutations and patterns in genomic data.
Immune-related analysis of the prognostic signature
The CIBERSORT algorithm, based on linear support vector regression (SVR), is a widely recognized and reliable machine learning technique for deconvolving expression matrices to evaluate the ratio of 22 distinct human immune cell subtypes (21). In this study, based on the CIBERSORT algorithm, we evaluated the immune cell abundance in each PTC sample from the TCGA database. In addition, we used two R packages: “preprocessCore” and “limma”.
Next, we utilized seven algorithms, namely, CIBERSORT-ABS (21), CIBERSORT (21), Tumor Immune Estimation Resource (TIMER) (22), QUANTISEQ (23), MCPcounter (24), xCell (25), and EPIC (26), to comprehensively analyze the immune landscape of two groups, which enabled us to assess various aspects of immune cell infiltration and characterize the immunological features in greater detail. We used the following eight R packages: “limma,” “scales,” “ggplot2,” “ggtext,” “reshape2,” “tidyverse,” “ggpubr,” and “pheatmap.” Additionally, immune function analysis was carried out utilizing five R packages: “limma,” “GSVA,” “GSEABase,” “ggpubr,” and “reshape2”.
Cell culture and transfection
In this study, all cell lines were purchased from the China Type Culture Collection (CTCC). Nthy-ori 3-1 is a normal thyroid cell line, while TPC-1, K1, KTC-1, and BCPAP are PTC cell lines. Nthy-ori 3-1 cells were cultured in Dulbecco’s modified eagle medium (DMEM). TPC-1, KTC-1, and BCPAP cells were maintained in Roswell Park Memorial Institute 1640 (RPMI-1640) medium, and K1 cells were grown in DMEM/F12 (DMEM and Ham’s F-12 nutrient mixture) medium. All cells were grown in media with 10% fetal bovine serum (FBS) and 1% penicillin–streptomycin and incubated at 37°C with 5% CO2.
For the cell transfection of TPC-1, cell transfection was initiated when the cell density reached approximately 30%. Lipofectamine 2000 (Lip2000) was used as the transfection reagent. First, the optimized minimum essential medium was separately mixed with Lip2000 and siRNA, and each mixture was incubated for 5 min. The two solutions were then combined for an additional 15 minutes. The resulting transfection mixture was added to the complete RPMI-1640 medium without antibiotics. After 6–8 h, the medium was replaced, and SCD knockdown efficiency was evaluated 24 h post-transfection.
Quantitative polymerase chain reaction
According to the manufacturer’s instructions, the TRIzol reagent was employed to acquire total ribonucleic acid). Next, complementary DNA (cDNA) was obtained by performing a reverse transcription assay. Lastly, qPCR was utilized to assess relative messenger ribonucleic acid (mRNA) expression. The 2−ΔΔCt method was used to calculate relative expression. The primer names and primer sequences are shown in Supplementary Table S1.
CCK8, colony formation, scratch, and Transwell assays
For the CCK8 assay, after successful transfection of TPC-1 cells, 3,000 cells from both the control and knockdown groups were cultured in 96-well plates. Cell viability was checked by incubating the cells for 0, 24, 48, and 72 h, and optical density (OD) at 450 nm was determined at each time point using a microplate reader.
For the scratch assay, after successful transfection of TPC-1 cells, cells were cultured until they reached 100%. A scratch was made using a 200-µL pipette tip, followed by PBS washing to remove the medium. Images were captured immediately after scratching and then again at 24 and 48 h to monitor wound healing.
For the colony formation assay, after successful transfection of TPC-1 cells, 1,000 cells from both the control and knockdown groups were seeded into six-well plates. The medium was replaced every 3–5 days. After 14 days, the plates were collected, washed with PBS, fixed with paraformaldehyde, and stained with crystal violet, and the images were taken after the plates dried using an Olympus microscope.
For the Transwell assay, after successful transfection of TPC-1 cells, 30,000 cells from both the control and knockdown groups were mixed with 260 µL of serum-free medium and transferred to the top chamber of the Transwell plates. The bottom chamber contained 750 µL of complete medium. For the invasion assay, 20% Matrigel was precoated on the bottom of the upper chamber, while for the migration assay, no Matrigel was used. After 24 h, the upper chamber was removed, washed, fixed, stained, and imaged using an Olympus microscope.
Statistical analysis
RStudio (Version 4.4.1) and GraphPad Prism (Version 10.1.0) were utilized to perform statistical analysis. In this study, a p-value less than 0.05 was considered statistically significant.
Results
Construction of the prognostic signature for PTC patients
FAM-related genes were acquired from the MSigDB database (HALLMARK, KEGG, REACTOME), and 309 FAM-related genes were used for follow-up analyses (Supplementary Table S2). We analyzed DEGs from 309 FAM-related genes based on logFC more than 1 and p-value <0.05, in which 24 DEGs were identified and employed to build the prognostic signature (Supplementary Table S3). We used a heatmap and a volcano plot to display 25 DEGs associated with FAM (Figures 1B, C). Furthermore, we selected survival-related genes through univariate Cox regression analysis, and four FAM-related genes were selected (Figure 1D). Lastly, multivariate Cox regression analysis was utilized to build a three FAM-related gene prognostic signature (Figure 1E).
Verification of the prognostic signature in the TCGA cohort
Through the above analyses, we successfully constructed the prognostic signature based on three FAM-related genes. It was observed through survival analysis that compared with the low-risk group, the high-risk group had a shorter survival probability (Figure 2A). The receiver operating characteristic (ROC) curve demonstrates that the prognostic signature exhibits high predictive efficacy, with area under the curve (AUC) values of 0.95 at 1 year, 0.816 at 2 years, and 0.686 at 3 years (Figure 2B). Univariate and multivariate regression analyses showed that stage and risk score are independent prognostic factors for PTC patients (Figures 2C, D). We depicted the heatmap of the three FAM-related genes in this risk group (Figure 2E). In addition, we also displayed the risk score curve (Figure 2F) and survival state distribution (Figure 2G), which confirmed the reasonable distribution between the two risk groups. Next, we integrated the clinical characteristics of PTC and analyzed their correlation with risk score, presenting the results in a heatmap for clarity (Figure 2H). The heatmap revealed that risk score is associated with age, T stage, and N stage. Lastly, a predictive nomogram was generated by integrating multiple clinical factors with risk scores (Figure 2I). These scores can be employed to estimate the survival probabilities of PTC patients.
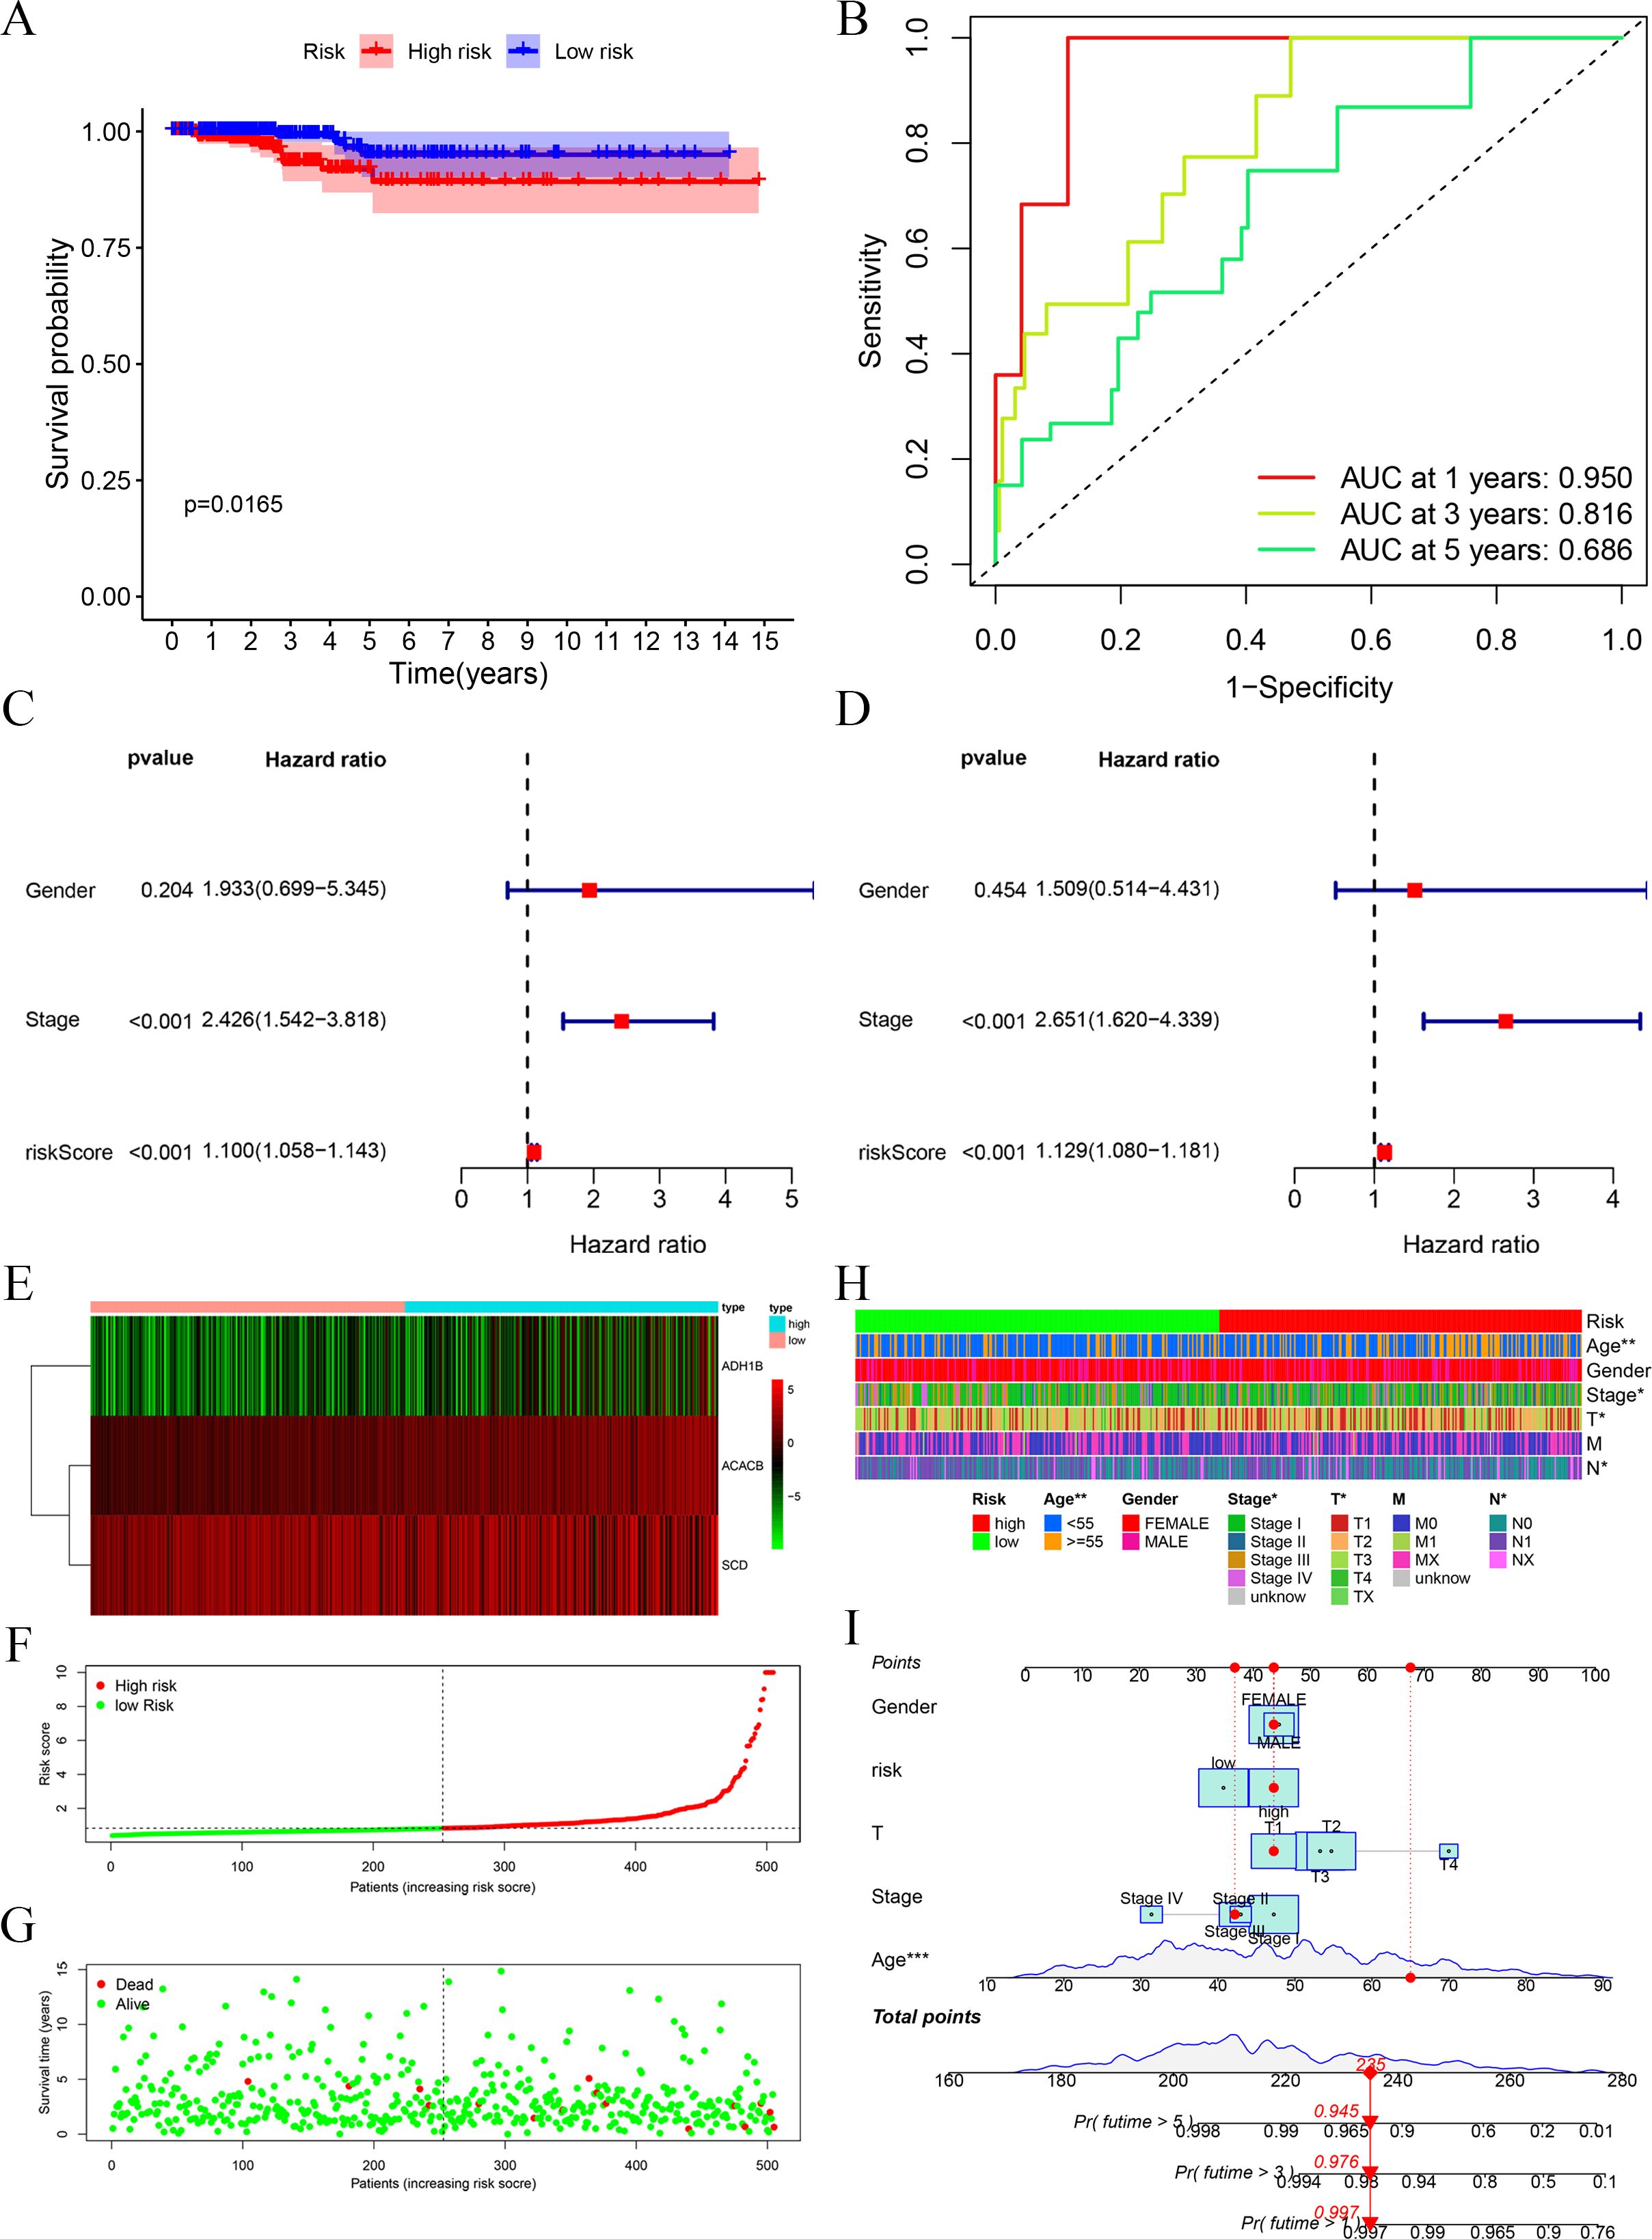
Figure 2. Evaluation of the prognostic signature. (A) Survival analysis of high and low risks showed that the high-risk group possessed a worse OS. (B) ROC curves at 1, 3, and 5 years showed the model has good predictive ability. (C, D) Univariate and multivariate Cox regression analyses of the prognostic signature identified risk score to possess a better independent prognostic effect. (E) Heatmap of the three FAM-related genes. (F) Risk score distribution for PTC patients. (G) Survival state curve for PTC patients. (H) The association between prognostic signature and clinical features, including age, gender, and TNM stage. (I) Development of the FAM clinicopathologic nomogram for predicting the 1-, 3-, and 5-year OS for PTC patients by incorporating risk score, age, gender, and TNM stage. *p < 0.05, **p < 0.01.
Functional analysis and somatic mutation analysis of the prognostic signature
All PTC samples were categorized into high and low groups according to the median expression levels of the hub genes. Next, we performed GSEA to explore the potential functional enrichment of the hub genes. Through GSEA of Gene Ontology (GO), we observed that the high-risk group was related to the AMINO ACID CATABOLIC PROCESS (BP), MONOATOMIC ANION TRANSPORT (BP), FATTY ACID TRANSMEMBRANE TRANSPORT (BP), ABC TYPE TRANSPORTER ACTIVITY (MF), and ATPASE COUPLED TRANSMEMBRANE TRANSPORTER ACTIVITY (MF), and the low-risk group was related to CYTOSOLIC LARGE RIBOSOMAL SUBUNIT (CC), NUCLEAR MEMBRANE REASSEMBLY (BP), BLOC 1 COMPLEX (CC), CYTOSOLIC SMALL RIBOSOMAL SUBUNIT (CC), and CADHERIN BINDING INVOLVED IN CELL-CELL ADHESION (MF) (Figure 3A). Through GSEA of KEGG, we observed that the high-risk group was associated with LYSINE DEGRADATION, ABC TRANSPORTERS, FATTY ACID METABOLISM, TYPE II DIABETES MELLITUS, and TRYPTOPHAN METABOLISM, and the low-risk group was associated with RIBOSOME, DNA REPLICATION, PROTEASOME, PATHOGENIC ESCHERICHIA COLI INFECTION, and P53 SIGNALING PATHWAY (Figure 3B).
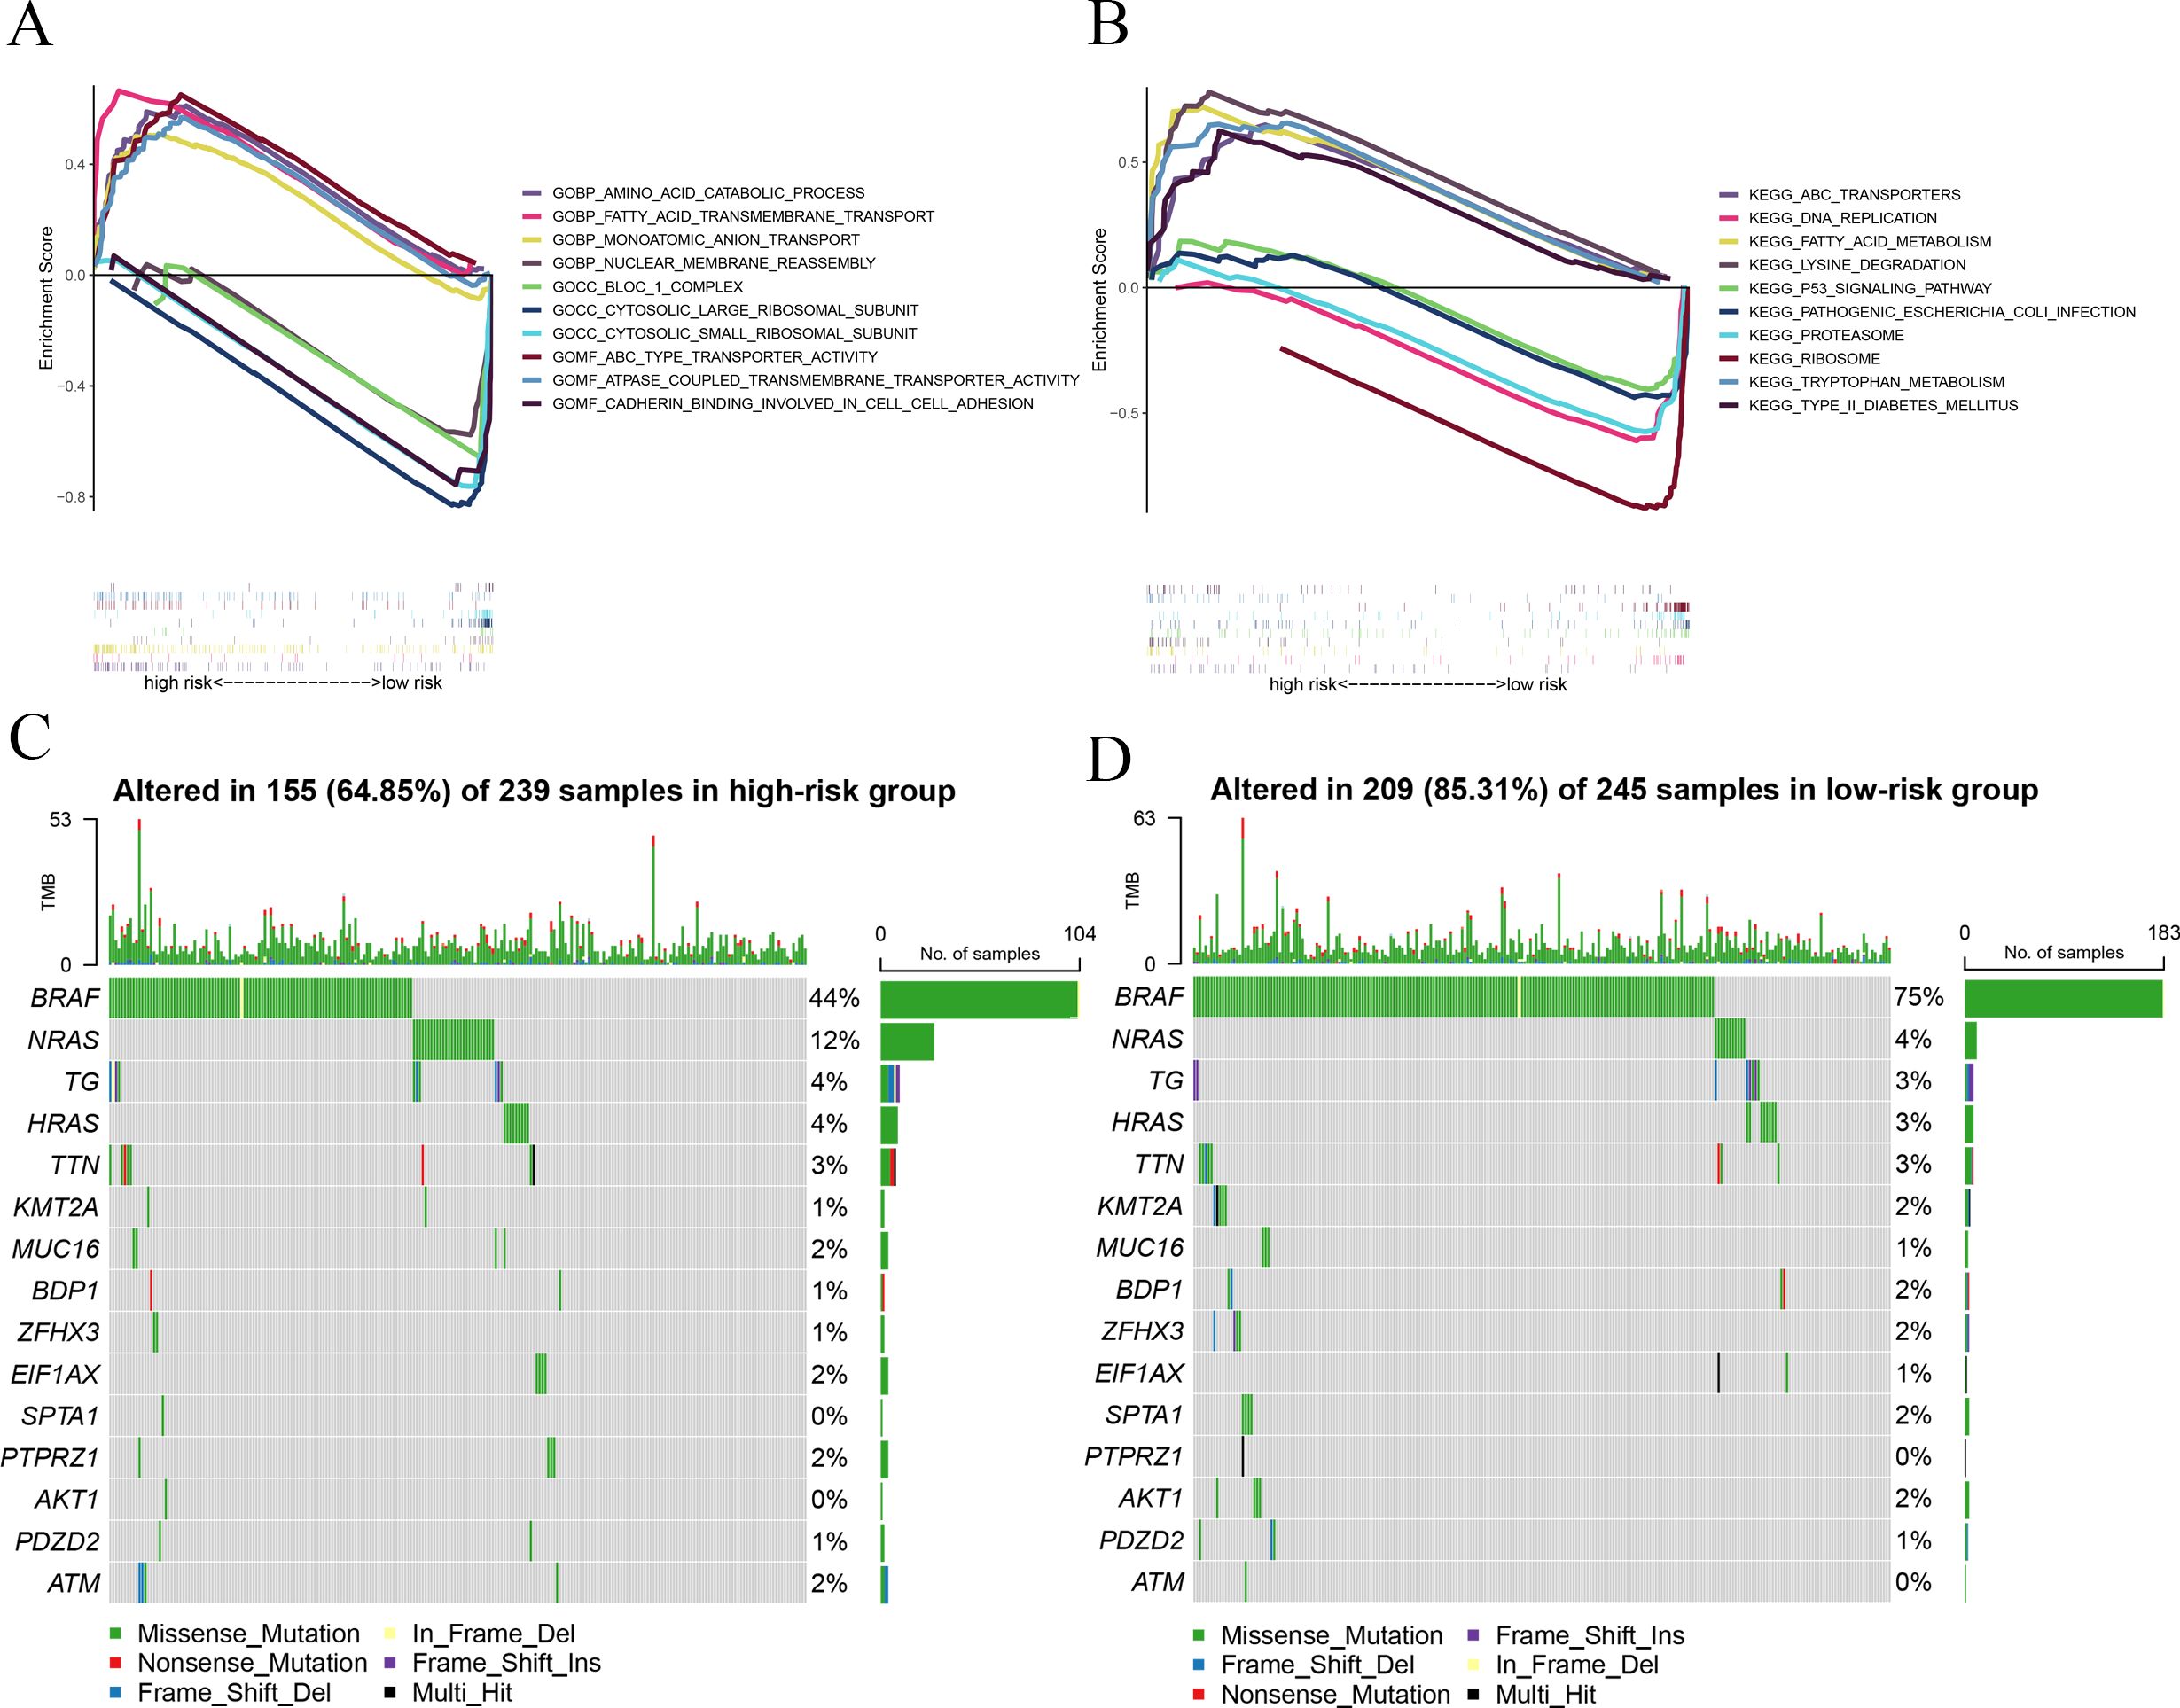
Figure 3. GSEA and mutation analysis. (A) GSEA of GO revealed the function of the prognostic signature. (B) GSEA of KEGG showed the potential biological pathway of the prognostic signature. (C) Mutation landscape displayed distinct genetic alterations in the high-risk group. (D) Mutation landscape verified distinct genetic alterations in the low-risk group.
To investigate the relationship between risk score and gene mutations, we analyzed the heterogeneity of gene mutations between the high-risk and low-risk groups. Compared with the high-risk group (64.85%), we uncovered that the low-risk group possessed a higher gene mutation ratio (85.31%) (Figures 3C, D). Furthermore, we also observed that BRAF and NRAS gene mutations are the most significant in those genes. The mutation ratio of BRAF is 75% in the low-risk group and 44% in the high-risk group. The mutation ratio of NRAS is 4% in the low-risk group and 12% in the high-risk group.
Immune-related analysis of the prognostic signature
In order to observe the immune condition of PTC patients and explore the relationship between FAM-related genes and tumor immunity, the CIBERSORT algorithm was employed to visualize the immune landscape of all PTC patients in the TCGA cohorts. The immune cell ratio of PTC patients was displayed in a heatmap (Figure 4A). The correlation results provided a comprehensive overview of the associations between risk scores and immune cells and stromal cells. We also employed a heatmap to visualize the distribution of various immune cells across samples with different risk scores (Figure 4B). Next, based on seven algorithms, we evaluated the association between immune cells and risk score (Figure 4C). We also showed the correlation between immune cells and risk score. The results showed that risk score is closely associated with multiple immune cells (Figures 4D–O) based on the xCell algorithm.
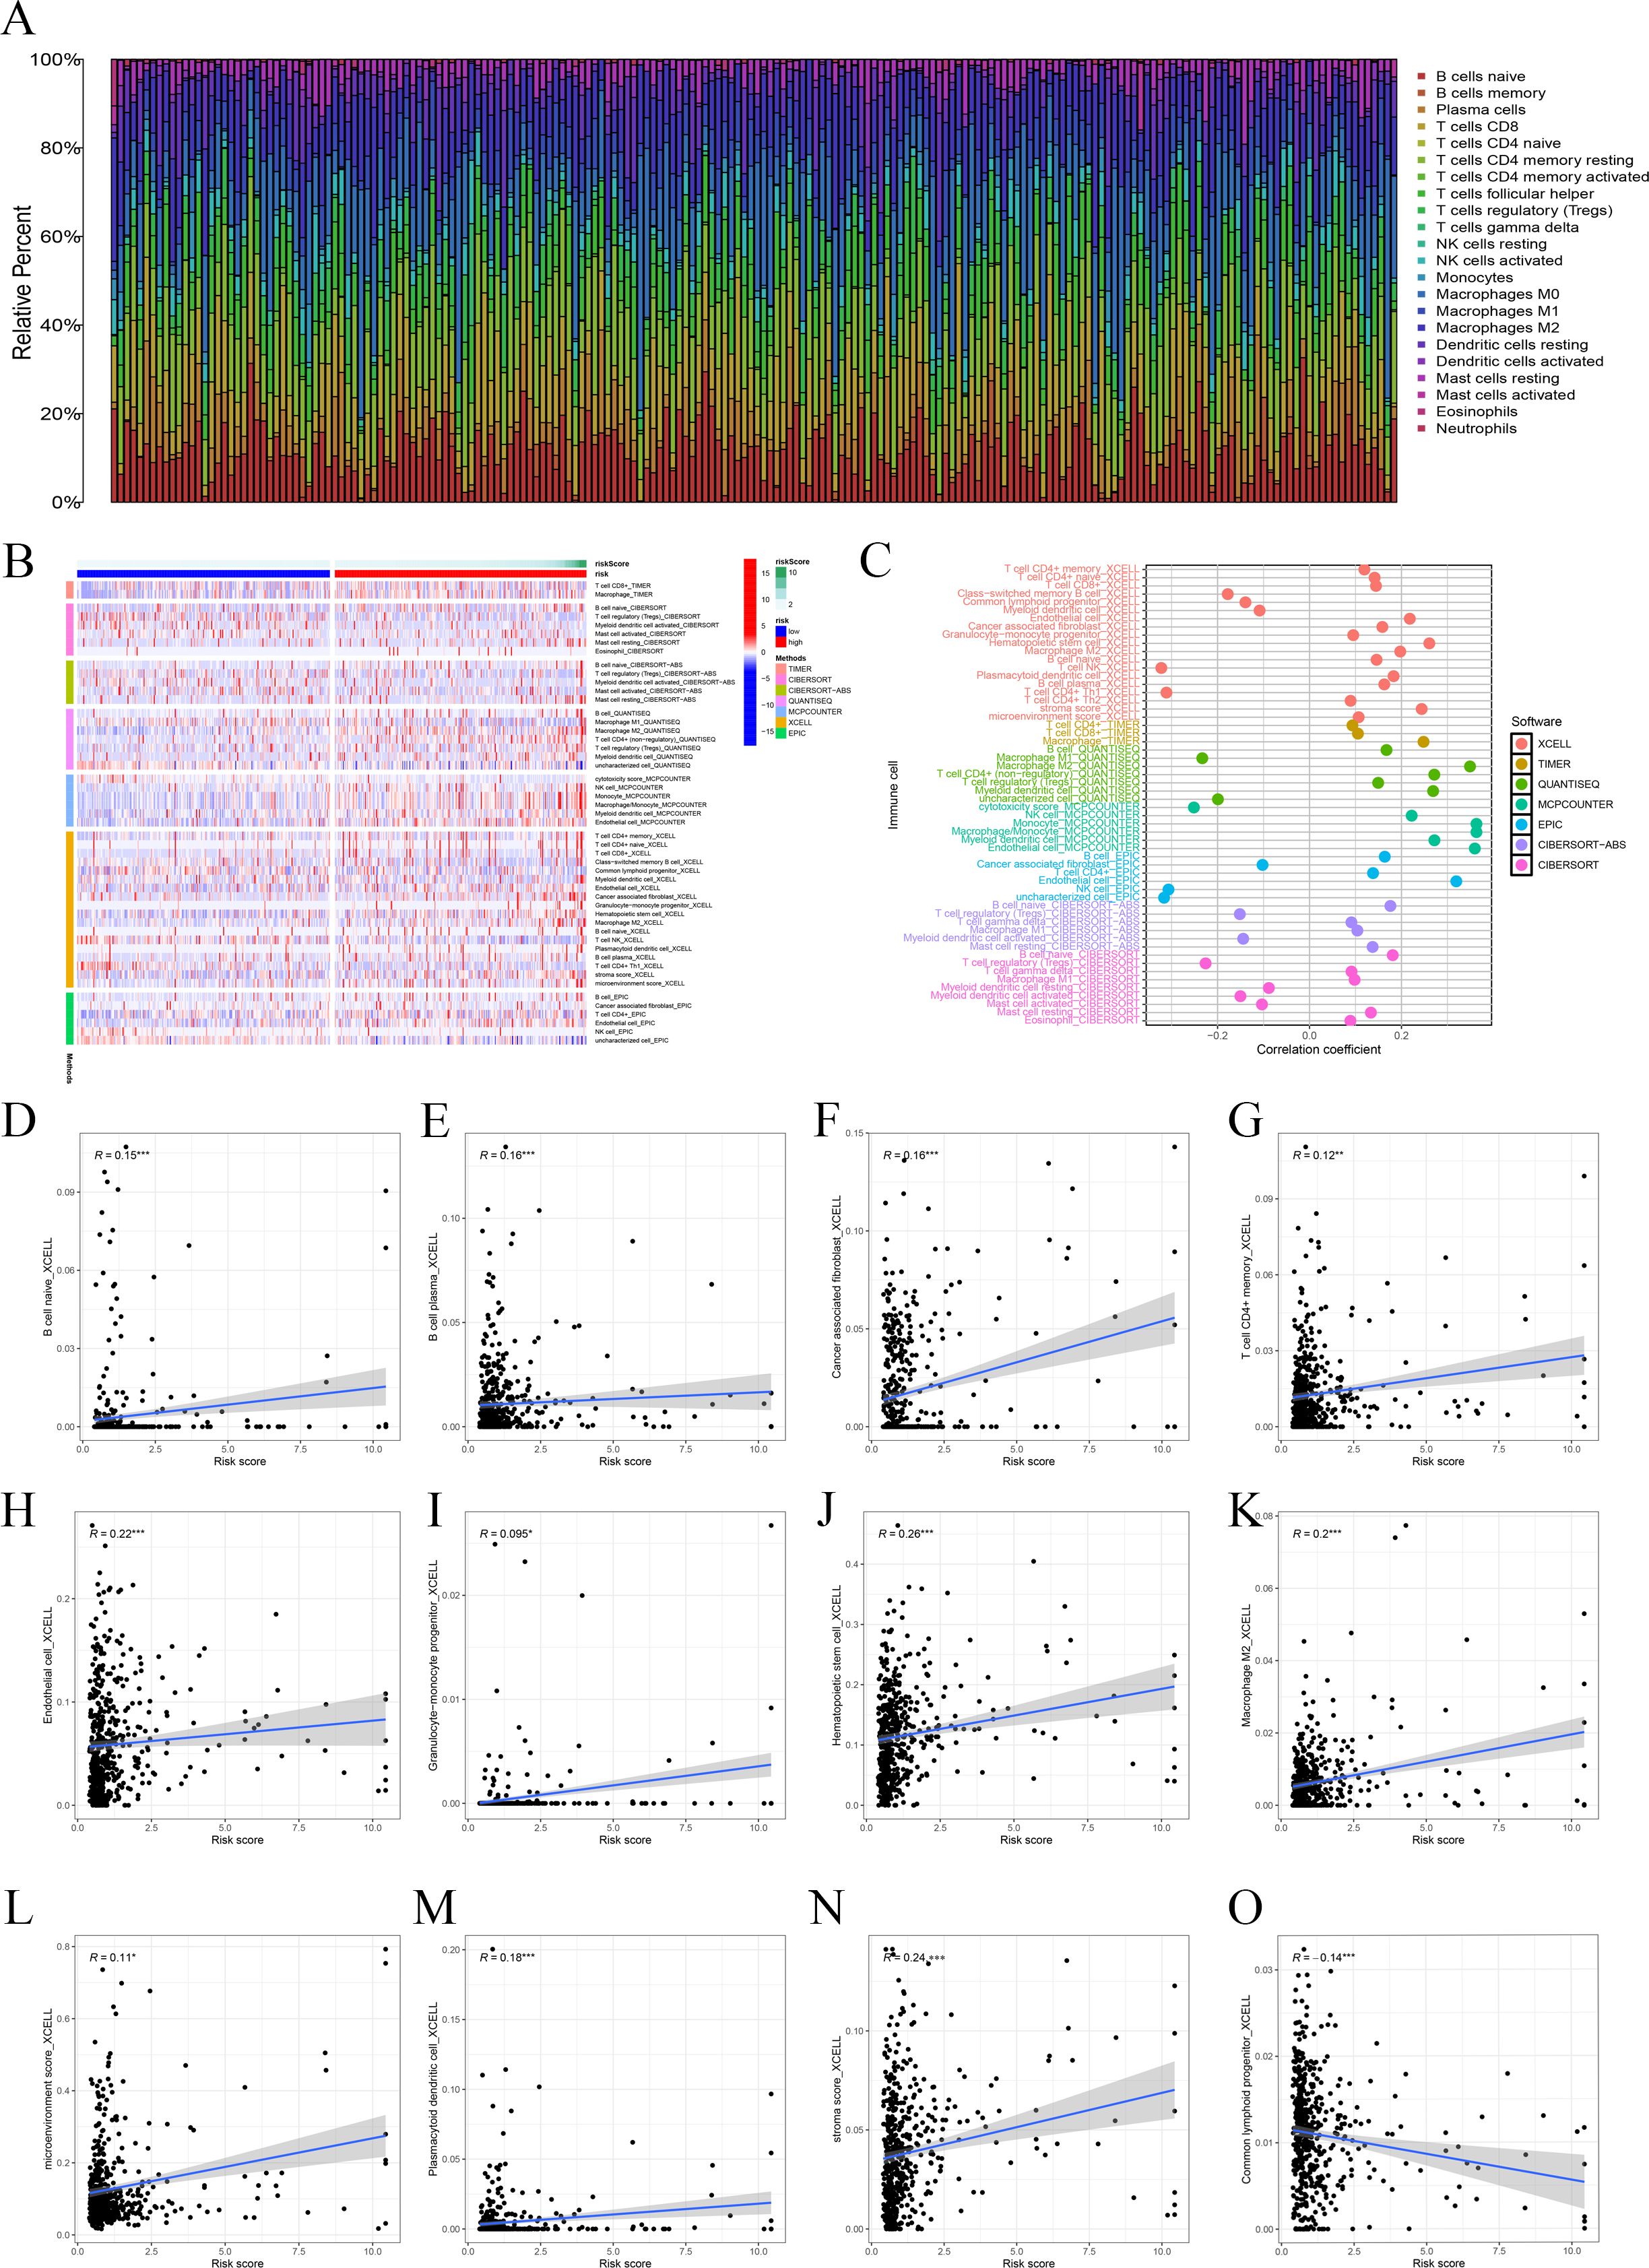
Figure 4. Immune-related analysis. (A) The ratio of 22 immune cells based on all PTC patients. (B) The distribution of various immune cells across samples with different risk scores. (C) Immune cell association analysis using seven algorithms revealed that risk score is closely associated with immune cells. (D–O) Correlation analysis of immune cells and risk scores.
Furthermore, we used boxplots to illustrate the changes in immune cell abundance between the two groups, which revealed that 17 immune cell types were present in lower quantities in the high-risk group compared to the low-risk group (Figure 5A). Based on the TIMER algorithm, we specifically analyzed the relationship between six immune cells and risk scores, which showed a positive correlation for all six immune cell types (Figures 5B–E).
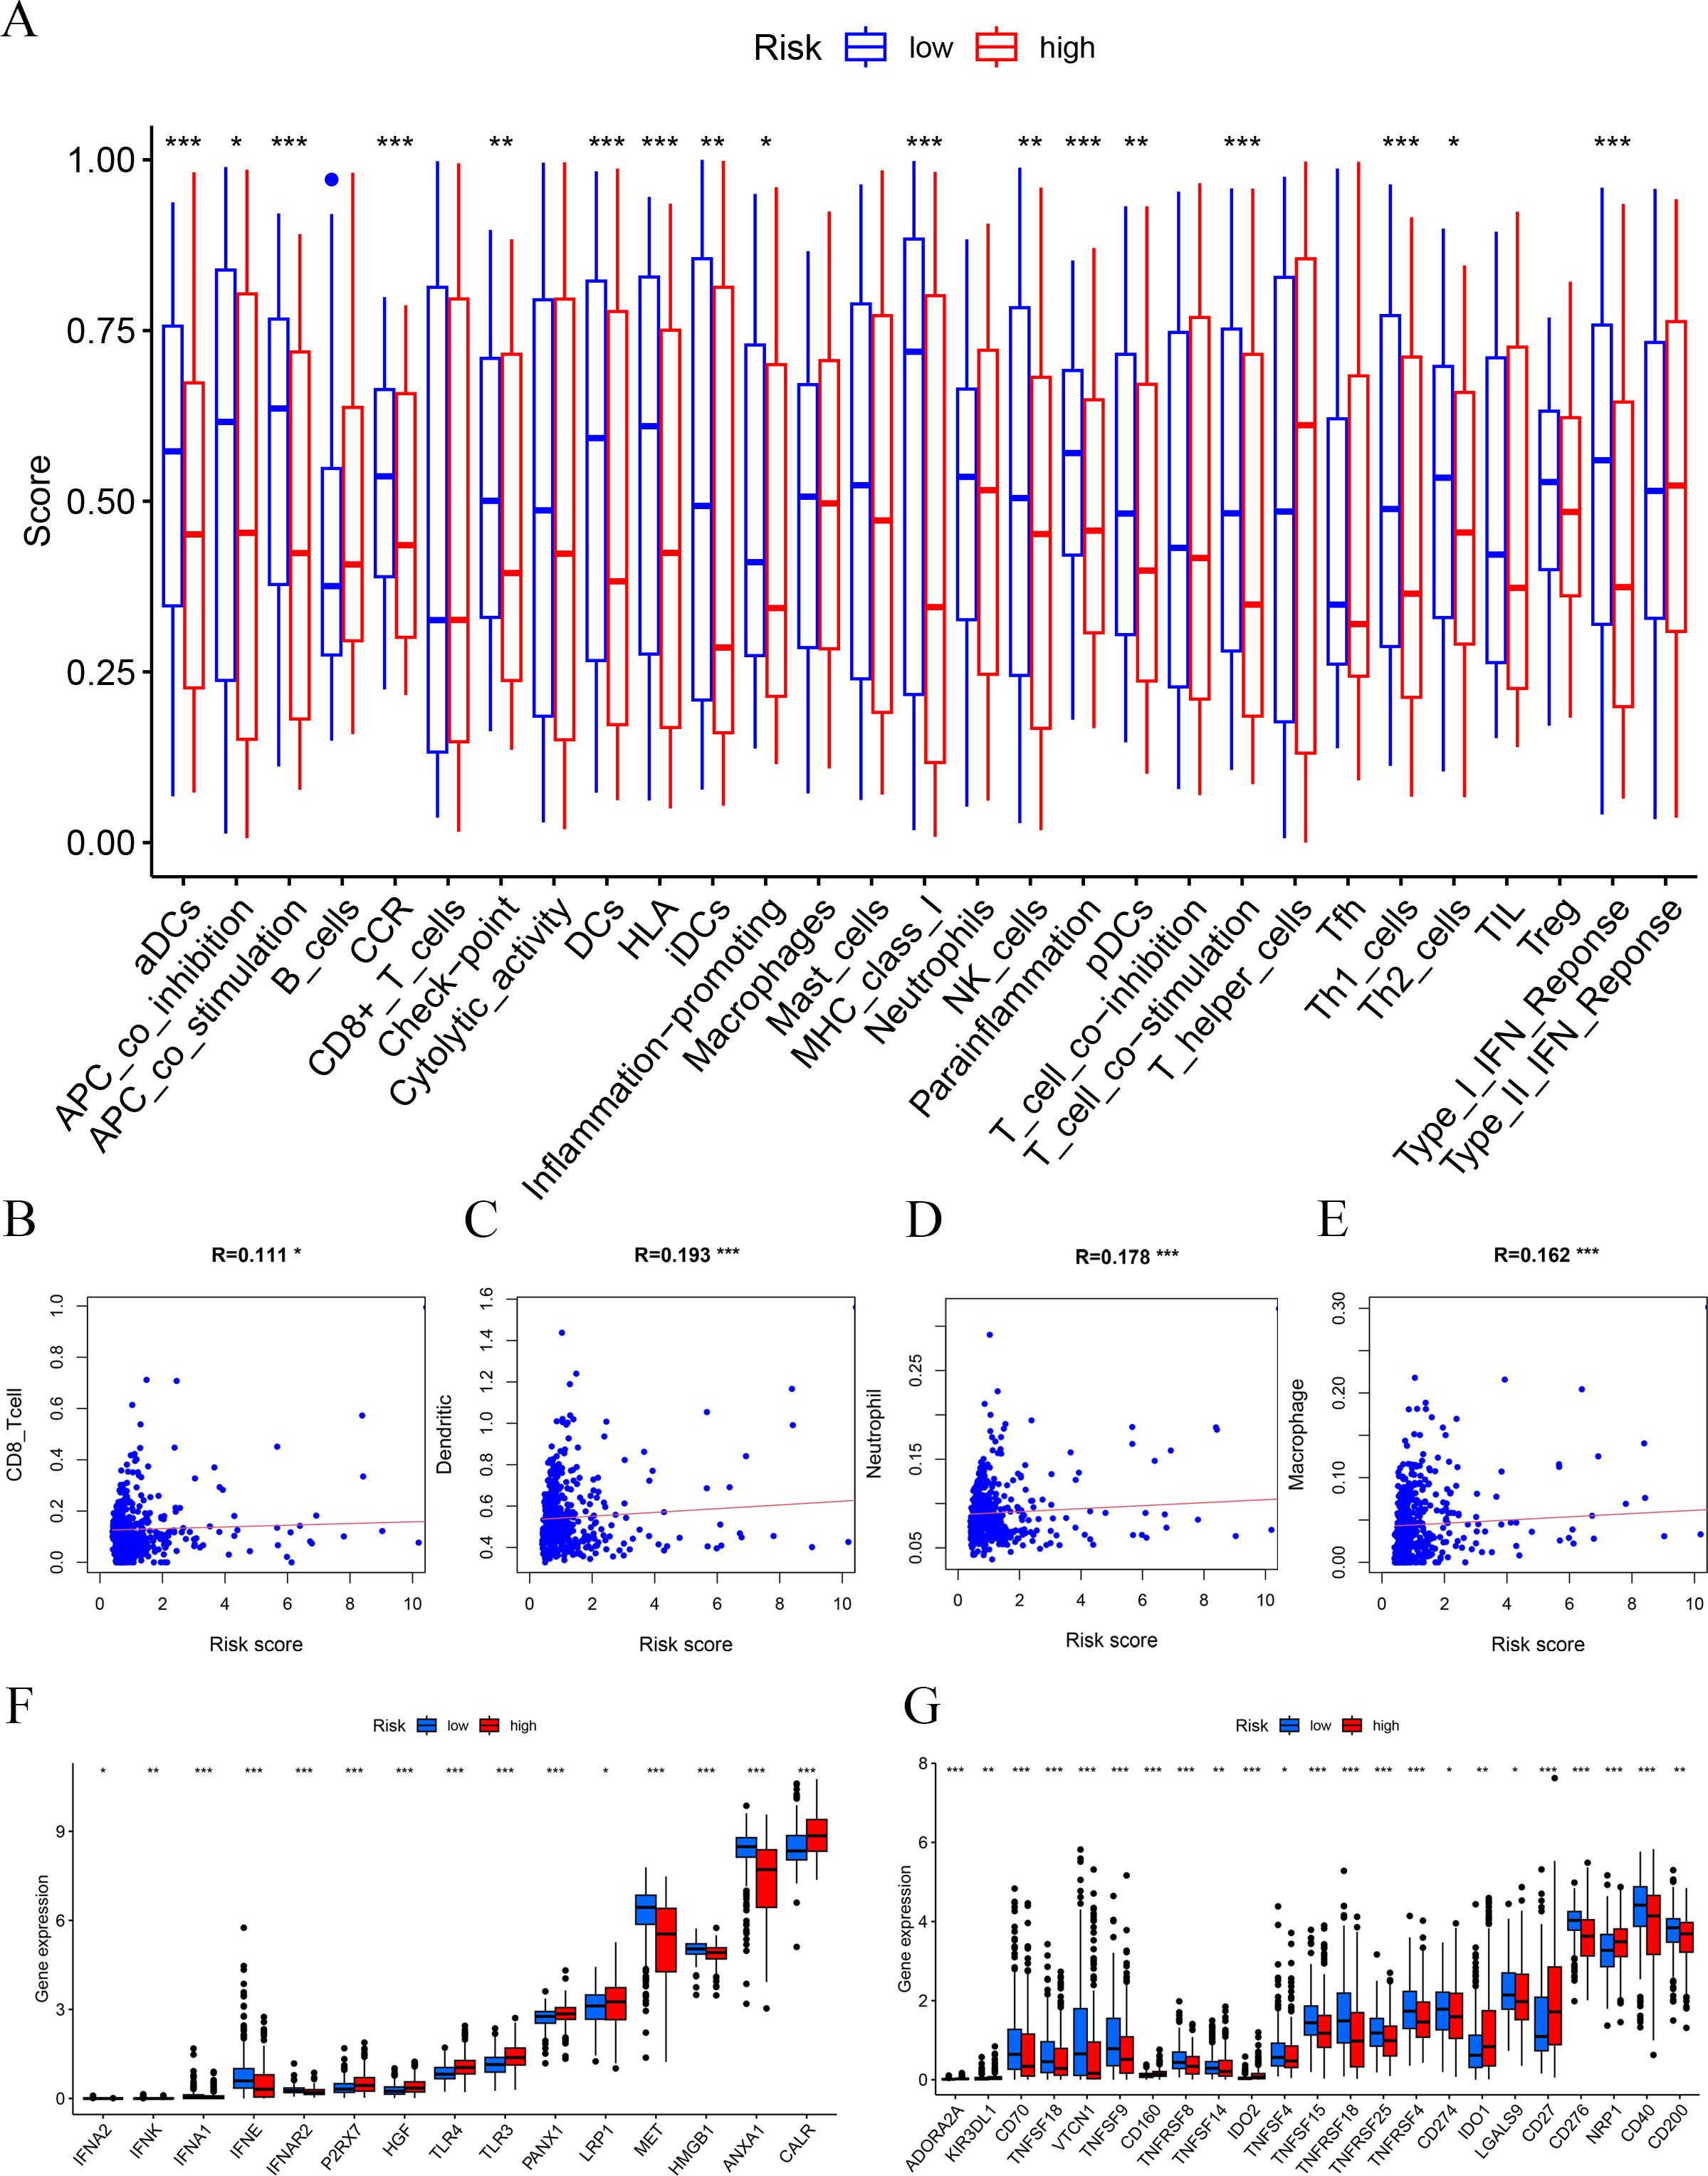
Figure 5. Immune function and immune cell association. (A) Immune function analysis-related risk score is related to potential functional immune cells. (B) The association with CD8 T cells. (C) The association with dendritic cells. (D) The association with neutrophils. (E) The association with macrophages. (F) Association between immune subgroups and ICD modulators. (G) Association between immune subgroups and ICP modulators. *p < 0.05, **p < 0.01, ***p < 0.001.
Immune checkpoints and immunogenic cell death (ICD)-related genes showed significant potential in tumor treatment, offering promising avenues to enhance antitumor immunity and improve therapeutic outcomes (27–29). We analyzed the expression differences of ICD-related genes and immune checkpoints between the high-risk and low-risk groups and observed that most immune checkpoints were upregulated in the low-risk group (Figures 5F, G). This suggests that, unlike the high-risk group, PTC patients in the low-risk group are more likely to respond favorably to immunotherapy.
Silencing SCD inhibits PTC progression
As a malignant tumor, DEGs may play an important role in PTC. Firstly, we analyzed the expression of three FAM-related genes across the TCGA, GSE29265, and GSE33630 cohorts. The results showed that, compared to PTC tissues, ACACB and ADH1B were more highly expressed in normal thyroid tissues, whereas SCD exhibited higher expression in PTC tissues (Figures 6A–C). Next, we used qPCR experiments to verify the expression of three FAM-related genes in normal thyroid cell lines and PTC cell lines. The results were consistent with the findings from the above bioinformatics analysis (Figure 6D). Moreover, using single-cell cohorts of PTC, we validated the relative expression levels of key genes across different cell types (Figure 7A). Our analysis revealed that ACACB is highly expressed in fibroblasts and endothelial cells (Figure 7B), ADH1B shows elevated expression in fibroblasts (Figure 7C), and SCD is predominantly expressed in myeloid cells (Figure 7D). Given that SCD is the only highly expressed gene among the three FAM-related genes, we plan to further investigate its role in PTC cells. We used siRNA to downregulate SCD expression in TPC-1 cells. Through the qPCR assay, SCD expression is significantly downregulated after using siRNA (Figure 8A). The CCK8 assay revealed that silencing SCD expression decreased the cell proliferation activity in the TPC-1 cell line (Figure 8B). The colony formation assay uncovered that colony formation ability was downregulated after silencing SCD expression (Figure 8C). Scratch assays observed that silencing SCD expression inhibited TPC-1 cell migration (Figure 8D). Transwell assays showed that silencing SCD expression suppressed TPC-1 cell migration and invasion (Figure 8E). Therefore, we concluded that SCD is a new PTC biomarker and silencing SCD expression inhibits PTC progression.
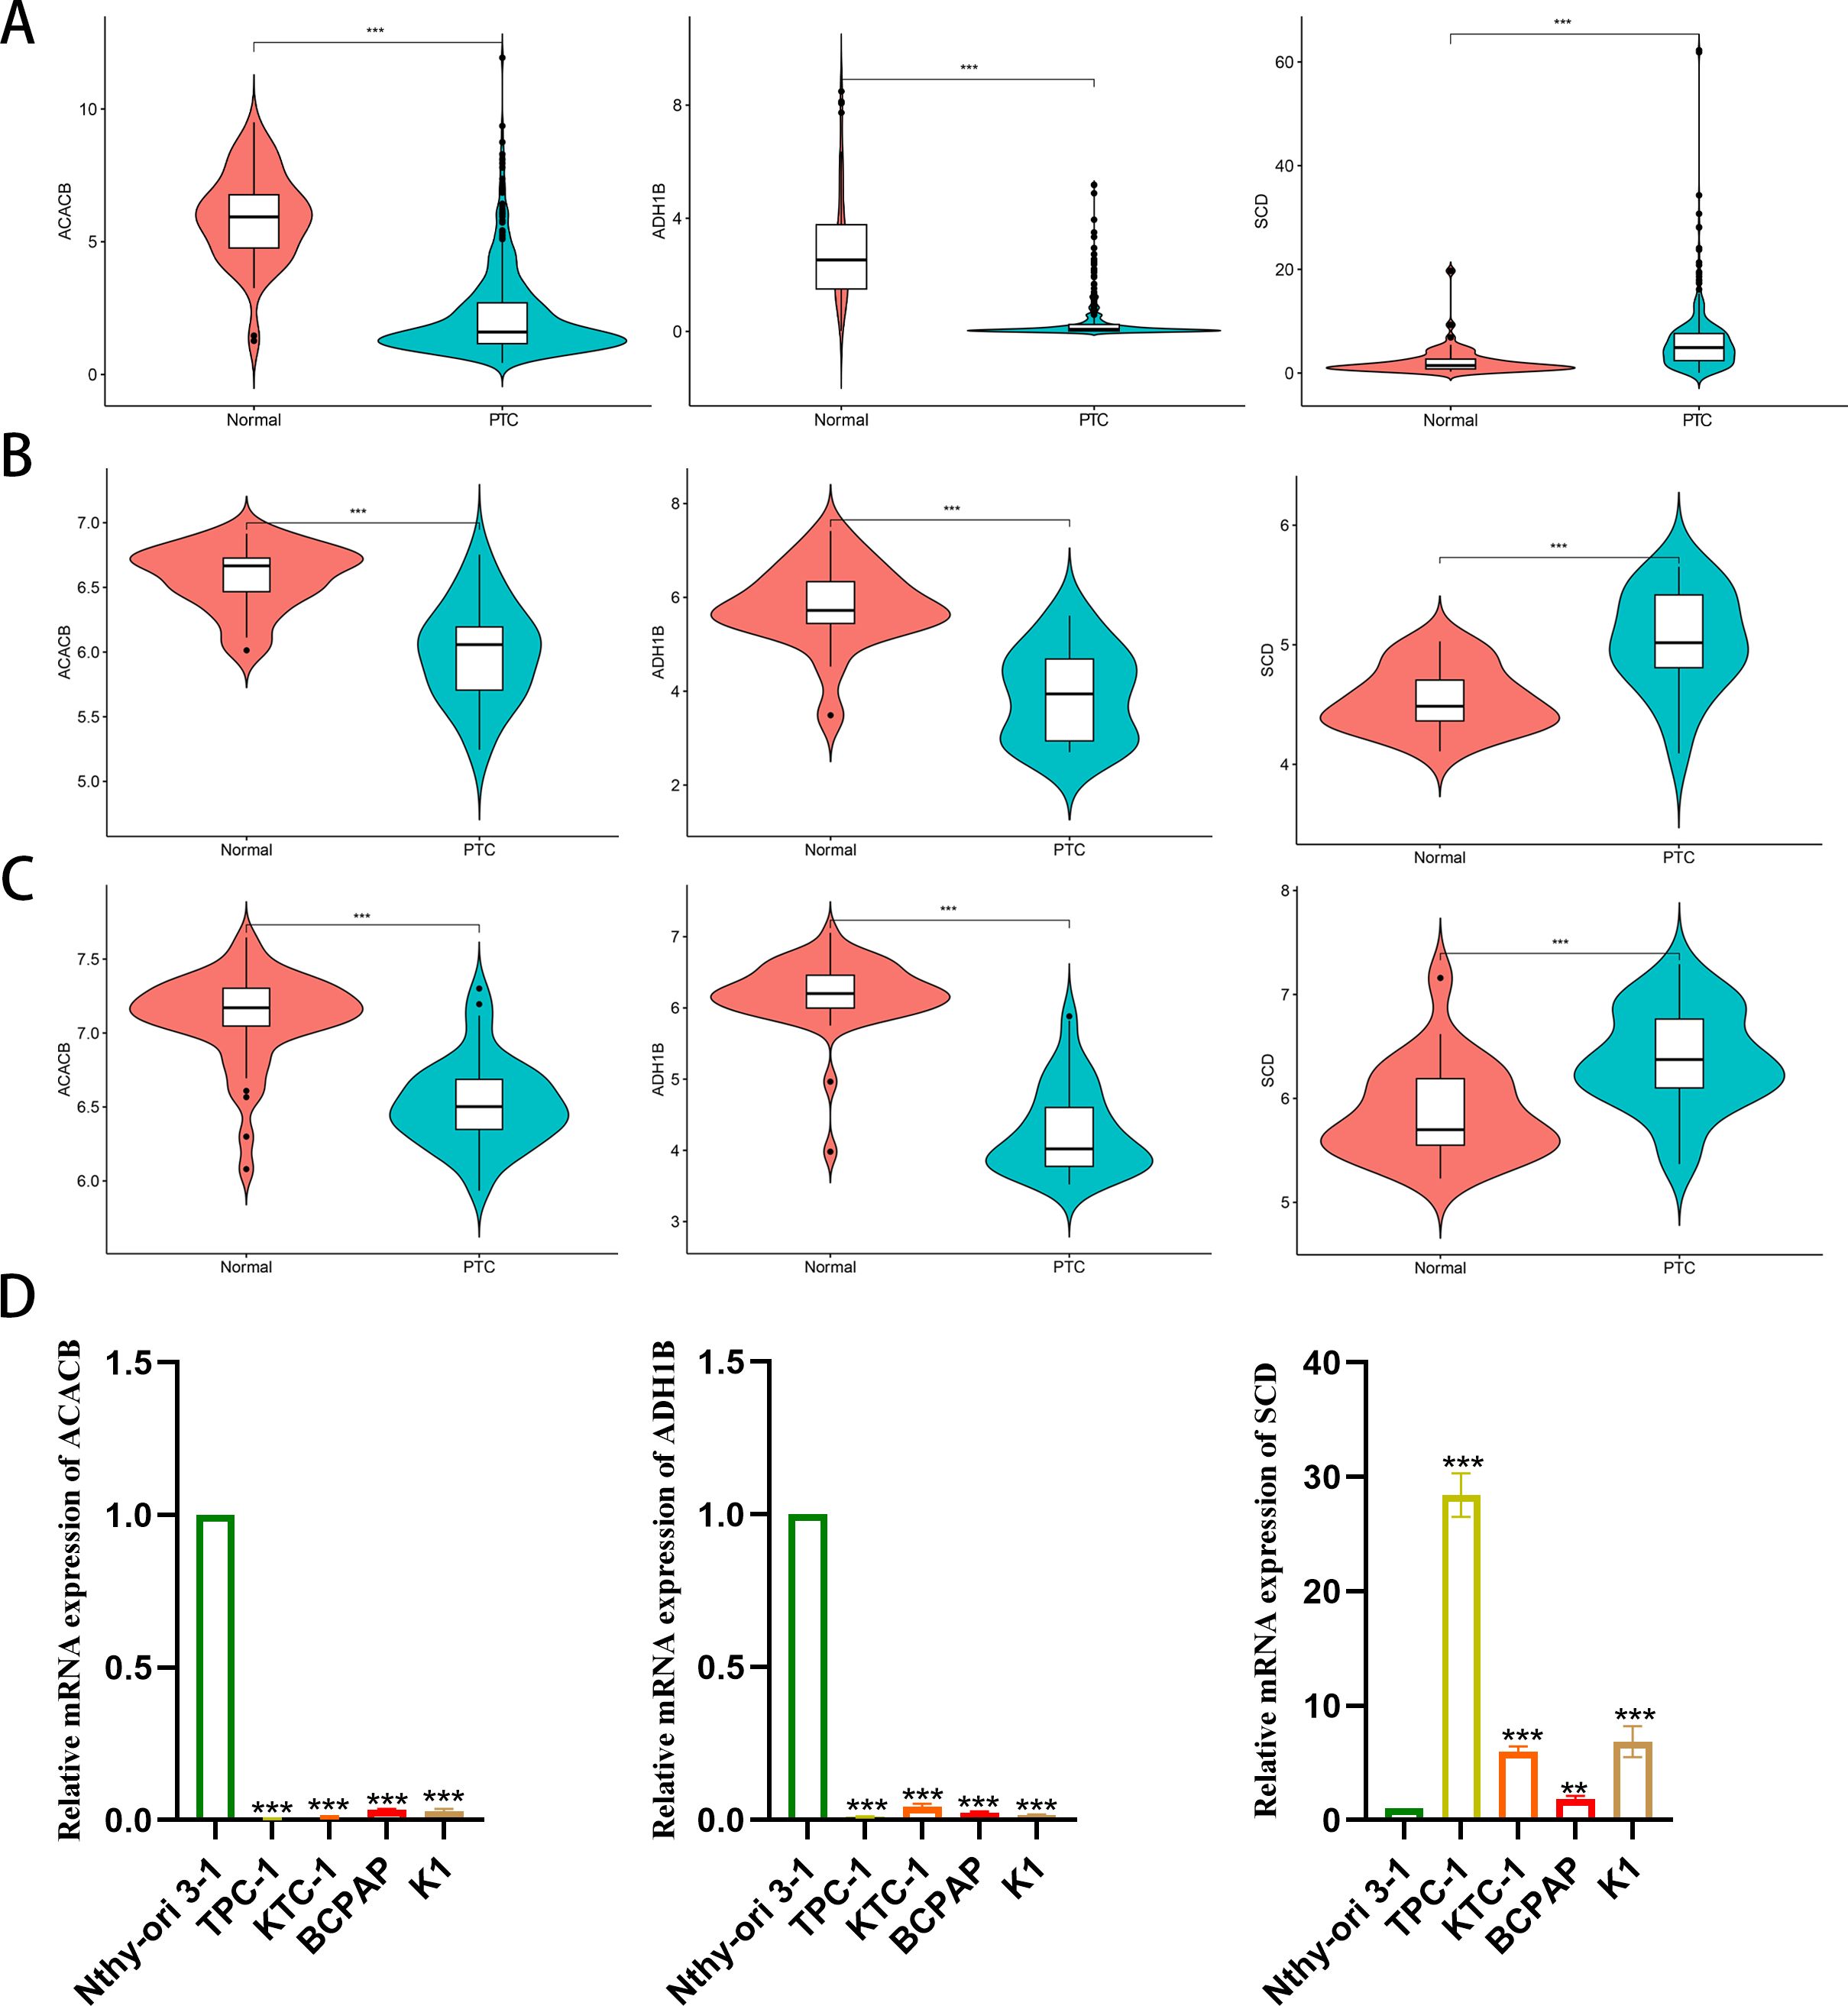
Figure 6. Differential expression analysis of the three FAM-related genes. (A) TCGA; (B) GSE29265; (C) GSE33630; (D) qPCR verified mRNA expression in cell lines. **p < 0.01, ***p < 0.001.
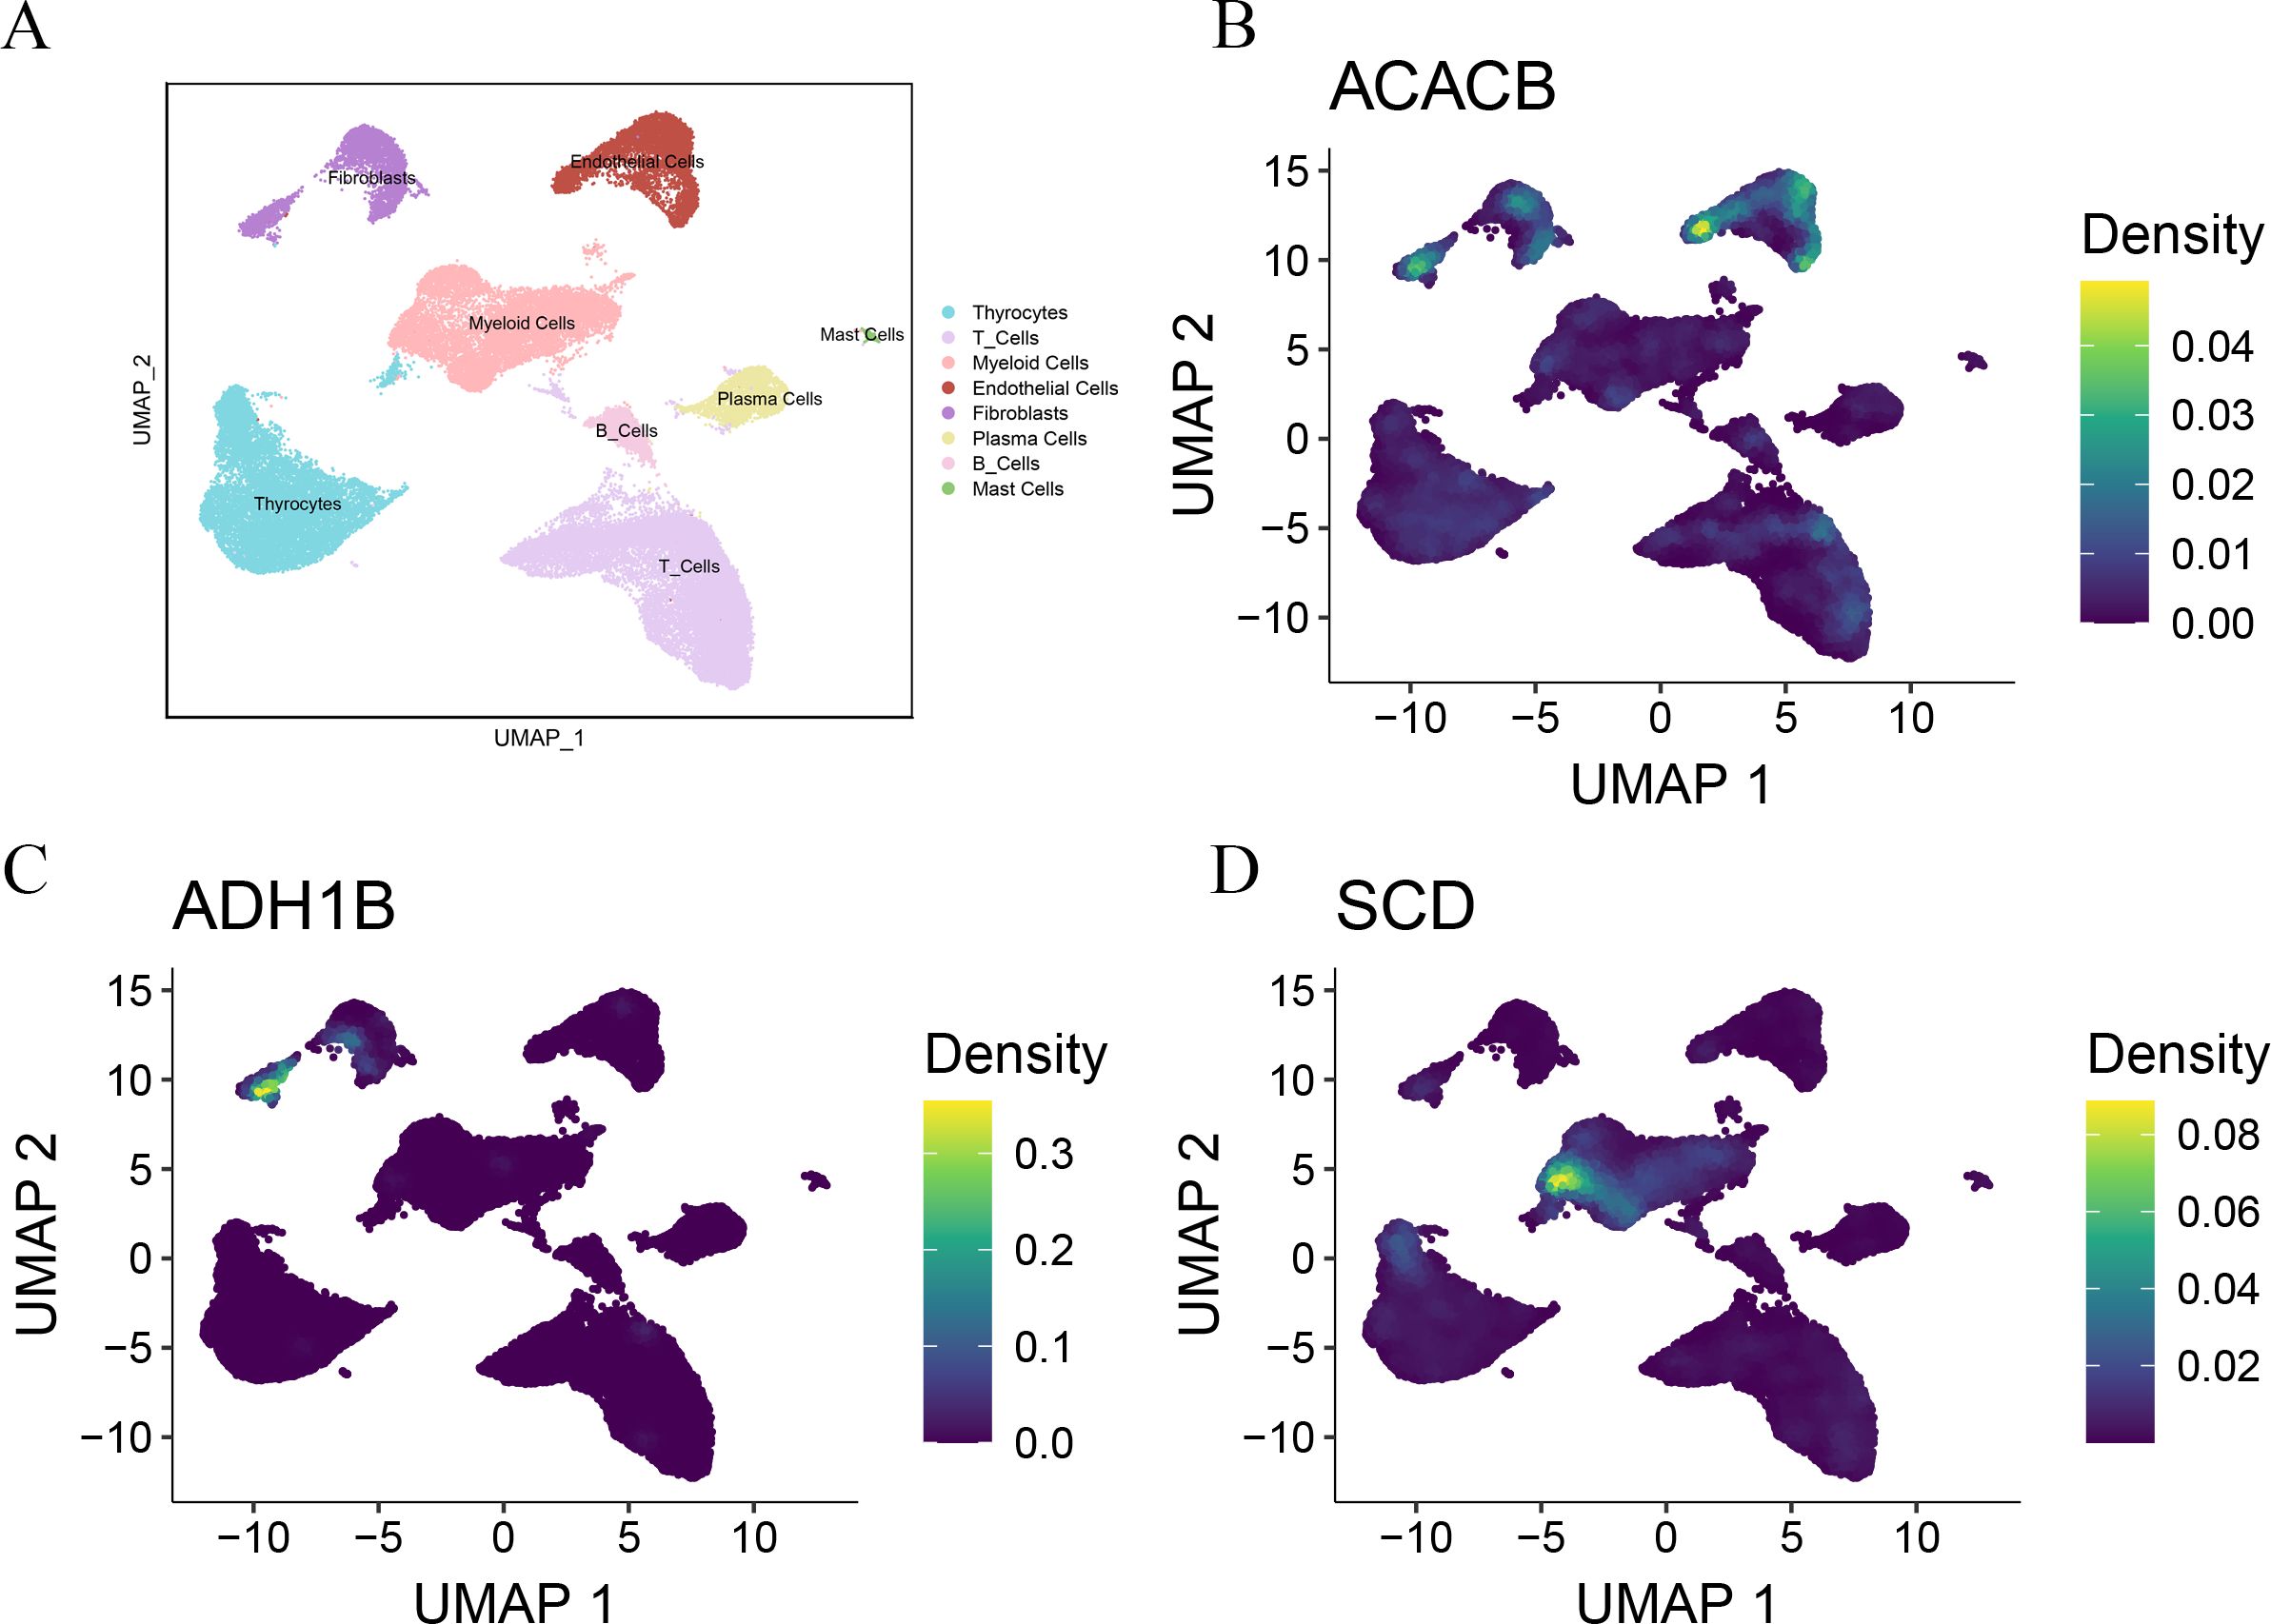
Figure 7. Single-cell analysis verified the expression of the three FAM-related genes. (A) UMAP plots of the major cell populations from PTC patients. Each point depicts a single cell, colored according to cell type. (B) The expression of ACACB in different cell types. (C) The expression of ADH1B in different cell types. (D) The expression of SCD in different cell types.
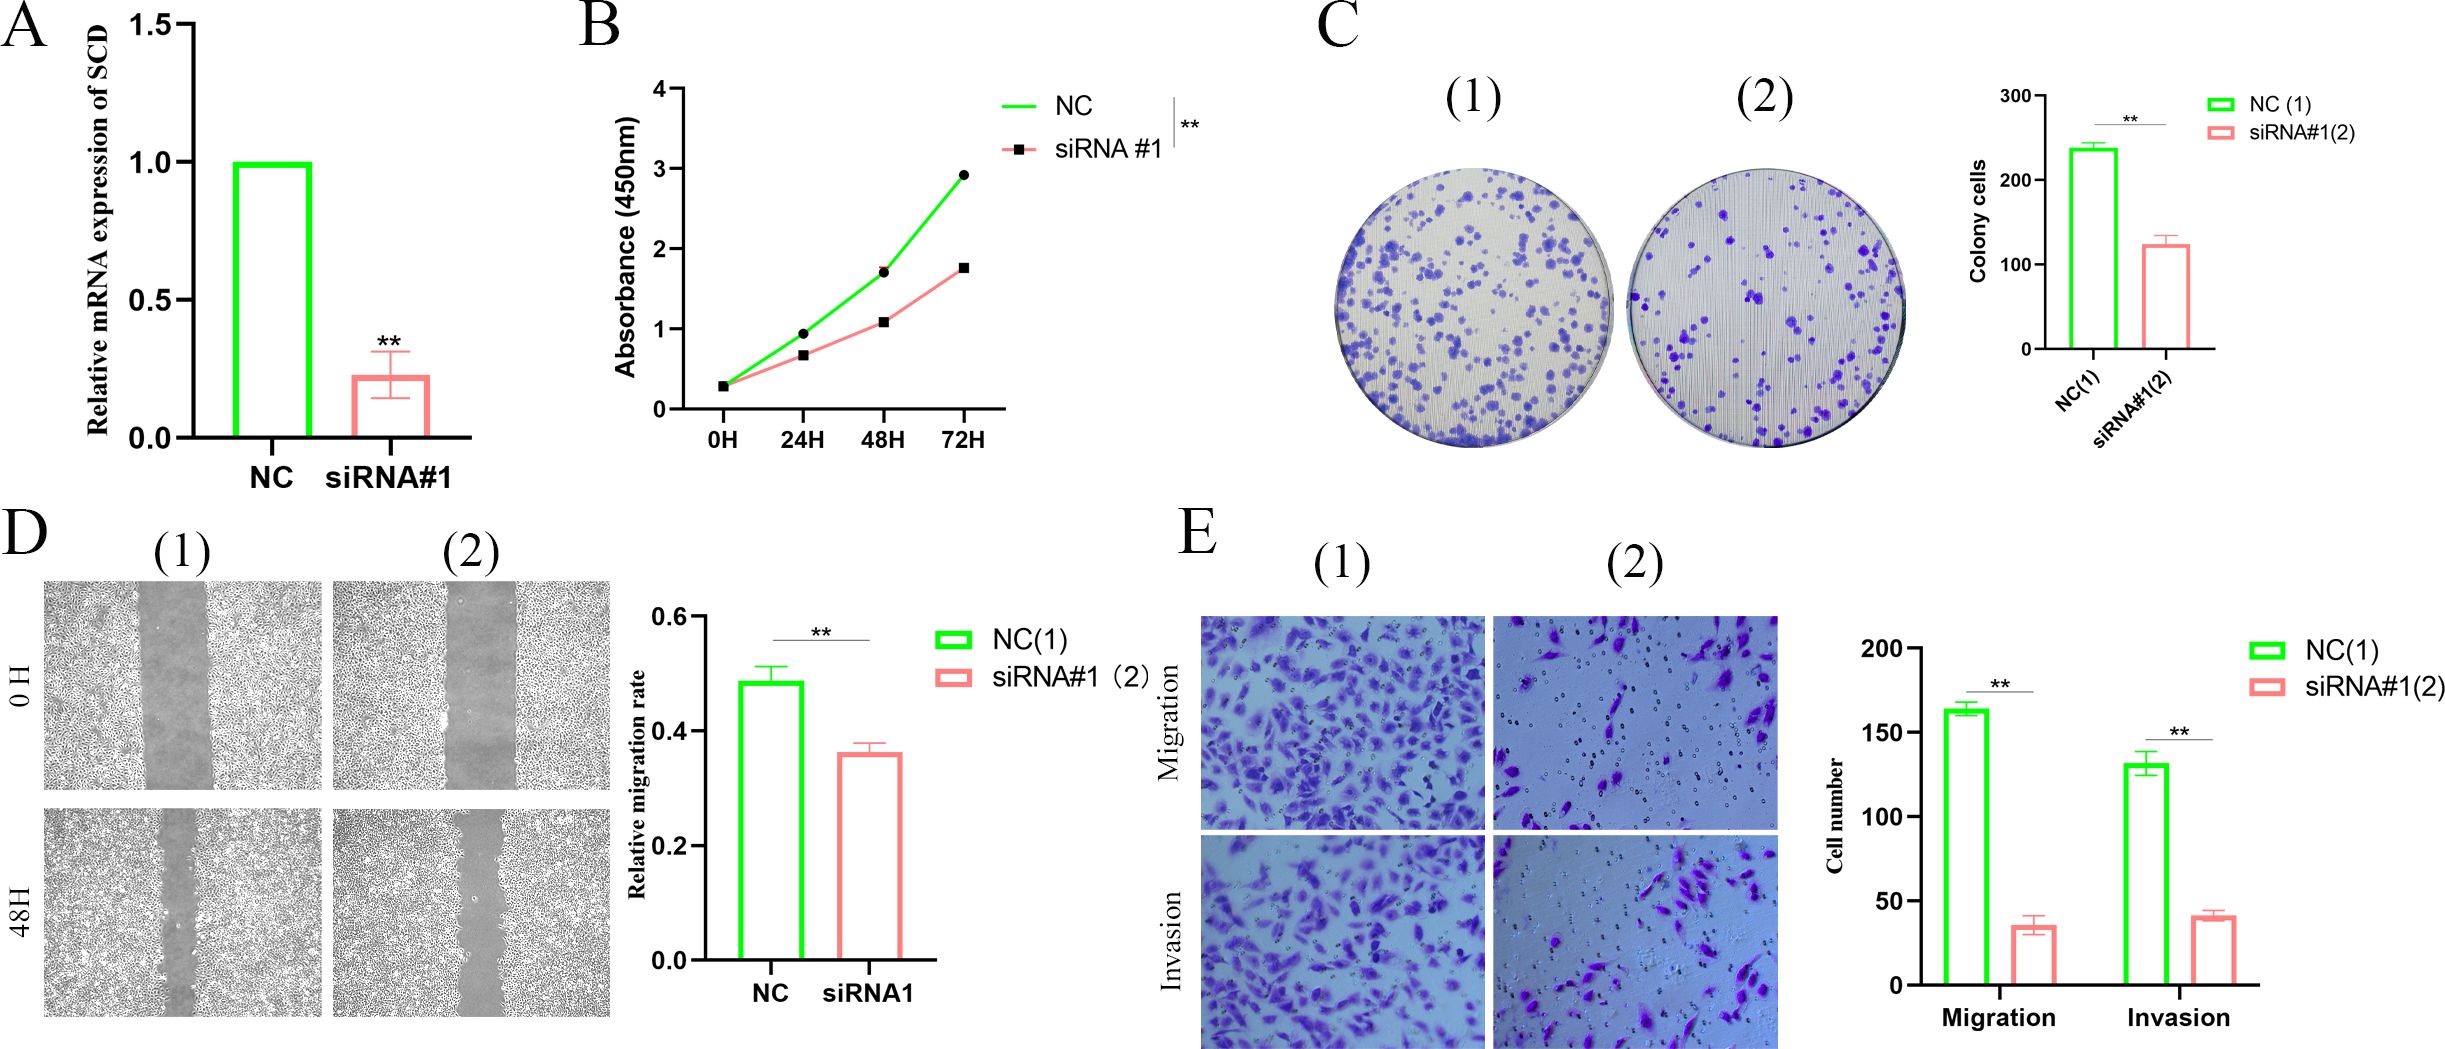
Figure 8. Silencing SCD inhibited PTC proliferation, migration, and invasion. (A) Silencing SCD downregulated SCD mRNA expression. (B) The CCK8 assay showed that silencing SCD inhibited PTC cell proliferation. (C) The colony formation assay depicted that silencing SCD disturbed PTC cell colony formation ability. (D) The scratch assay showed that silencing SCD controlled PTC cell migration. (E) The Transwell assay concluded that silencing SCD restrained PTC cell migration and invasion. **p < 0.01.
Discussion
Thyroid cancer ranks as the seventh most prevalent cancer worldwide, with its incidence rapidly increasing (3). As the most common type of thyroid cancer, PTC is primarily treated with surgery, often followed by radioactive iodine therapy (30). Although most PTC patients have a favorable prognosis, surgical treatment often imposes considerable economic and psychological burdens. Therefore, exploring the mechanisms underlying PTC development and progression and identifying potential treatment targets are crucial for improving the diagnosis, treatment, and prognosis of PTC patients. Our study seeks to explore the influence of FAM-related genes on the prognosis of PTC patients. By constructing a prognostic signature of FAM-related genes, we aim to predict clinical outcomes and explore its associations with clinical features, immunotherapy responses, and tumor progression.
Growing evidence suggests that metabolic dysregulation is a key determinant of tumor progression, immunotherapy resistance, recurrence, and metastasis (31). Aberrant lipid metabolism is a hallmark of various cancers, enabling rapid proliferation by driving excessive endogenous lipid production or enhanced uptake of external lipids, with cancer cells relying on FAM, alongside aerobic glycolysis and glutamine consumption, to meet their heightened energy demands (4, 32–34). FAM primarily influences the biological behavior of cancer cells through the formation of membrane lipid constituents, as well as the generation and deposit of energy (5). The composition of fatty acids (FAs) in the cell membrane enhances cell survival and reduces lipotoxicity (35). Tumor cells can acquire FAs exogenously or synthesize them endogenously through dysregulated lipogenesis. Alterations in FA levels or excessive lipid accumulation can disrupt homeostasis and exacerbate cellular stress (4). Thyroid cancer, as a malignant tumor, has been reported to be closely related to the biological functions of FAM (36). However, the molecular markers related to FAM in thyroid cancer remain insufficiently characterized. Recently, the construction of cancer prognostic signatures relying on specific gene sets has gained increasing recognition (37–40). A reliable prognostic model can help clinicians accurately classify patients into high-risk and low-risk groups, applying it to personalized treatment decisions. We constructed a significant prognostic signature relying on FAM-related genes, validated its clinical relevance, and evaluated the immune landscape.
Firstly, we retrieved 309 FAM-related genes from the MSigDB database. Next, we identified 24 DEGs to construct prognostic signatures. Next, we built a prognostic signature, which included three FAM-related genes, namely, ACACB, ADH1B, and SCD. Furthermore, we evaluated the association of the immune landscape. We observed that the low-risk group showed elevated immune cell levels and enhanced expression of immune checkpoints. Hot tumors respond well to immunotherapy due to the high activity of immune cells, while cold tumors are unresponsive to immunotherapy because of the lack of immune cell infiltration (41–43). Therefore, we can classify the low-risk group as hot tumors and the high-risk group as cold tumors, with low-risk PTC patients likely to benefit from immunotherapy, providing a new direction for clinical decision-making. Lastly, we checked the expression of the three genes in normal thyroid and PTC cell lines, finding that ACACB and ADH1B had a lower expression in PTC cell lines, while SCD exhibited a higher expression in PTC cell lines.
The ACC family influences tumor progression, with ACACB being an important member of this family (44, 45). ACACB has been reported in various diseases, including cancer (46), diabetic nephropathy (47), obesity (48), diabetes (49), and hepatic steatosis (50). Li K. et al. found that ACACB is highly expressed in laryngeal cancer tissues and is closely related to cancer staging and the degree of cellular differentiation in laryngeal cancer (51). Valvo V. et al. observed that BRAFV600E downregulates ACACB expression, thereby disrupting the regulation of lipid metabolism, which promotes de-novo lipogenesis and reduces fatty acid oxidation (FAO), synergistically contributing to vemurafenib resistance and increased tumor growth, suggesting that rescuing ACACB may represent a novel strategy to overcome resistance to BRAFV600E inhibitors in PTC and improve treatment outcomes for patients with refractory disease (52).
ADH1B is a member of the ADH1 family and is involved in the conversion of some alcohol products to aldehydes (53). The expression of ADH1B in human adipocytes is regulated by metabolic conditions (54, 55). Specifically, a downregulation of ADH1B expression has been shown to impair adipocyte differentiation, suggesting its crucial role in maintaining normal adipogenesis and metabolic function (55). Zhou Y. et al. believed that ADH1B is a key gene associated with afatinib, whose downregulation correlates with poorer prognosis and immune microenvironment changes in HCC patients, and they suggested ADH1B as a value target, offering a significant method for developing novel therapies for HCC (56). Morales LD et al. found that ADH1B disturbed the metabolic activity of adipose tissue, and its expression is inhibited by obesity, which is associated with insulin-stimulated glucose uptake (57). Yin D. et al. found that ADH1B is one of the genes with upregulated or downregulated expression in both LUAD and LUSC (58). Liu TT et al. considered ADH1B as one of the important genes linking Hashimoto’s thyroiditis (HT) and PTC, with potential diagnostic value (59). ADH1B affects the metabolic functions of adipose tissue, tumor progression, and metabolic diseases such as obesity, which means that it may serve as a potential treatment target for PTC patients.
SCD is a lipid-modifying enzyme that is upregulated in various cancers, including ovarian cancer (60), breast cancer (61), gastric cancer (GC) (62), and HCC (63). SCD promotes tumor progression and resistance in lung cancer by activating the EGFR/PI3K/AKT signaling pathway (64). SCD is also involved in GC chemoresistance by regulating the stemness and chemoresistance of GC cells through AKAP-8L, suggesting that SCD may overcome chemoresistance in GC (65). Lingrand M. et al. found that SCD regulates the migration of breast cancer cells by producing oleic acid, thereby promoting tumor metastasis (66). Yu Y. et al. uncovered that inhibiting SCD expression or function selectively excludes colon cancer stem cells through apoptosis, primarily by suppressing the Wnt and Notch signaling pathways (67). SCD plays a critical role in lipid metabolism in PTC, promoting PTC malignant progression through collaboration with METTL16 and YTHDC2 (68).
ACACB, ADH1B, and SCD, as key genes related to FAM, play important roles in tumor progression in PTC and may serve as potential therapeutic targets in PTC patients. Lastly, we also found that silencing SCD inhibited PTC cell proliferation, migration, and invasion. In conclusion, we found that FAM-related genes are involved in PTC progression, with SCD emerging as a potential therapeutic target. Further research is required to investigate its clinical implications and the underlying molecular mechanisms.
Conclusion
In this study, we constructed a prognostic signature relying on FAM-related genes and validated its clinical applicability in PTC patients. We found that patients in the low-risk group represented higher immune cell infiltration and immune checkpoint expression, signifying that they are more likely to benefit from immunotherapy. Additionally, silencing SCD in PTC inhibited cell proliferation, migration, and invasion. Therefore, SCD could emerge as a promising biomarker for PTC and offers a potential treatment target for future interventions.
Data availability statement
The original contributions presented in the study are included in the article/Supplementary Material. Further inquiries can be directed to the corresponding author.
Author contributions
BS: Conceptualization, Data curation, Formal analysis, Investigation, Methodology, Software, Validation, Visualization, Writing – original draft, Writing – review & editing. YZ: Data curation, Formal analysis, Methodology, Software, Writing – review & editing. YT: Conceptualization, Funding acquisition, Investigation, Methodology, Project administration, Resources, Supervision, Writing – review & editing.
Funding
The author(s) declare that financial support was received for the research, authorship, and/or publication of this article. This research is supported by fellowship from the Natural Science Foundation of Sichuan Province (No. 2023NSFSC1871) and the National Natural Science Foundation of China (No. 82403597).
Acknowledgments
We acknowledge the data support provided by TCGA and GEO for this study.
Conflict of interest
The authors declare that the research was conducted in the absence of any commercial or financial relationships that could be construed as a potential conflict of interest.
Generative AI statement
The author(s) declare that no Generative AI was used in the creation of this manuscript.
Publisher’s note
All claims expressed in this article are solely those of the authors and do not necessarily represent those of their affiliated organizations, or those of the publisher, the editors and the reviewers. Any product that may be evaluated in this article, or claim that may be made by its manufacturer, is not guaranteed or endorsed by the publisher.
Supplementary material
The Supplementary Material for this article can be found online at: https://www.frontiersin.org/articles/10.3389/fendo.2025.1534393/full#supplementary-material
Abbreviations
PTC, papillary thyroid carcinoma; FAM, fatty acid metabolism; DEGs, differentially expressed genes; ACC, acetyl-CoA carboxylase; TCGA, The Cancer Genome Atlas; GEO, Gene Expression Omnibus; qPCR, quantitative polymerase chain reaction; PBS, phosphate buffered saline; FAs, fatty acids; ACACB, acetyl-CoA carboxylase beta; FAO, fatty acid oxidation; ADH1B, alcohol dehydrogenase 1B; HCC, hepatocellular carcinoma; FASN, fatty acid synthase; HT, Hashimoto’s thyroiditis; GC, gastric cancer.
References
1. Megwalu UC, Moon PK. Thyroid cancer incidence and mortality trends in the United States: 2000-2018. Thyroid. (2022) 32:560–70. doi: 10.1089/thy.2021.0662
2. Lim H, Devesa SS, Sosa JA, Check D, Kitahara CM. Trends in thyroid cancer incidence and mortality in the United States, 1974-2013. Jama. (2017) 317:1338–48. doi: 10.1001/jama.2017.2719
3. Bray F, Laversanne M, Sung H, Ferlay J, Siegel RL, Soerjomataram I, et al. Global cancer statistics 2022: GLOBOCAN estimates of incidence and mortality worldwide for 36 cancers in 185 countries. CA Cancer J Clin. (2024) 74:229–63. doi: 10.3322/caac.21834
4. Currie E, Schulze A, Zechner R, Walther TC, Farese RV Jr. Cellular fatty acid metabolism and cancer. Cell Metab. (2013) 18:153–61. doi: 10.1016/j.cmet.2013.05.017
5. Koundouros N, Poulogiannis G. Reprogramming of fatty acid metabolism in cancer. Br J Cancer. (2020) 122:4–22. doi: 10.1038/s41416-019-0650-z
6. Li Z, Zhang H. Reprogramming of glucose, fatty acid and amino acid metabolism for cancer progression. Cell Mol Life Sci. (2016) 73:377–92. doi: 10.1007/s00018-015-2070-4
7. Luo Y, Wang H, Liu B, Wei J. Fatty acid metabolism and cancer immunotherapy. Curr Oncol Rep. (2022) 24:659–70. doi: 10.1007/s11912-022-01223-1
8. Ma Y, Temkin SM, Hawkridge AM, Guo C, Wang W, Wang XY, et al. Fatty acid oxidation: An emerging facet of metabolic transformation in cancer. Cancer Lett. (2018) 435:92–100. doi: 10.1016/j.canlet.2018.08.006
9. Zhang J, Ouyang F, Gao A, Zeng T, Li M, Li H, et al. ESM1 enhances fatty acid synthesis and vascular mimicry in ovarian cancer by utilizing the PKM2-dependent warburg effect within the hypoxic tumor microenvironment. Mol Cancer. (2024) 23:94. doi: 10.1186/s12943-024-02009-8
10. Chu J, Jiang J, Lu X, He G, Zhang D. CircPCNXL2 promotes papillary thyroid carcinoma progression by regulating fatty acid metabolism induced by anabolic enzyme ACC1. Cancer Lett. (2024) 598:217069. doi: 10.1016/j.canlet.2024.217069
11. Lu J, Zhang Y, Sun M, Ding C, Zhang L, Kong Y, et al. Multi-omics analysis of fatty acid metabolism in thyroid carcinoma. Front Oncol. (2021) 11:737127. doi: 10.3389/fonc.2021.737127
12. Castanza AS, Recla JM, Eby D, Thorvaldsdóttir H, Bult CJ, Mesirov JP. Extending support for mouse data in the Molecular Signatures Database (MSigDB). Nat Methods. (2023) 20:1619–20. doi: 10.1038/s41592-023-02014-7
13. Liberzon A, Birger C, Thorvaldsdóttir H, Ghandi M, Mesirov JP, Tamayo P. The Molecular Signatures Database (MSigDB) hallmark gene set collection. Cell Syst. (2015) 1:417–25. doi: 10.1016/j.cels.2015.12.004
14. Liberzon A, Subramanian A, Pinchback R, Thorvaldsdóttir H, Tamayo P, Mesirov JP. Molecular signatures database (MSigDB) 3.0. Bioinformatics. (2011) 27:1739–40. doi: 10.1093/bioinformatics/btr260
15. Subramanian A, Tamayo P, Mootha VK, Mukherjee S, Ebert BL, Gillette MA, et al. Gene set enrichment analysis: a knowledge-based approach for interpreting genome-wide expression profiles. Proc Natl Acad Sci U S A. (2005) 102:15545–50. doi: 10.1073/pnas.0506580102
16. Wang Z, Jensen MA, Zenklusen JC. A practical guide to the cancer genome atlas (TCGA). Methods Mol Biol. (2016) 1418:111–41. 10.1007/978-1-4939-3578-9_6
17. von Roemeling CA, Marlow LA, Pinkerton AB, Crist A, Miller J, Tun HW, et al. Aberrant lipid metabolism in anaplastic thyroid carcinoma reveals stearoyl CoA desaturase 1 as a novel therapeutic target. J Clin Endocrinol Metab. (2015) 100:E697–709. doi: 10.1210/jc.2014-2764
18. Tomás G, Tarabichi M, Gacquer D, Hébrant A, Dom G, Dumont JE, et al. A general method to derive robust organ-specific gene expression-based differentiation indices: application to thyroid cancer diagnostic. Oncogene. (2012) 31:4490–8. doi: 10.1038/onc.2011.626
19. Dom G, Tarabichi M, Unger K, Thomas G, Oczko-Wojciechowska M, Bogdanova T, et al. A gene expression signature distinguishes normal tissues of sporadic and radiation-induced papillary thyroid carcinomas. Br J Cancer. (2012) 107:994–1000. doi: 10.1038/bjc.2012.302
20. Lee SE, Park S, Yi S, Choi NR, Lim MA, Chang JW, et al. Unraveling the role of the mitochondrial one-carbon pathway in undifferentiated thyroid cancer by multi-omics analyses. Nat Commun. (2024) 15:1163. doi: 10.1038/s41467-024-45366-0
21. Newman AM, Liu CL, Green MR, Gentles AJ, Feng W, Xu Y, et al. Robust enumeration of cell subsets from tissue expression profiles. Nat Methods. (2015) 12:453–7. doi: 10.1038/nmeth.3337
22. Li T, Fan J, Wang B, Traugh N, Chen Q, Liu JS, et al. TIMER: A web server for comprehensive analysis of tumor-infiltrating immune cells. Cancer Res. (2017) 77:e108–10. doi: 10.1158/1538-7445.AM2017-108
23. Finotello F, Mayer C, Plattner C, Laschober G, Rieder D, Hackl H, et al. Molecular and pharmacological modulators of the tumor immune contexture revealed by deconvolution of RNA-seq data. Genome Med. (2019) 11:34. doi: 10.1186/s13073-019-0638-6
24. Li B, Severson E, Pignon JC, Zhao H, Li T, Novak J, et al. Comprehensive analyses of tumor immunity: implications for cancer immunotherapy. Genome Biol. (2016) 17:174. doi: 10.1186/s13059-016-1028-7
25. Aran D, Hu Z, Butte AJ. xCell: digitally portraying the tissue cellular heterogeneity landscape. Genome Biol. (2017) 18:220. doi: 10.1186/s13059-017-1349-1
26. Racle J, de Jonge K, Baumgaertner P, Speiser DE, Gfeller D. Simultaneous enumeration of cancer and immune cell types from bulk tumor gene expression data. Elife. (2017) 6:e26476. doi: 10.7554/eLife.26476
27. Postow MA, Sidlow R, Hellmann MD. Immune-related adverse events associated with immune checkpoint blockade. N Engl J Med. (2018) 378:158–68. doi: 10.1056/NEJMra1703481
28. Mao S, Zeng L, Yang Y, Liu Z, Zhang L. Receptor-ligand pair typing and prognostic risk model of response or resistance to immune checkpoint inhibitors in lung adenocarcinoma. Front Oncol. (2023) 13:1170942. doi: 10.3389/fonc.2023.1170942
29. Mao S, Wang Y, Chao N, Zeng L, Zhang L. Integrated analysis of single-cell RNA-seq and bulk RNA-seq reveals immune suppression subtypes and establishes a novel signature for determining the prognosis in lung adenocarcinoma. Cell Oncol (Dordr). (2024) 47:1697–713. doi: 10.1007/s13402-024-00948-4
30. Boucai L, Zafereo M, Cabanillas ME. Thyroid cancer: A review. Jama. (2024) 331:425–35. doi: 10.1001/jama.2023.26348
31. Corn KC, Windham MA, Rafat M. Lipids in the tumor microenvironment: From cancer progression to treatment. Prog Lipid Res. (2020) 80:101055. doi: 10.1016/j.plipres.2020.101055
32. Menendez JA, Lupu R. Fatty acid synthase and the lipogenic phenotype in cancer pathogenesis. Nat Rev Cancer. (2007) 7:763–77. doi: 10.1038/nrc2222
33. Beloribi-Djefaflia S, Vasseur S, Guillaumond F. Lipid metabolic reprogramming in cancer cells. Oncogenesis. (2016) 5:e189. doi: 10.1038/oncsis.2015.49
34. Ford JH. Saturated fatty acid metabolism is key link between cell division, cancer, and senescence in cellular and whole organism aging. Age (Dordr). (2010) 32:231–7. doi: 10.1007/s11357-009-9128-x
35. Hoy AJ, Nagarajan SR, Butler LM. Tumour fatty acid metabolism in the context of therapy resistance and obesity. Nat Rev Cancer. (2021) 21:753–66. doi: 10.1038/s41568-021-00388-4
36. Lukasiewicz M, Zwara A, Kowalski J, Mika A, Hellmann A. The role of lipid metabolism disorders in the development of thyroid cancer. Int J Mol Sci. (2024) 25:7129. doi: 10.3390/ijms25137129
37. Fu D, Zhang B, Fan W, Zeng F, Feng J, Wang X. Fatty acid metabolism prognostic signature predicts tumor immune microenvironment and immunotherapy, and identifies tumorigenic role of MOGAT2 in lung adenocarcinoma. Front Immunol. (2024) 15:1456719. doi: 10.3389/fimmu.2024.1456719
38. Shen B, Wen Z, Lv G, Wang J, Han R, Jiang J. Identification and analysis of DNA methylation-driven signatures for prognostic and immune microenvironments evaluation in hepatocellular carcinoma. Front Genet. (2022) 13:1022078. doi: 10.3389/fgene.2022.1022078
39. Liu Y, Shen B, Huang T, Wang J, Jiang J. Construction and validation of 3-genes hypoxia-related prognostic signature to predict the prognosis and therapeutic response of hepatocellular carcinoma patients. PloS One. (2023) 18:e0288013. doi: 10.1371/journal.pone.0288013
40. Xiao Y, Huang W, Zhang L, Wang H. Identification of glycolysis genes signature for predicting prognosis in Malignant pleural mesothelioma by bioinformatics and machine learning. Front Endocrinol (Lausanne). (2022) 13:1056152. doi: 10.3389/fendo.2022.1056152
41. Khosravi GR, Mostafavi S, Bastan S, Ebrahimi N, Gharibvand RS, Eskandari N. Immunologic tumor microenvironment modulators for turning cold tumors hot. Cancer Commun (Lond). (2024) 44:521–53. doi: 10.1002/cac2.12539
42. Wei SC, Duffy CR, Allison JP. Fundamental mechanisms of immune checkpoint blockade therapy. Cancer Discovery. (2018) 8:1069–86. doi: 10.1158/2159-8290.CD-18-0367
43. Rezaei M, Danilova ND, Soltani M, Savvateeva LV, Tarasov VV, Ganjalikhani-Hakemi M, et al. Cancer vaccine in cold tumors: clinical landscape, challenges, and opportunities. Curr Cancer Drug Targets. (2022) 22:437–53. doi: 10.2174/1568009622666220214103533
44. Kuhajda FP. Fatty-acid synthase and human cancer: new perspectives on its role in tumor biology. Nutrition. (2000) 16:202–8. doi: 10.1016/S0899-9007(99)00266-X
45. Samuel VT, Shulman GI. Nonalcoholic fatty liver disease as a nexus of metabolic and hepatic diseases. Cell Metab. (2018) 27:22–41. doi: 10.1016/j.cmet.2017.08.002
46. Zhao S, Wang Q, Zhang X, Ma B, Shi Y, Yin Y, et al. MARCH5-mediated downregulation of ACC2 promotes fatty acid oxidation and tumor progression in ovarian cancer. Free Radic Biol Med. (2024) 212:464–76. doi: 10.1016/j.freeradbiomed.2024.01.004
47. Murea M, Freedman BI, Parks JS, Antinozzi PA, Elbein SC, Ma L. Lipotoxicity in diabetic nephropathy: the potential role of fatty acid oxidation. Clin J Am Soc Nephrol. (2010) 5:2373–9. doi: 10.2215/CJN.08160910
48. Riancho JA, Vázquez L, García-Pérez MA, Sainz J, Olmos JM, Hernández JL, et al. Association of ACACB polymorphisms with obesity and diabetes. Mol Genet Metab. (2011) 104:670–6. doi: 10.1016/j.ymgme.2011.08.013
49. Tang SC, Leung VT, Chan LY, Wong SS, Chu DW, Leung JC, et al. The acetyl-coenzyme A carboxylase beta (ACACB) gene is associated with nephropathy in Chinese patients with type 2 diabetes. Nephrol Dial Transplant. (2010) 25:3931–4. doi: 10.1093/ndt/gfq303
50. McGlone ER, Siebert M, Dore M, Hope DCD, Davies I, Owen B, et al. Sleeve gastrectomy causes weight-loss independent improvements in hepatic steatosis. Liver Int. (2023) 43:1890–900. doi: 10.1111/liv.15614
51. Li K, Zhang C, Chen L, Wang P, Fang Y, Zhu J, et al. The role of acetyl-coA carboxylase2 in head and neck squamous cell carcinoma. PeerJ. (2019) 7:e7037. doi: 10.7717/peerj.7037
52. Valvo V, Iesato A, Kavanagh TR, Priolo C, Zsengeller Z, Pontecorvi A, et al. Fine-tuning lipid metabolism by targeting mitochondria-associated acetyl-coA-carboxylase 2 in BRAF(V600E) papillary thyroid carcinoma. Thyroid. (2021) 31:1335–58. doi: 10.1089/thy.2020.0311
53. Gautheron J, Elsayed S, Pistorio V, Lockhart S, Zammouri J, Auclair M, et al. ADH1B, the adipocyte-enriched alcohol dehydrogenase, plays an essential, cell-autonomous role in human adipogenesis. Proc Natl Acad Sci U S A. (2024) 121:e2319301121. doi: 10.1073/pnas.2319301121
54. Winnier DA, Fourcaudot M, Norton L, Abdul-Ghani MA, Hu SL, Farook VS, et al. Transcriptomic identification of ADH1B as a novel candidate gene for obesity and insulin resistance in human adipose tissue in Mexican Americans from the Veterans Administration Genetic Epidemiology Study (VAGES). PloS One. (2015) 10:e0119941. doi: 10.1371/journal.pone.0119941
55. Kerr AG, Sinha I, Dadvar S, Arner P, Dahlman I. Epigenetic regulation of diabetogenic adipose morphology. Mol Metab. (2019) 25:159–67. doi: 10.1016/j.molmet.2019.04.009
56. Zhou Y, Yu L, Huang P, Zhao X, He R, Cui Y, et al. Identification of afatinib-associated ADH1B and potential small-molecule drugs targeting ADH1B for hepatocellular carcinoma. Front Pharmacol. (2023) 14:1166454. doi: 10.3389/fphar.2023.1166454
57. Morales LD, Cromack DT, Tripathy D, Fourcaudot M, Kumar S, Curran JE, et al. Further evidence supporting a potential role for ADH1B in obesity. Sci Rep. (2021) 11:1932. doi: 10.1038/s41598-020-80563-z
58. Yin D, Zhang Y, Li H, Cheng L. Association of TOP2A and ADH1B with lipid levels and prognosis in patients with lung adenocarcinoma and squamous cell carcinoma. Clin Respir J. (2023) 17:1301–15. doi: 10.1111/crj.v17.12
59. Liu TT, Yin DT, Wang N, Li N, Dong G, Peng MF. Identifying and analyzing the key genes shared by papillary thyroid carcinoma and Hashimoto’s thyroiditis using bioinformatics methods. Front Endocrinol (Lausanne). (2023) 14:1140094. doi: 10.3389/fendo.2023.1140094
60. Xuan Y, Wang H, Yung MM, Chen F, Chan WS, Chan YS, et al. SCD1/FADS2 fatty acid desaturases equipoise lipid metabolic activity and redox-driven ferroptosis in ascites-derived ovarian cancer cells. Theranostics. (2022) 12:3534–52. doi: 10.7150/thno.70194
61. Luis G, Godfroid A, Nishiumi S, Cimino J, Blacher S, Maquoi E, et al. Tumor resistance to ferroptosis driven by Stearoyl-CoA Desaturase-1 (SCD1) in cancer cells and Fatty Acid Biding Protein-4 (FABP4) in tumor microenvironment promote tumor recurrence. Redox Biol. (2021) 43:102006. doi: 10.1016/j.redox.2021.102006
62. Mao X, Wang L, Chen Z, Huang H, Chen J, Su J, et al. SCD1 promotes the stemness of gastric cancer stem cells by inhibiting ferroptosis through the SQLE/cholesterol/mTOR signalling pathway. Int J Biol Macromol. (2024) 275:133698. doi: 10.1016/j.ijbiomac.2024.133698
63. Liu HH, Xu Y, Li CJ, Hsu SJ, Lin XH, Zhang R, et al. An SCD1-dependent mechanoresponsive pathway promotes HCC invasion and metastasis through lipid metabolic reprogramming. Mol Ther. (2022) 30:2554–67. doi: 10.1016/j.ymthe.2022.03.015
64. She K, Fang S, Du W, Fan X, He J, Pan H, et al. SCD1 is required for EGFR-targeting cancer therapy of lung cancer via re-activation of EGFR/PI3K/AKT signals. Cancer Cell Int. (2019) 19:103. doi: 10.1186/s12935-019-0809-y
65. Zhang R, Liu L, Wang F, Zhao W, Liu K, Yu H, et al. AKAP8L enhances the stemness and chemoresistance of gastric cancer cells by stabilizing SCD1 mRNA. Cell Death Dis. (2022) 13:1041. doi: 10.1038/s41419-022-05502-4
66. Lingrand M, Lalonde S, Jutras-Carignan A, Bergeron KF, Rassart E, Mounier C. SCD1 activity promotes cell migration via a PLD-mTOR pathway in the MDA-MB-231 triple-negative breast cancer cell line. Breast Cancer. (2020) 27:594–606. doi: 10.1007/s12282-020-01053-8
67. Yu Y, Kim H, Choi S, Yu J, Lee JY, Lee H, et al. Targeting a lipid desaturation enzyme, SCD1, selectively eliminates colon cancer stem cells through the suppression of wnt and NOTCH signaling. Cells. (2021) 10:106. doi: 10.3390/cells10010106
Keywords: papillary thyroid cancer, fatty acid metabolism, immune, bioinformatics, SCD
Citation: Shen B, Zhang Y and Tie Y (2025) Fatty acid metabolism influences the immune microenvironment in papillary thyroid cancer and identifies SCD as a novel biomarker. Front. Endocrinol. 16:1534393. doi: 10.3389/fendo.2025.1534393
Received: 25 November 2024; Accepted: 07 February 2025;
Published: 27 February 2025.
Edited by:
Martin Herrmann, University Hospital Erlangen, GermanyReviewed by:
Xia Yuan, Central South University, ChinaXiaoyan Yang, Harvard University, United States
Copyright © 2025 Shen, Zhang and Tie. This is an open-access article distributed under the terms of the Creative Commons Attribution License (CC BY). The use, distribution or reproduction in other forums is permitted, provided the original author(s) and the copyright owner(s) are credited and that the original publication in this journal is cited, in accordance with accepted academic practice. No use, distribution or reproduction is permitted which does not comply with these terms.
*Correspondence: Yan Tie, dGllbHlfMTk5MEAxNjMuY29t