
94% of researchers rate our articles as excellent or good
Learn more about the work of our research integrity team to safeguard the quality of each article we publish.
Find out more
ORIGINAL RESEARCH article
Front. Endocrinol., 24 February 2025
Sec. Clinical Diabetes
Volume 16 - 2025 | https://doi.org/10.3389/fendo.2025.1516328
This article is part of the Research TopicAdvances in Diabetes and Hypertension ResearchView all 10 articles
 Xiaoli Ren1,2†Mengying Chen1,3†Liyou Lian4
 Huimin Xia1Wei Chen5,6Shengjie Ge1Lijuan Yang1
 Qingxi Jiang5,6
 Xuejiang Gu1*
 Bo Yang5,6*
 Xiang Hu1,6*
Background: The results of population-based studies show a diverse association between the triglyceride-glucose (TyG) index and hypertension. The present study aimed to investigate this association based on a cross-sectional study on Chinese adults and meta-analysis of epidemiology studies.
Methods: The cross-sectional analysis used the baseline data from the on-going REACTION study in China. The TyG index was calculated as Ln [triglyceride(mg/dl)×fasting plasma glucose(mg/dl)/2]. A multivariate-adjusted logistic regression model was used to calculate the odds ratio (OR) with a 95% confidence interval (CIs) for the prevalence of hypertension, with the lowest TyG quartile as a reference.
Results: A total of 4,177 participants aged 58.62 ± 8.40 years were included. TyG was significantly associated with higher odds of hypertension (OR:1.273, 95% CI:1.171-1.384), and the association remained pronounced with isolated systolic hypertension (OR:1.161, 95% CI:1.045-1.289) and systolic-diastolic hypertension (OR:1.313, 95% CI:1.163-1.483) but not with isolated diastolic hypertension (OR:1.164, 95% CI:0.929-1.460). In the present meta-analysis, 34 relevant studies were included through systematic searches of PUBMED, Embase, and the Cochrane Library. A positive association between the TyG index and hypertension was revealed in the meta-analysis of cohort studies (HR:1.57, 95% CI:1.25-1.96) and cross-sectional studies (OR:2.01, 95% CI:1.47-2.76).
Conclusion: Elevated TyG index levels were significantly associated with a higher risk of clinical hypertension, which may provide new insights into the clinical management of hypertension.
Elevated blood pressure (BP) is a leading risk factor for cardiovascular death (1, 2). Data from a Chinese national survey of 1.7 million adults showed that more than 40% of Chinese adults may have suffered from hypertension and the risk of high BP increases with age (3). In consideration of the improvement of awareness, treatment, and control of hypertension in middle-aged and elderly Chinese (4), identification of a new onset of hypertension may be effective in reducing the healthcare burden from cardiometabolic diseases in China.
Disorders of glucose and lipid metabolism, particularly elevated levels of triglyceride (TG) and fasting plasma glucose (FPG), are known risk factors for hypertension (5, 6). Mechanistic evidence to date has indicated that insulin resistance (IR) is linked with hypertension (7). Elevated levels of TG and FPG separately reflect IR status in the liver and adipose cells (8), with a general acceptance that conditions involved in high BP include endothelial dysfunction (9), pro-inflammatory response (10), and over-activation of the renin-angiotensin system (RAS) (11). The triglyceride-glucose (TyG) index, a composite parameter based on TG and FPG levels, presents a novel and cost-effective tool for assessing insulin resistance. TyG not only reflects glucose metabolism, but also captures lipid metabolism aspects that were not covered by traditional indices such as HOMA-IR. Its convenience due to only requiring routine biochemical parameters (12, 13) means it can be implemented more easily in clinical cardiology practice and resource-limited areas (14).
The TyG index may have the potential to become a novel indicator in detecting new-onset myocardial infarction (8) and metabolic syndrome (15). Nevertheless, evidence to date suggests that findings on using the TyG index to predict incident hypertension were inconsistent in several prospective cohorts (16, 17). Of note, two meta-analyses found the TyG index to be related to an increased risk of high BP (18, 19). One possibility was that the eligible selections from most cross-sectional studies may decrease the inference of causal association in pooled estimations and the inclusion of articles limited to Chinese regions may reduce population representativeness and generalizability. Moreover, the disagreements reported in previous studies were likely to be partially influenced by patients with different subtypes of hypertension including isolated systolic hypertension (ISH), isolated diastolic hypertension (IDH), and systolic-diastolic hypertension (SDH), low statistical powers attributed to small sample size, and insufficient adjustments for covariates.
To present population-based evidence with a large sample size and multiple covariates adjusted for, we used the baseline data from the REACTION study (20) to examine a cross-sectional association between the TyG index and hypertension in middle-aged and elderly Chinese patients. Moreover, a meta-analysis of data from prospective cohorts was further conducted to strengthen the observation at the causal evidence level.
The present study was one part of the baseline survey from the REACTION study that aimed to investigate the association between diabetes and cancer among 259,657 adults aged over 40 years old in 25 local communities across different regions of China from 2011 to 2012 (20). Participants in the current study were selected from four communities in Wenzhou, Zhejiang Province. Eligible study participants were identified from local residence registration records and were required to be 40 years or older, with no restrictions on sex or ethnicity. Exclusion criteria for the participants were as follows: (1) severe hepatic or renal dysfunction (viral hepatitis, liver cirrhosis, autoimmune liver disease, chronic nephritis, and nephrotic syndrome), severe cardiovascular or cerebrovascular disease (myocardial infarction, coronary heart disease, and stroke), tumor, and psychiatric disorder; (2) data on key variables were missing. A total of 4,177 participants were included in the final analysis.
This study was conducted in accordance with the principles of the Declaration of Helsinki and approved by the Ruijin Hospital Ethics Committee, Shanghai Jiaotong University School of Medicine (201114RHEC). All participants signed informed consent forms prior to the study.
All participants completed standardized questionnaires, anthropometric tests, and laboratory examinations, which were conducted by professional physicians. The questionnaires included demographic characteristics, socioeconomic status, lifestyle factors (smoking, drinking, physical activity, and sedentary behavior), and medical history, and their specific definitions have been described in previous publications (20). Anthropometric tests were carried out by trained staff using uniform instruments (20, 21). Height and weight were measured with the participants wearing light clothing and no shoes. Body mass index (BMI) was calculated as weight (kg)/height (meters) squared. BP was measured using a mercury sphygmomanometer. Blood samples were collected from subjects who had fasted overnight for at least 8 hours. Routine biochemical data including FPG, 2-hour plasma glucose (2hPG), glycated hemoglobin A1c (HbA1c), total cholesterol (TC), TG, high-density lipoprotein cholesterol (HDL-C), and low-density lipoprotein cholesterol (LDL-C) were examined under a strict quality control (20, 21).
The TyG index was calculated according to the formula with Ln [TG (mg/dl)×FPG (mg/dl)/2] (22). Hypertension was defined as the objective measurement with systolic BP (SBP) ≥ 140mmHg and/or diastolic BP (DBP) ≥ 90mmHg (23) and/or the current use of antihypertensive medications. ISH was defined as SBP ≥ 140mmHg and DBP < 90mmHg (24). IDH was defined as SBP < 140mmHg and DBP ≥ 90mmHg (24). SDH was defined as SBP ≥ 140mmHg and DBP ≥ 90mmHg (24). A BMI of ≥ 24 kg/m² was defined as overweight/obesity according to the definition proposed by the Working Group on Obesity in China (25). Diabetes was diagnosed as FPG ≥ 7.0 mmol/L, 2hPG ≥ 11.1 mmol/L, or receiving hypoglycemic therapy (26). Dyslipidemia was defined as TC ≥ 5.18 mmol/L and/or TG ≥ 1.7 mmol/L and/or LDL-C ≥ 3.37 mmol/L and/or HDL-C < 1.04 mmol/L and/or on specific treatment for dyslipidemia (27). Depressive symptoms were measured by the Patient Health Questionnaire-9 (PHQ-9), and a PHQ-9 score ≥ 5 defined the presence of depressive symptoms (28).
Data were presented as frequencies and percentages for categorical variables and mean ± standard deviation (SD) or median and interquartile range (IQR) for continuous variables according to their normality. Differences between groups were measured by the chi-square test or Fisher’s exact test for categorical variables and Student’s t-test or the Mann–Whitney U test for continuous variables. Participants were divided into four groups according to TyG index quartile levels, with the lowest quartile as a reference. A logistic regression model was used to calculate the odds ratio (OR) with a confidence interval (CI) for the prevalence of hypertension, with multiple adjustments for covariates including age, sex, education levels, lifestyle risk factors (smoking status, drinking status, physical activity, and sedentary behavior), and concomitant diseases (overweight/obesity, diabetes, dyslipidemia, and depressive symptoms). Subgroup analyses were conducted to determine if the TyG index interacted with age, sex, lifestyle risk factors, or concomitant diseases. Two sensitivity analyses were performed to test if the direction of the estimated association for the TyG index changed when (1) re-defining hypertension as SBP ≥ 130mmHg or DBP ≥ 80mmHg or (2) after additional adjustments for anti-hypertensive medications.
In the additional meta-analyses, relevant population-based studies were included according to the following criteria: (1) population-based cross-sectional or cohort studies; (2) ORs or HRs with 95% CIs for the TyG index in relation to hypertension; (3) with systolic/diastolic BP greater than 140/90 mmHg or the use of antihypertensive medications as the diagnosis for hypertension.
The 9-star Newcastle–Ottawa Scale (NOS) (29) was used to evaluate the study quality of the included studies. Studies with an NOS score of 8 to 9 stars were considered high quality, 6 to 7 stars were moderate quality and 1 to 5 stars were low quality.
A random effects model was used to calculate the summary ORs for the cross-sectional studies and HRs for the prospective cohort studies. Heterogeneity was assessed using Q statistics and the I2 index (30). A sensitivity analysis was conducted to assess the robustness of the pooled association estimations by excluding one individual study at a time (31). Funnel plots, Egger’s test, and Begg’s test were used to evaluate the potential publication bias (32). All statistical analyses were performed using Stata version 17.0, with a P-value less than 0.05 indicating statistical significance.
Characteristics of the participants in the cross-sectional study are shown in Table 1. A total of 4,177 eligible participants (1,267 men and 2,910 women) were included, with a mean age of 58.62 ± 8.40 years old. The study population included 2,081 hypertensive patients and 2,096 individuals with normal blood pressure. Among the hypertensive patients, 924 were taking anti-hypertensive medication. The prevalence of hypertension was 49.82% (95% CI: 48.30-51.34), with a significant increase in the proportions of hypertension across the TyG quartiles (P for trend < 0.001). Participants in the highest TyG quartiles had a higher proportion of overweight/obesity, diabetes, and dyslipidemia than those in the lowest quartiles (all P<0.001). Moreover, compared to participants in the lowest TyG quartile, those in the higher TyG quartiles were more likely to be male, older, current smokers, and drinkers (all P<0.001).
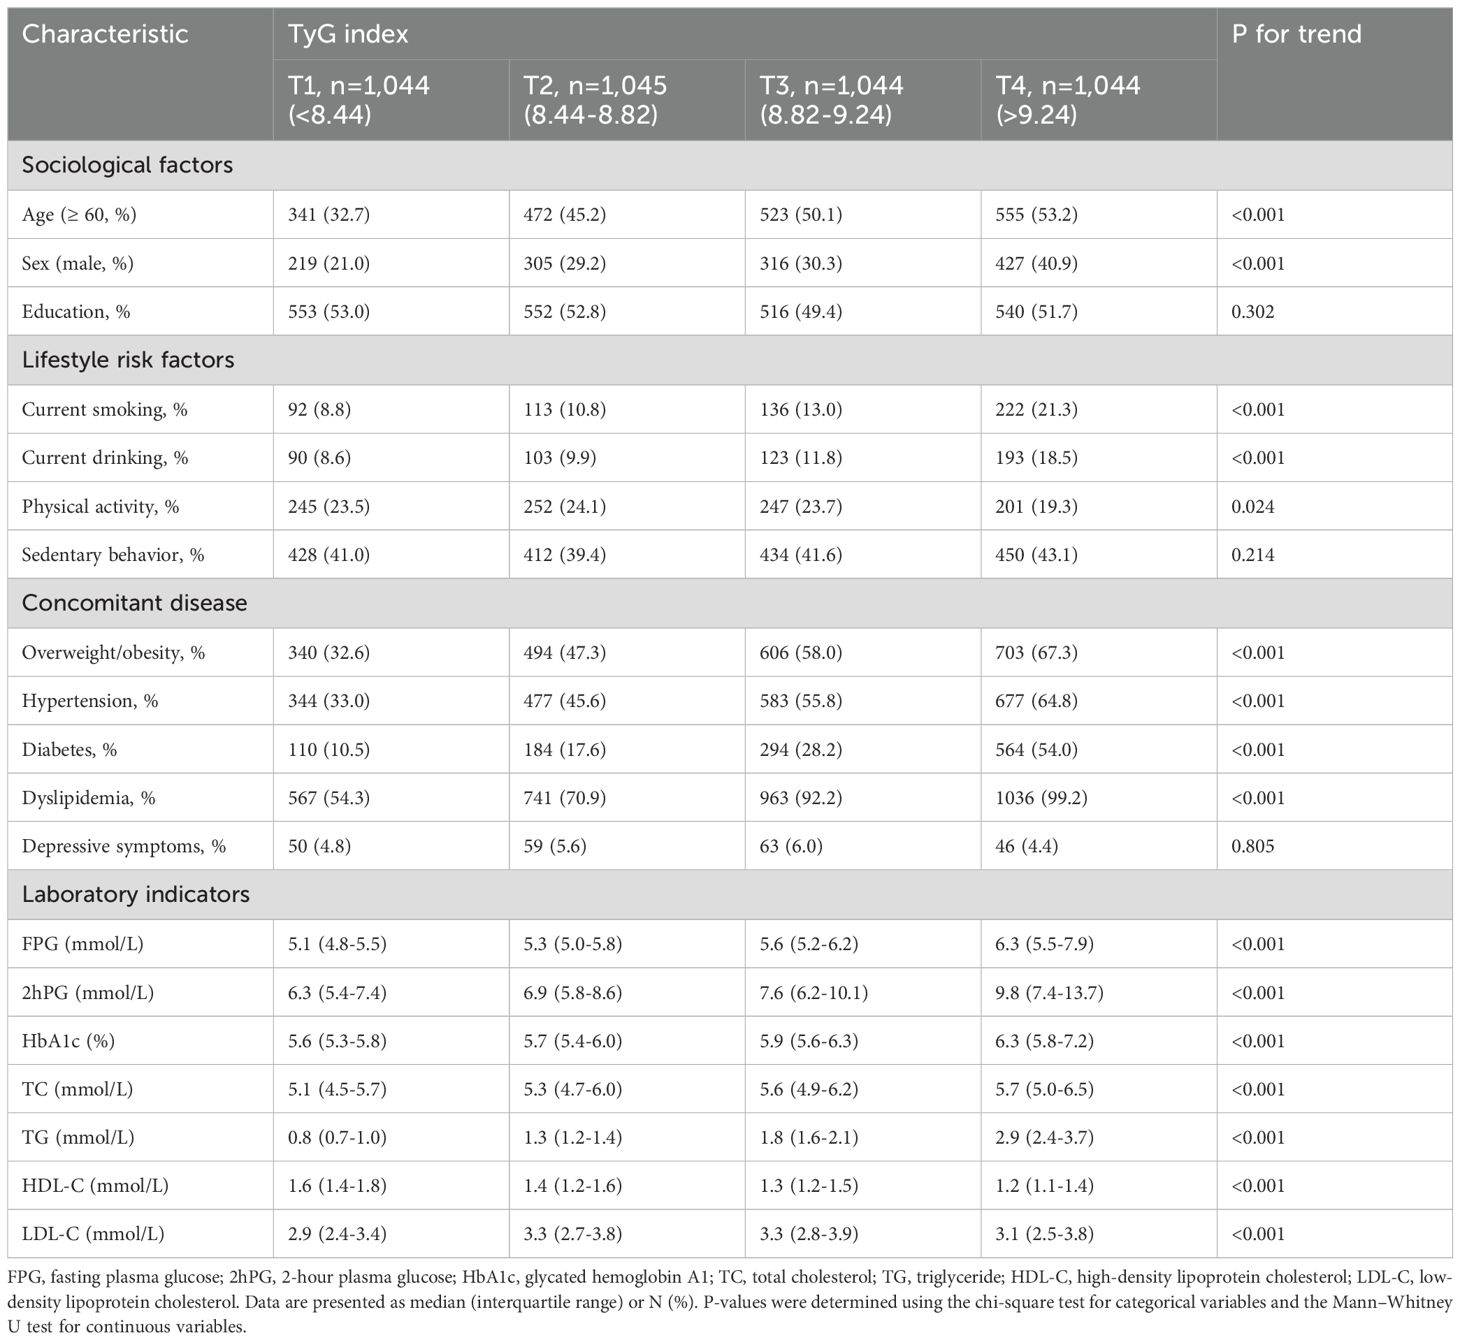
Table 1. Descriptive characteristics of the 4,177 individuals who participated in the cross-sectional study.
There was a positive association between the TyG index and hypertension in all the statistical models with multiple adjustments (Table 2). Specifically, participants in the highest TyG quartile had higher odds of hypertension than those in the lowest TyG quartile (OR:1.273, 95% CI:1.171-1.384, P<0.001), and the associations were found to be pronounced in ISH (OR:1.161, 95% CI:1.045-1.289, P=0.005) and SDH (OR:1.313, 95% CI:1.163-1.483, P<0.001) but not in IDH (OR: 1.164, 95% CI:0.929-1.460, P=0.187).

Table 2. The association between the TyG index and the prevalence of hypertension in the cross-sectional study.
In the subgroup analyses (Figure 1), the TyG index was found to have significant associations with the prevalence of hypertension in most of the subgroups, with no significant interactions between the TyG index and the strata for hypertension.
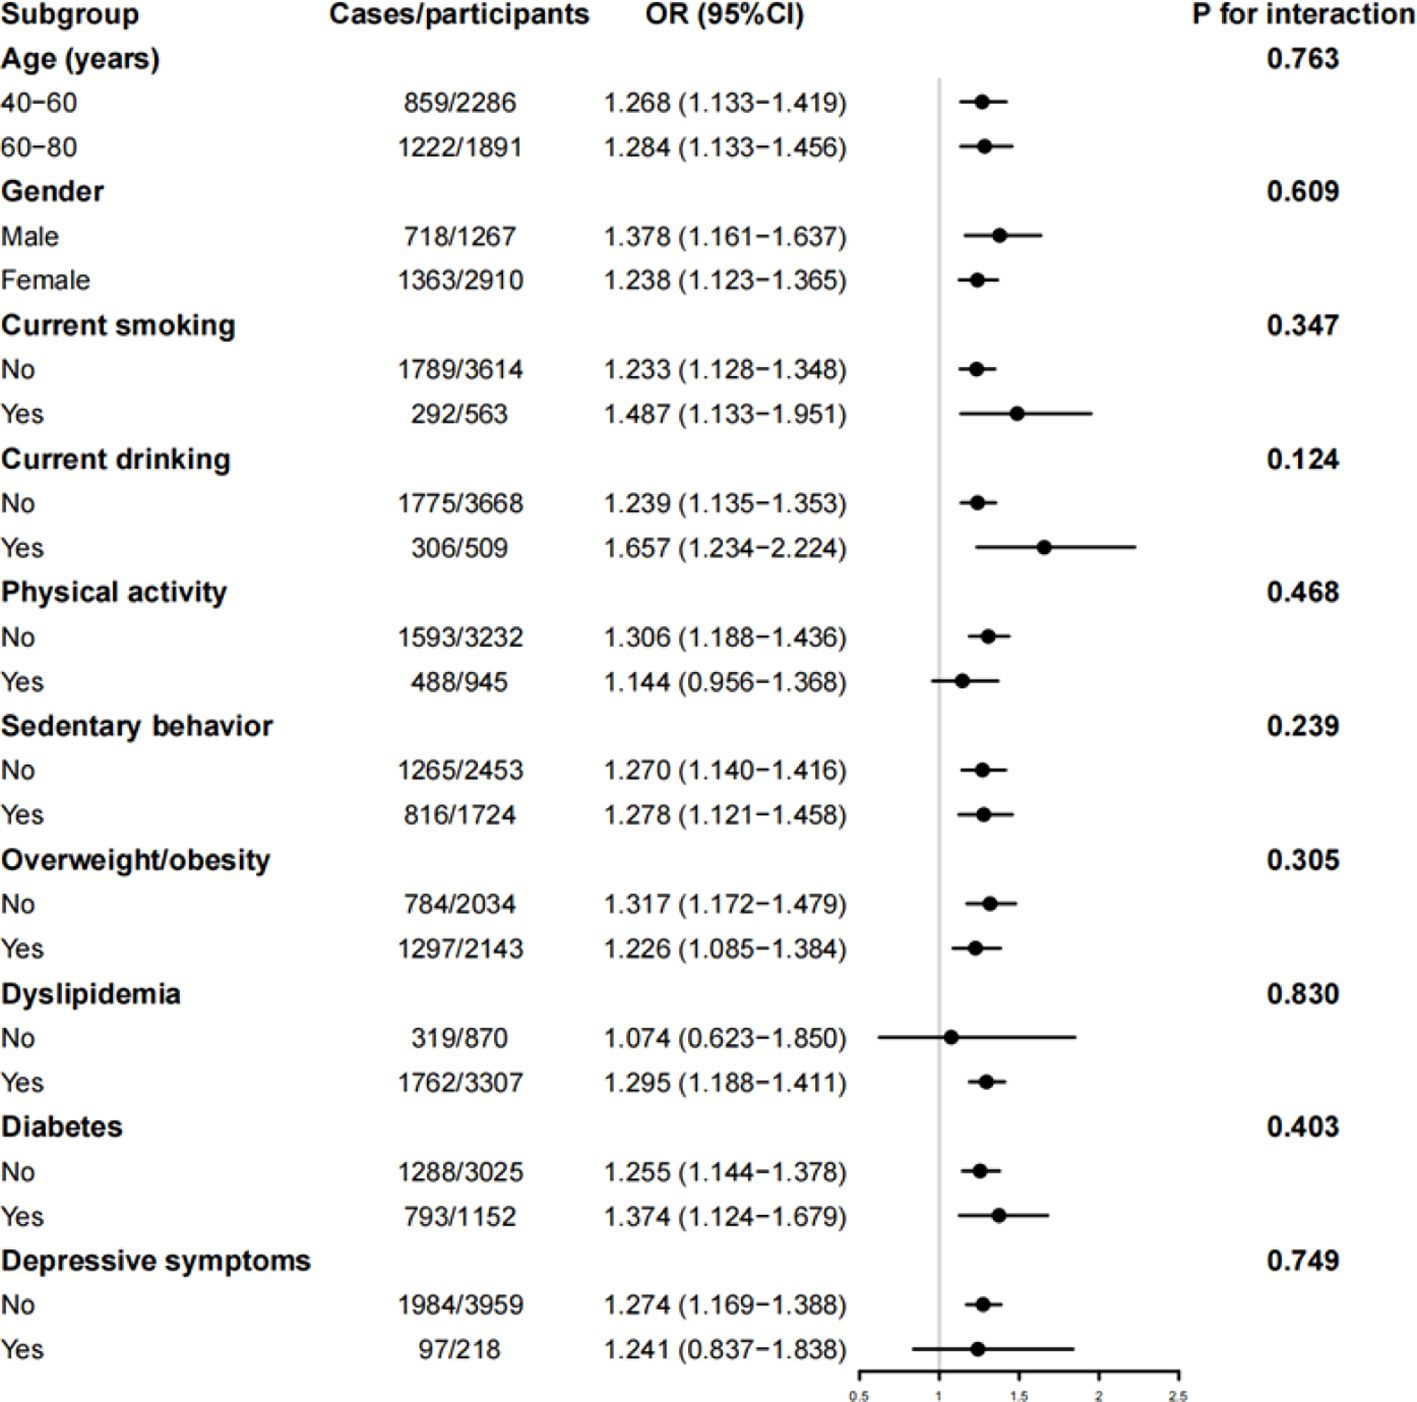
Figure 1. Subgroup analysis of the cross-sectional association between TyG index and hypertension. OR, odds ratio; 95% CI, 95% confidence interval. The model was adjusted for age, sex, education levels, current smoking, current drinking, physical activity, sedentary behavior, overweight/obesity, diabetes, dyslipidemia, and depressive symptoms.
The results of the sensitivity analyses in which we defined hypertension as SBP ≥ 130mmHg and (or) DBP ≥ 80mmHg showed that the positive association between the TyG index and hypertension was not remarkably changed (Supplementary Table S1). Additionally, the results remained largely unchanged when anti-hypertensive medications were included in the model adjustment. Compared to those in the lowest TyG quartile, the participants in the highest TyG quartile had higher odds of hypertension (OR:1.249, 95% CI:1.130-1.381, P<0.001). This association was more pronounced in ISH (OR:1.136, 95% CI:1.019-1.266, P=0.021) and SDH (OR:1.275, 95% CI:1.126-1.444, P<0.001) but was not significant in IDH (OR: 1.136, 95% CI:0.898-1.437, P=0.289) (Supplementary Table S1).
The flowchart of the literature selection is shown in Supplementary Figure S1. One eligible study included two independent cohorts, thus 18 cohorts (16, 17, 33–47) and 18 cross-sectional studies (48–64) (17 cross-sectional studies and our current study) were eligible. The pooling analyses of the 18 cohorts included 210,694 participants with a median age of 49.1 years and a median follow-up period of 6.0 years, while the meta-analysis of the cross-sectional studies included 810,839 participants with a median age of 51.4 years. All 18 cohorts were of high quality except for seven articles of moderate quality (37, 39, 41, 43, 44, 46, 47). Among the 18 cross-sectional studies, 16 were of high quality and two were of moderate quality (50, 54).
The meta-analytic results from the random-effects models are shown in Figure 2. Participants with the highest TyG index had a higher risk of hypertension compared with those with the lowest, both in the meta-analysis of cohort studies (HR:1.57, 95% CI:1.25-1.96, I2 = 97.1%), and in the meta-analysis of cross-sectional studies (OR:2.01, 95% CI:1.47-2.76, I2 = 99.4%).
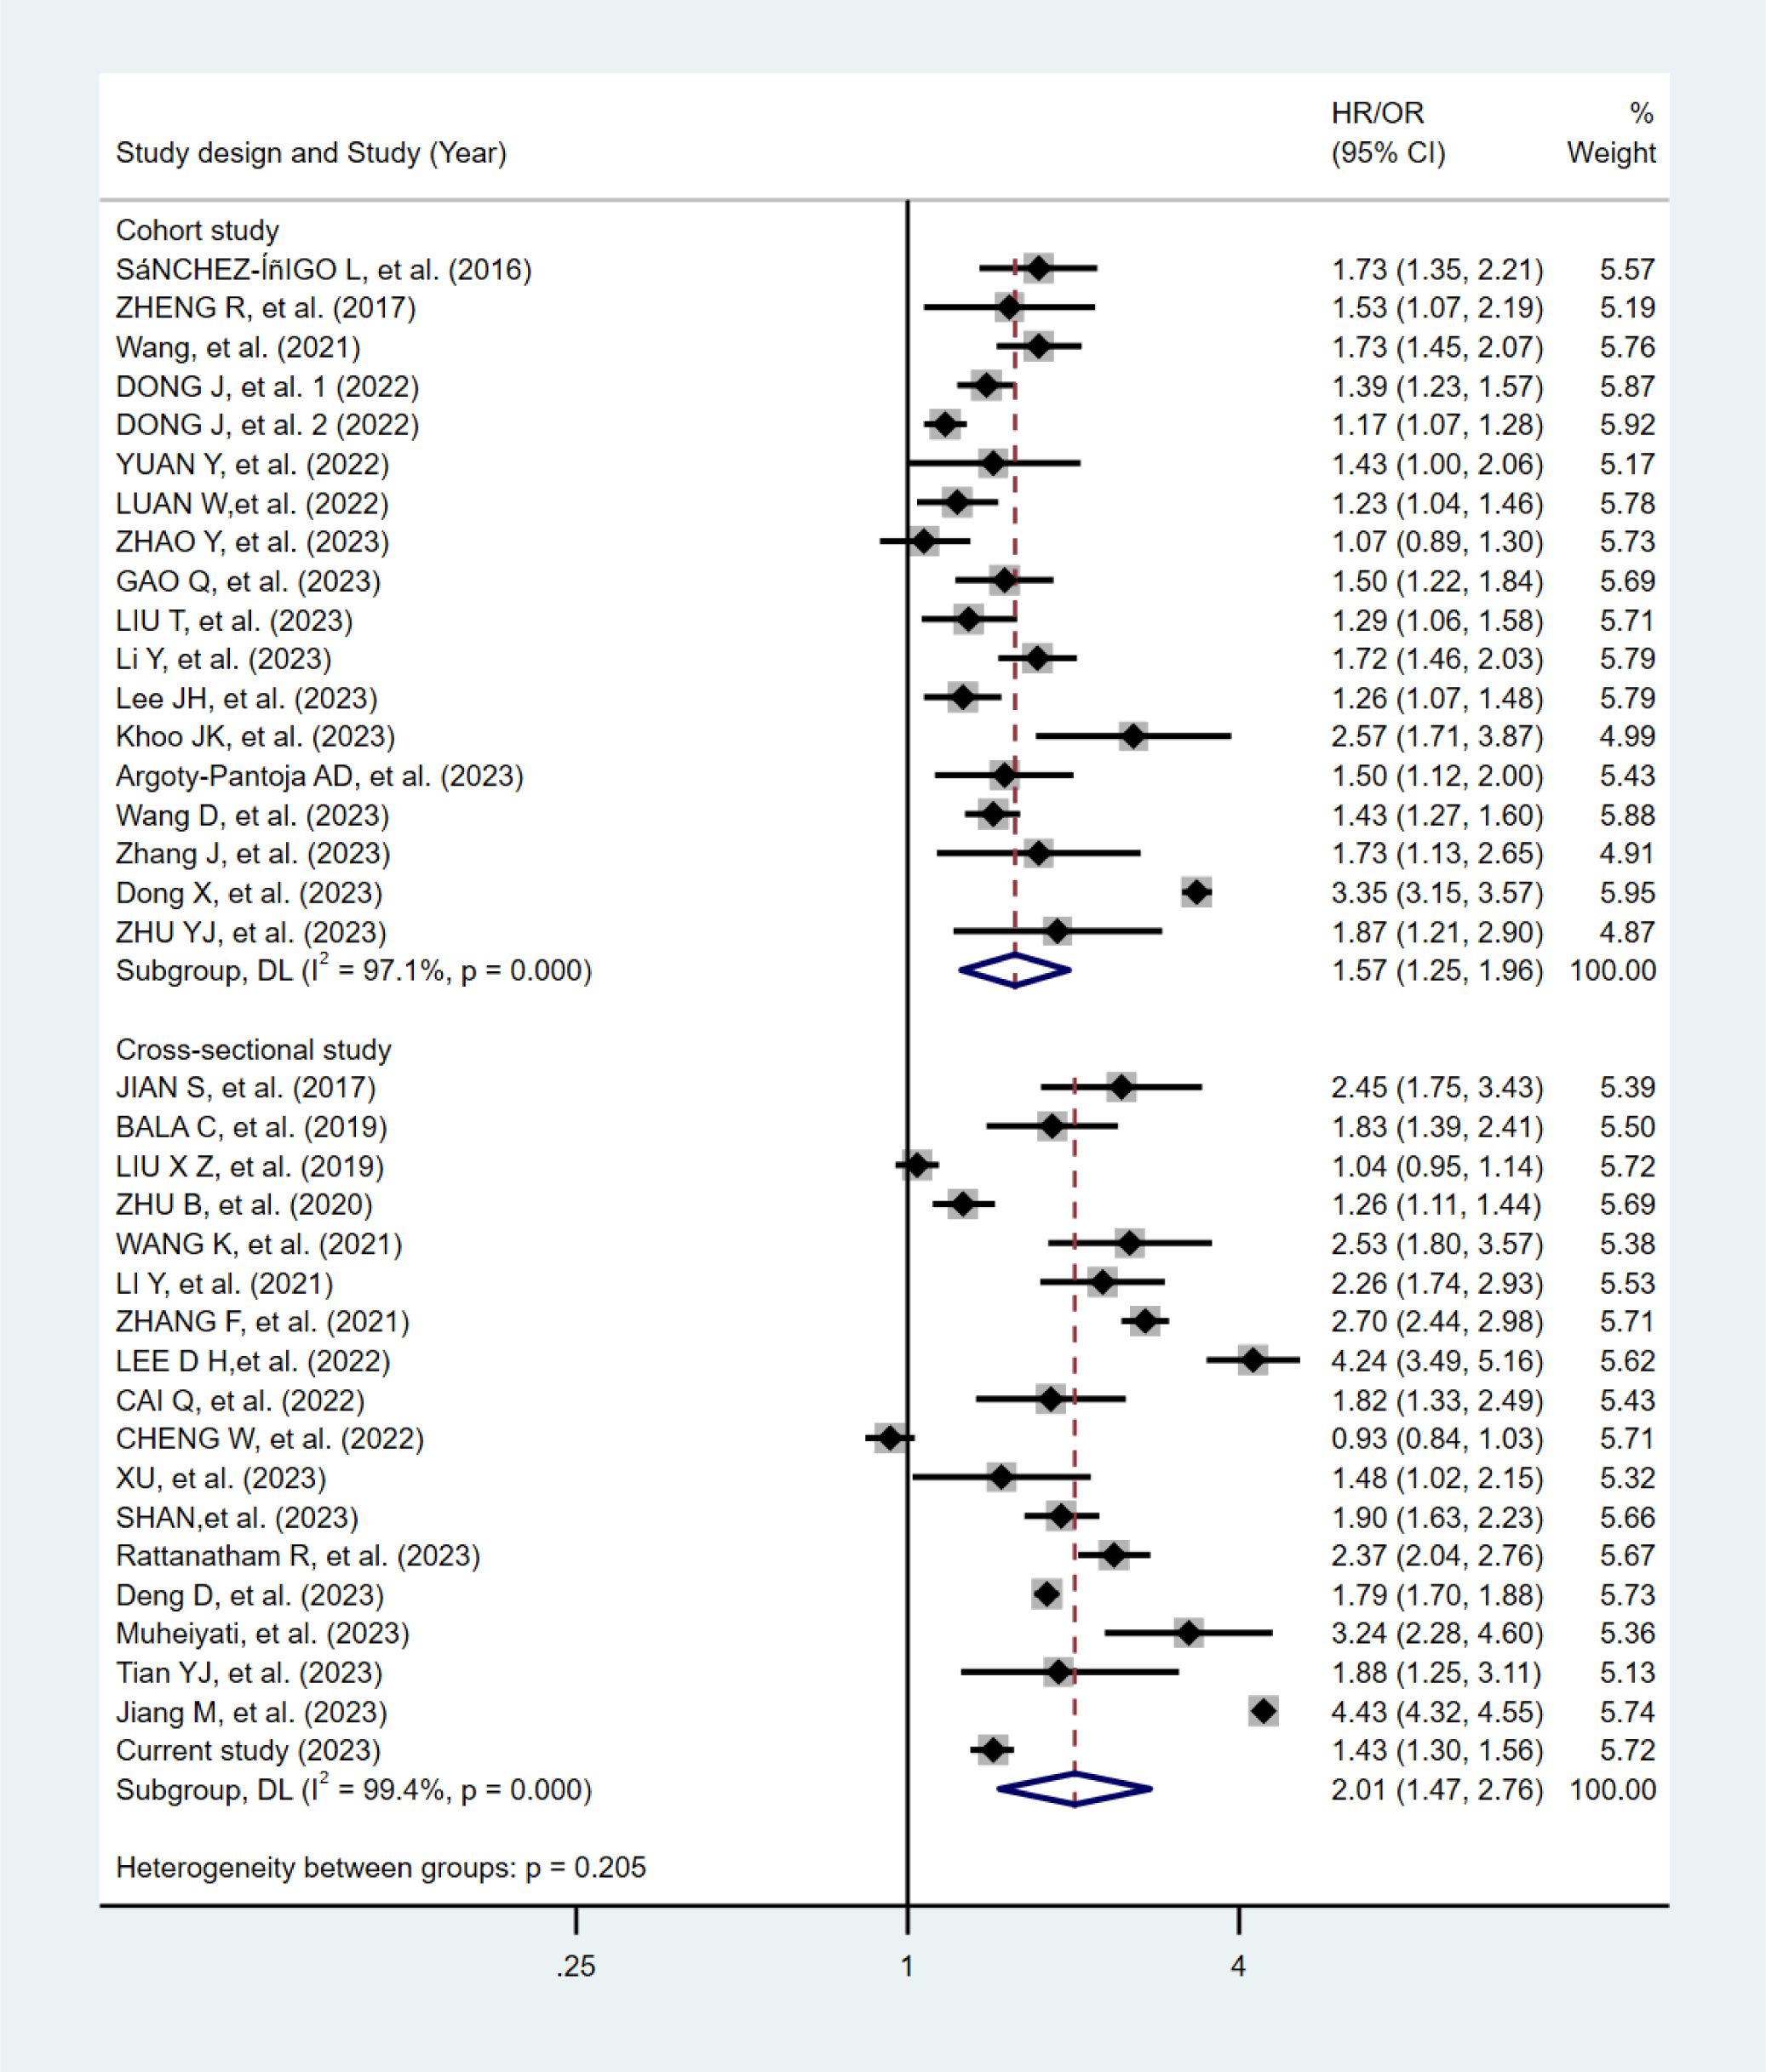
Figure 2. Forest plots of the association between the TyG index and hypertension in the meta-analysis.
In the sensitivity analyses after excluding one article at a time, the pooled association estimates did not significantly change (Supplementary Figures S2, S3). In the subgroup analyses, no significant interactions were observed both in the meta-analysis of the cohort studies (Supplementary Table S3) and cross-sectional studies (Supplementary Table S4). The meta-analytic findings from cohort studies had no potential publication bias in the visual funnel plots (Supplementary Figure S4), Egger’s test (Supplementary Figure S6), or Begg’s test (Supplementary Figure S8). In contrast, potential publication bias was observed in these assessments for the meta-analytic findings from cross-sectional studies (Supplementary Figures S5, S7, S9).
Our cross-sectional data demonstrated a significant positive association between the TyG index and hypertension in a middle-aged and elderly Chinese population, and this significant association was independent of age, sex, lifestyle factors, and concomitant diseases. The findings were also supported by current meta-analyses of prospective cohorts, which may strengthen the robustness of the inference of a causal association.
Our current findings were consistent with most of the previous population-based reports. A cross-sectional study involving 43,591 participants aged over 40 years old found that increases in the TyG index were more statistically associated with hypertension than blood lipids or glycemic parameters alone such as TC, TG, HDL-C, LDL-C, HbA1c, and 2hPG (51). This result was also seen in another cross-sectional study including 1,777 participants aged over 40 years old (48), and the TyG index was observed to be more associated with ISH, but not IDH. In support of these findings, this study demonstrated a positive association between the TyG index and hypertension, especially in ISH and SDH. In contrast, a recent study involving 21,670 Chinese adults aged 18-75 years old revealed a positive association with IDH only (55). The discrepancy between these observational studies may be explained by the age of the enrolled population. IDH is generally more prevalent among young adults (65), whereas ISH is prevalent in the middle-aged and elderly population (66). In our study of middle-aged and elderly Chinese patients, the number of IDH cases was limited, which may have led to the observation towards null. In additional analyses, the TyG index’s association with hypertension remained significant in most of the subgroups analyzed, suggesting that the observed association was independent of age, sex, lifestyle risk factors, and concomitant diseases. In addition, the results of sensitivity analyses in which we re-defined hypertension as SBP/DBP ≥ 130/80 mmHg, showed that the positive association between the TyG index and hypertension did not change, indicating the robustness of the TyG index in detecting high BP.
In the meta-analyses, available data from the observational studies were pooled and the directions for their summary association were consistent in both the cohort and cross-sectional studies, thereby reinforcing the observation obtained from the present cross-sectional analysis of Chinese adults. Moreover, the summary association estimates, as summarized in either the cohort or cross-sectional studies, had high heterogeneity at the statistical level but they remained significant in most of the subgroups and the results of a meta-regression analysis did not detect a significant interaction effect with age, sex, and obesity status on hypertension. Of note, when stratified by age, the TyG index was found to be pronounced with a high risk of hypertension in younger, middle-aged, and elderly persons. These summary findings from the pooling cohorts may not only further solidify the strength of epidemiological evidence at the causal-association level but also reinforce the consistency of this association across various age groups.
A series of mechanistic evidence to date likely to explain why hyperglycemia and dyslipidemia are potential risk factors that may trigger the development of high BP (5, 6). First, elevated levels of TG may partially lead to vascular endothelial dysfunction and oxidative stress, thereby leading to vascular remodeling signals that may be associated with elevated systolic and pulse pressure (67). Second, hypertriglyceridemia may cause hypercoagulability by promoting coagulation and inhibiting fibrinolysis, which increases blood viscosity and peripheral vascular resistance (68). Third, hyperglycemia may promote glucose and sodium reabsorption in the proximal convoluted tubules, thereby generating sodium retention and increased extracellular fluid (69). Finally, TyG, as a potential indicator for IR, may have in part prompted the development of hypertension through multiple biological mechanisms such as excessive activations of RAS and inflammatory response (10, 11).
Our study is the first to combine a population-based study with a meta-analysis and summarize relevant articles published worldwide, verifying the generalizability of the TyG index in predicting hypertension risk across different regions. However, there are several limitations in our study. First, our study of Chinese adults is a cross-sectional study, therefore causal inferences cannot be made. However, we performed a meta-analysis of cohort studies, in which the direction of the meta-analytic results was found to be consistent with the findings from our cross-sectional study. Second, our cross-sectional study was conducted in the middle-aged and elderly population only, thereby leading to a lack of representativeness of the whole population of Chinese adults. However, when stratified by age in the meta-analysis of the published cohort studies, the TyG index had a positive association with the risk of hypertension in younger, middle-aged, and older adults. Third, medical history was determined by participants’ self-report, which may have affected the results due to recall bias. Fourth, the association observed in the cross-sectional study may have been affected by other unknown confounders, therefore the present findings must be interpreted with caution. Fifth, the study population was restricted to individuals from Wenzhou. Blood pressure-related data were not collected during the 3rd-, 5th-, and 10th-year follow-ups in this region. In future follow-ups, we will strive to enhance data collection in this regard, aiming to provide more robust evidence for cohort studies. Finally, our current meta-analysis of prospective cohorts may partially or at least enhance the reliability of the observed findings, but there was high heterogeneity and potential publication bias in the pooling analysis of the published cross-sectional analyses. Therefore, the results of summarized evidence from prospective cohorts were warranted in the present study.
In conclusion, evidence from the current cross-sectional study and meta-analyses showed that participants with elevated TyG index levels had a high risk of hypertension, indicating that individuals with impaired glucose tolerance and/or lipid metabolism should be alert to incident hypertension, especially ISH and SDH. Such findings may provide strong support for the TyG index to be used as an independent indicator in screening hypertension risk in clinical cardiology practice.
The data are held in a secure, confidential database, which can only be assessed by members of the REACTION group. The data that support the findings of this study are available from the corresponding author upon reasonable request. Requests to access the datasets should be directed to XH, aHV4aWFuZ0B3bXUuZWR1LmNu.
The studies involving humans were approved by the Ruijin Hospital Ethics Committee, Shanghai Jiaotong University School of Medicine (201114RHEC). The studies were conducted in accordance with the local legislation and institutional requirements. The participants provided their written informed consent to participate in this study.
XR: Formal analysis, Writing – original draft, Writing – review & editing. MC: Formal analysis, Writing – original draft, Writing – review & editing. LL: Investigation, Data curation, Writing – review & editing. HX: Investigation, Data curation, Writing – review & editing. SG: Investigation, Data curation, Writing – review & editing. LY: Investigation, Data curation, Writing – review & editing. WC: Investigation, Data curation, Writing – review & editing. QJ: Investigation, Data curation, Writing – review & editing. XG: Supervision, Project administration, Funding acquisition, Writing – review & editing. BY: Supervision, Project administration, Funding acquisition, Writing – review & editing. XH: Conceptualization, Supervision, Project administration, Funding acquisition, Writing – review & editing.
The author(s) declare that financial support was received for the research, authorship, and/or publication of this article. This work was supported by a grant from the National Natural Science Foundation of China (81900737); the Basic Scientific Research Program of Wenzhou Medical University, China (KYYW202015); the 2017 Chinese Nutrition Society (CNS) Nutrition Research Foundation-DSM Research Fund (95017008); Scientific Technician Funding of Wenzhou Science and Technology Bureau (Y20240066); the Key Research and Development Program of Zhejiang (2021C03069); and the Natural Science Foundation of Zhejiang Province (LY20H070003).
The authors declare that the research was conducted in the absence of any commercial or financial relationships that could be construed as a potential conflict of interest.
The author(s) declare that no Generative AI was used in the creation of this manuscript.
All claims expressed in this article are solely those of the authors and do not necessarily represent those of their affiliated organizations, or those of the publisher, the editors and the reviewers. Any product that may be evaluated in this article, or claim that may be made by its manufacturer, is not guaranteed or endorsed by the publisher.
The Supplementary Material for this article can be found online at: https://www.frontiersin.org/articles/10.3389/fendo.2025.1516328/full#supplementary-material
1. Whelton PK, Carey RM, Aronow WS, Casey DE Jr., Collins KJ, Dennison Himmelfarb C, et al. 2017 ACC/AHA/AAPA/ABC/ACPM/AGS/APhA/ASH/ASPC/NMA/PCNA guideline for the prevention, detection, evaluation, and management of high blood pressure in adults: A report of the american college of cardiology/american heart association task force on clinical practice guidelines. Hypertension. (2018) 71:e13–e115. doi: 10.1161/hyp.0000000000000065
2. van Kleef ME, Spiering W. Hypertension: Overly important but under-controlled. Eur J Prev Cardiol. (2017) 24:36–43. doi: 10.1177/2047487317709116
3. Lu J, Lu Y, Wang X, Li X, Linderman GC, Wu C, et al. Prevalence, awareness, treatment, and control of hypertension in China: data from 1·7 million adults in a population-based screening study (China PEACE Million Persons Project). Lancet. (2017) 390:2549–58. doi: 10.1016/s0140-6736(17)32478-9
4. Li W, Gu H, Teo KK, Bo J, Wang Y, Yang J, et al. Hypertension prevalence, awareness, treatment, and control in 115 rural and urban communities involving 47 000 people from China. J Hypertens. (2016) 34:39–46. doi: 10.1097/hjh.0000000000000745
5. Yan Q, Sun D, Li X, Chen G, Zheng Q, Li L, et al. Association of blood glucose level and hypertension in Elderly Chinese Subjects: a community based study. BMC Endocr Disord. (2016) 16:40. doi: 10.1186/s12902-016-0119-5
6. Tohidi M, Hatami M, Hadaegh F, Azizi F. Triglycerides and triglycerides to high-density lipoprotein cholesterol ratio are strong predictors of incident hypertension in Middle Eastern women. J Hum Hypertens. (2012) 26:525–32. doi: 10.1038/jhh.2011.70
7. Soleimani M. Insulin resistance and hypertension: new insights. Kidney Int. (2015) 87:497–9. doi: 10.1038/ki.2014.392
8. Tian X, Zuo Y, Chen S, Liu Q, Tao B, Wu S, et al. Triglyceride-glucose index is associated with the risk of myocardial infarction: an 11-year prospective study in the Kailuan cohort. Cardiovasc Diabetol. (2021) 20:19. doi: 10.1186/s12933-020-01210-5
9. Olsen MH, Andersen UB, Wachtell K, Ibsen H, Dige-Petersen H. A possible link between endothelial dysfunction and insulin resistance in hypertension. A LIFE substudy. Losartan Intervention For Endpoint-Reduction in Hypertension. Blood Press. (2000) 9:132–9. doi: 10.1080/080370500453474
10. Zhou MS, Wang A, Yu H. Link between insulin resistance and hypertension: What is the evidence from evolutionary biology? Diabetol Metab Syndr. (2014) 6:12. doi: 10.1186/1758-5996-6-12
11. Underwood PC, Adler GK. The renin angiotensin aldosterone system and insulin resistance in humans. Curr Hypertens Rep. (2013) 15:59–70. doi: 10.1007/s11906-012-0323-2
12. Bloomgarden ZT. Measures of insulin sensitivity. Clin Lab Med. (2006) 26:611–33. doi: 10.1016/j.cll.2006.06.007
13. Tahapary DL, Pratisthita LB, Fitri NA, Marcella C, Wafa S, Kurniawan F, et al. Challenges in the diagnosis of insulin resistance: Focusing on the role of HOMA-IR and Tryglyceride/glucose index. Diabetes Metab Syndr. (2022) 16:102581. doi: 10.1016/j.dsx.2022.102581
14. Guerrero-Romero F, Simental-Mendía LE, González-Ortiz M, Martínez-Abundis E, Ramos-Zavala MG, Hernández-González SO, et al. The product of triglycerides and glucose, a simple measure of insulin sensitivity. Comparison with the euglycemic-hyperinsulinemic clamp. J Clin Endocrinol Metab. (2010) 95:3347–51. doi: 10.1210/jc.2010-0288
15. Nabipoorashrafi SA, Seyedi SA, Rabizadeh S, Ebrahimi M, Ranjbar SA, Reyhan SK, et al. The accuracy of triglyceride-glucose (TyG) index for the screening of metabolic syndrome in adults: A systematic review and meta-analysis. Nutr Metab Cardiovasc Dis. (2022) 32:2677–88. doi: 10.1016/j.numecd.2022.07.024
16. Zhao Y, Yang X, Wu Y, Huang H, Hu F, Zhang M, et al. Association of triglyceride-glucose index and its 6-year change with risk of hypertension: A prospective cohort study. Nutr Metab Cardiovasc Dis. (2023) 33:568–76. doi: 10.1016/j.numecd.2022.12.001
17. Yuan Y, Sun W, Kong X. Comparison between distinct insulin resistance indices in measuring the development of hypertension: The China Health and Nutrition Survey. Front Cardiovasc Med. (2022) 9:912197. doi: 10.3389/fcvm.2022.912197
18. Wang Y, Yang W, Jiang X. Association between triglyceride-glucose index and hypertension: A meta-analysis. Front Cardiovasc Med. (2021) 8:644035. doi: 10.3389/fcvm.2021.644035
19. Xu AR, Jin Q, Shen Z, Zhang J, Fu Q. Association between the risk of hypertension and triglyceride glucose index in Chinese regions: a systematic review and dose-response meta-analysis of a regional update. Front Cardiovasc Med. (2023) 10:1242035. doi: 10.3389/fcvm.2023.1242035
20. Bi Y, Lu J, Wang W, Mu Y, Zhao J, Liu C, et al. Cohort profile: risk evaluation of cancers in Chinese diabetic individuals: a longitudinal (REACTION) study. J Diabetes. (2014) 6:147–57. doi: 10.1111/1753-0407.12108
21. Hu X, Yu W, Yang L, Pan W, Xu K, Chen X, et al. First-degree family history of diabetes is associated with nonalcoholic fatty liver disease independent of glucose metabolic status. J Diabetes Complications. (2022) 36:108083. doi: 10.1016/j.jdiacomp.2021.108083
22. Simental-Mendía LE, Rodríguez-Morán M, Guerrero-Romero F. The product of fasting glucose and triglycerides as surrogate for identifying insulin resistance in apparently healthy subjects. Metab Syndr Relat Disord. (2008) 6:299–304. doi: 10.1089/met.2008.0034
23. Kjeldsen SE, Farsang C, Sleigh P, Mancia G. 1999 WHO/ISH hypertension guidelines–highlights and esh update. J Hypertens. (2001) 19:2285–8. doi: 10.1097/00004872-200112000-00026
24. Williams B, Mancia G, Spiering W, Agabiti Rosei E, Azizi M, Burnier M, et al. 2018 ESC/ESH Guidelines for the management of arterial hypertension. Eur Heart J. (2018) 39:3021–104. doi: 10.1093/eurheartj/ehy339
25. Zhou BF. Predictive values of body mass index and waist circumference for risk factors of certain related diseases in Chinese adults–study on optimal cut-off points of body mass index and waist circumference in Chinese adults. BioMed Environ Sci. (2002) 15:83–96.
26. Alberti KG, Zimmet PZ. Definition, diagnosis and classification of diabetes mellitus and its complications. Part 1: diagnosis and classification of diabetes mellitus provisional report of a WHO consultation. Diabetes Med. (1998) 15:539–53. doi: 10.1002/(SICI)1096-9136(199807)15:7<539::AID-DIA668>3.0.CO;2-S
27. Zhu JGR, Zhao S, Lu G, Zhao D, Li J. Chinese Guidelines for the prevention and treatment of dyslipidemia in adults (2016 revision). Chin J Cardiol. (2016) 31:937–53.
28. Levis B, Benedetti A, Thombs BD. Accuracy of Patient Health Questionnaire-9 (PHQ-9) for screening to detect major depression: individual participant data meta-analysis. BMJ. (2019) 365:l1476. doi: 10.1136/bmj.l1476
29. Stang A. Critical evaluation of the Newcastle-Ottawa scale for the assessment of the quality of nonrandomized studies in meta-analyses. Eur J Epidemiol. (2010) 25:603–5. doi: 10.1007/s10654-010-9491-z
30. Higgins JP, Thompson SG. Quantifying heterogeneity in a meta-analysis. Stat Med. (2002) 21:1539–58. doi: 10.1002/sim.1186
31. Patsopoulos NA, Evangelou E, Ioannidis JP. Sensitivity of between-study heterogeneity in meta-analysis: proposed metrics and empirical evaluation. Int J Epidemiol. (2008) 37:1148–57. doi: 10.1093/ije/dyn065
32. Egger M, Davey Smith G, Schneider M, Minder C. Bias in meta-analysis detected by a simple, graphical test. Bmj. (1997) 315:629–34. doi: 10.1136/bmj.315.7109.629
33. Gao Q, Lin Y, Xu R, Luo F, Chen R, Li P, et al. Positive association of triglyceride-glucose index with new-onset hype rtension among adults: a national cohort study in China. Cardiovasc Diabetol. (2023) 22(1):58. doi: 10.1186/s12933-023-01795-7
34. Liu T, Xuan H, Yin J, Wang L, Wang C, Xu X, et al. Triglyceride glucose index increases significantly risk of hypertensio n development in chinese individuals aged ≥45 years old: analysis from the China health and retirement longitudinal study. J Multidiscip Healthc. (2023) 16:63–73. doi: 10.2147/JMDH.S391905
35. Zheng R, Mao Y. Triglyceride and glucose (TyG) index as a predictor of incident hypert ension: a 9-year longitudinal population-based study. Lipids Health Dis. (2017) 16(1):175. doi: 10.1186/s12944-017-0562-y
36. Sánchez-Íñigo L, Navarro-González D, Pastrana-Delgado J, Fernández-Montero A, Martínez JA. Association of triglycerides and new lipid markers with the incidence of hypertension in a Spanish cohort. J Hypertens. (2016) 34:1257–65. doi: 10.1097/hjh.0000000000000941
37. Wang RN, Zhang DS, Bai Z, Yin C, Zhang R, Yang JL, et al. Prospective cohort study of relationship of triglyceride, fasting blood-glucose and triglyceride glucose product index with risk of hypertension. Zhonghua Liu Xing Bing Xue Za Zhi. (2021) 42:482–7. doi: 10.3760/cma.j.cn112338-20200401-00491
38. Dong J, Liu YH, Lu YK, Hu LK, Chen N, Ma LL, et al. Association between surrogate indicators of insulin resistance and risk of type 2 diabetes combined with hypertension among Chinese adults: two independent cohort studies. Nutr Metab (Lond). (2022) 19:85. doi: 10.1186/s12986-022-00720-1
39. Li Y, Gui J, Zhang X, Wang Y, Mei Y, Yang X, et al. Predicting hypertension by obesity- and lipid-related indices in mid-aged and elderly Chinese: a nationwide cohort study from the China Health and Retirement Longitudinal Study. BMC Cardiovasc Disord. (2023) 23:201. doi: 10.1186/s12872-023-03232-9
40. Lee JH, Heo SJ, Kwon YJ. Sex-specific comparison between triglyceride glucose index and modified triglyceride glucose indices to predict new-onset hypertension in middle-aged and older adults. J Am Heart Assoc. (2023) 12:e030022. doi: 10.1161/jaha.123.030022
41. Argoty-Pantoja AD, Velázquez-Cruz R, Meneses-León J, Salmerón J, Rivera-Paredez B. Triglyceride-glucose index is associated with hypertension incidence up to 13 years of follow-up in mexican adults. Lipids Health Dis. (2023) 22:162. doi: 10.1186/s12944-023-01925-w
42. Wang D, Li W, Zhou M, Ma J, Guo Y, Yuan J, et al. Association of the triglyceride-glucose index variability with blood pressure and hypertension: a cohort study. Qjm. (2023) 12;117(4):277–82. doi: 10.1093/qjmed/hcad252
43. Zhang J, Wang R, Liu Q, Song G, Tang X. Association of triglyceride-glucose index with incident hypertension among non-overweight healthy adults: A cohort study in China. Nutr Metab Cardiovasc Dis. (2023) 33:1057–65. doi: 10.1016/j.numecd.2023.02.014
44. Dong X, Han B, Huang W, Song Z, Huang N, Zhao Y, et al. Association of TyG index with hypertension in Chinese adults: the China Health Examination Collaborative Study (CHEC Study). Asia Pac J Clin Nutr. (2023) 32:362–73. doi: 10.6133/apjcn.202309_32(3).0008
45. Luan W, Wang J, Zhao F, Zhou J, Zhou Y, Yu L, et al. A cohort study of relationship between triglyceride glucose product index and hypertension risk. Chin J Prev Control Chronic Dis. (2022) 30:731–5. doi: 10.16386/j.cjpccd.issn.1004-6194.2022.10.003
46. Zhu Y, Liu A. Longitudinal cohort study of the association of triglyceride-glucose index with hypertension among teachers from a university. Chin Gen Pract. (2022) 25:461–6.
47. Khoo JK, Low S, Irwan B, Tang JI, Sum CF, Subramaniam T, et al. The role of triglyceride-glucose index in the prediction of the development of hypertension - findings from a community cohort in Singapore. J ASEAN Fed Endocr Soc. (2023) 38:62–7. doi: 10.15605/jafes.038.01.09
48. Jian S, Su-Mei N, Xue C, Jie Z, Xue-Sen W. Association and interaction between triglyceride-glucose index and obesity on risk of hypertension in middle-aged and elderly adults. Clin Exp Hypertens. (2017) 39:732–9. doi: 10.1080/10641963.2017.1324477
49. Bala C, Gheorghe-Fronea O, Pop D, Pop C, Caloian B, Comsa H, et al. The association between six surrogate insulin resistance indexes and hypertension: A population-based study. Metab Syndr Relat Disord. (2019) 17:328–33. doi: 10.1089/met.2018.0122
50. Liu XZ, Fan J, Pan SJ. METS-IR, a novel simple insulin resistance indexes, is associated with hypertension in normal-weight Chinese adults. J Clin Hypertens (Greenwich). (2019) 21:1075–81. doi: 10.1111/jch.13591
51. Zhu B, Wang J, Chen K, Yan W, Wang A, Wang W, et al. A high triglyceride glucose index is more closely associated with hypertension than lipid or glycemic parameters in elderly individuals: a cross-sectional survey from the Reaction Study. Cardiovasc Diabetol. (2020) 19:112. doi: 10.1186/s12933-020-01077-6
52. Li Y, You A, Tomlinson B, Yue L, Zhao K, Fan H, et al. Insulin resistance surrogates predict hypertension plus hyperuricemia. J Diabetes Investig. (2021) 12:2046–53. doi: 10.1111/jdi.13573
53. Wang K, He G, Zhang Y, Yin J, Yan Y, Zhang Y, et al. Association of triglyceride-glucose index and its interaction with obesity on hypertension risk in Chinese: a population-based study. J Hum Hypertens. (2021) 35:232–9. doi: 10.1038/s41371-020-0326-4
54. Zhang F, Zhang Y, Guo Z, Yang H, Ren M, Xing X, et al. The association of triglyceride and glucose index, and triglyceride to high-density lipoprotein cholesterol ratio with prehypertension and hypertension in normoglycemic subjects: A large cross-sectional population study. J Clin Hypertens (Greenwich). (2021) 23:1405–12. doi: 10.1111/jch.14305
55. Cai Q, Xing CY, Zhu J, Wang Y, Lu F, Peng J. Associations between triglyceride-glucose index and different hypertension subtypes: A population-based study in China. Front Cardiovasc Med. (2022) 9:901180. doi: 10.3389/fcvm.2022.901180
56. Cheng W, Kong F, Chen S. Comparison of the predictive value of four insulin resistance surrogates for the prevalence of hypertension: a population-based study. Diabetol Metab Syndr. (2022) 14:137. doi: 10.1186/s13098-022-00907-9
57. Lee DH, Park JE, Kim SY, Jeon HJ, Park JH. Association between the triglyceride-glucose (TyG) index and increased blood pressure in normotensive subjects: a population-based study. Diabetol Metab Syndr. (2022) 14:161. doi: 10.1186/s13098-022-00927-5
58. Xu J, Xu W, Chen G, Hu Q, Jiang J. Association of TyG index with prehypertension or hypertension: a retrospective study in Japanese normoglycemia subjects. Front Endocrinol (Lausanne). (2023) 14:1288693. doi: 10.3389/fendo.2023.1288693
59. Rattanatham R, Tangpong J, Chatatikun M, Sun D, Kawakami F, Imai M, et al. Assessment of eight insulin resistance surrogate indexes for predicting metabolic syndrome and hypertension in Thai law enforcement officers. PeerJ. (2023) 11:e15463. doi: 10.7717/peerj.15463
60. Deng D, Chen C, Wang J, Luo S, Feng Y. Association between triglyceride glucose-body mass index and hypertension in Chinese adults: A cross-sectional study. J Clin Hypertens (Greenwich). (2023) 25:370–9. doi: 10.1111/jch.14652
61. Muheiyati G, Mei Y, Tao N. Relationship between blood lipid level and hypertension in Xinjiang oil workers based on restricted cubic spline model. CJDCP. (2023) 27:392–8. doi: 10.16462/j.cnki.zhjbkz.2023.04.004
62. Jiang M, Li X, Wu H, Su F, Cao L, Ren X, et al. Triglyceride-glucose index for the diagnosis of metabolic syndrome: A cross-sectional study of 298,652 individuals receiving a health check-up in China. Int J Endocrinol. (2022) 2022:3583603. doi: 10.1155/2022/3583603
63. Shan S, Li S, Lu K, Cao J, Sun W, Zhou J, et al. Associations of the triglyceride and glucose index with hypertension stages, phenotypes, and their progressions among middle-aged and older chinese. Int J Public Health. (2023) 68:1605648. doi: 10.3389/ijph.2023.1605648
64. Tian Y, Wu G, Wu Y, Yu L, Zhao X, Bao H. Triglyceride-glucose index and obesity interactions in Mongolian hypertensive patients. Chin J Hypertens. (2023) 31:78–84. doi: 10.16439/j.issn.1673-7245.2023.01.015
65. Franklin SS, Pio JR, Wong ND, Larson MG, Leip EP, Vasan RS, et al. Predictors of new-onset diastolic and systolic hypertension: the Framingham Heart Study. Circulation. (2005) 111:1121–7. doi: 10.1161/01.Cir.0000157159.39889.Ec
66. Chobanian AV. Clinical practice. Isolated systolic hypertension in the elderly. N Engl J Med. (2007) 357:789–96. doi: 10.1056/NEJMcp071137
67. Sun Z. Aging, arterial stiffness, and hypertension. Hypertension. (2015) 65:252–6. doi: 10.1161/hypertensionaha.114.03617
68. Godsland IF, Crook D, Walton C, Wynn V, Oliver MF. Influence of insulin resistance, secretion, and clearance on serum cholesterol, triglycerides, lipoprotein cholesterol, and blood pressure in healthy men. Arterioscler Thromb. (1992) 12:1030–5. doi: 10.1161/01.atv.12.9.1030
Keywords: hypertension, triglyceride-glucose index, insulin resistance, meta-analysis, cross-sectional analysis
Citation: Ren X, Chen M, Lian L, Xia H, Chen W, Ge S, Yang L, Jiang Q, Gu X, Yang B and Hu X (2025) The triglyceride-glucose index is associated with a higher risk of hypertension: evidence from a cross-sectional study of Chinese adults and meta-analysis of epidemiology studies. Front. Endocrinol. 16:1516328. doi: 10.3389/fendo.2025.1516328
Received: 24 October 2024; Accepted: 21 January 2025;
Published: 24 February 2025.
Edited by:
Åke Sjöholm, Gävle Hospital, SwedenReviewed by:
Adriyan Pramono, Diponegoro University, IndonesiaCopyright © 2025 Ren, Chen, Lian, Xia, Chen, Ge, Yang, Jiang, Gu, Yang and Hu. This is an open-access article distributed under the terms of the Creative Commons Attribution License (CC BY). The use, distribution or reproduction in other forums is permitted, provided the original author(s) and the copyright owner(s) are credited and that the original publication in this journal is cited, in accordance with accepted academic practice. No use, distribution or reproduction is permitted which does not comply with these terms.
*Correspondence: Xuejiang Gu, Z3V4dWVqaWFuZ0B3bXUuZWR1LmNu; Bo Yang, eWJAd211LmVkdS5jbg==; Xiang Hu, aHV4aWFuZ0B3bXUuZWR1LmNu
†These authors have contributed equally to this work
Disclaimer: All claims expressed in this article are solely those of the authors and do not necessarily represent those of their affiliated organizations, or those of the publisher, the editors and the reviewers. Any product that may be evaluated in this article or claim that may be made by its manufacturer is not guaranteed or endorsed by the publisher.
Research integrity at Frontiers
Learn more about the work of our research integrity team to safeguard the quality of each article we publish.