 I-Wen Chen
 Cheng-Wei Lin
 Chia-Ni Lin
 Szu-Tah Chen
94% of researchers rate our articles as excellent or good
Learn more about the work of our research integrity team to safeguard the quality of each article we publish.
Find out more
ORIGINAL RESEARCH article
Front. Endocrinol. , 07 February 2025
Sec. Clinical Diabetes
Volume 16 - 2025 | https://doi.org/10.3389/fendo.2025.1511730
This article is part of the Research Topic Advances in Diabetes and Hypertension Research View all 7 articles
Background: To investigate the value of serum adropin in predicting chronic kidney disease (CKD) progression in subjects with type 2 diabetes (T2D).
Materials and methods: Serum adropin levels were measured in normal control and T2D patients with various stage of CKD. CKD progression was defined as ≥ 30% decline from the baseline estimated glomerular filtration rate. Logistic regression analysis was applied to assess the association between adropin levels and CKD progression.
Results: The study included 58 subjects with T2D (18 early CKD and 40 advanced CKD) and 9 subjects without diabetes (control). Subjects with T2D had significantly higher adropin levels than controls (6393.10 ± 1611.84 vs. 3470.30 ± 1284.41 pg/ml; P < 0.001). Meanwhile, T2D patients with advanced CKD had higher adropin levels than those with early CKD (6848.89 ± 1287.04 vs. 5380.25 ± 1826.44 pg/ml; P = 0.003). Among T2D patients, subjects experienced CKD progression had higher adropin levels than those without (7520.15 ± 843.21 vs. 6151.16 ± 1661.61 pg/mL, P =0.003). Thus, adropin predicts CKD progression in T2D patients with 86% sensitivity and 70% specificity at 6872.24 pg/ml cutoff value. The association with CKD progression was still significant after adjusting for age, gender and body mass index (adjusted odds ratio = 27.188, 95% confidence interval 1.415-522.527, P =0.029).
Conclusions: The above findings suggest that serum adropin could be applied as a potential biomarker for predicting CKD progression in subjects with T2D. Further research is needed to validate these results and explore the underlying mechanisms.
Diabetic nephropathy is a worldwide-leading cause of end-stage kidney disease resulting in dialysis or renal transplantation in about 20–40% of patients with diabetes patients (1). Additionally, such patients with diabetic kidney disease (DKD) might also have exceptionally high rates of cardiovascular morbidity and mortality (2); furthermore, along with glycemic control, the renin-angiotensin-aldosterone system (RAAS) has also been shown as associated with the progression of DKD, promising advancements in chronic kidney disease (CKD) management in type 2 diabetes mellitus (T2D) including angiotensin-converting enzyme inhibitors (ACEi), angiotensin II receptor blockers (ARB), sodium-glucose cotransporter-2 inhibitors (SGLT2i), and nonsteroidal mineralocorticoid receptor antagonists (MRA).
Microalbuminuria is considered an important predictor of progression to proteinuria or nephropathy; however, its usefulness for early detection and monitoring of CKD progression is limited (3, 4). In certain cases, such as in patients with T2D, CKD can be observed even in the absence of albumin excretion, indicating that albuminuria alone is inadequate for monitoring diabetic nephropathy (3). This inconsistency has been documented in studies showing normal renal function in patients with microalbuminuria, while those with normoalbuminuria have renal disorders (5, 6). These findings highlight the limitations of using albuminuria or serum creatinine alone as early indicators of renal dysfunction; therefore, novel biomarker potential for early detection of patients in risk for CKD progression is warranted.
Adropin is a newly identified peptide hormone expressed in the liver and brain, and has been implicated in processes such as energy homeostasis and lipid metabolism (7). Demographic factors such as gender, age and body mass index (BMI) might affect the serum levels of adropin (8). Observation studies have reported decreased adropin levels in patients with obesity, metabolic syndrome, and type 2 diabetes, suggesting the correlation of adropin and insulin resistance (9); indeed, treatment with adropin lowered blood glucose levels and improved insulin resistance in type 2 diabetic animal models (10). Interestingly, conflicting serum adropin levels have been reported in some patients with T2D (11, 12) lead to the role of adropin plays in diabetes becoming much more complex as previously assumed.
In addition to its expression in the liver and brain, adropin has also been detected in the kidney, including glomeruli, peritubular interstitial cells, and peritubular capillary endothelial cells (13). Interestingly, adropin immunoreaction was enhanced in the kidney of streptozotocin (STZ)-induced diabetic rats compared with the controls (13); and subsequently, adropin was found to reduce the expression levels of inflammatory markers like tumor necrosis factor-alpha (TNF-α) and interleukin 6 (IL-6) in diabetic rats (10). On considering that inflammation plays important roles in the development of diabetic nephropathy, these findings suggest that adropin could exert a protective effect against the development of diabetic nephropathy through its anti-inflammatory actions; accordingly, given the evidence presented, this study aimed to examine serum adropin levels in subjects with diabetes at various stage of CKD and explore the potential application of adropin levels as an adjuvant indicator of CKD progression in individuals with T2D.
We enrolled subjects with T2D being regularly followed-up at the Chang-Gung Memorial Hospital (CGMH), a tertiary hospital in Northern Taiwan, since September 2021. The diagnosis of T2D fulfilled the American Diabetic Association (ADA) criteria and all patients received antidiabetic drugs to control hyperglycemia. Subjects with type 1 diabetes, severe cardiovascular diseases, malignant diseases, acute infection, hepatic or endocrine diseases were excluded. The non-diabetic controls enrolled from the same clinic were supervised by the endocrinologists and assured to have normal blood glucose and no history of diabetes. This study was conducted in accordance with the Declaration of Helsinki and was approved by the Ethics Committee on Research of the Institutional Review Board (IRB approval number: 201900988B0) of CGMH. Informed consents were obtained from all participants with their full appreciations of the study.
Clinical information including age, gender and the date of diagnosis as well as laboratory data (serum hemoglobin, hematocrit, creatinine, glycated hemoglobin (HbA1c), sodium, potassium, osmolality, urine osmolality, urine creatinine, urine sodium, and urine albumin creatinine ratio) were collected. Participants were followed-up until May 31st, 2023, and the primary outcome (endpoint) was CKD progression, being a decline of eGFR at least 30% from the baseline accordingly (14).
The estimated glomerular filtration rate (eGFR) was calculated using the Modification of Diet in Renal Disease (MDRD): i.e. 175 x serum creatinine (exp[-1.154]) x age (exp[0.203] x (0.742 if female) (15). We manually measured spot urinary albumin creatinine ratio (UACR) by dividing spot urinary albumin to urinary creatinine, with results were expressed in mg/g to meet the standard guidelines. According to the Kidney Disease Improving Global Outcomes (KDIGO) guidelines, individuals at risk category of CKD were classified into five eGFR and three albuminuria categories (1). The eGFR categories were defined as follows: grade 1: eGFR > 90 mL/min/1.73 m2; grade 2: 60 mL/min/1.73 m2< eGFR <90 mL/min/1.73 m2; grade 3: 30 mL/min/1.73 m2≤ eGFR <60 mL/min/1.73 m2; grade 4: 15 mL/min/1.73 m2 ≤ eGFR<30 mL/min/1.73 m2 and grade 5: eGFR < 15 mL/min/1.73 m2. Advanced chronic kidney disease (CKD) was defined as having an estimated glomerular filtration rate (eGFR) of less than 60 ml/min per 1.73 m², indicating significant reduction in kidney function, while in contrast, early CKD was characterized by a preserved eGFR of greater than 60 ml/min per 1.73 m², suggesting relatively normal kidney function. End-stage renal disease (ESRD) was defined as initiation of chronic hemodialysis or peritoneal dialysis.
Serum adropin levels were measured in duplicate using an enzyme-linked immunosorbent assay (ELISA) kit from Elabscience (Houston, TX, USA). The standard curve for adropin ranged from 12.5 pg/mL to 800 pg/mL, with a sensitivity of 7.5 pg/mL, while the intra-assay coefficient of variation (CV) for adropin was less than 10% in terms of functional sensitivity and the inter-assay CV was less than 15%.
In short, serum was obtained from a total of 10 mL of venous blood taken in the morning after at least 12 h fasting and stored at − 80°C. Aliquots of 10 μl of 5-fold diluted serum sample was added into wells coated with adropin antibodies, followed by the addition of 100 μl of HRP-conjugated reagent. After incubation for 60 min at 37°C, unbound Streptavidin-HRP was washed away, then the reaction was terminated by addition of acidic stop solution and the absorbance was measured at 450 nm. The five-parameter logistic fitted standard curve for calculating the concentration of adropin was generated from the Arigo Biolaboratories website (https://www.arigobio.cn/ELISA-calculator).
Data were expressed as means ± standard deviation or median (interquartile range). The differences of characteristics between three groups of T2D patients and control subjects were compared using Chi-square tests, or Mann-Whitney U test with Logistic regression analysis being used to determine the risk factors for developing T2D and DKD. The correlations between serum adropin and other parameters were analyzed by Pearson correlation analysis, and multiple linear regression analysis was used to determine the contribution of various factors to serum adropin. P values less than 0.05 were considered statistically significant. Potential predictors of CKD progression in the bivariate analyses (P < 0.05) were tabulated and were analyzed by logistic regression (probability of entry P < 0.05). Binary logistic regression was employed for multivariate analysis of risk factors causing decline in renal function. In addition, receiver operating characteristic curve (ROC) were delineated, followed by stepwise regression analysis of the role of adropin in the differential diagnosis of CKD progression. All data analyses were conducted using SPSS version 26 (IBM SPSS Inc., Chicago, IL).
A total of 58 eligible T2D patients were enrolled in this study: 40 were advanced CKD, with twenty-three in stage 3, seven in stage 4, and ten in stage 5 (including three under regular hemodialysis). The remaining 18 subjects with diabetes had eGFR ≥ 60 mL/min/1.73 m2 and were classified as early CKD. None of these patients had pre-existing episodes of major adverse cardiovascular events. We also included a control group of 9 subjects without diabetes. The demographic, clinical and biochemical data of subjects with diabetes both with advanced and early CKD, as well as the control group are presented in Table 1.
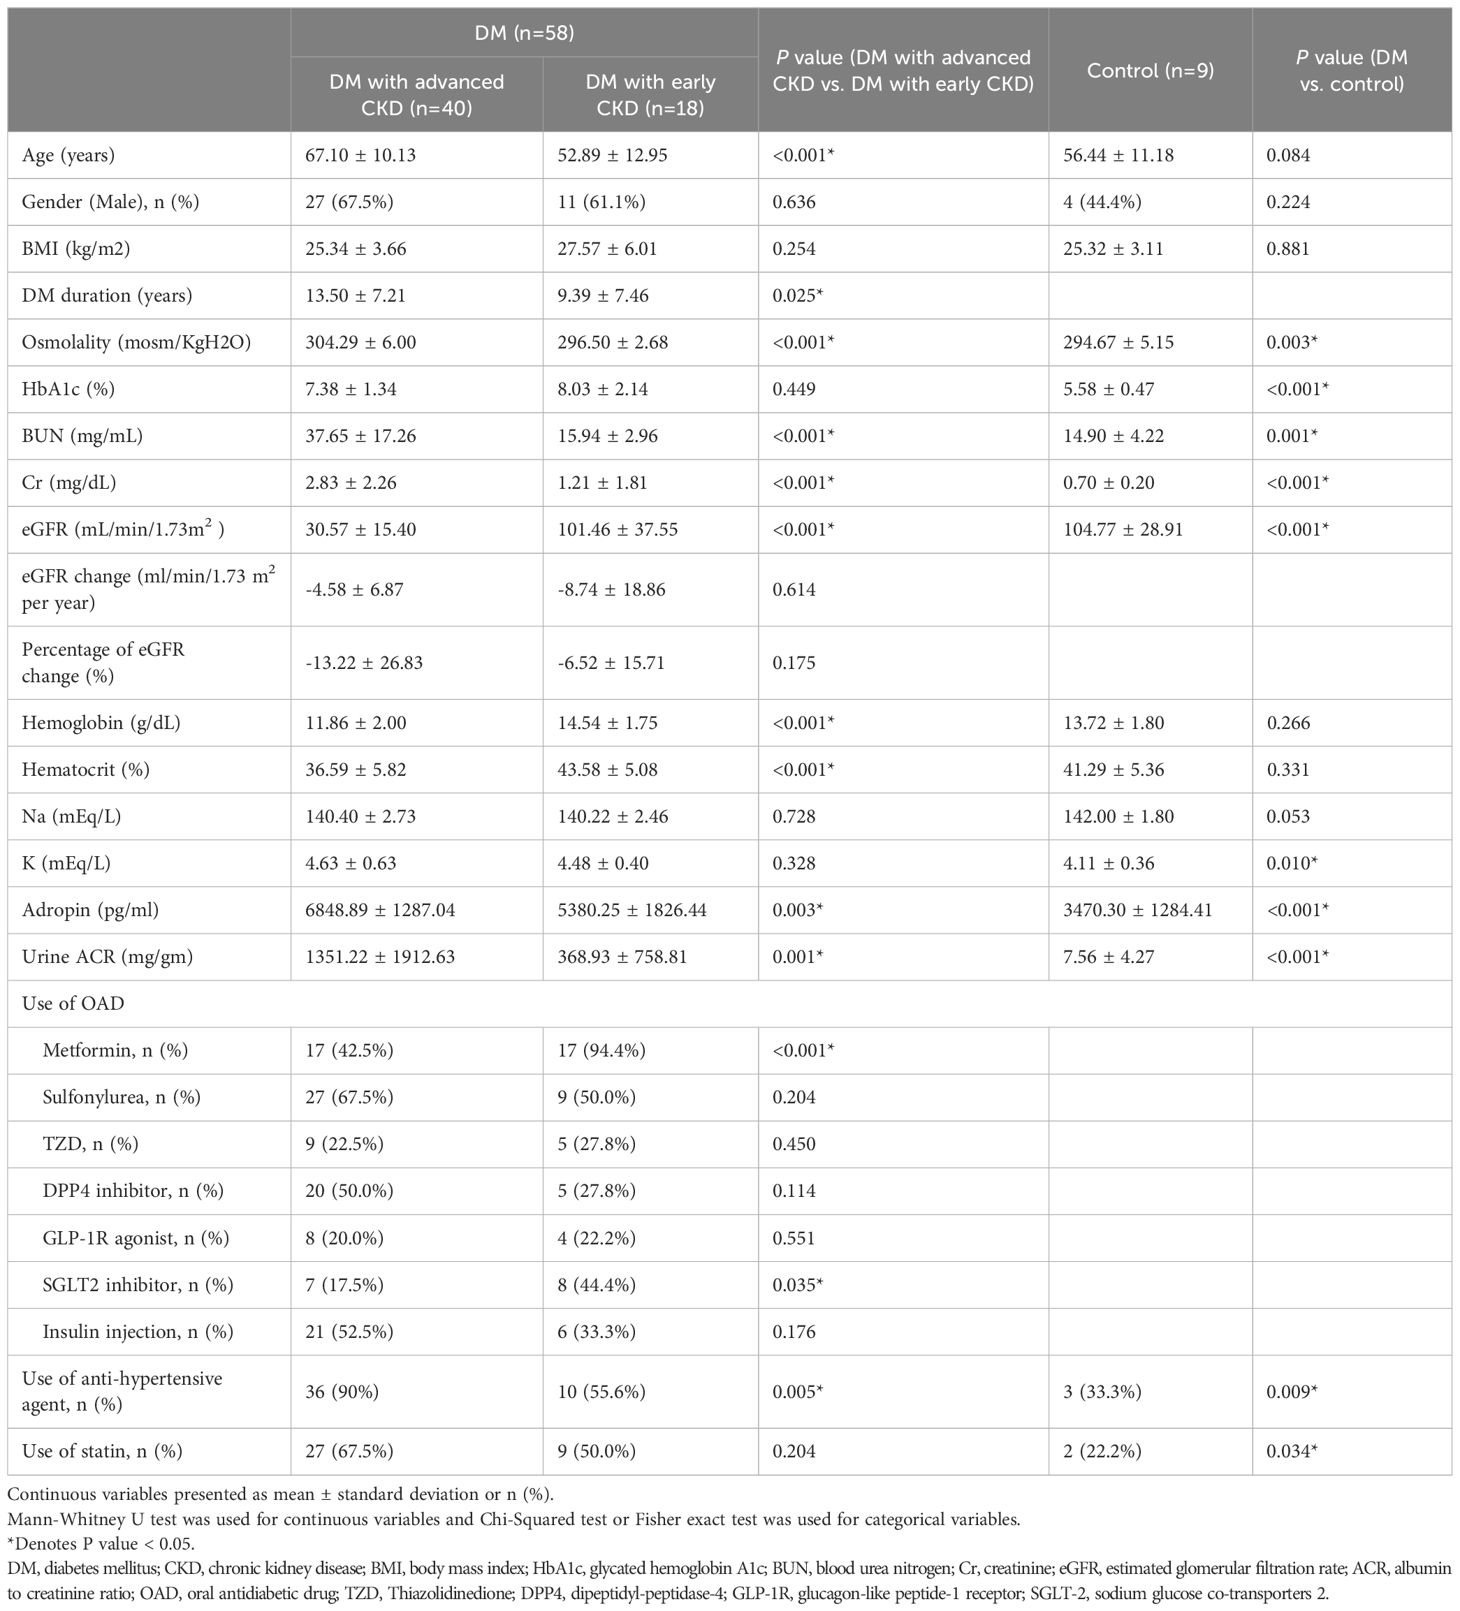
Table 1. Demographic and clinical characteristics of T2D patients with early and advanced kidney disease and controls.
The mean age of subjects with diabetes was 62.69 (± 12.82) years old and mean duration of diabetes was 12.22 (± 7.47) years. The average HbA1c was 7.58 (± 1.64) %; the average eGFR was 52.57 (± 40.95) mL/min/1.73 m2 and UACR was 1029.74 (± 1684.16) mg/g, and the average concentration of adropin was 6292.10 (± 1611.84) pg/ml. In summary, the subjects with diabetes had higher levels of blood osmolality, HbA1c, blood urea nitrogen (BUN), creatinine, potassium, adropin and UACR, as well as lower levels of eGFR as compared to the control group (Table 1).
In the subjects with diabetes, patients with advanced CKD were older (67.10 ± 10.13 vs. 52.89 ± 12.95 years, P < 0.001), sustaining a longer duration of diabetes (13.50 ± 7.21 vs. 9.39 ± 7.46 years, P = 0.25), and had significantly lower eGFR (30.57 ± 1./40 vs. 101.46 ± 37.55 mL/min/1.73m2, P < 0.001). Biochemically, patients with advanced CKD had higher blood osmolality (304.29 ± 6.00 vs. 296.50 ± 2.68 mosm/KgH2O, P < 0.001), elevated BUN (37.65 ± 17.26 v.s.15.94 ± 2.96 mg/mL, P < 0.001), increased creatinine (2.83 ± 2.26 vs. 1.21 ± 1.81 mg/mL, P < 0.001), higher adropin concentration (6848.89 ± 1287.04 vs. 5380.25 ± 1826.44 pg/mL, P = 0.003), elevated UACR (1351.22 ± 1921.63 vs. 368.93 ± 758.81 mg/g, P = 0.001), and lower hemoglobin (11.86 ± 2.00 vs. 14.54 ± 1.75 g/dL, P < 0.001).
Serum adropin levels as presented in Table 1 and Figure 1, were significantly higher in subjects with diabetes compared to the control group (T2D: 6393.10 ± 1611.84 pg/mL; control: 3470.30 ± 1284.41 pg/mL; P < 0.001). Additionally, significantly higher adropin levels were also found in T2D subjects with advanced CKD compared to those with early CKD (6848.89 ± 1287.04 pg/mL vs 5380.25 ± 1826.44 pg/mL; P =0.003). After adjusting for osmolality, GFR, UACR, use of anti-hypertensive agents and use of statins, the serum adropin level showed borderline significance (adjusted odds ratio (aOR) 1.001, 95% confidence interval (CI) 1.000-1.003, P = 0.096) between subjects with diabetes and controls.
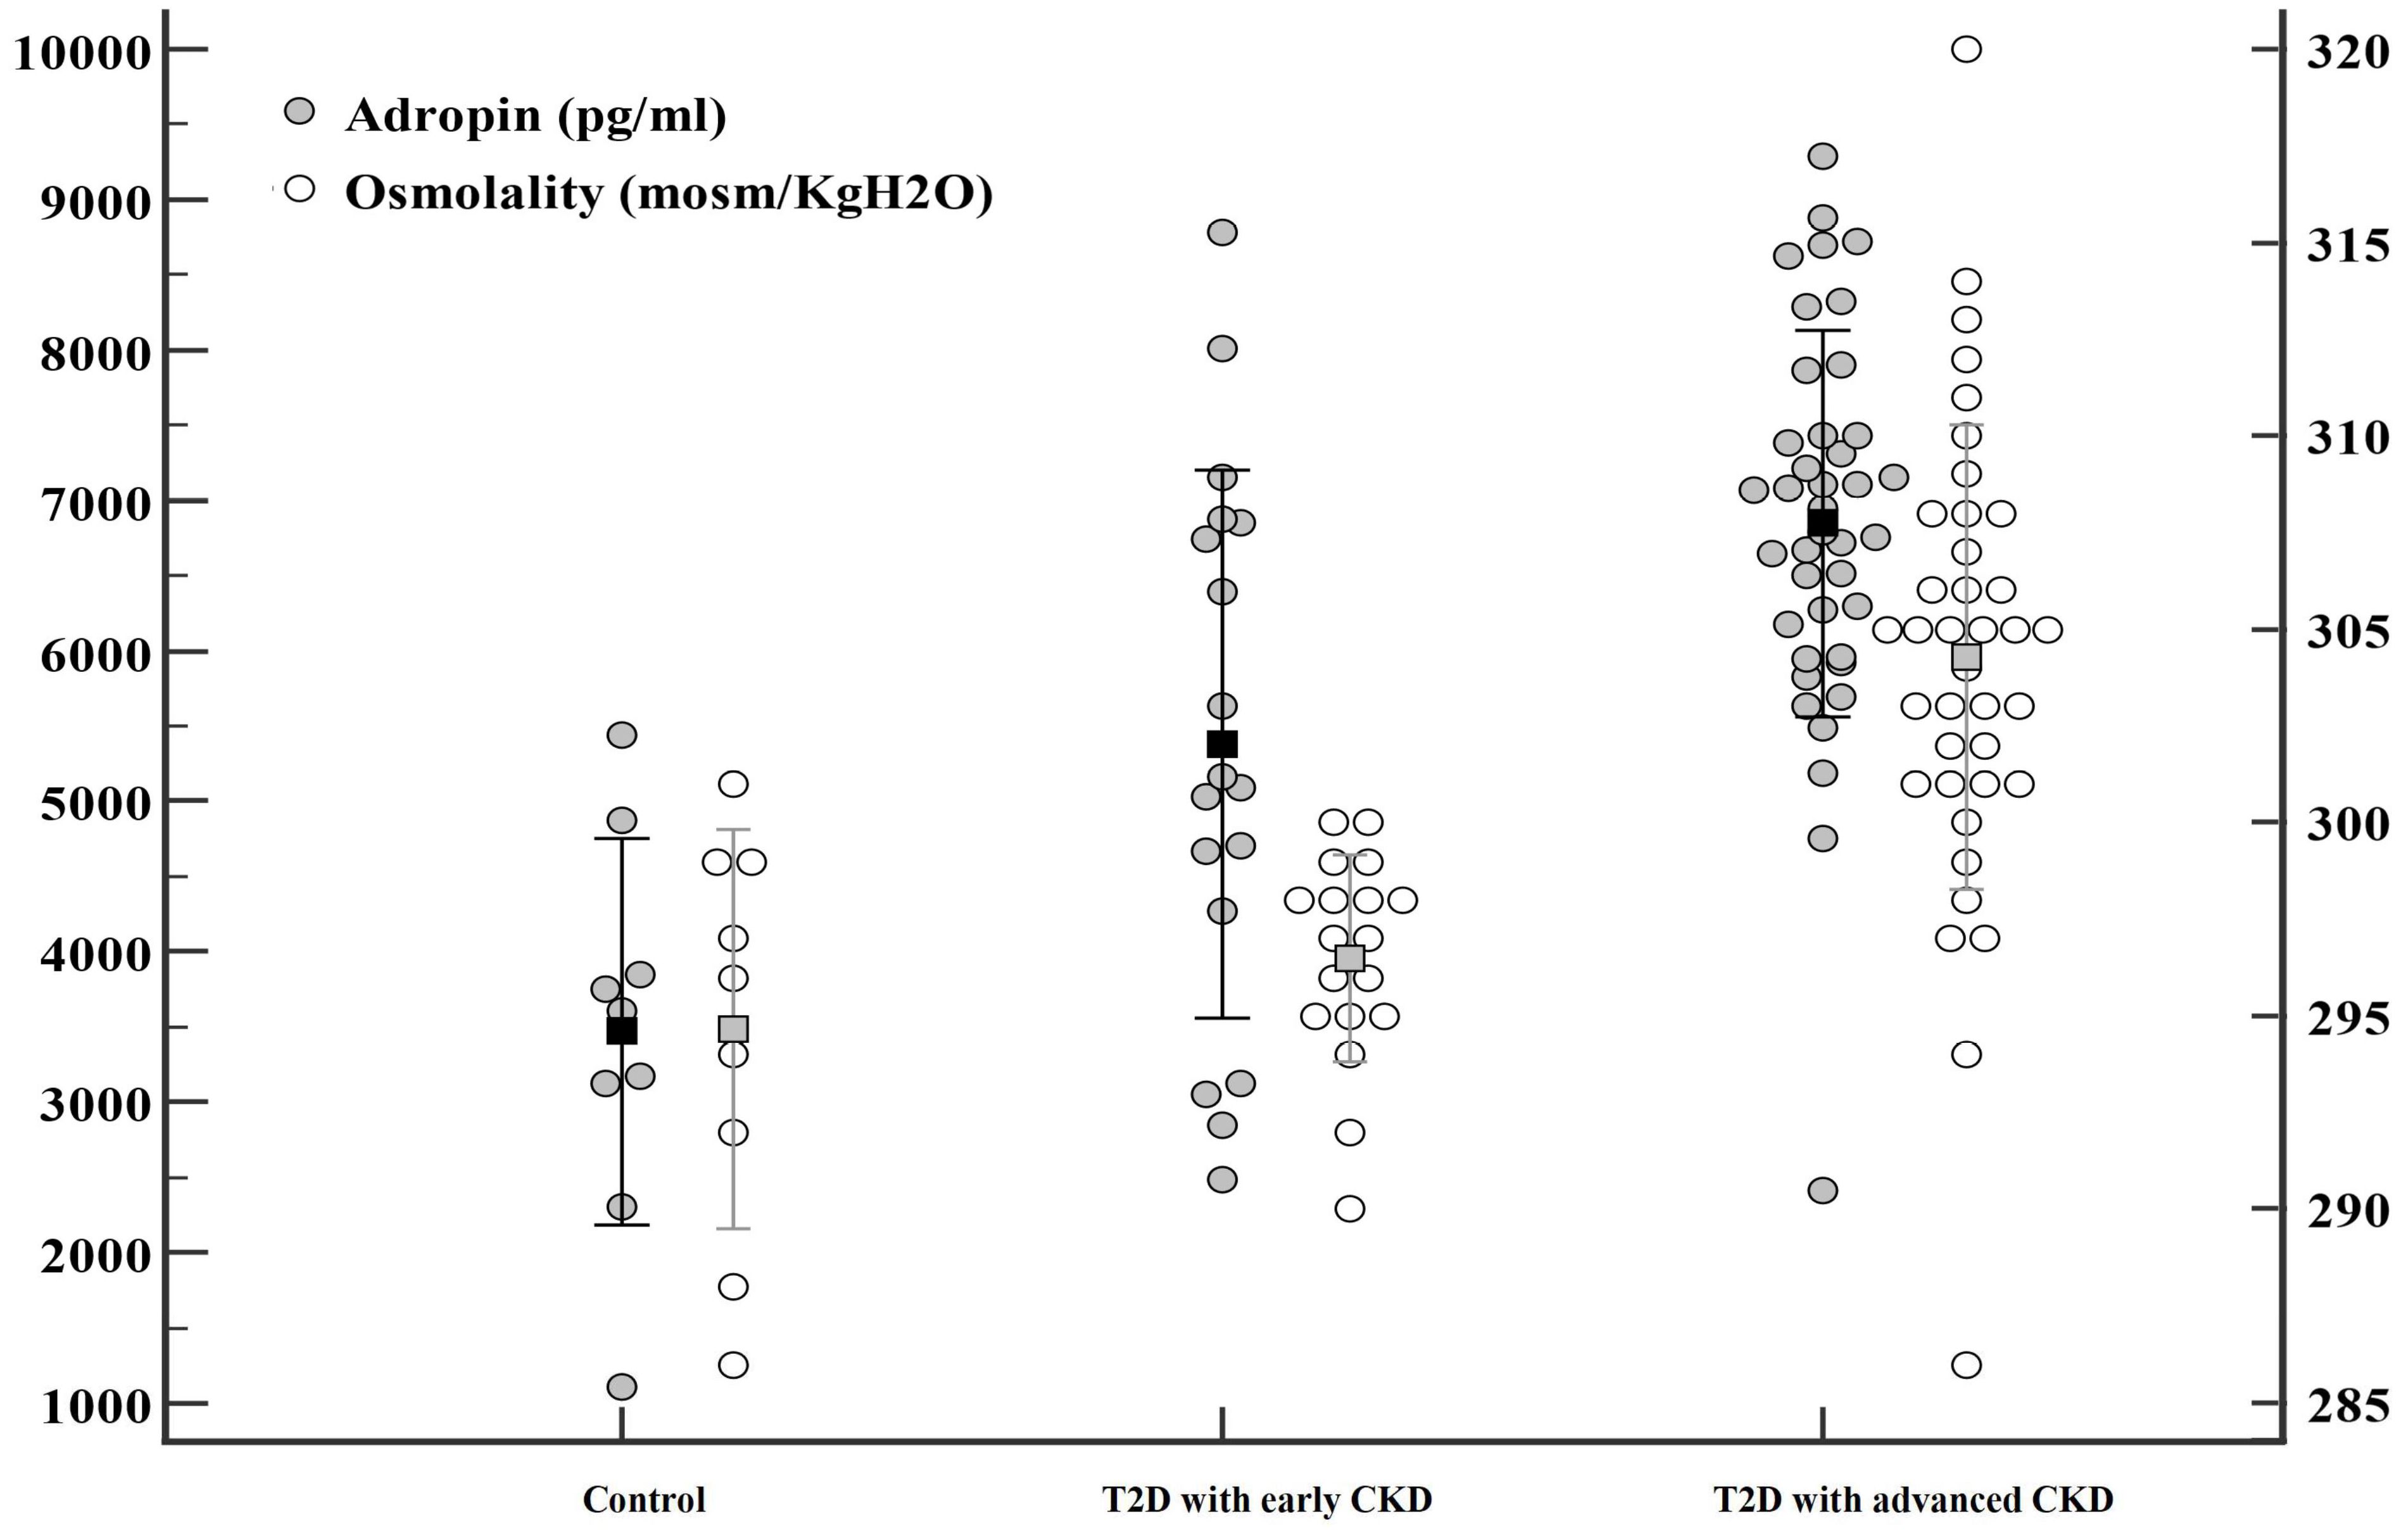
Figure 1. Significant differences were observed in adropin (●) and osmolality (○) levels among three groups: patients with type 2 diabetes mellitus (T2D) with advanced chronic kidney disease (CKD), patients with T2D with early CKD, and controls.
Since serum adropin was associated with diabetic control and complications, we performed univariate and multivariate linear regression analyses in subjects with diabetes (Table 2) to evaluate the plausible associations of adropin levels with other variables. The unadjusted univariate linear regression analysis showed significant association between adropin levels and male gender (P < 0.001), osmolality (P =0.047), BUN (P=0.013), creatinine (P = 0.038), eGFR (P < 0.001) and use of anti-hypertensive (+/-diuretic) agents (P =0.007); however, age, BMI, diabetic duration, HbA1c, UACR, use of SGLT2 inhibitors and statins showed no significant association. Multivariate linear regression demonstrated that only male gender (P <0.001) and eGFR (P <0.001) remained strongly associated with adropin level, whereas use of SGLT2 inhibitors and use of anti-hypertensive agents exhibited borderline significance. Figure 2 illustrates the Pearson correlation analysis between serum adropin levels and renal parameters.
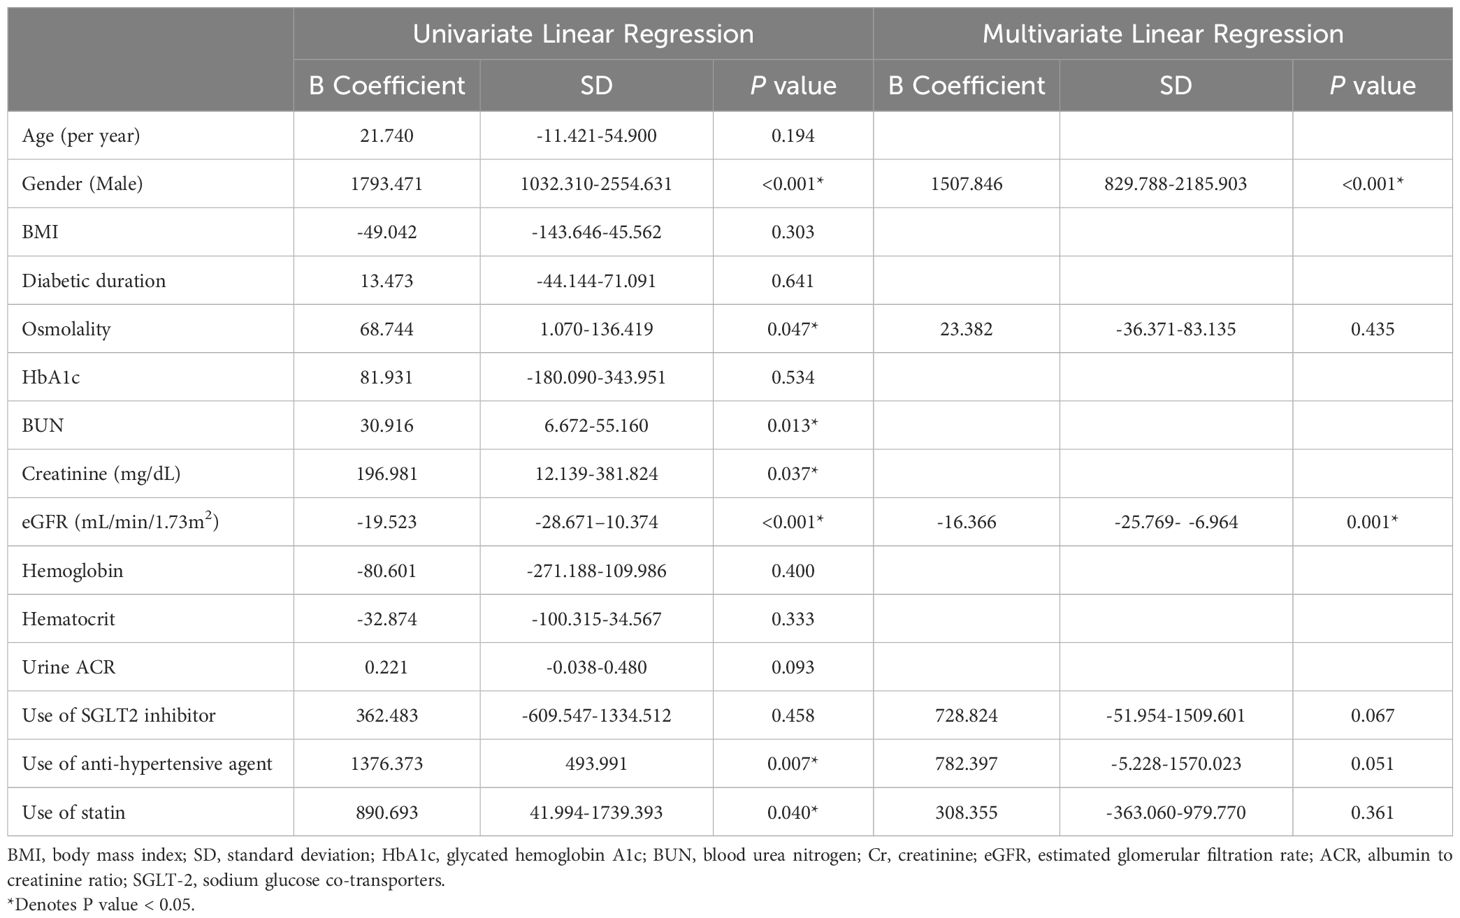
Table 2. Univariate and multivariate linear regression analyses of the association of adropin levels with age, gender, BMI, osmolality, BUN, Creatinine, eGFR, Urine ACR, use of SGLT2 inhibitor, anti-hypertensive agent, and statin.
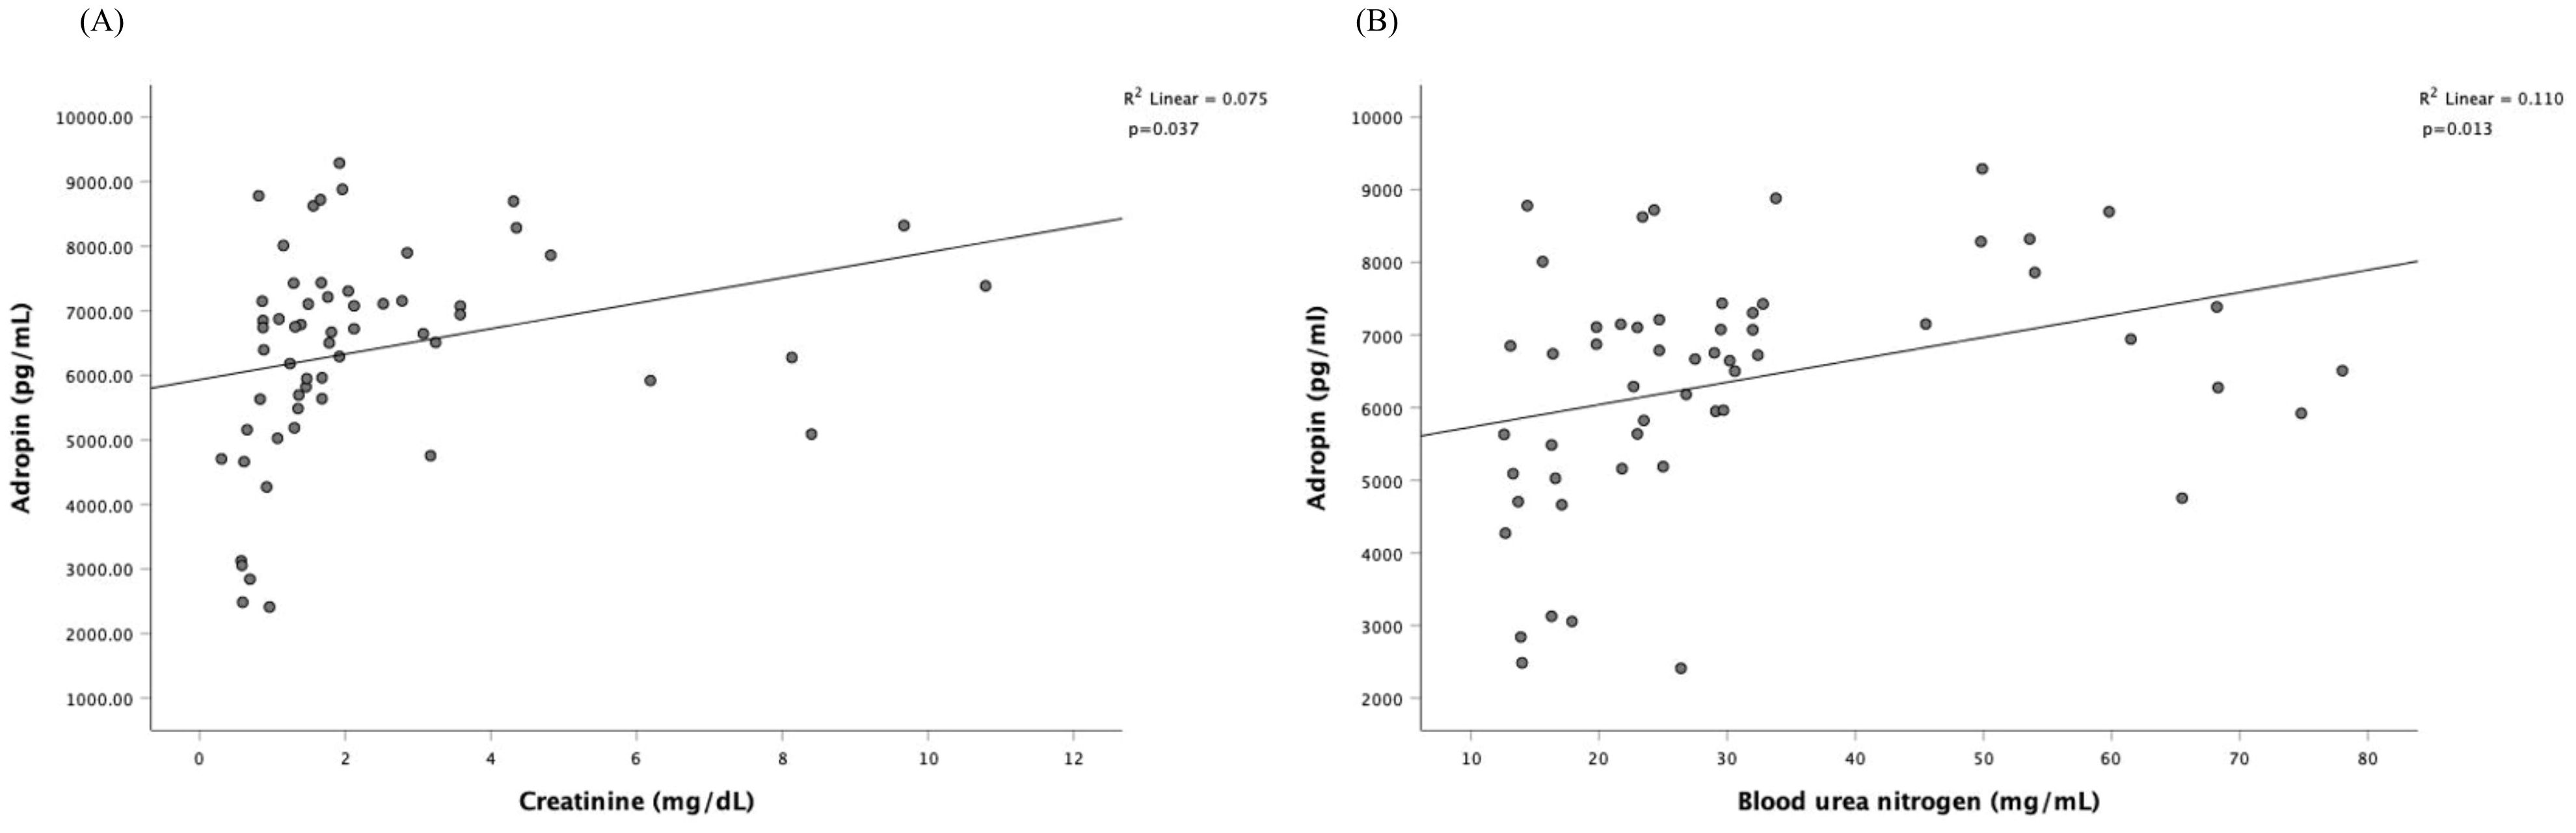
Figure 2. Pearson correlation analysis among serum adropin levels and renal parameters. The correlation is depicted between serum adropin levels and creatinine in panel (A), between adropin levels and blood urea nitrogen in panel (B).
Among 58 subjects with diabetes, one individual initiated regular hemodialysis during the follow-up period, and three were already receiving regular hemodialysis before enrollment. After excluding these cases, 54 subjects with diabetes continued and underwent renal function follow-up, with an average follow-up duration of 16.05 ± 4.65 months. Within this group, seven individuals (12.9%) developed CKD progression, including three in CKD stage 3, two in CKD stage 4, and two in CKD stage 5). Notably, in subjects with diabetes and CKD stages 1 and 2, no renal function progression during the follow-up duration was observed.
Table 3 displays the demographic characteristics of subjects with diabetes, both with and without CKD progression. In short, patients with CKD progression had higher levels of blood osmolarity (305.43 ± 4.35 vs. 300.93 ± 6.38 mosm/KgH2O, P < 0.001), creatinine (2.47 ± 1.10 vs. 1.82 ± 1.53 mg/mL, p<0.001), and lower hemoglobin (11.43 ± 1.52 vs. 13.05 ± 2.34 g/dL, P <0.001); additionally, the progression group had higher adropin (7520.15 ± 843.21 vs. 6151.16 ± 1661.61 pg/mL, P =0.003) and lower eGFR (29.37 ± 14.74 vs. 59.85 ± 41.68 mL/min/1.73m2, P < 0.001). No significant difference was found in the use of oral antidiabetic drugs or anti-hypertensive agents between the two groups.
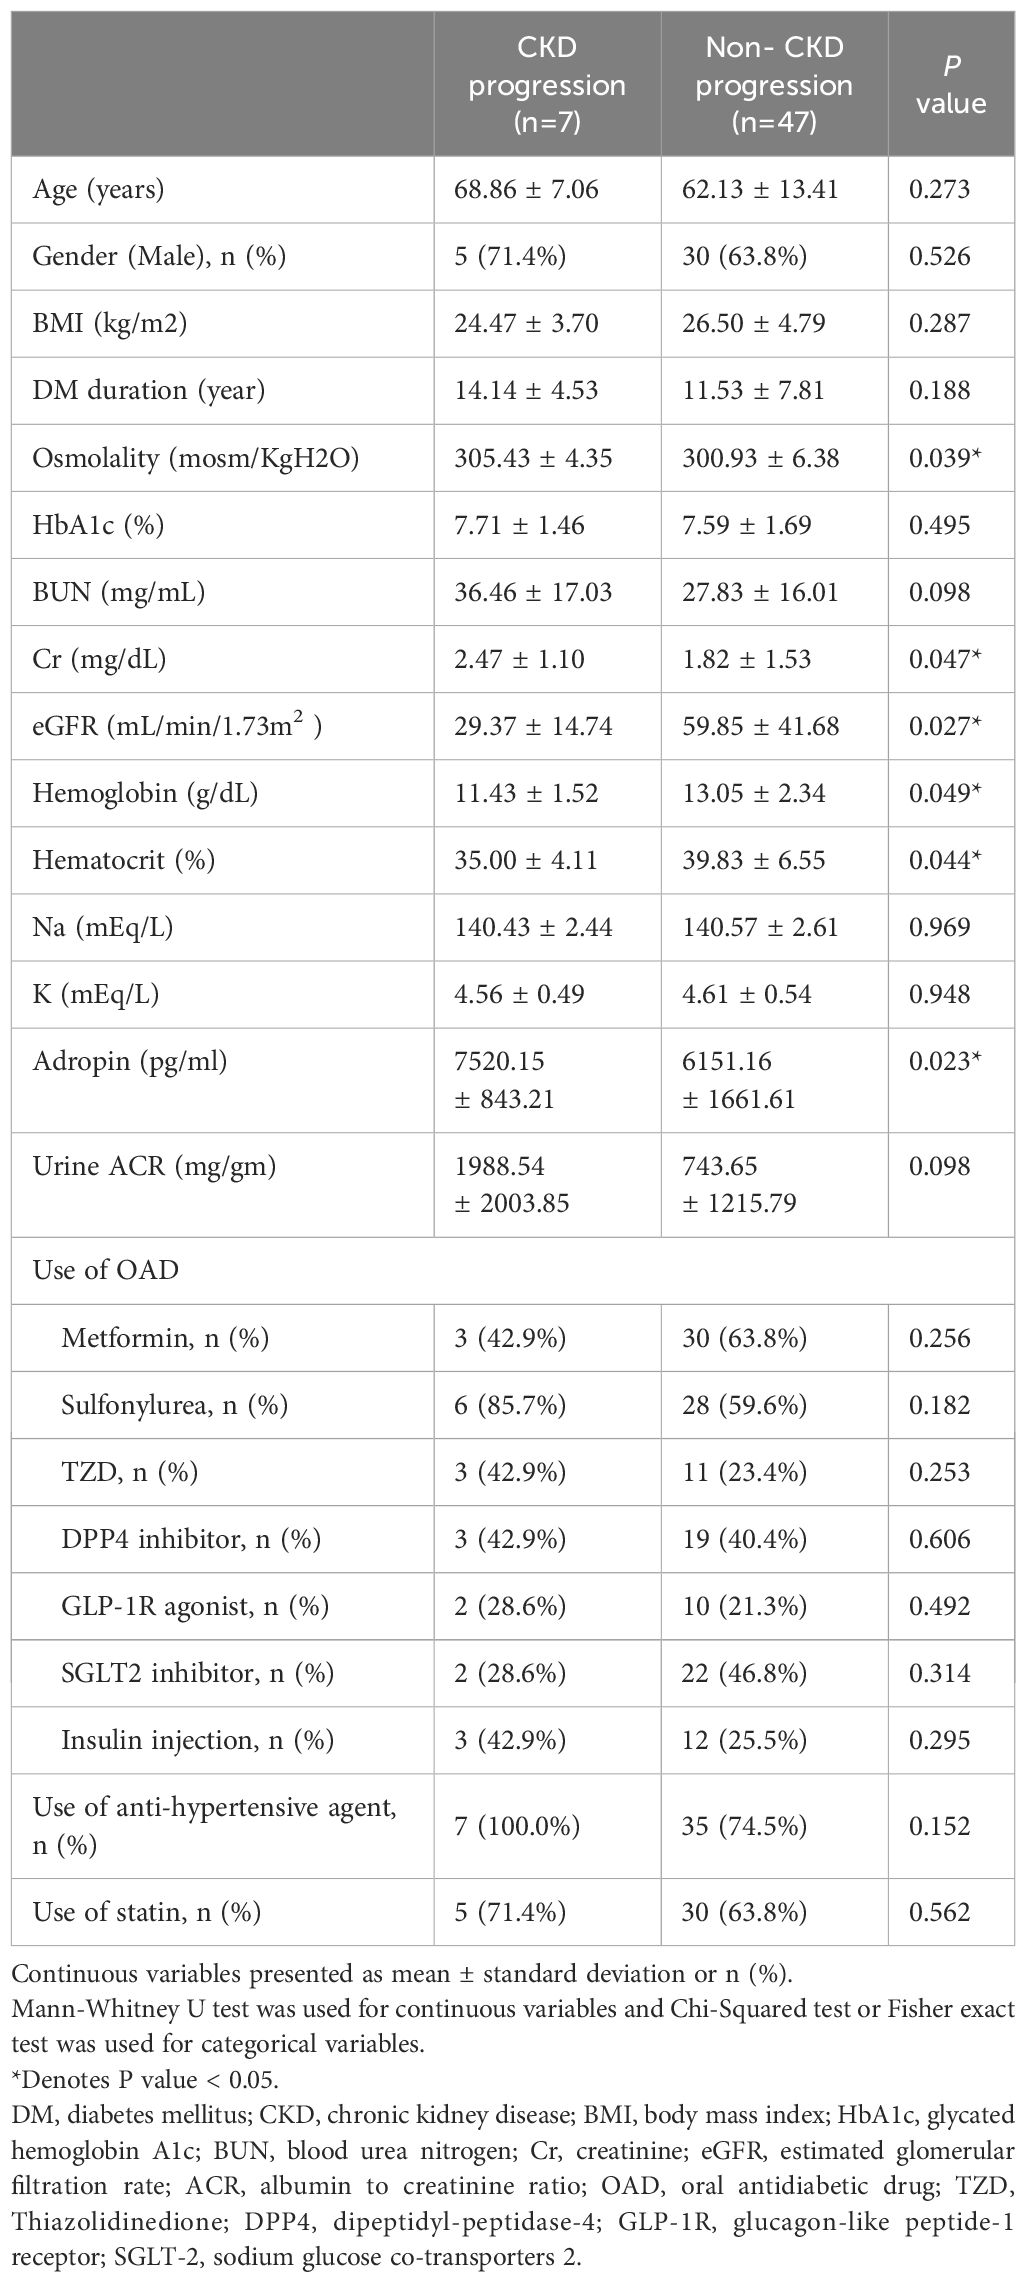
Table 3. Demographic characteristics of subjects with diabetes with and without chronic kidney disease progression (Decrease eGFR >= 30%).
ROC curve analysis was performed to evaluate whether adropin could perform as a novel biomarker for distinguishing CKD progression in DKD patients. The results are shown in Figure 3, with an area under the curve (AUC) of 0.769 (95% confidence interval (CI) 0.635-0.903), indicating a significant predictive ability (P=0.0001). Notably, a cut-off value of 6872.24 pg/ml was identified (sensitivity 85.7%, specificity 70.2%, positive predictive value 74.20%, negative predictive value 80.08%), representing the optimal threshold on ROC curve for predicting renal endpoint.
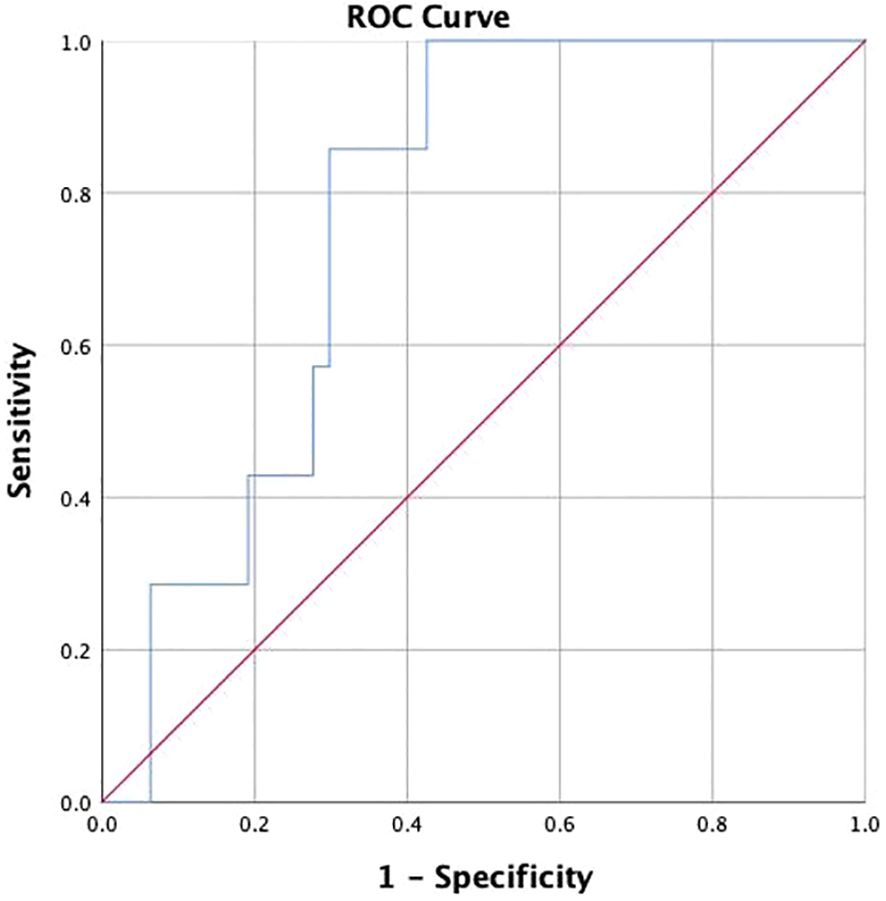
Figure 3. The receiver operating characteristic curve of Adropin for chronic kidney disease progression.
In order to evaluate the clinical value of serum adropin level in predicting CKD progression, logistic regression analysis was performed (Table 4), with multivariate analysis including variables such as age, gender, BMI, the cut-off point level of adropin, eGFR, serum creatinine, UACR, macroalbuminuria at baseline, the use of antihypertensive agents, SGLT2 inhibitors, and statins. Results are summarized in Table 4.
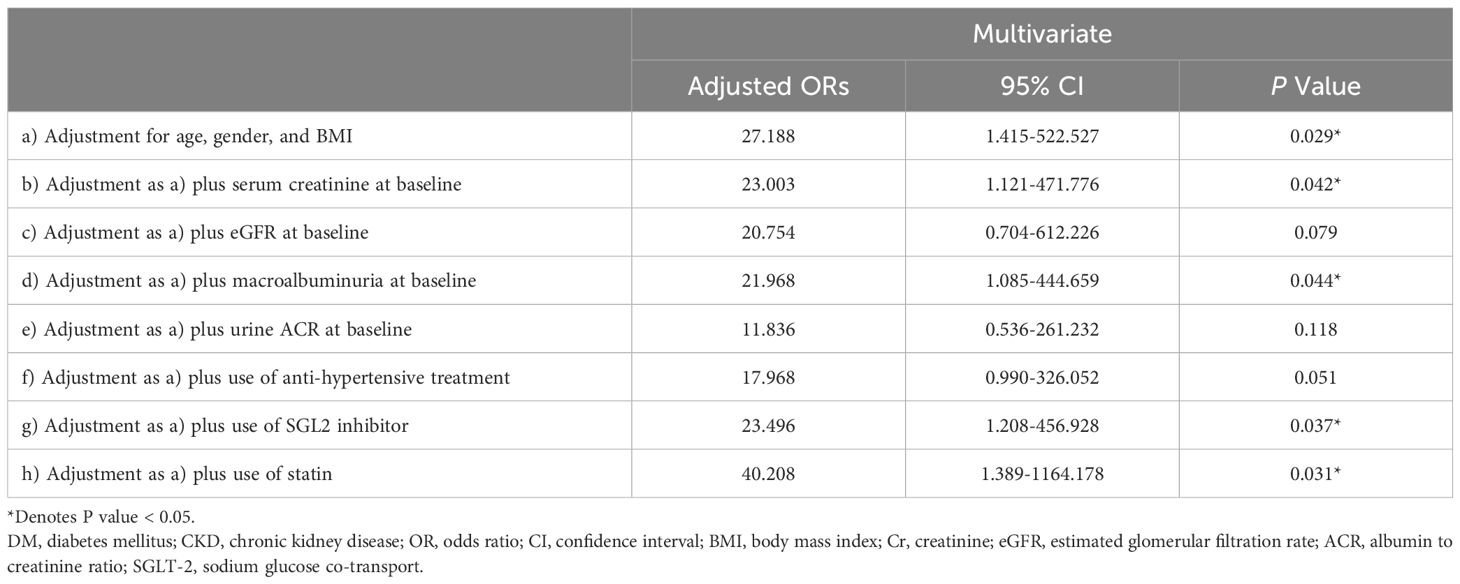
Table 4. Association between fasting high adropin concentrations (> 6872.24 pg/ml) and development of chronic kidney disease progression.
Our findings revealed an association of serum adropin level > 6872.24 pg/ml and CKD progression, even after adjusting for confounding factors such as age, gender and BMI (adjusted odds ratio (aOR) 27.188, 95% CI 1.415-522.527, P =0.029). This association remained significant even after adjusting for serum creatinine at baseline (aOR 23.003, 95% CI 1.121-471.776, P =0.042), macroalbuminuria at baseline (aOR 21.968, 95% CI 1.085-444.659, P =0.044), use of SGLT2 inhibitors (aOR 23.496, 95% CI 1.208-456.928, P =0.037), and use of statins (aOR 40.208, 95% CI 1.389-1164.178, P =0.031), but the association became borderline significant after adjusting for the use of antihypertensive agents (aOR 17.968, 95% CI 0.990-326.052, P =0.051). Additionally, no significant relationship was observed between elevated adropin concentrations and CKD progression when adjusting for eGFR and UACR at baseline.
Although initially classified as a “promoting fat burning” peptide, adropin was later confirmed to enhance glucose oxidation and utility to reduce insulin resistance. Through knockout of the Enho gene, Kumar et al. demonstrated that adropin-deficiency was associated with increased risk of developing insulin resistance and diseases of metabolic syndrome (16); correspondingly, clinical observation studies corroborated this study and found that reduced circulating adropin was associated with insulin resistance, gestation and type 2 diabetes (9, 17, 18). Nevertheless, not all reports fit into this rule in the real world, where high-circulating adropin level was reported especially in patients with long-standing diabetes (11, 12, 19).
Herein, we also observed elevated adropin levels in subjects with advanced diabetes compared to those without diabetes in our study. Although lowered circulating adropin levels favor the development of diabetes from the standpoint of glucose homeostasis, it has been acknowledged that chronic oxidative stress and/or inflammation may stimulate adropin overexpression in advanced and/or poorly controlled subjects with diabetes, as has been found in rheumatic arthritis and systemic sclerosis (20–22). In correspondence, lines of evidence have documented increased serum (23) and tissue (pancreas, liver, kidney, heart, brain and cerebellar) adropin immunoreactivities (13) in diabetic rats induced by STZ. Therefore, we hypothesize a U-shaped risk association of adropin during the natural course of diabetes.
The published data suggesting oxidative stress may affect adropin expression through as yet unclarified meticulous networks. However, as mentioned above, we propose that the elevated adropin levels observed in our study may reflect a compensatory response to chronic oxidative stress and inflammation process in advanced CKD. This hypothesis is supported by evidence from chronic heart failure patients, where elevated adropin correlates with inflammation markers like IL-6 (24). Adropin may act to counterbalance the inflammatory status, which helps explain its paradoxical elevation in advanced disease stages.
Another possible interruption for serum adropin level in this study is medication, and it is worth noting that a significant proportion of our subjects with diabetes (79.3%) were taking anti-hypertensive agents, while a considerable number (62.1%) were on statin treatment, and 25.9% were using SGLT2 inhibitors. Previous research suggested that patients treated with anti-hypertensive medications like amlodipine and valsartan may have increased serum levels of adropin (25); additionally, an in vitro study demonstrated that atorvastatin might upregulate the expression of adropin (23), while another study demonstrated that dapagliflozin, an SGLT2 inhibitor, led to an increase in adropin level by up to 26.6% (26). Accordingly, multivariate linear regression analyses was performed to assess this correlation, with results still revealing borderline significance of higher adropin levels in subjects with diabetes after adjusting potential confounding factors including the use of the aforementioned drugs. In summary, the current study found significantly elevated serum adropin levels in subjects with diabetes, especially those with CKD, compared to those without diabetes for demographic differences.
In addition to the diabetogenic effect, lower serum adropin levels in subjects with diabetes were also found to be associated with higher possibility of developing renal and cardiovascular complications (27). Although the mechanisms as to how adropin preserves normal tissue function under hyperglycemic status remains obscure, it has been found that decreased adropin secretion in diabetic rats and adropin-knockout mice is associated with overexpressed inflammatory factors such as TNF-α, IL-6, as well as reduced phosphorylation level of eNOS (28, 29), while in contrast, increased generation and secretion of adropin promoted nitrogen oxide production and up-regulation of vascular endothelial growth factor receptors, potentially preventing endothelial cell damage in diabetic nephropathy (28, 29). Taken together, these findings suggest that adropin plays a crucial role in the pathophysiological development of diabetic nephropathy.
The association of adropin and the development and progression of diabetic nephropathy has been monitored by UACR and serum creatinine in individuals with T2D in clinical practice. In a literature review, most of the studies were focused on patients with early-stage CKD (average eGFR ranging from 68.80 to 109.13 mL/min/1.73 m2) (17, 18, 30). To further investigate these finding in more advanced CKD, our study focused on subjects with diabetes, with 69% classified as CKD stages 4-5 (average eGFR of 52.57 mL/min/1.73 m²), and as expected, our result is in contrast to the previous reports in early CKD, and we found that patients with advanced CKD had higher adropin levels than those with early CKD. Notably, our report is also the first study to demonstrate higher serum adropin levels; that is, those exceeding 6872.24 pg/ml, as being an independent risk factor for CKD progression.
Corresponding to our finding of elevated circulating adropin in advanced CKD, animal studies have already reported increased adropin immunoreaction documented in the kidney of STZ-induced diabetic rats with the intensities increasing with diabetic severity (13, 18). It is proposed that in response to chronic insults in poorly controlled T2D with advanced CKD, over-secretion of adropin plays a vital role in preventing further deterioration of diabetic nephropathy; therefore, higher levels of adropin in this study might represent an adaptive response with a potential protective effect against the progression of CKD. Nevertheless, as it was found in an in vivo study showing “adropin resistance” (31, 32), it seems that a threshold of adropin-associated renal protection exists, so when the environmental condition is exacerbated, renal function deterioration commences even when serum adropin is persistently high, just as it was observed in our progression DKD patients.
It has been well documented that the progression of CKD is associated with the nuclear factor erythroid 2-related factor 2 (Nrf2) which plays critical roles in maintaining normal redox homeostasis and renal function (33). A role of Nrf2 in DKD was demonstrated by reduced translocation of Nrf2 into the nucleus and diminished protection against inflammation, fibrosis and oxidative damage in renal tissues of diabetic rat studies (34). Nevertheless, clinical treatment of stage 4 diabetic CKD patients with a synthetic Nrf2 activator, bardoxolone methyl, in the BEACON study showed the recovery of eGFR within a narrow therapeutic range, accompanied by certain unfavorable side effects (35, 36). To integrate these findings into our study, we propose an Nrf2-mediated mechanism for “adropin resistance” in our study based on the following studies. Firstly, the naturally occurring endogenous Nrf2 activator, adropin bioactive peptides stimulated and activated Nrf2 in a dose-dependent manner in an adropin-knockout mice to prevent non-alcoholic steatohepatitis (37). Secondly, biphasic Nrf2 expression in CKD patients were reported in Denmark (38) and Italian (39) studies, where increased Nrf2 expression was detected in patients with mild to moderate renal impairment, whereas significant reduced Nrf2 was observed as CKD progressed in patients with severe renal impairment. To summarize, initially overexpressed adropin may protect against CKD progression through its dose- dependent induction and activation of Nrf2 until this protective mechanism is overwhelmed in more deteriorated conditions. Subsequently, Nrf2 exhaustion led to renal function decline and rapid progression, even with their serum adropin levels exceeding 6872.24 pg/ml.
Although we did not perform kidney biopsy or urinary analysis to check for the renal expression of adropin, Nrf2 and inflammatory markers, our results echo the findings of increased renal expression of adropin in STZ-induced diabetic rats (13, 40), which also highlights the complexity of the role of adropin in diabetic nephropathy and suggests that further research is needed to better understand its mechanisms and potential therapeutic implications.
Another important finding was the elevated osmolality in the subjects with diabetes and CKD, which was also well-correlated with the circulating adropin. In addition to the elevated blood glucose and urea nitrogen in the subjects with poorly controlled diabetes, there is a possibility that an elevated circulating adropin might also act on the brain to inhibit water intake (41, 42) cannot be excluded, and the higher osmolality might in part have contributed to the rapid progression of renal function in our DKD patients (43).
These findings suggest that serum adropin levels could potentially serve as a useful biomarker for predicting rapid deterioration of renal function, especially in individuals with poorly controlled T2D and pre-existing CKD. Several reviews and the hypothesis have well summarized the evidence to date on adropin in the development of diabetes and its complications, as displayed in Figure 4.
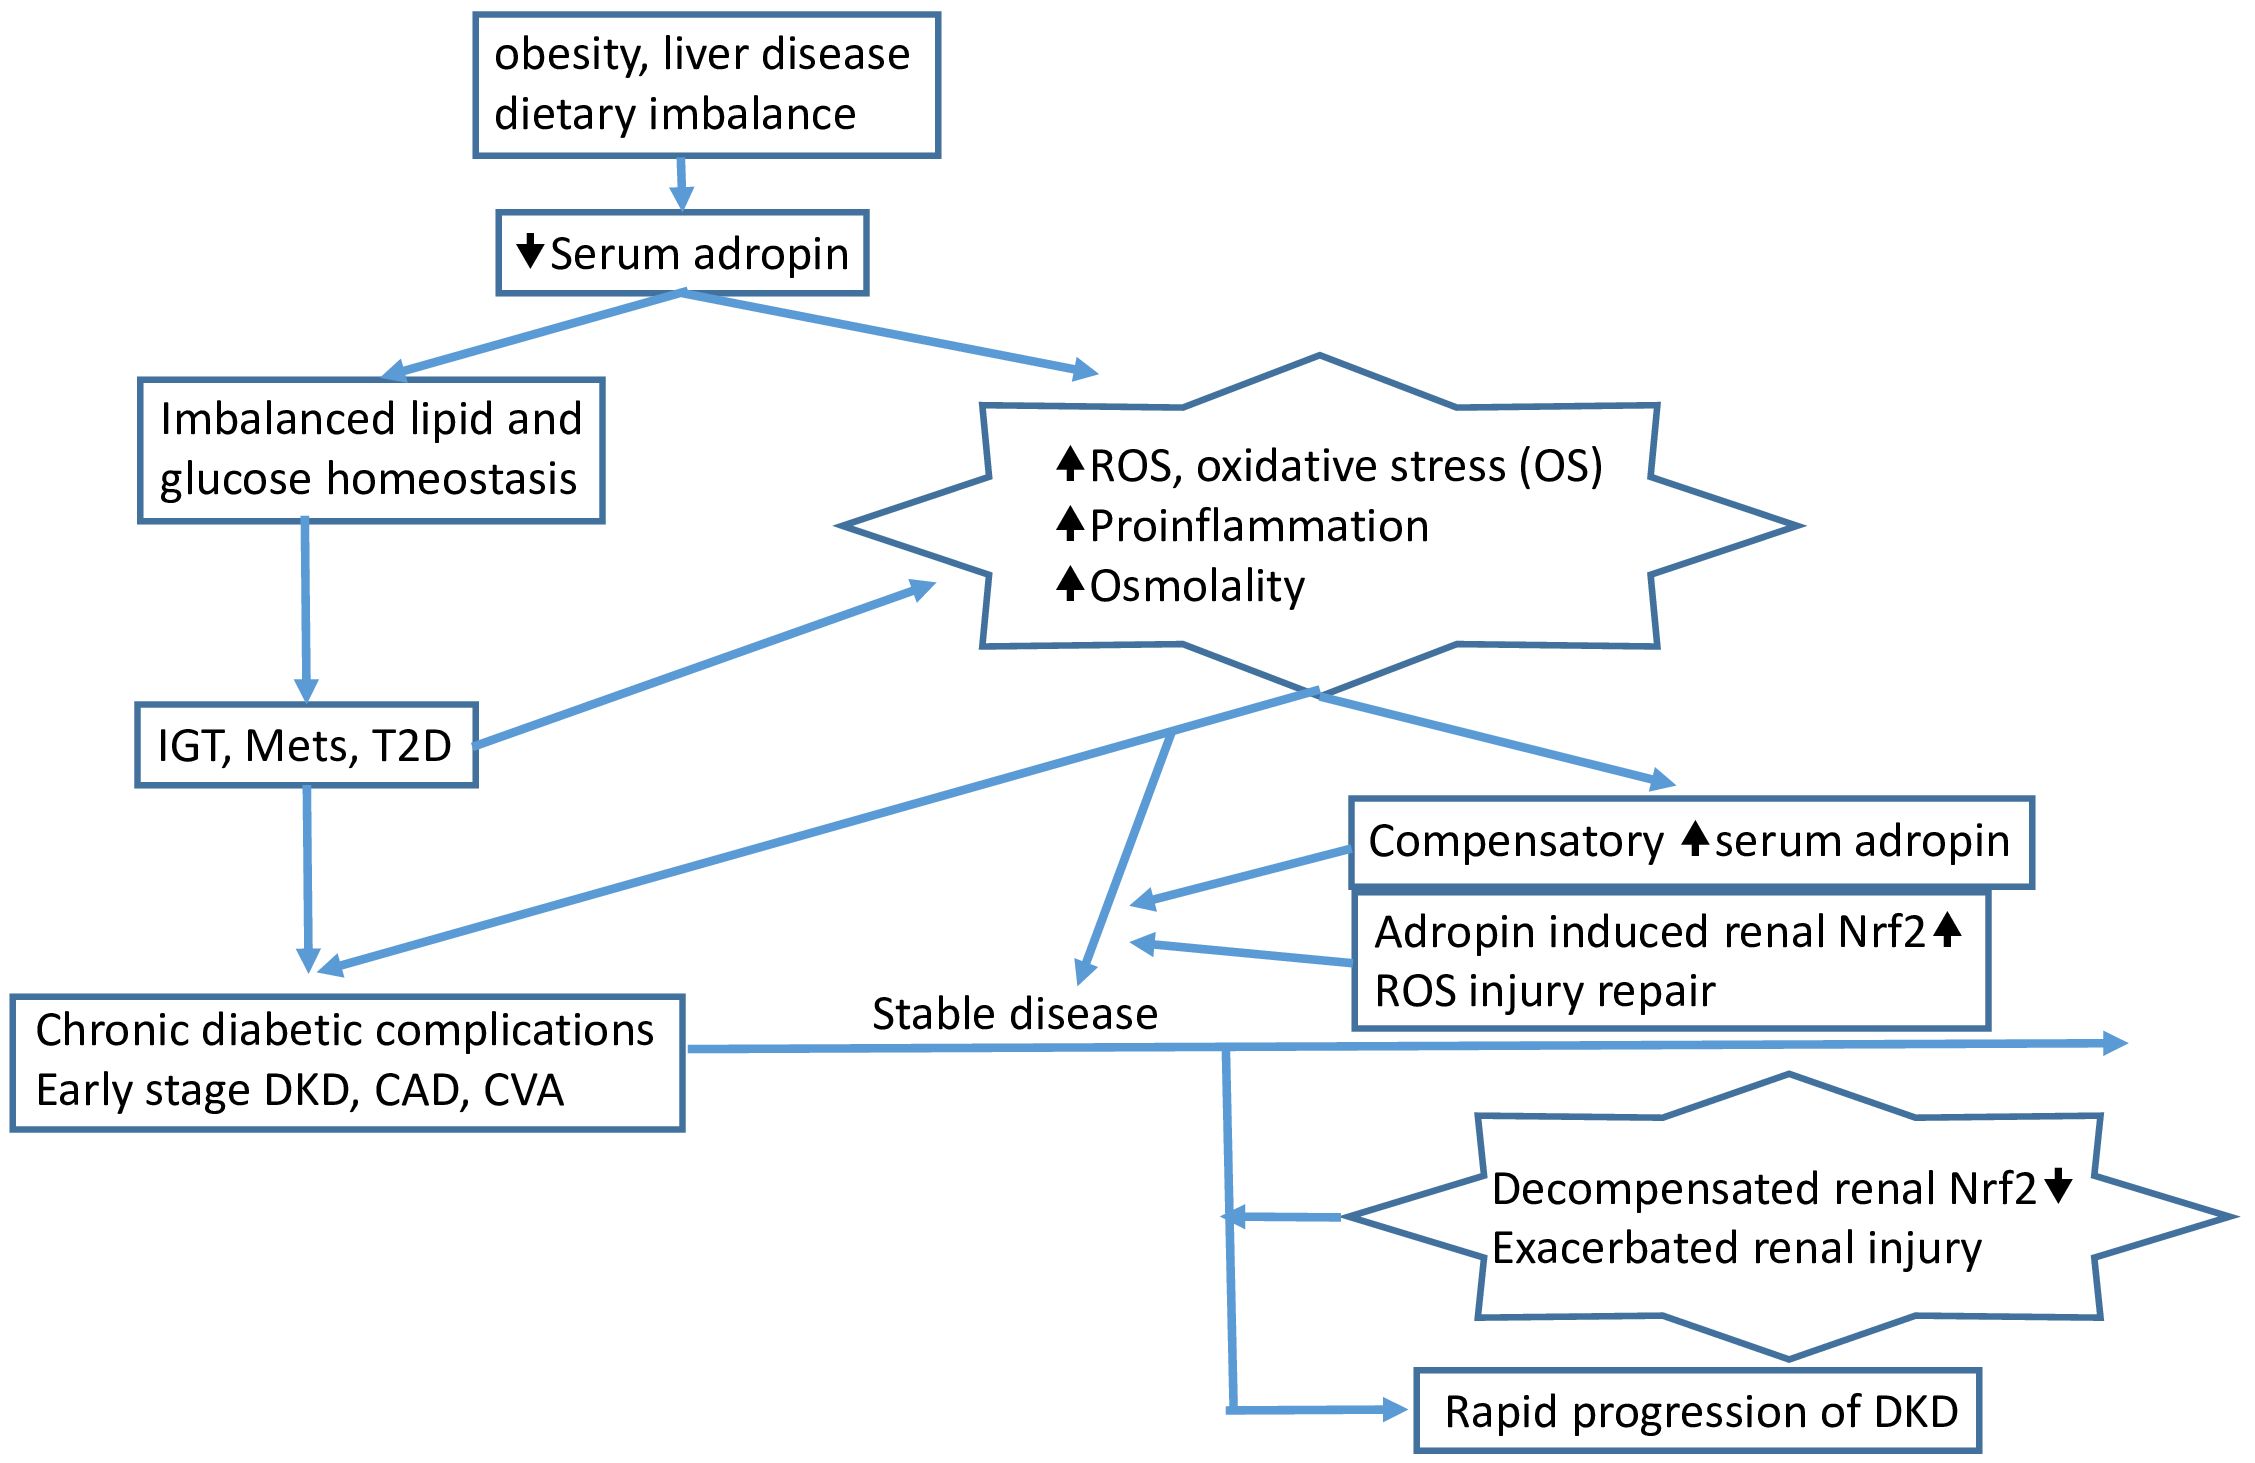
Figure 4. Pathophysiologic insults such as obesity, dietary imbalance, and certain liver diseases (e.g., fatty liver) reduce serum adropin and induce impaired glucose tolerance (IGT), metabolic syndrome (MetS), and/or type 2 diabetes (T2D). Accumulated increased serum glucose induces reactive oxygen species (ROS), oxidative stress (OS), proinflammation, and increased serum osmolality, leading to chronic complications in patients with advanced T2D. The proinflammatory process and/or other mechanisms induce compensatory overexpression of adropin, which then triggers renal Nrf2 overexpression, protecting the kidney from injury caused by increased ROS and proinflammation. As the environment exacerbates, Nrf2 function is compromised, and at this point, rapid progression of CKD can be observed clinically, accompanied by elevated serum adropin. The arrows indicate the sequential flow of events leading to the development of diabetic kidney disease (DKD).
This study has some limitations. Firstly, the sample size was relatively small, necessitating further studies for confirmation, while adropin concentrations were measured only under fasting conditions, which might not fully capture the fluctuations of adropin level(s) over time, particularly after different dietary intakes. Additionally, anthropologic parameters such as age, gender and body composition might also influence circulating adropin levels, while exploring the kinetics of adropin clearance from the circulation desirably measuring its concentration in various conditions could further help to clarify the possible mechanisms involved in the response of adropin to altered metabolic status. Additionally, we could not exclude the possibility that reduced nephron activity and impaired renal clearance may contribute to accumulated circulating adropin in our advanced CKD patients as a possible mechanism albeit whether adropin was excreted by urination was unclear. Finally, multicenter studies with larger sample sizes are necessary to validate our findings.
Despite the association between lack of circulating adropin and the development of diabetes and its renal and cardiovascular complications, this study observed significantly higher serum adropin levels in diabetes subjects with advanced nephropathy compared to those with mild diabetic nephropathy and subjects without diabetes in this study. These findings suggest that compensatory elevated adropin could be associated with proinflammation- and redox imbalance-induced renal dysfunction in patients with T2D. Adropin could potentially serve as a biomarker for early detection of renal Nrf2 insufficiency and diabetic nephropathy deterioration, especially in patients with advanced CKD. Further research is needed to better understand the exact role and mechanisms of adropin in the pathogenesis of diabetes and diabetic kidney disease. Such understanding can provide valuable insights for the development of targeted interventions and treatments in the future.
The raw data supporting the conclusions of this article will be made available by the authors, without undue reservation.
The studies involving humans were approved by IRB approval number: 201900988B0. The studies were conducted in accordance with the local legislation and institutional requirements. The participants provided their written informed consent to participate in this study.
IWC: Conceptualization, Data curation, Formal analysis, Funding acquisition, Investigation, Methodology, Validation, Visualization, Writing – original draft, Writing – review & editing. CWL: Data curation, Investigation, Validation, Visualization, Writing – original draft, Writing – review & editing. CNL: Formal analysis, Validation, Visualization, Writing – original draft, Writing – review & editing. STC: Conceptualization, Formal analysis, Funding acquisition, Methodology, Supervision, Validation, Visualization, Writing – original draft, Writing – review & editing.
The author(s) declare financial support was received for the research, authorship, and/or publication of this article. This work was supported by grants from Linkou Chang-Gung Memorial Hospital grants (CMRPG3J1291~2, CMRPG3H1711 and CMRPG3K1921). The funders had no role in the study design, data collection, analysis and interpretation, preparation of the manuscript and the decision to publish the results.
The authors would like to thank Miss Yi-Ching Chang and Wan-Ling Chiu for their efforts on laboratory support and data collection. We like to thank all subjects who gave their consent to participate in the study.
The authors declare that the research was conducted in the absence of any commercial or financial relationships that could be construed as a potential conflict of interest.
The author(s) declare that no Generative AI was used in the creation of this manuscript.
All claims expressed in this article are solely those of the authors and do not necessarily represent those of their affiliated organizations, or those of the publisher, the editors and the reviewers. Any product that may be evaluated in this article, or claim that may be made by its manufacturer, is not guaranteed or endorsed by the publisher.
1. Kidney Disease: Improving Global Outcomes Diabetes Work G. KDIGO 2022 clinical practice guideline for diabetes management in chronic kidney disease. Kidney Int. (2022) 102:S1–S127. doi: 10.1016/j.kint.2022.06.008
2. Palsson R, Patel UD. Cardiovascular complications of diabetic kidney disease. Adv Chronic Kidney Dis. (2014) 21:273–80. doi: 10.1053/j.ackd.2014.03.003
3. Newman DJ, Mattock MB, Dawnay AB, Kerry S, McGuire A, Yaqoob M, et al. Systematic review on urine albumin testing for early detection of diabetic complications. Health Technol Assess. (2005) 9:iii–vi, xiii-163. doi: 10.3310/hta9300
4. Levey AS, Becker C, Inker LA. Glomerular filtration rate and albuminuria for detection and staging of acute and chronic kidney disease in adults: a systematic review. JAMA. (2015) 313:837–46. doi: 10.1001/jama.2015.0602
5. Lin CH, Chang YC, Chuang LM. Early detection of diabetic kidney disease: Present limitations and future perspectives. World J Diabetes. (2016) 7:290–301. doi: 10.4239/wjd.v7.i14.290
6. Persson F, Rossing P. Diagnosis of diabetic kidney disease: state of the art and future perspective. Kidney Int Suppl (2011). (2018) 8:2–7. doi: 10.1016/j.kisu.2017.10.003
7. Kumar KG, Trevaskis JL, Lam DD, Sutton GM, Koza RA, Chouljenko VN, et al. Identification of adropin as a secreted factor linking dietary macronutrient intake with energy homeostasis and lipid metabolism. Cell Metab. (2008) 8:468–81. doi: 10.1016/j.cmet.2008.10.011
8. Butler AA, Tam CS, Stanhope KL, Wolfe BM, Ali MR, O’Keeffe M, et al. Low circulating adropin concentrations with obesity and aging correlate with risk factors for metabolic disease and increase after gastric bypass surgery in humans. J Clin Endocrinol Metab. (2012) 97:3783–91. doi: 10.1210/jc.2012-2194
9. Soltani S, Beigrezaei S, Malekahmadi M, Clark CCT, Abdollahi S. Circulating levels of adropin and diabetes: a systematic review and meta-analysis of observational studies. BMC Endocr Disord. (2023) 23:73. doi: 10.1186/s12902-023-01327-0
10. Akcilar R, Kocak FE, Simsek H, Akcilar A, Bayat Z, Ece E, et al. Antidiabetic and hypolipidemic effects of adropinin streoptozotocin-induced type 2 diabetic rats. Bratislava Med J. (2016) 116:100–5. doi: 10.4149/bll_2016_020
11. Hosseini A, Shanaki M, Emamgholipour S, Nakhjavani M, Razi F, Golmohammadi T. Elevated serum levels of adropin in patients with type 2 diabetes mellitus and its association with insulin resistance. J Biol Today’s World. (2016) 5:44–9. doi: 10.15412/j.jbtw.01050301
12. Palizban AA, Yazdani AH, Jahanbani-Ardakani H. Role of rs7903146 polymorphism and adropin serum level in patients with diabetes mellitus; a case-control study from Isfahan, Iran. Arch Physiol Biochem. (2022) 128:378–81. doi: 10.1080/13813455.2019.1684951
13. Aydin S, Kuloglu T, Aydin S, Eren MN, Yilmaz M, Kalayci M, et al. Expression of adropin in rat brain, cerebellum, kidneys, heart, liver, and pancreas in streptozotocin-induced diabetes. Mol Cell Biochem. (2013) 380:73–81. doi: 10.1007/s11010-013-1660-4
14. Levey AS, Gansevoort RT, Coresh J, Inker LA, Heerspink HL, Grams ME, et al. Change in albuminuria and GFR as end points for clinical trials in early stages of CKD: A scientific workshop sponsored by the national kidney foundation in collaboration with the US food and drug administration and european medicines agency. Am J Kidney Dis. (2020) 75:84–104. doi: 10.1053/j.ajkd.2019.06.009
15. Levey AS, Bosch JP, Lewis JB, Greene T, Rogers N, Roth D. A more accurate method to estimate glomerular filtration rate from serum creatinine: a new prediction equation. Modification of Diet in Renal Disease Study Group. Ann Intern Med. (1999) 130:461–70. doi: 10.7326/0003-4819-130-6-199903160-00002
16. Ganesh Kumar K, Zhang J, Gao S, Rossi J, McGuinness OP, Halem HH, et al. Adropin deficiency is associated with increased adiposity and insulin resistance. Obes (Silver Spring). (2012) 20:1394–402. doi: 10.1038/oby.2012.31
17. Hu W, Chen L. Association of serum adropin concentrations with diabetic nephropathy. Mediators Inflamm. (2016) 2016:6038261. doi: 10.1155/2016/6038261
18. Es-Haghi A, Al-Abyadh T, Mehrad-Majd H. The clinical value of serum adropin level in early detection of diabetic nephropathy. Kidney Blood Press Res. (2021) 46:734–40. doi: 10.1159/000519173
19. Ugur K, Oz B, Ozkan Y, Sener SY, Orhan B, Aydin S. Microalbuminuria by concentration serum and urine levels of adropin in patients with type 2 diabetes mellitus. Endocrine Abstracts. (2015). doi: 10.1530/endoabs.37.EP446
20. Yolbas S, Kara M, Kalayci M, Yildirim A, Gundogdu B, Aydin S, et al. ENHO gene expression and serum adropin level in rheumatoid arthritis and systemic lupus erythematosus. Adv Clin Exp Med. (2018) 27:1637–41. doi: 10.17219/acem/75944
21. Simac P, Perkovic D, Bozic I, Bilopavlovic N, Martinovic D, Bozic J. Serum adropin levels in patients with rheumatoid arthritis. Life (Basel). (2022) 12:169. doi: 10.3390/life12020169
22. Yolbas S, Kara M, Yilmaz M, Aydin S, Koca SS. Serum adropin level and ENHO gene expression in systemic sclerosis. Clin Rheumatol. (2016) 35:1535–40. doi: 10.1007/s10067-016-3266-1
23. Zhao L, Zhang C, Wang L, You T, Xu W, Chen J. GW26-e1596 Effects of atorvastatin on mRNA and protein expression of adropin in cultured human umbilical endothelial cells and rat artery smooth muscle cells. J Am Coll Cardiol. (2015) 66(16_Supplement):C31. doi: 10.1016/j.jacc.2015.06.1146
24. Lian W, Gu X, Qin Y, Zheng X. Elevated plasma levels of adropin in heart failure patients. Intern Med. (2011) 50:1523–7. doi: 10.2169/internalmedicine.50.5163
25. Celik HT, Akkaya N, Erdamar H, Gok S, Kazanci F, Demircelik B, et al. The effects of valsartan and amlodipine on the levels of irisin, adropin, and perilipin. Clin Lab. (2015) 61:1889–95. doi: 10.7754/clin.lab.2015.150420
26. Berezin AA, Obradovic Z, Fushtey IM, Berezina TA, Novikov EV, Schmidbauer L, et al. The impact of SGLT2 inhibitor dapagliflozin on adropin serum levels in men and women with type 2 diabetes mellitus and chronic heart failure. Biomedicines. (2023) 11. doi: 10.3390/biomedicines11020457
27. Zhang H, Chen N. Adropin as an indicator of T2DM and its complications. Food Sci Hum Wellness. (2022) 11:1455–63. doi: 10.1016/j.fshw.2022.06.002
28. Chen S, Zeng K, Liu QC, Guo Z, Zhang S, Chen XR, et al. Adropin deficiency worsens HFD-induced metabolic defects. Cell Death Dis. (2017) 8:e3008. doi: 10.1038/cddis.2017.362
29. Lovren F, Pan Y, Quan A, Singh KK, Shukla PC, Gupta M, et al. Adropin is a novel regulator of endothelial function. Circulation. (2010) 122:S185–92. doi: 10.1161/CIRCULATIONAHA.109.931782
30. Berezina TA, Obradovic Z, Boxhammer E, Berezin AA, Lichtenauer M, Berezin AE. Adropin predicts chronic kidney disease in type 2 diabetes mellitus patients with chronic heart failure. J Clin Med. (2023) 12:2231. doi: 10.3390/jcm12062231
31. Thapa D, Xie B, Mushala BAS, Zhang M, Manning JR, Bugga P, et al. Diet-induced obese mice are resistant to improvements in cardiac function resulting from short-term adropin treatment. Curr Res Physiol. (2022) 5:55–62. doi: 10.1016/j.crphys.2022.01.005
32. Kuo FY, Cheng KC, Li Y, Cheng JT, Tsai CC. Promotion of adropin expression by hyperglycemia is associated with STAT3 activation in diabetic rats. Diabetes Metab Syndr Obes. (2020) 13:2269–77. doi: 10.2147/DMSO.S243755
33. Stenvinkel P, Chertow GM, Devarajan P, Levin A, Andreoli SP, Bangalore S, et al. Chronic inflammation in chronic kidney disease progression: role of nrf2. Kidney Int Rep. (2021) 6:1775–87. doi: 10.1016/j.ekir.2021.04.023
34. Lin DW, Hsu YC, Chang CC, Hsieh CC, Lin CL. Insights into the molecular mechanisms of NRF2 in kidney injury and diseases. Int J Mol Sci. (2023) 24:6053. doi: 10.3390/ijms24076053
35. Aranda-Rivera AK, Cruz-Gregorio A, Pedraza-Chaverri J, Scholze A. Nrf2 activation in chronic kidney disease: promises and pitfalls. Antioxidants (Basel). (2022) 11:1112. doi: 10.3390/antiox11061112
36. Hall ET, Bhalla V. Is there a sweet spot for Nrf2 activation in the treatment of diabetic kidney disease? Diabetes. (2014) 63:2904–5. doi: 10.2337/db14-0829
37. Chen X, Xue H, Fang W, Chen K, Chen S, Yang W, et al. Adropin protects against liver injury in nonalcoholic steatohepatitis via the Nrf2 mediated antioxidant capacity. Redox Biol. (2019) 21:101068. doi: 10.1016/j.redox.2018.101068
38. Rasmussen M, Hansen KH, Scholze A. Nrf2 protein serum concentration in human CKD shows a biphasic behavior. Antioxidants (Basel). (2023) 12(4):932. doi: 10.3390/antiox12040932
39. Spoto B, Politi C, Postorino M, Parlongo RM, Testa A, Tripepi GL, et al. Role of kidney function on Nrf2 mRNA levels in type 2 diabetes. BMJ Open Diabetes Res Care. (2024) 12(2):e003929. doi: 10.1136/bmjdrc-2023-003929
40. Kuloglu T, Aydin S. Immunohistochemical expressions of adropin and inducible nitric oxide synthase in renal tissues of rats with streptozotocin-induced experimental diabetes. Biotech Histochem. (2014) 89:104–10. doi: 10.3109/10520295.2013.821713
41. Stein LM, Yosten GL, Samson WK. Adropin acts in brain to inhibit water drinking: potential interaction with the orphan G protein-coupled receptor, GPR19. Am J Physiol Regul Integr Comp Physiol. (2016) 310:R476–80. doi: 10.1152/ajpregu.00511.2015
42. Loewen SP, Ferguson AV. Adropin acts in the rat paraventricular nucleus to influence neuronal excitability. Am J Physiol Regul Integr Comp Physiol. (2017) 312:R511–R9. doi: 10.1152/ajpregu.00517.2016
Keywords: adropin, biomarkers, diabetic kidney disease, diabetes, kidney disease
Citation: Chen I-W, Lin C-W, Lin C-N and Chen S-T (2025) Serum adropin levels as a potential biomarker for predicting diabetic kidney disease progression. Front. Endocrinol. 16:1511730. doi: 10.3389/fendo.2025.1511730
Received: 15 October 2024; Accepted: 21 January 2025;
Published: 07 February 2025.
Edited by:
Åke Sjöholm, Gävle Hospital, SwedenReviewed by:
Maria Guadalupe Moreno Treviño, University of Monterrey, MexicoCopyright © 2025 Chen, Lin, Lin and Chen. This is an open-access article distributed under the terms of the Creative Commons Attribution License (CC BY). The use, distribution or reproduction in other forums is permitted, provided the original author(s) and the copyright owner(s) are credited and that the original publication in this journal is cited, in accordance with accepted academic practice. No use, distribution or reproduction is permitted which does not comply with these terms.
*Correspondence: Szu-Tah Chen, c3RjMTEwNUBjZ21oLm9yZy50dw==
Disclaimer: All claims expressed in this article are solely those of the authors and do not necessarily represent those of their affiliated organizations, or those of the publisher, the editors and the reviewers. Any product that may be evaluated in this article or claim that may be made by its manufacturer is not guaranteed or endorsed by the publisher.
Research integrity at Frontiers
Learn more about the work of our research integrity team to safeguard the quality of each article we publish.